- Protocols

- Articles and Issues
- For Authors
- About
- Become a Reviewer

Chloroplast Movement Imaging Under Different Light Regimes With a Hyperspectral Camera
(§ Technical contact) Published: Vol 15, Iss 24, Dec 20, 2025 DOI: 10.21769/BioProtoc.5541 Views: 983
Reviewed by: Pawan KumarTasleem JavaidAnonymous reviewer(s)
Original research article
The authors used this protocol in:
Feb 2025
Advertisement


Protocol Collections
Comprehensive collections of detailed, peer-reviewed protocols focusing on specific topics


Related protocols
Abstract
Plants move chloroplasts in response to light, changing the optical properties of leaves. Low irradiance induces chloroplast accumulation, while high irradiance triggers chloroplast avoidance. Chloroplast movements may be monitored through changes in leaf transmittance and reflectance, typically in red light. We present a step-by-step procedure for the detection of chloroplast positioning using reflectance hyperspectral imaging in white light. We show how to employ machine learning methods to classify leaves according to the chloroplast positioning. The convolutional network is a method of choice for the analysis of the reflectance spectra, as it allows low levels of misclassification. As a complementary approach, we propose a vegetation index, called the Chloroplast Movement Index (CMI), which is sensitive to chloroplast positioning. Our method offers a high-throughput, contactless way of chloroplast movement detection.
Key features
• Protocol for detached leaves handled in laboratory conditions.
• Based on differential (dark-adapted versus irradiated) hyperspectral images of plant leaves.
• Data analysis includes machine learning methods and the calculation of a vegetation index.
• Requires irradiation equipment apart from the hyperspectral camera set.
Keywords: Arabidopsis thalianaGraphical overview
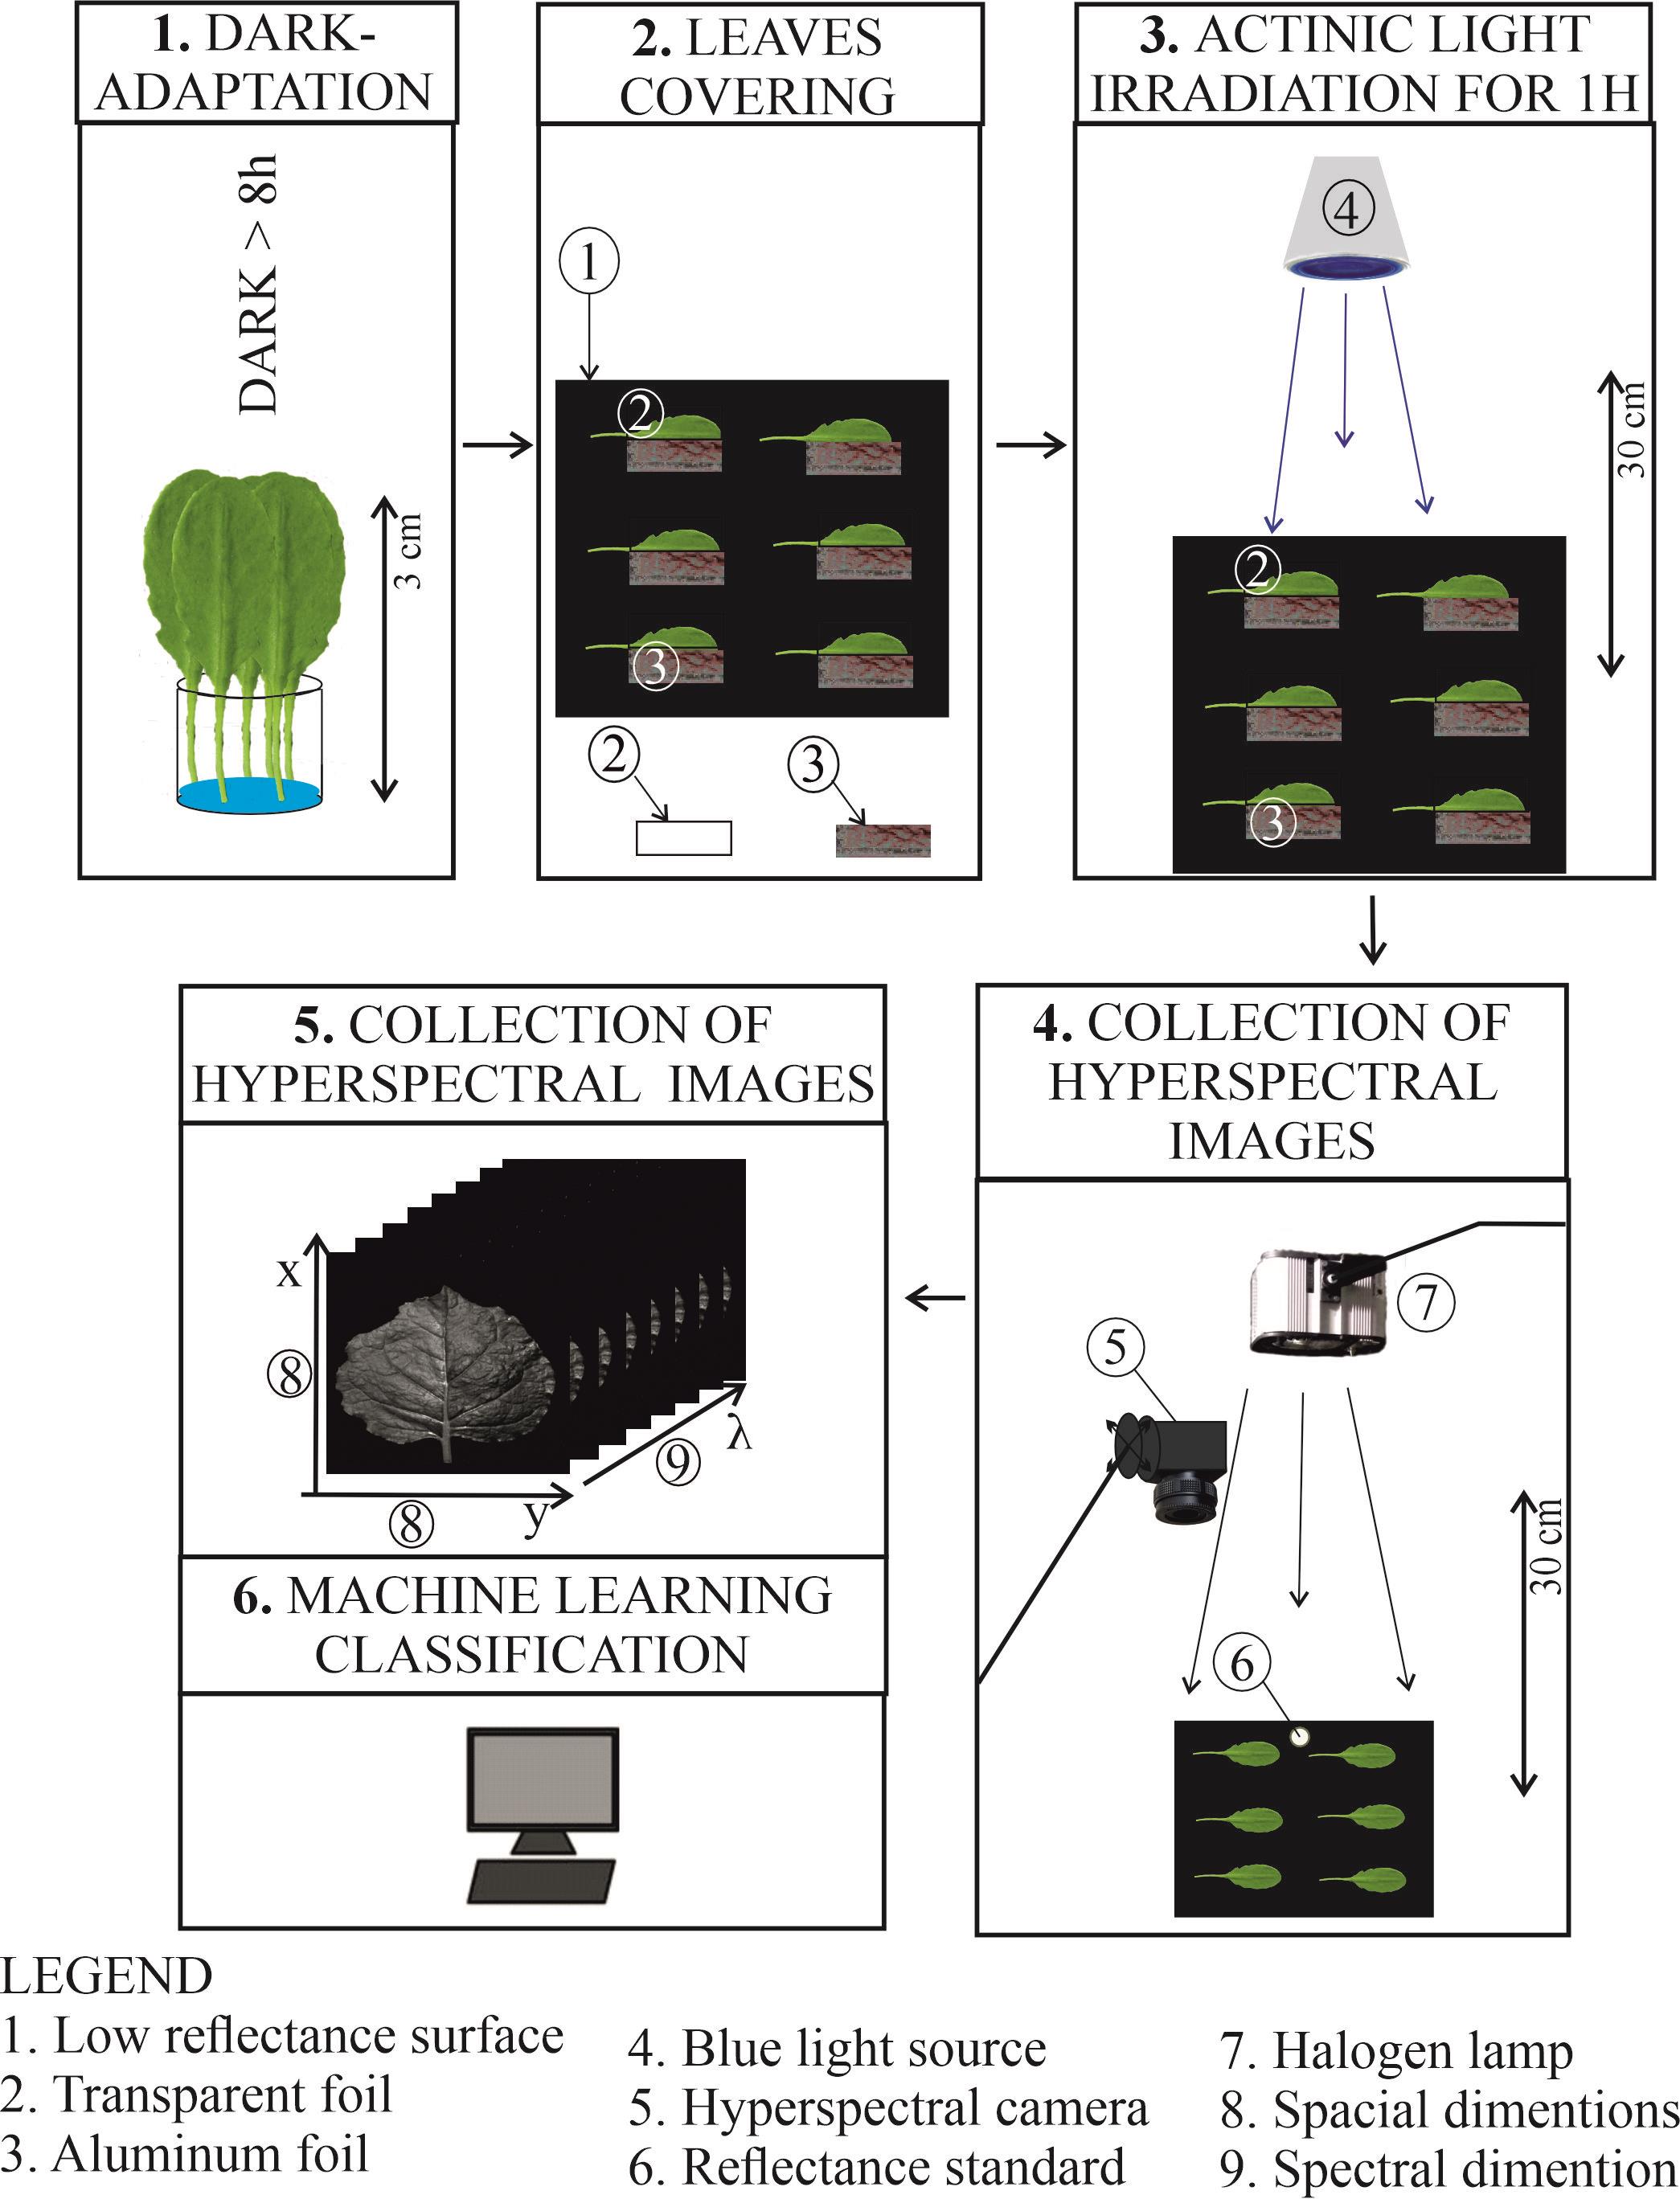
The main steps of the protocol for the detection of chloroplast responses based on leaf reflectance recorded with a hyperspectral camera. (A) Leaves or plants are dark-adapted overnight. (B) The next day, under a safe green light, half of the leaf is covered with aluminum foil and the other half with transparent foil on a Petri dish filled with black velvet. (C) The leaves are irradiated with blue light of high or low irradiance for 1 h to induce chloroplast movements. (D) Immediately after irradiation, the Petri dish is moved under the experimental setup, and a reflectance standard is added. The hyperspectral camera and a halogen light are simultaneously switched on. (E) The images are recorded on the computer and further processed. (F) The Chloroplast Movement Index may be calculated, or machine learning classification may be applied.
Background
Plants show distinct chloroplast positioning, dependent on light conditions. In low light, chloroplasts gather at cell walls lying perpendicular to the direction of incident light, a phenomenon known as the accumulation response. In high light, chloroplasts show avoidance response by moving to the cell walls parallel to the direction of incident light. Distinct dark positioning is also observed, with chloroplasts located at the bottom of the palisade cells [1].
Chloroplast movements have been examined using light microscopy for over a century [2,3]. Such observations are still important for assessing chloroplast responses, providing a detailed description of the movements of chloroplasts within the cell [4]. However, microscopic observations are laborious and usually restricted to the outer layers of the mesophyll in unfixed leaves. An alternative approach is to take advantage of the substantial changes in the optical properties of the whole leaf that result from chloroplast movements. Their optical effects are often visible to the naked eye. The slit assay is based on a simple observation that chloroplast avoidance makes leaves look pale, while chloroplast accumulation renders them darker [4]. Changes in leaf transmittance yield information on averaged chloroplast positions within the mesophyll cells and enable quantitative assessment of chloroplast movements. Photometric devices are used for measuring blue-light-induced changes in red light leaf transmittance [5–7]. They provide a continuous recording of the changes in leaf transmittance, which allows for studies of the kinetics of the process, though only one leaf can be examined at a time. Chloroplast movements may also be measured by changes in leaf reflectance [8–10]. Red light reflectance was used to monitor chloroplast movements with photosynthetic efficiency during the growth of Arabidopsis thaliana [11]. Two previous works [12,13] employed an integrating sphere to measure chloroplast movement-induced changes in diffuse reflectance. This approach involves the collection of whole (i.e., hemispherical) leaf reflectance, which is independent of the observation angle. This reduces the sensitivity of measurements to the leaf orientation and its surface undulations. However, such measurements are limited due to the requirement of direct contact with the leaf, which results in low throughput. Hyperspectral imaging is a fast, non-contact method of acquiring reflectance spectra in a spatially resolved manner; thus, it can be used to assess chloroplast positioning in several leaves at the same time. Such high throughput may be useful for phenotyping multiple mutants or studies on leaves collected in the field, in which a large sample is necessary due to the heterogeneity of the light conditions in natural environments. However, while a detector connected to an integrating sphere can measure light reflected to the whole hemisphere, the camera collects light reflected to a narrow cone. As a result, specular reflection from the leaf surface may reduce the accuracy of leaf classification according to chloroplast positioning, especially when leaves contain pronounced veins or their surface undulates. Specular reflectance may be reduced for such samples using light polarizers [10]. In an alternative approach, used in this protocol, classification of leaves is performed not based on raw reflectance, but using the complete visible light reflectance spectrum, through application of pretrained machine learning classifiers. The workflow of the protocol is shown in the Graphical overview.
Materials and reagents
Biological materials
1. Mature leaves from 6-week-old Nicotiana benthamiana
2. Fifth or sixth leaf from 4-week-old Arabidopsis thaliana, wild-type, ecotype Col-0, N6673 (NASC, www.arabidopsis.org)
Note: Plants are sown in Jiffy-7 pots (Jiffy Products International AS, Holand), vernalized at 4 °C for 2 days, and grown in a growth chamber (Sanyo MLR 350H, Japan) at 23 °C, 80% relative humidity, with a photoperiod of 10 h light and 14 h darkness, with irradiance of 70 µmol·m-2·s-1 supplied by fluorescent lamps (FL40SS.W/37, Sanyo, Japan). After 4 weeks, Nicotiana plants are transferred to pots with commercial soil and moved to a walk-in-type growth chamber supplied with white LEDs of 100 µmol·m-2·s-1 with a photoperiod of 10 h light and 14 h darkness.
Reagents
1. Tap water (400 ppm)
Laboratory supplies
1. Thick aluminum foil (0.03 mm) (Hutnik Sp. z o.o., Poland)
2. Transparent polyester foil (e.g., Alpha Autostat CT5, MacDermid, USA)
3. Paper towel, cellulose, two-layer (Merida, Poland)
4. Matte, black velvet (e.g., Musou Black VL Flock Sheet, Musou Black, Germany)
5. Petri dish, rectangular (100 mm × 100 mm × 20 mm) (Sarstedt, catalog number: 82.9923.422)
Equipment
1. Headwall nano hyperspectral camera (Nano-Hyperspec VNIR 400–1,000 nm, Headwall Photonics)
2. White diffuse reflectance standard (Spectralon or BaSO4-based reflectance standard, e.g., Edmund Optics, catalog number: #54-302)
3. 12 mm objective (Cinegon F/1.4/12-0906, C-Mount, 400–1,000 nm, Schneider Kreuznach)
4. Rotating platform (Sevenoak SK-ebh01 Pro, Andoer)
5. Manfrotto 143 magic arm with bracket (Videndum Media Solutions Spa)
6. Halogen lamp (Hedler HF 65, HEDLER Systemlicht GmbH)
7. Blue light LED panel (peak 455 nm, XLamp XQ-E HD Royal Blue Cree or equivalent blue light source)
Note: Several manufacturers offer royal blue LEDs that can be used as an alternative. However, LEDs described as PC-blue or PC-cyan are not suitable, as their spectrum features a prominent shoulder or second peak in the longer wavelength range.
8. Sensor (LI-COR Biosciences, model: LI-190R)
9. Leaf state analyzer (Walz, model: LSA-2050)
Software and datasets
1. Mathematica version 14 or later (Wolfram Research, USA); requires a license
2. All code has been deposited to GitHub: https://github.com/plantPhotobiologyLab/machine-learning-for-chloroplast-movement-detection (access date, 08/18/2025)
3. Original files with hyperspectral images of Nicotiana benthamiana and Arabidopsis thaliana (WT and phot2) leaves, including recordings shown in Figure 3 and Figure 4 of this protocol, can be downloaded from https://figshare.com/articles/dataset/Hyperspectral_images_of_Arabidopsis_thaliana_and_Nicotiana_benthamiana_leaves/30402409?file=58898569
4. Statistical analysis can be performed using the R language (version 4.5 available from https://cran.r-project.org/) in the RStudio integrated development environment (available from https://posit.co/products/open-source/rstudio/?sid=1)
Procedure
A. Principle
In flowering plants, chloroplast movements are controlled by blue light. In the model plant Arabidopsis thaliana, low blue light (450 nm) in the irradiance range of 0.01–20 µmol·m-2·s-1 induces chloroplast accumulation [1]. Irradiance of 1 µmol·m-2·s-1 is sufficient to trigger chloroplast accumulation in most species examined by us. In Arabidopsis, sustained chloroplast avoidance is triggered above 20 µmol·m-2·s-1. We recommend using irradiance of 100 µmol·m-2·s-1 or higher to induce avoidance response. At least 1 h of irradiation is needed for saturation of the reaction. The magnitude of changes in leaf optical properties depends on the initial chloroplast positioning. To obtain reproducible results, leaves should be kept in darkness for at least 8 h before measurements. This time is sufficient for chloroplasts to assume distinct dark positioning. The difference in reflectance spectra between the covered and irradiated parts of the leaf provides information on the position of chloroplasts.
Notes:
1. Choose mature, fully expanded leaves with no signs of senescence. The leaves of different plants cannot differ in age or chlorophyll content. It is advisable to control the chlorophyll content across the leaf, as it may directly affect the measurements. Chlorophyll content may be measured spectrophotometrically in extracts or intact leaves using hand-held optical devices, e.g., the Leaf State Analyzer (Walz). The latter method is more suitable for our purposes, as spatial chlorophyll distribution throughout the leaf may be monitored. It can then be compared with chlorophyll-specific vegetation indices [14–17] calculated from hyperspectral images.
2. After dark adaptation of the plants, perform all steps of the experiment in low green light, <0.05 μmol·m-2·s-1. We use a green LED lamp, additionally covered with a green plastic filter (#740 Aurora Borealis gel, Lee filters company). All devices that emit light (such as the computer screen) should also be covered with green foil.
B. Leaf irradiation
1. Dark-adapt plants for at least 8 h.
Note: Detached plant leaves or branches may be dark-adapted as well, provided that only the petiole or stem is immersed in water. Do not immerse the leaf blade in water, as this may lead to partial infiltration of the leaf and substantially change its optical properties.
2. Detach the leaves and place them on Petri dishes covered with matte, thick black velvet. Cover one half of the leaf with thick aluminum foil along the main vein (control treatment, chloroplast in dark position) and the other half with a transparent polyester foil (for blue light treatment). The leaf petiole should be wrapped in a paper towel soaked with water (Figure 1). Sprinkle water over the velvet as well.
Note: A black, visible-light-absorbing material such as velvet is needed to reduce the reflectance of the substrate during hyperspectral imaging. This is important because light reflected from the substrate and then transmitted through the leaf is detected together with light reflected from the blade, leading to overestimation of its reflectance. The irradiated part of the leaf is covered with transparent polyester foil to mimic other ways in which the foil cover can affect the leaf. The presence of aluminum foil may not only block light but, for instance, affect gas exchange or provide mechanical cues to the blade. We try to ensure that both sides of the blade are subject to these effects.
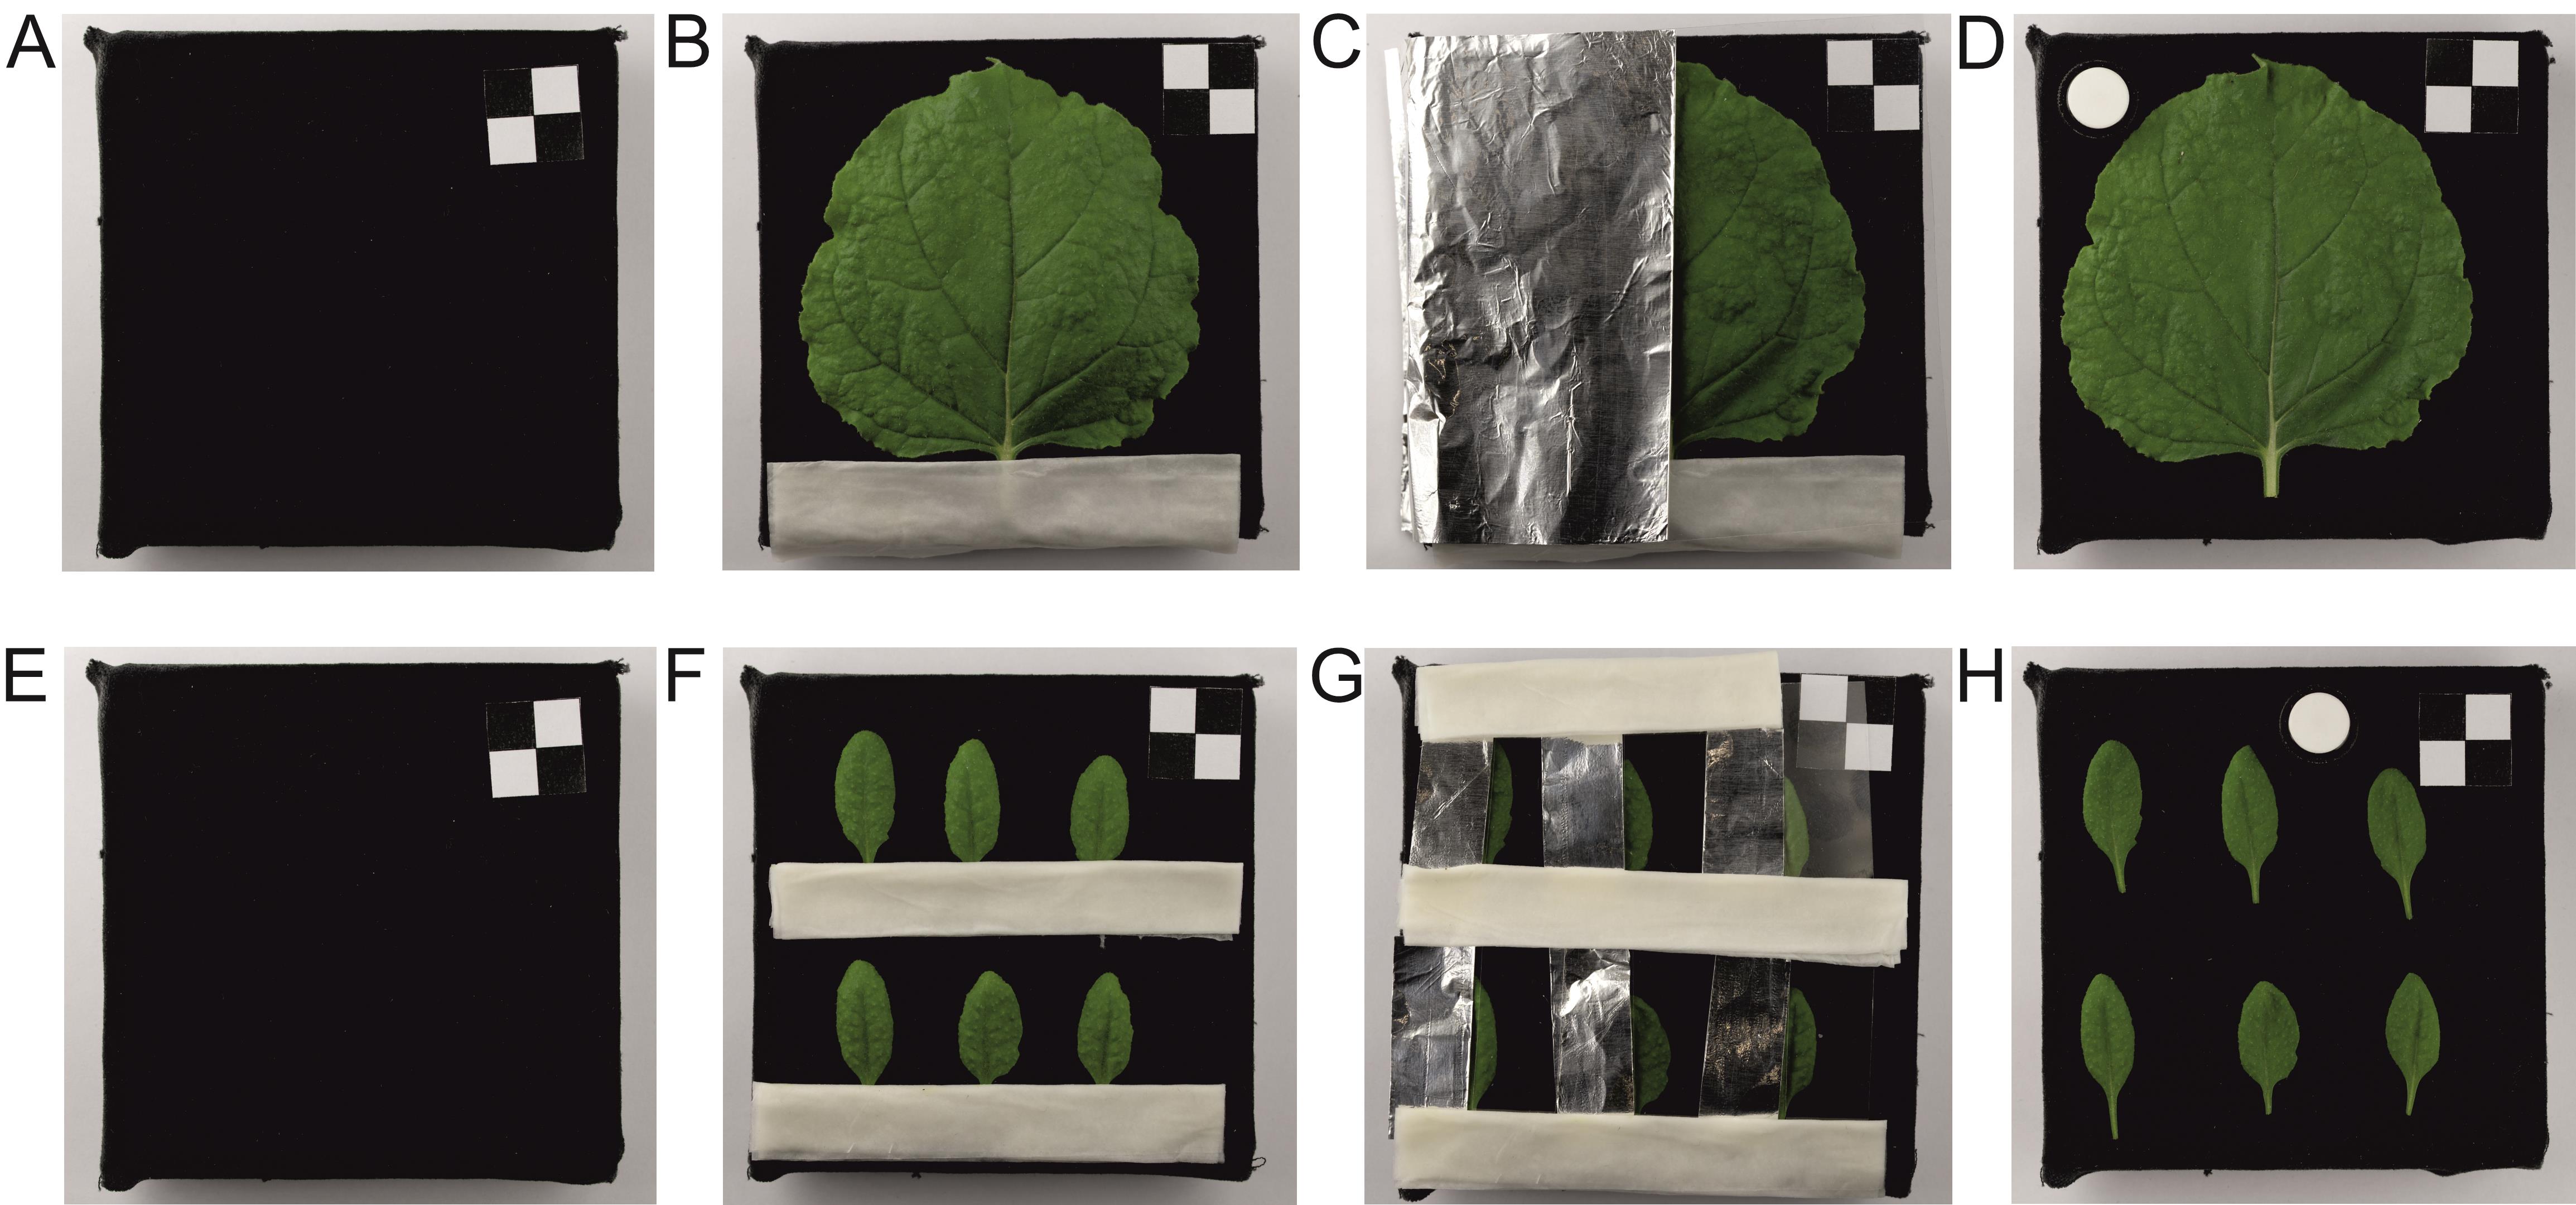
Figure 1. Leaf preparation steps for hyperspectral imaging. (A, E) A plate covered with black velvet is used as a support for detached leaves. (B, F) The leaf petiole is covered with a wet paper towel. (C, G) Half of the leaf is then covered with aluminum foil, and the other half with polyester foil. (D, H) After irradiation with blue light for 1 h, materials covering the leaf halves are removed, and a reflectance standard is added so that the leaves are ready for imaging.
3. Irradiate leaves for 1 h with actinic blue light (ca. 450 nm peak) of 1 µmol·m-2·s-1 to induce chloroplast accumulation or 100 µmol·m-2·s-1 to induce chloroplast avoidance. During measurements of actinic light, the light-sensitive surface of the probe should be covered with the same transparent polyester foil that is used to cover half of the leaf.
Notes:
1. Loss of water may increase leaf reflectance, even in the visible range [18]. During irradiation, make sure that the petiole or stem is tightly wrapped in a wet towel.
2. Most illumination fixtures do not provide uniform irradiation on the sample plane. If more leaves are irradiated at one time, it is advisable to change the position of leaves on plates during irradiation.
C. Hyperspectral imaging
1. Immediately after blue irradiation finishes, place the leaf on the velvet-covered plate beneath the hyperspectral camera mounted on a rotating platform placed 30 cm from the table (Figure 2).
Note: Provide spacers, such as tape, to position the plate within the field of view of the camera.
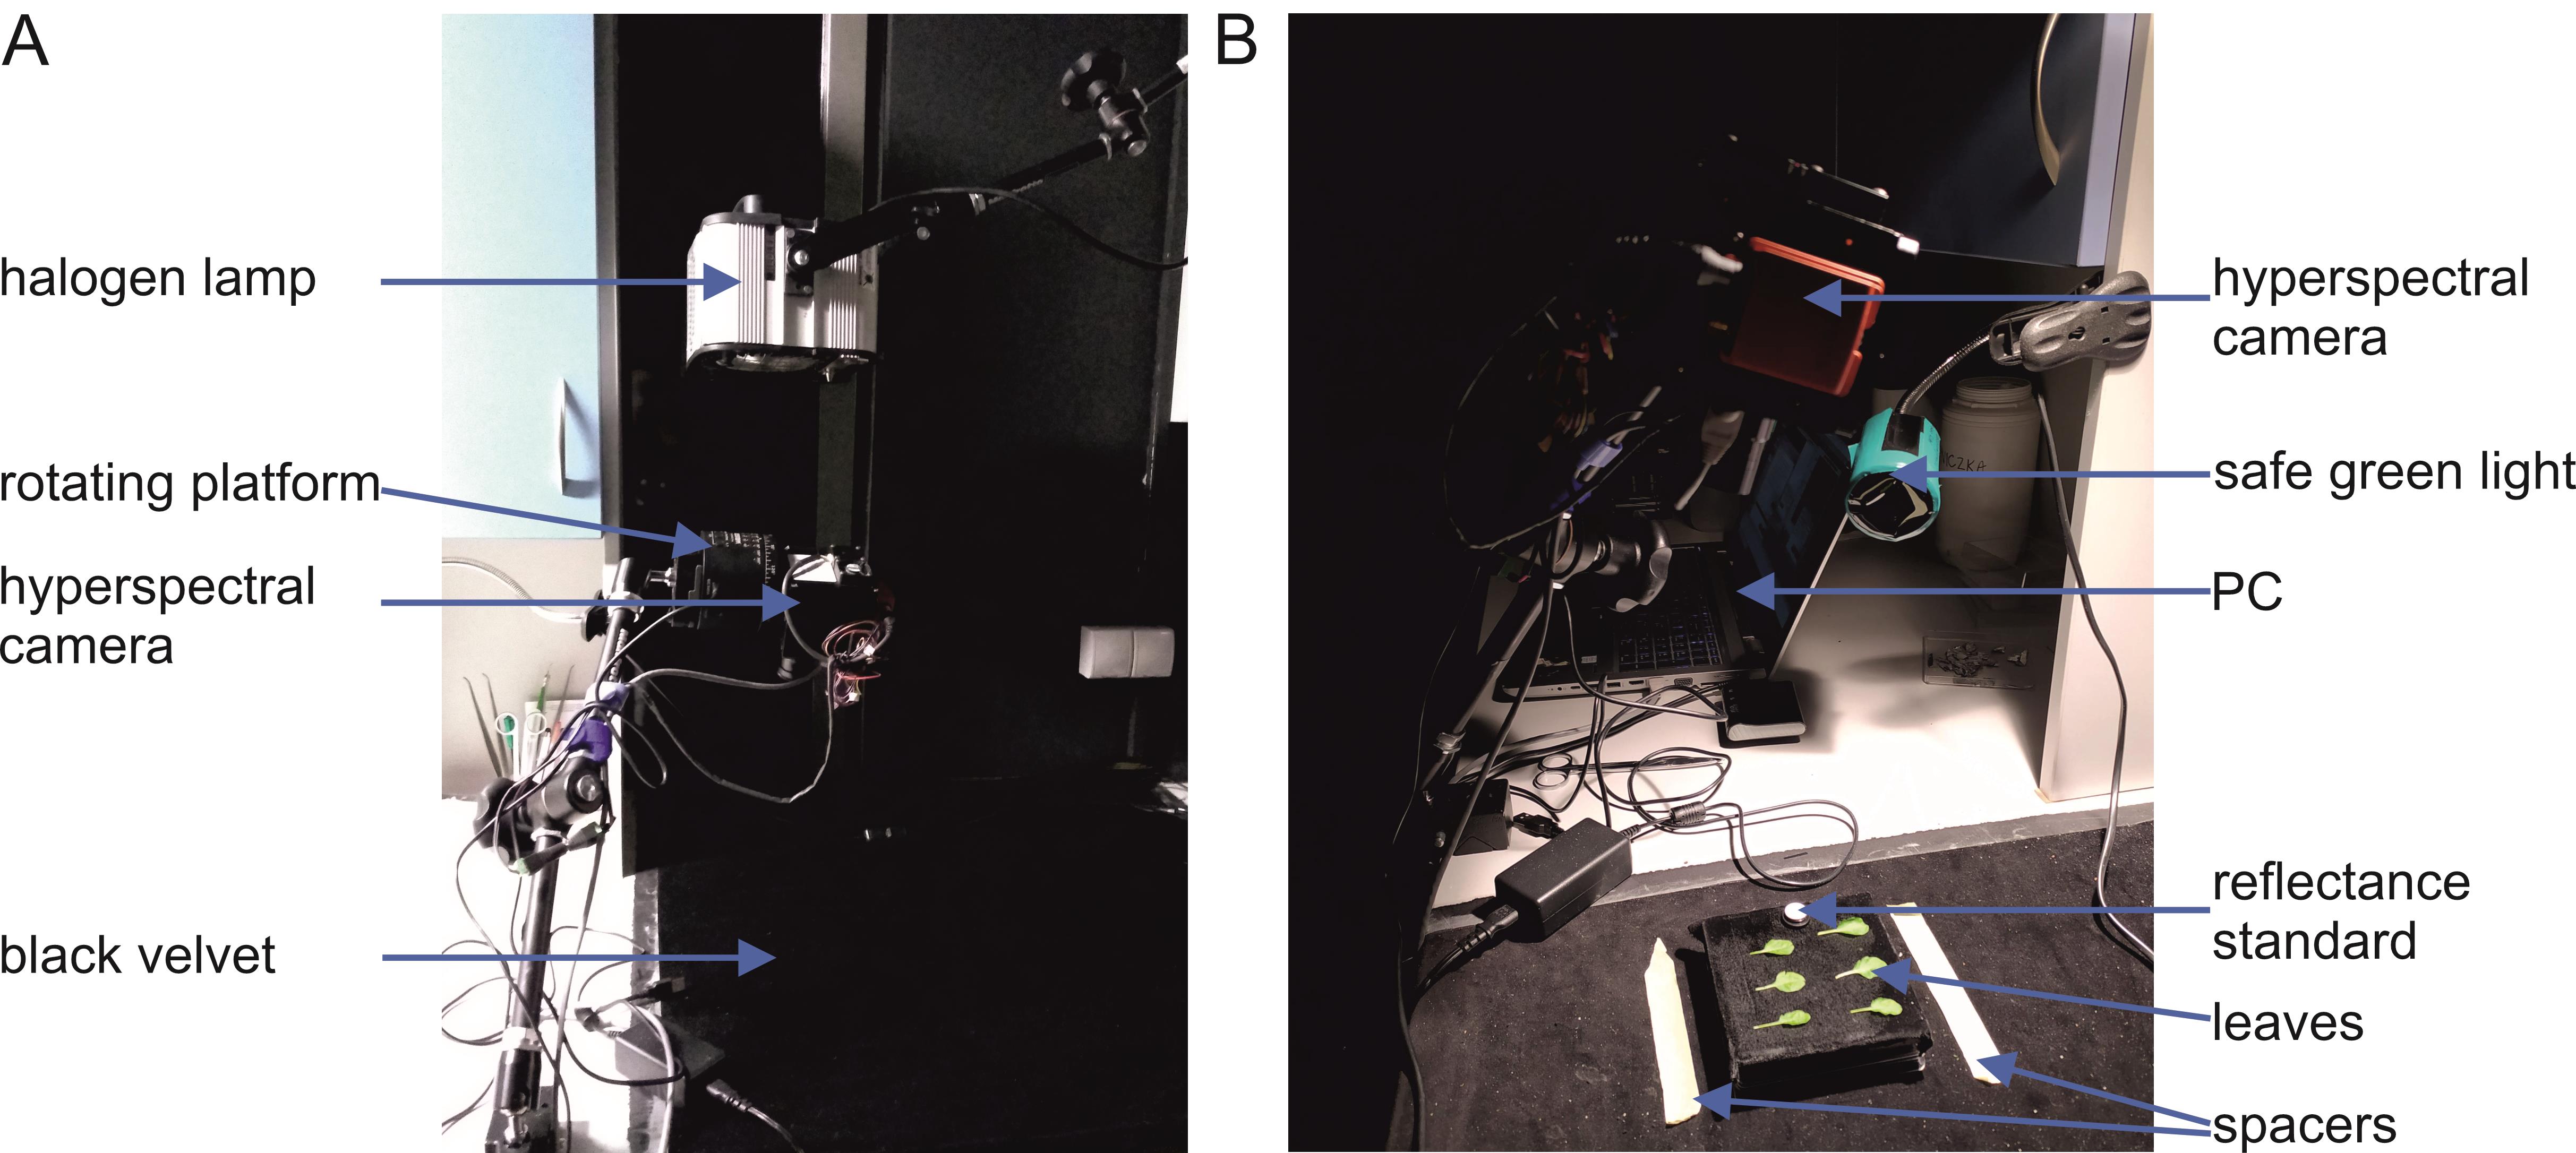
Figure 2. Experimental setup used to detect chloroplast movements based on leaf reflectance recorded with a hyperspectral camera. (A) The halogen lamp is located above the hyperspectral camera, which is mounted on a rotating platform. The camera must not shadow the plane of observation. The field of view of the camera is covered with black velvet. (B) The location in which the plate with leaves is placed should be marked with spacers, e.g., tape strips. A green safe light is used for performing all the experimental steps before the halogen light is switched on. The monitor of the PC should also be covered with green foil.
2. Place at least one white, diffusely reflecting reflectance standard near the leaf.
Note: If several leaves are examined at the same time, using multiple standards placed in different locations is recommended to reduce errors due to uneven illumination with measuring light.
3. Remove the polyester and aluminum foil from the leaf.
4. Switch on the halogen lamp.
5. Collect hyperspectral images of the whole leaf in the range of 400–800 nm or wider.
6. Cover the objective of the camera with an opaque, black cap and collect a hyperspectral image of the same field of view. The image obtained will be used to subtract dark electronic noise.
Critical: Perform steps C1–5 as fast as possible. After changing the light conditions, chloroplasts will start to move. This process takes several minutes. Try to work within 1 min.
Note: Cover the whole area illuminated with halogen light with black velvet to reduce light scatter. The halogen light should deliver irradiance of ca. 300 µmol·m-2·s-1 in the PAR (400–700 nm) range at the sample plane. Using lower irradiance values may lead to high noise in the blue part of the reflectance spectrum, as the output of halogen lamps is low for short wavelengths. The angle of light incidence with respect to the leaf normal should be small, ideally <15°. The camera is mounted on a rotating platform, so the angle of observation changes. However, it should always be smaller in magnitude than the angle of incidence of halogen light. This helps to reduce the amount of specular (mirror-like) reflection recorded by the camera. The time required to record a single image is 25–30 s.
D. Machine learning procedures for leaf classification
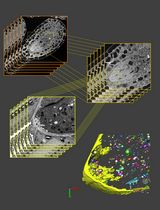
In this section, leaves will be classified according to the chloroplast positioning, using a pretrained convolutional neural network. The network is available in the software package HyperspectralImageProcessing.m, written by us in Mathematica (Wolfram Research, USA) and distributed through GitHub. The package allows for classification of leaves based on both single reflectance spectra as well as differences in reflectance spectra between irradiated and darkened leaf halves. Use the latter approach when following this protocol. A free introduction to Mathematica can be found online [19]. The core command of the package, readInHeadwallFileImages, creates an object representing a hyperspectral image recorded with a Headwall camera (Figure 3). It can be acted upon by additional functions that allow for the extraction and display of spectra from custom regions of interest. The list of functions available in the package can be produced with the command Names["HyperspectralImageProcessing`*"]. For each function, the details about its parameters and returned values can be obtained using the Information command. For example, executing Information[readInHeadwallFileImages] will yield usage information for the readInHeadwallFileImages function.
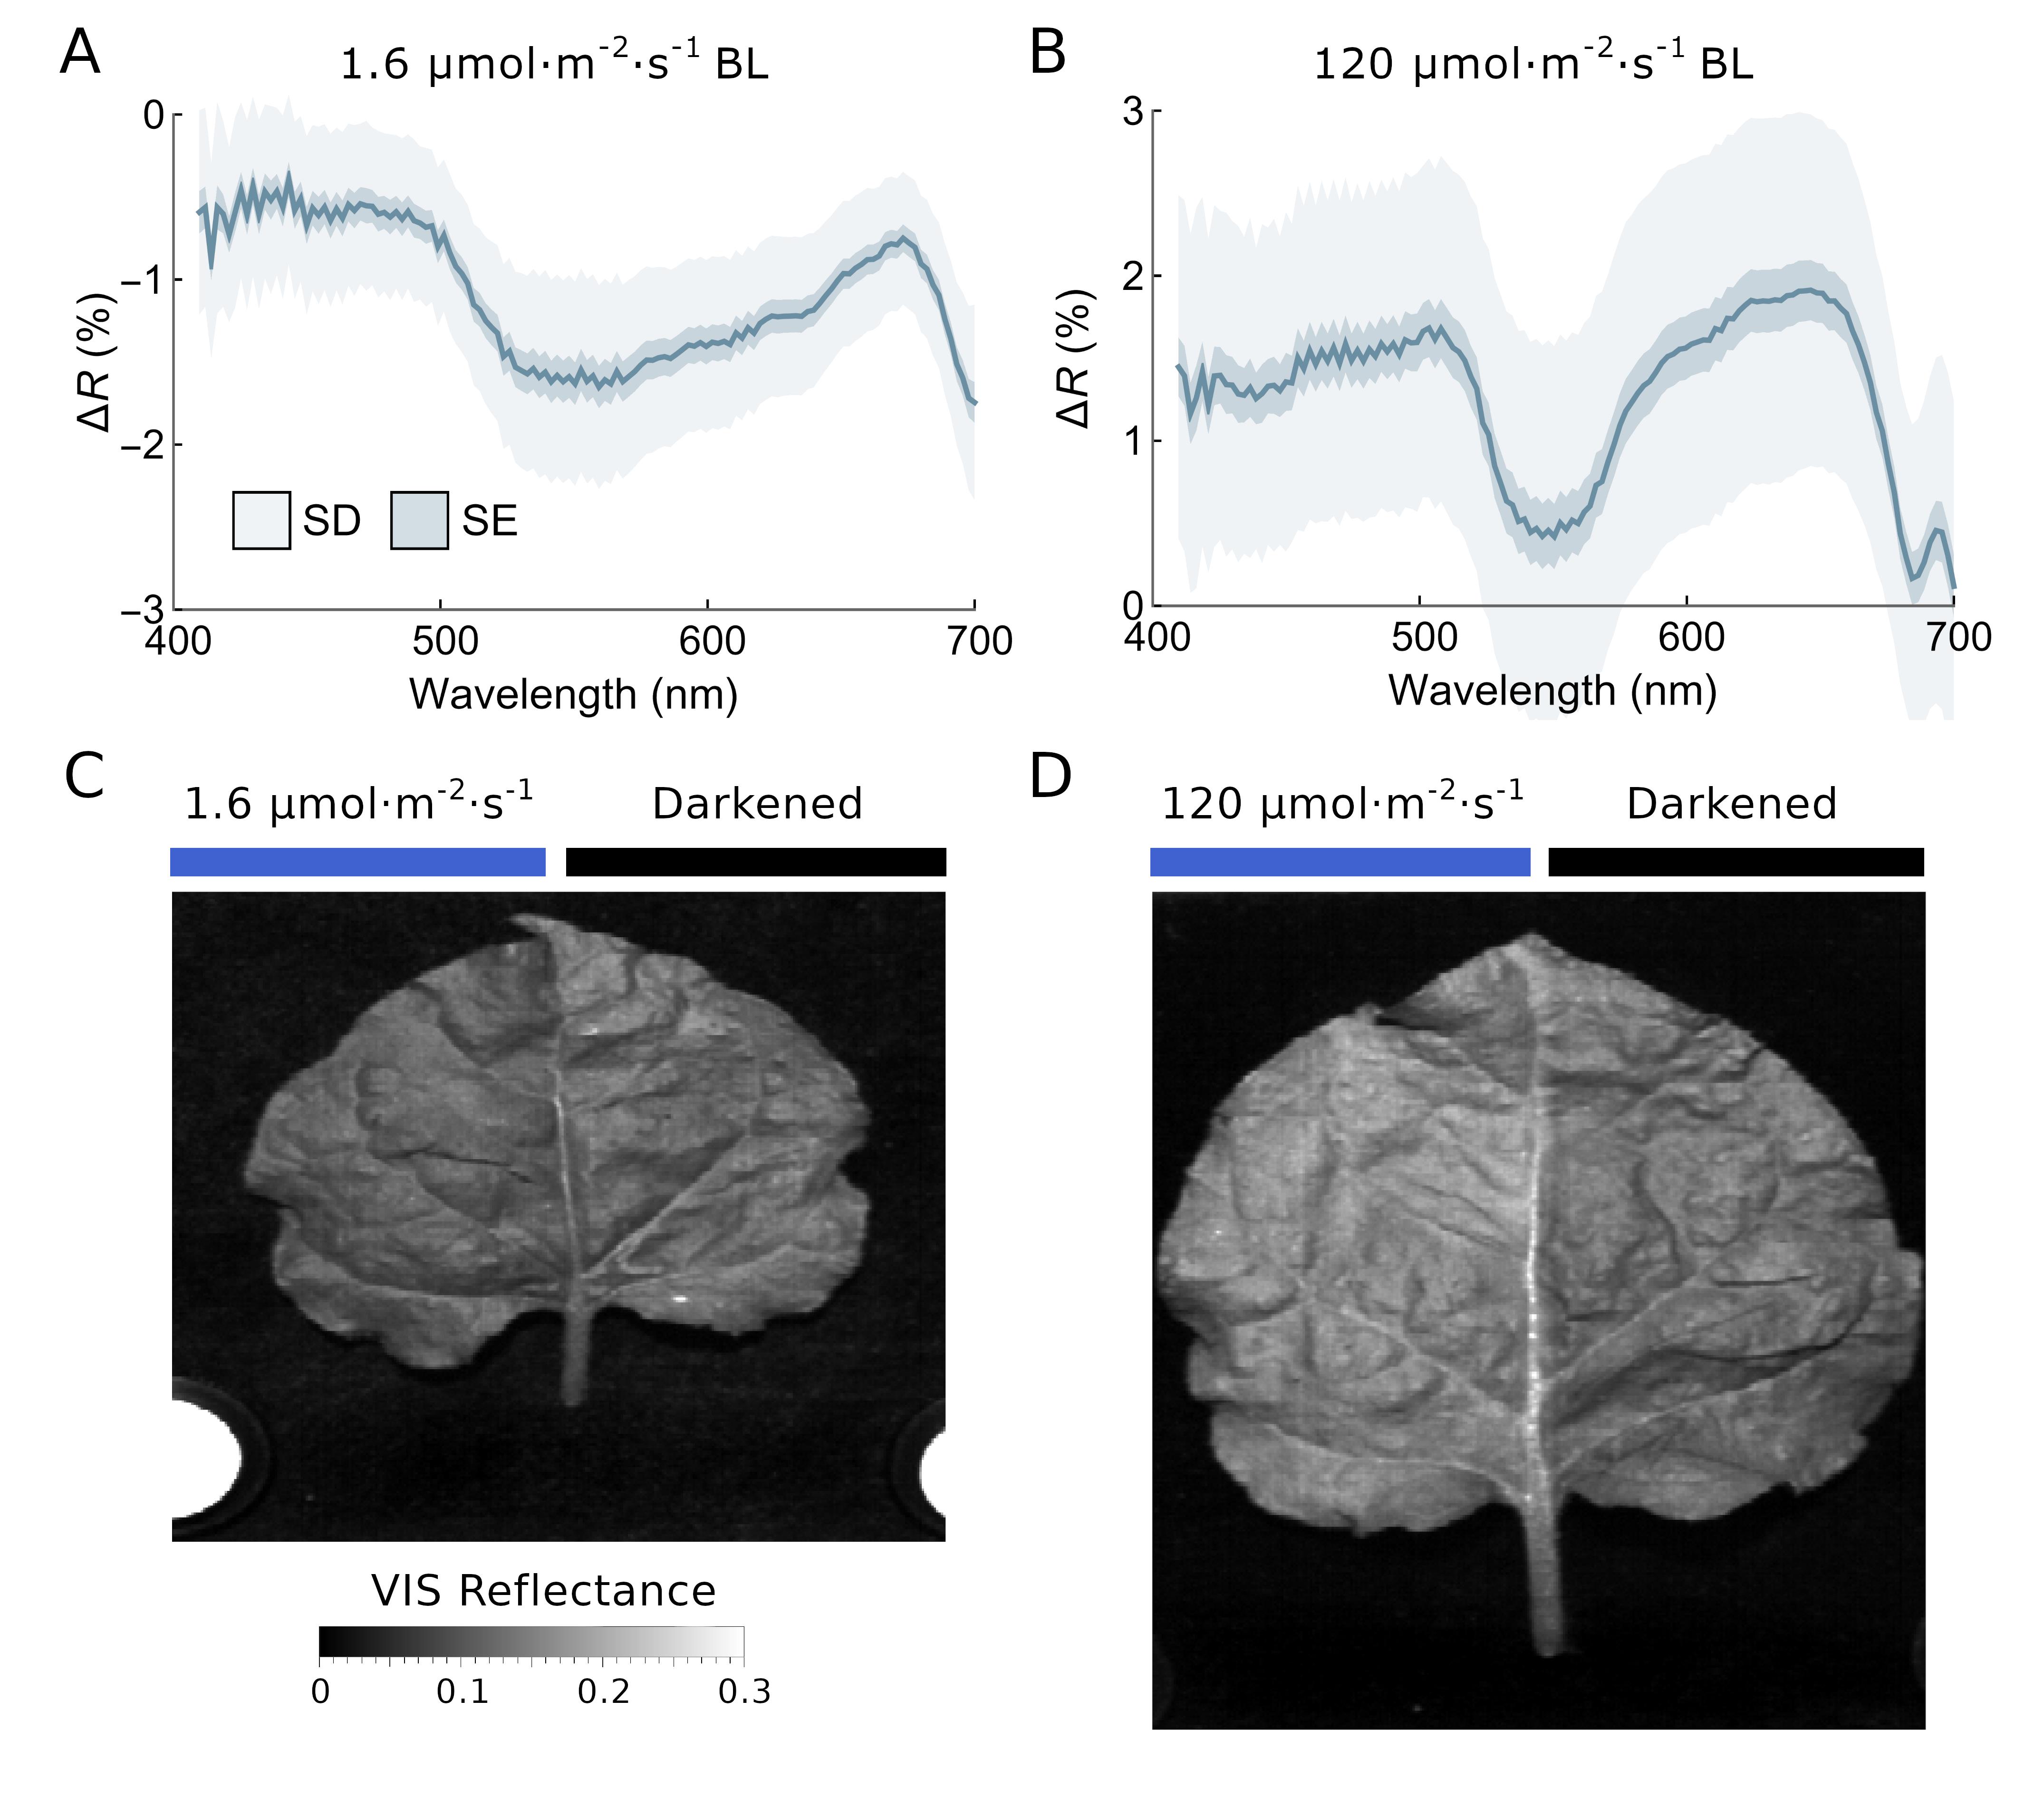
Figure 3. Differential reflectance spectra after blue light irradiation of N. benthamiana leaves. Leaves detached from dark-adapted plants were irradiated with either 1.6 or 120 µmol·m-2·s-1 of blue light for 1 h to induce chloroplast accumulation and avoidance responses, respectively. Half of the leaf remained in the dark-adapted state, as it was covered with aluminum foil during irradiation. (A, B) Mean difference in reflectance spectra between irradiated and darkened leaf halves calculated from hyperspectral images of 23 low- and 31 high-light-irradiated leaves. Note that the y-axis range in panels A and B is different. The standard deviation is indicated in light blue, and the standard error in darker blue. (C, D) Reflectance images of N. benthamiana leaves, calculated as an average of the hyperspectral images in the visible (400–700 nm) range. Spectra in A and B redrawn from Hermanowicz, P. and Łabuz, J. 2025 [20].
1. Download the files from our GitHub repository (https://github.com/plantPhotobiologyLab/machine-learning-for-chloroplast-movement-detection). All files must be kept in the same directory.
2. Open the HyperspectralImageProcessing.m file in Mathematica 14.1 or later. Select Evaluation and then Evaluate initialization cells in the main menu.
3. Open a new Mathematica notebook (select File → New → Notebook in the main menu).
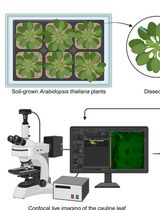
4. Read in a hyperspectral image and assign it to a variable, executing the command hyperspectralImage = readInHeadwallFileImages[path1.hdr, path2.hdr], where path1.hdr and path2.hdr are paths to the hyperspectral image and the dark calibration file, respectively (Figure 4).
5. Display the image of the reflectance in the green range (550 nm, corresponding to high leaf reflectance), executing hyperspectralImage [displayImageDataByWavelength][550].
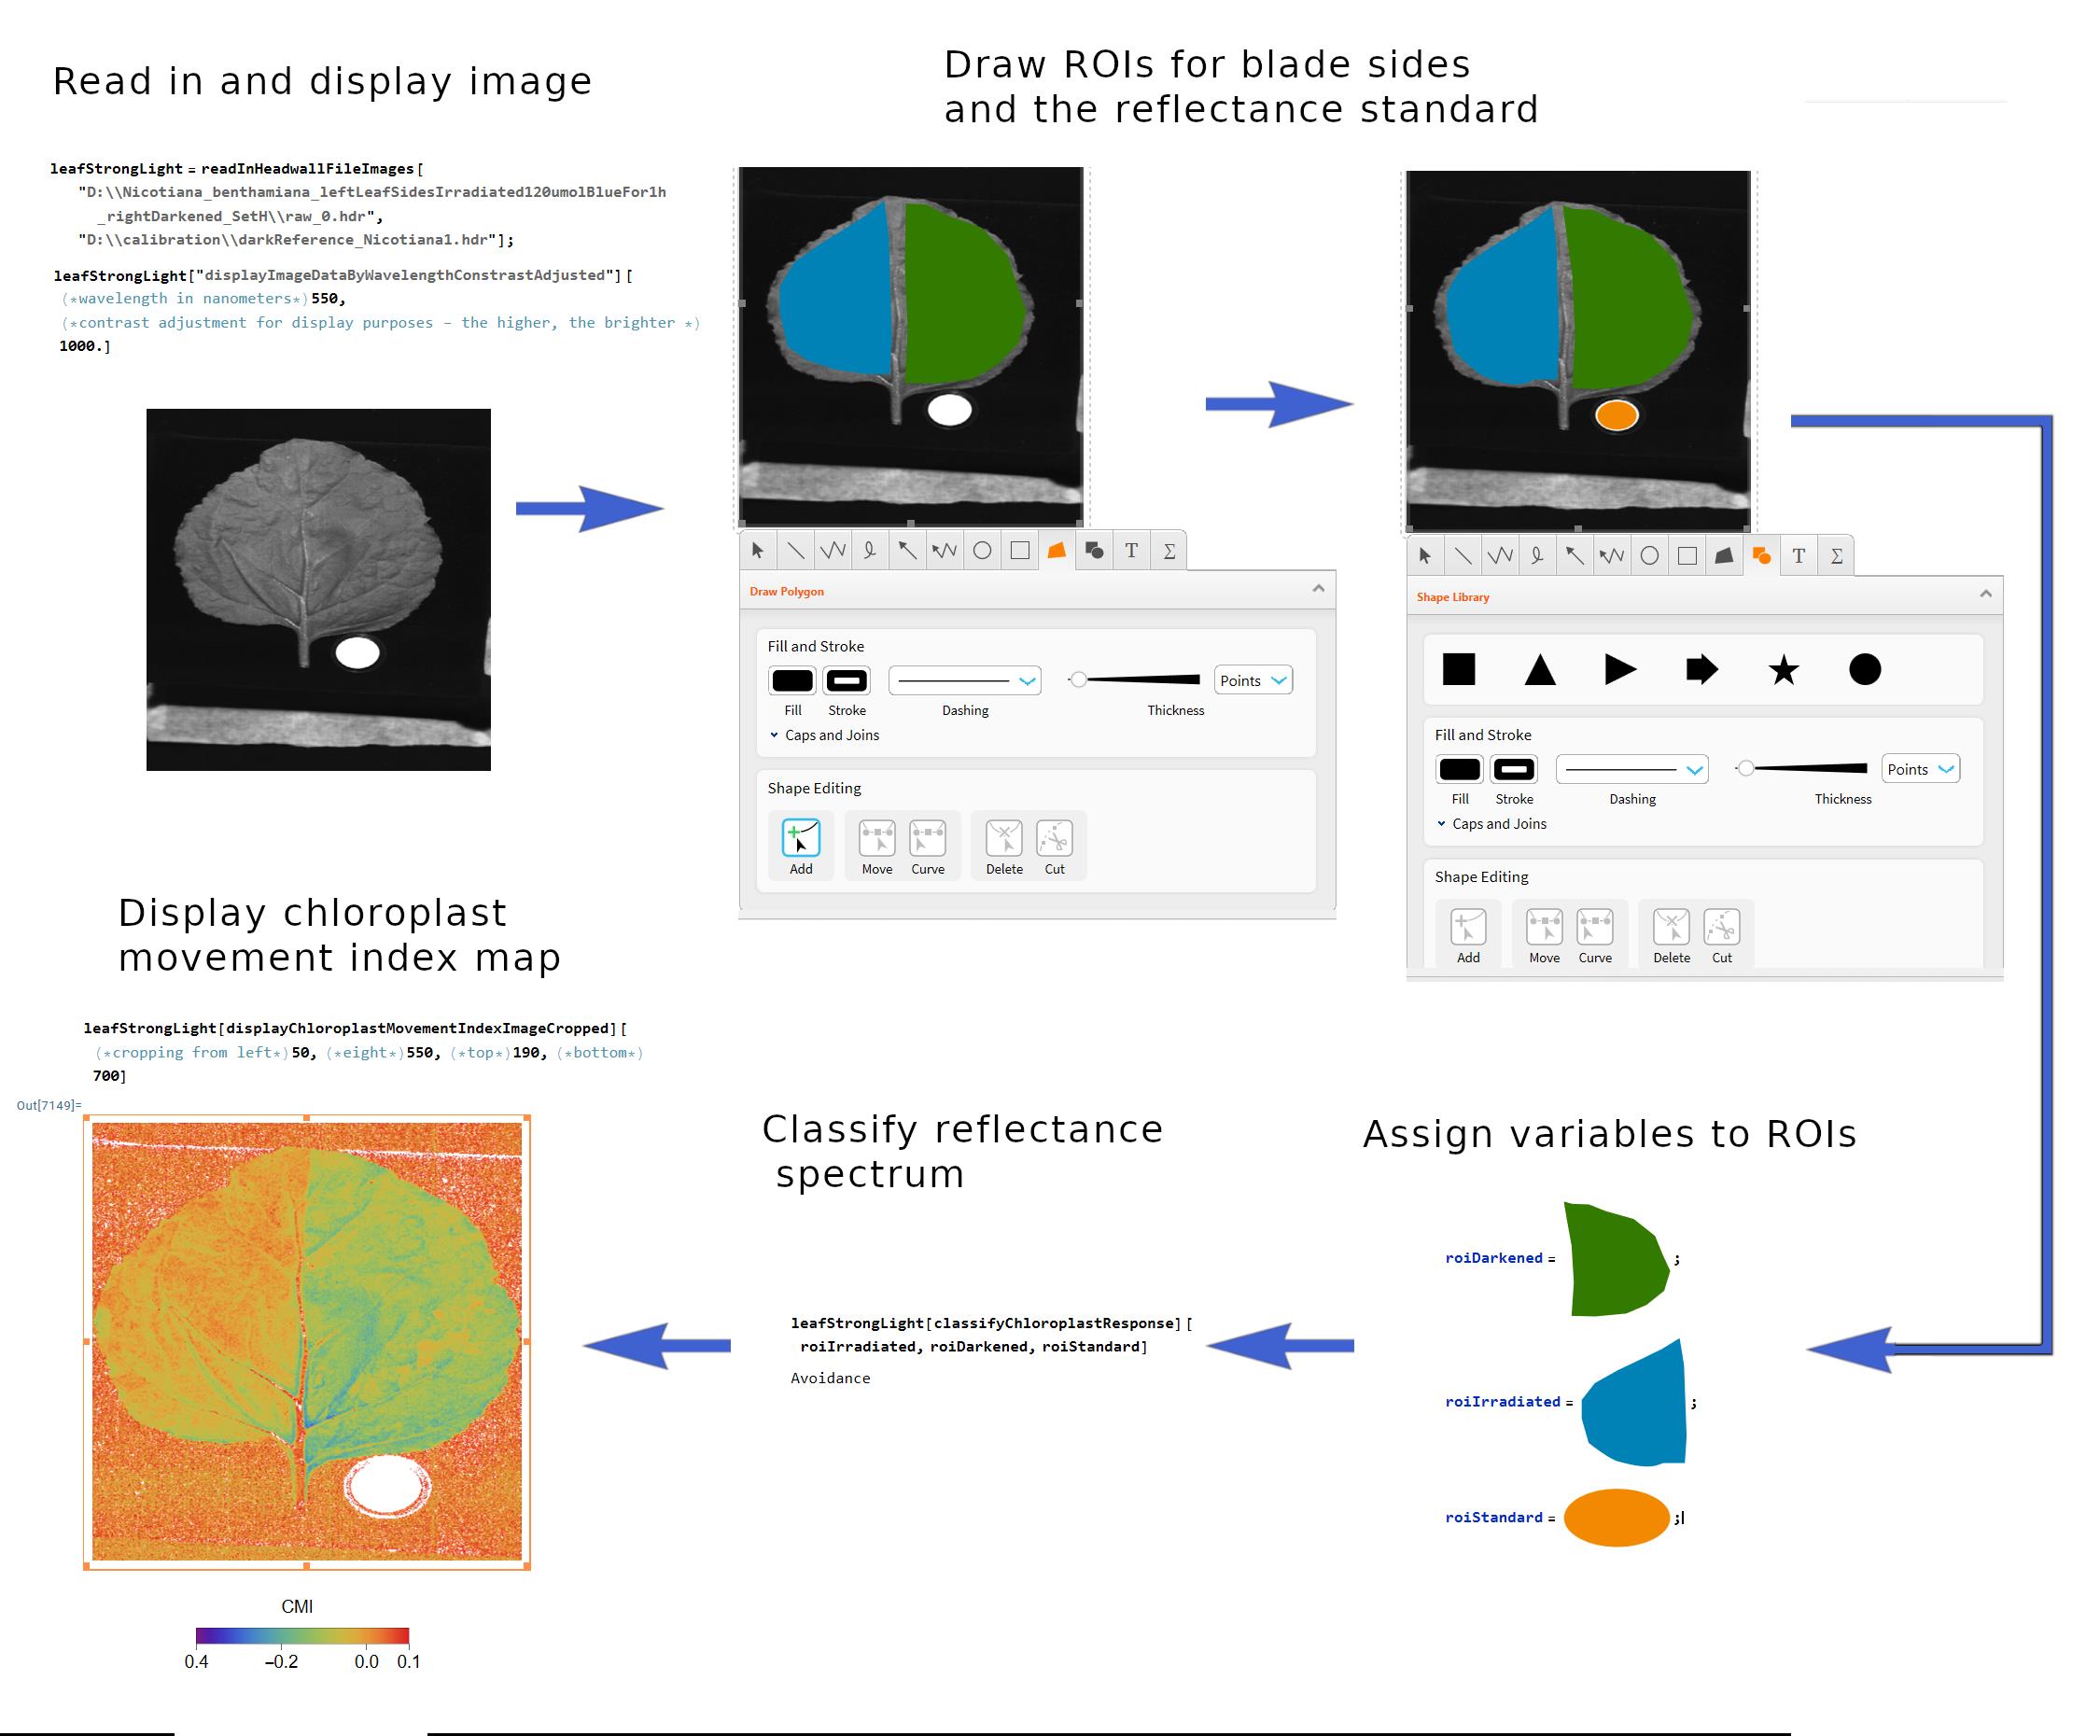
Figure 4. Main steps of the analysis of chloroplast positioning based on a hyperspectral image
6. Double-click the image with a mouse and use the keyboard shortcut Ctrl + D to activate graphical tools. Select the polygon tool and draw rough outlines of (1) the irradiated and (2) darkened parts of the leaf. Select the ellipse drawing tool and draw an ellipse within the image part occupied by the white reflectance standard. Copy these shapes and assign them to new variables.
Note: The individual reflectance spectra of leaf halves can be examined by executing hyperspectralImage [extractReflectanceSpectrum][roiLeaf, roiStandard], where roiLeaf and roiStandard are polygons drawn for a leaf part of interest and the white standard, respectively. The difference in reflectance spectra (irradiated minus dark-adapted) can be calculated using hyperspectralImage [extractDifferenceInReflectenceSpectrum] [roiDarkened, roiIrradiated, roiStandard].
7. Classify the response of chloroplasts in the leaf, using the command hyperspectralImage [classifyChloroplastResponse][roiDarkened, roiIrradiated, roiStandard]. The returned value is 1 for the chloroplast avoidance and 0 for the chloroplast accumulation response.
E. Chloroplast Movement Index
To obtain a quantitative measure of chloroplast positioning based on reflectance spectra, the Chloroplast Movement Index [20] can be used, defined by the following formula:
where R555 and R635 are relative reflectance values in narrow bands centered at 555 and 635 nm, respectively. The index usually takes negative values. An increase in the value of the index (values approximating 0) indicates a chloroplast avoidance response, and a decrease in the index points to a chloroplast accumulation response (Figure 5). The CMI index can be calculated using a hyperspectral image read in with the HyperspectralImageProcessing.m package.
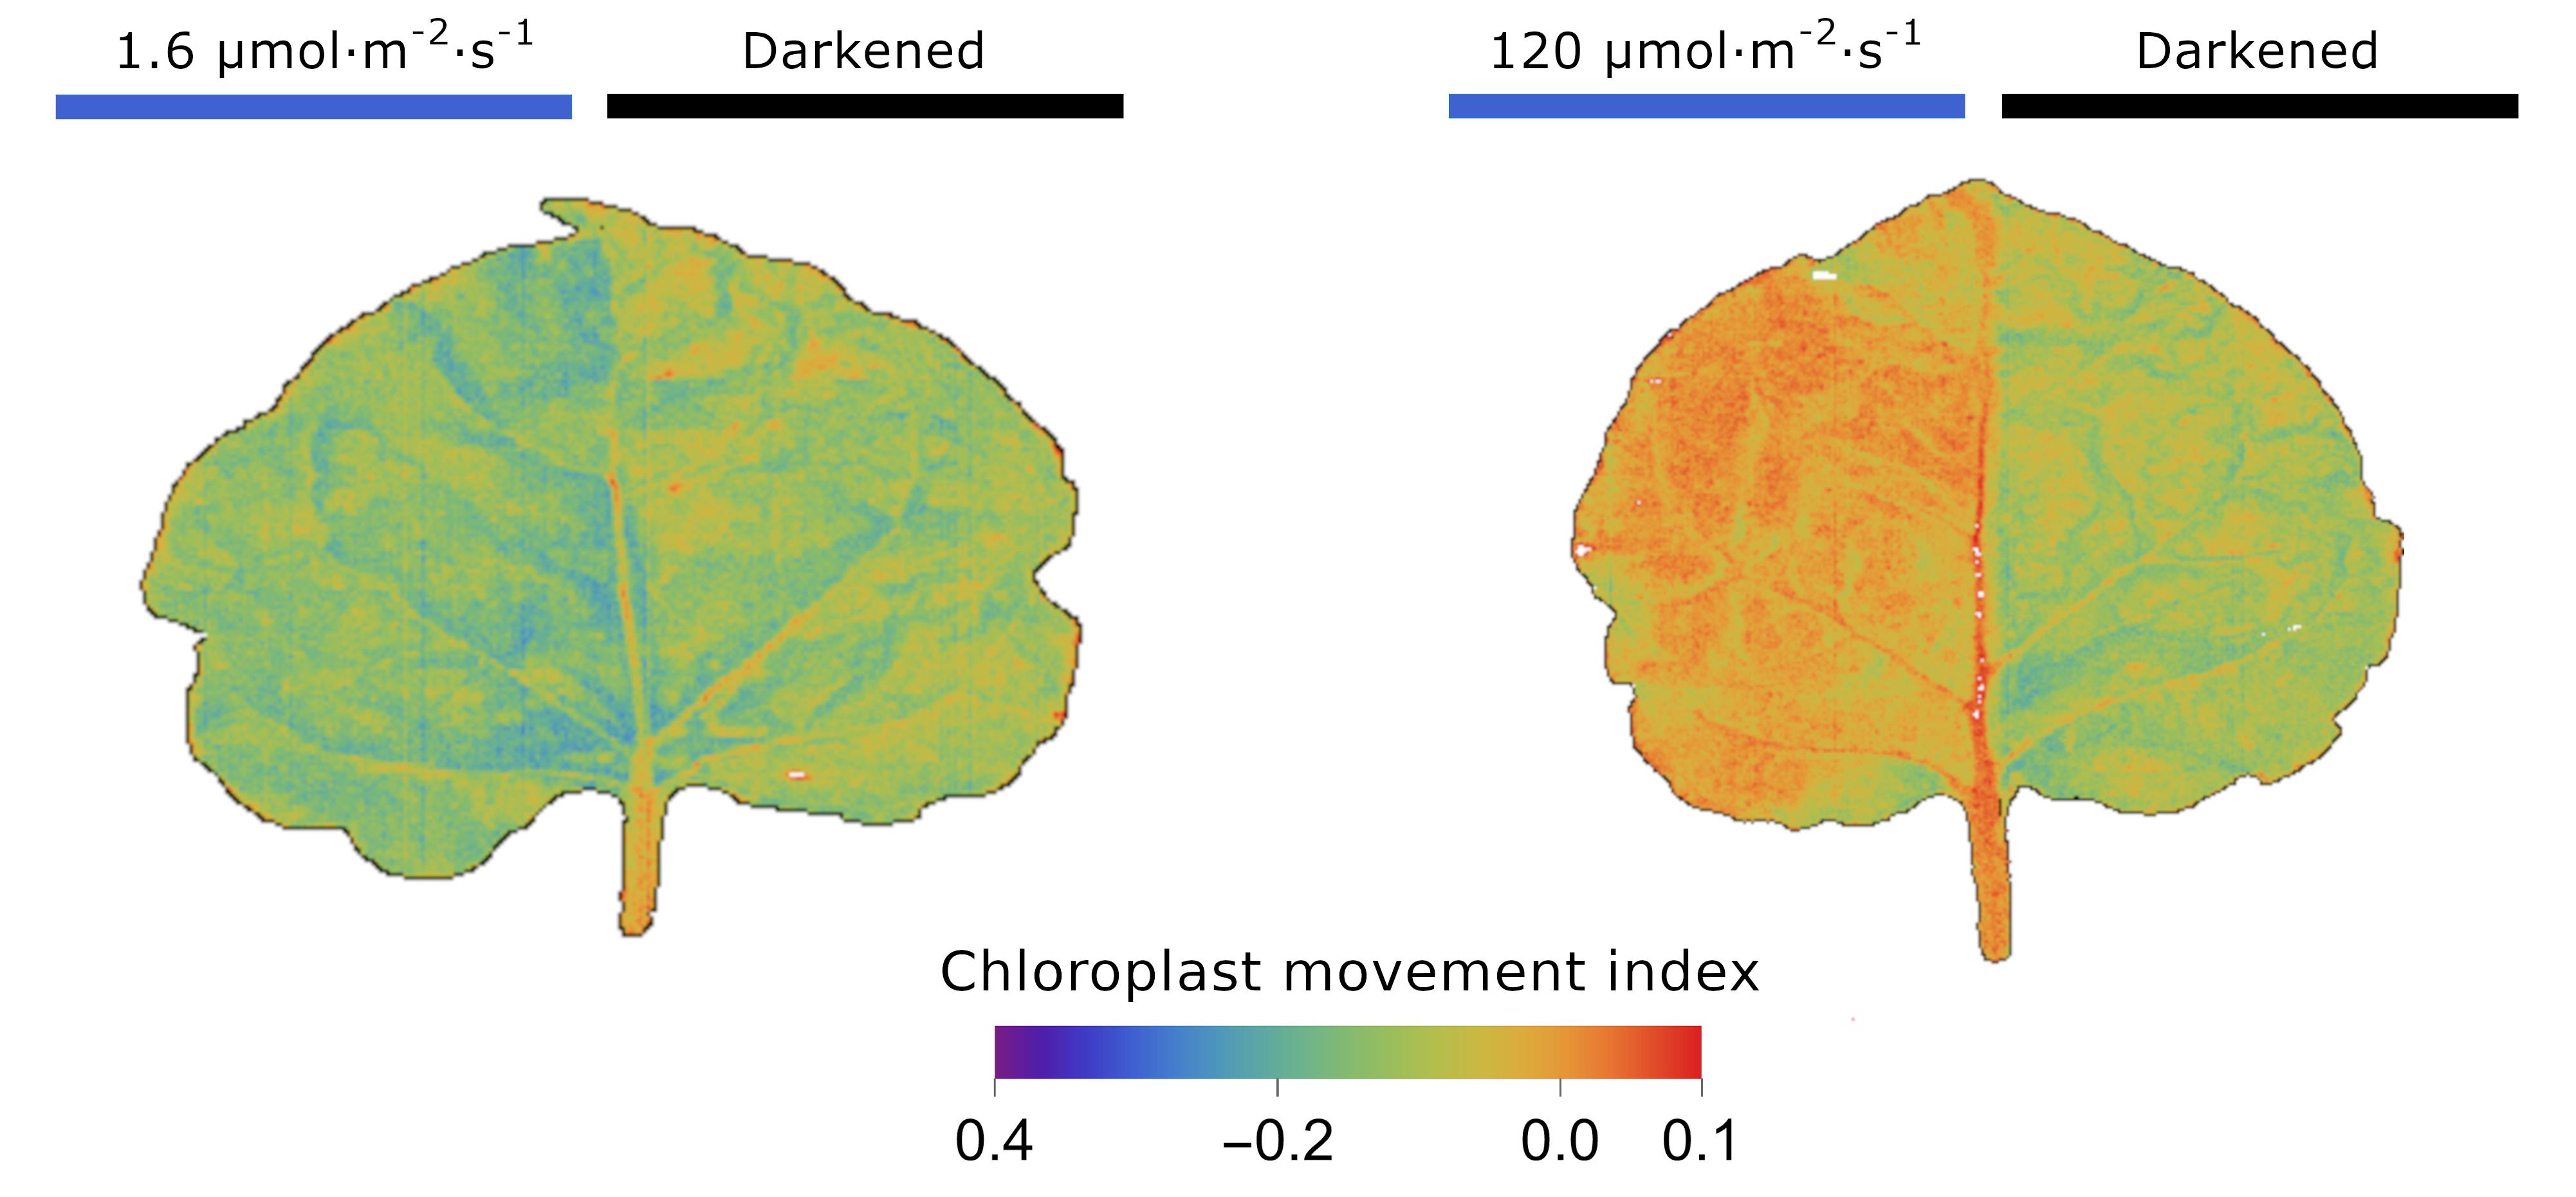
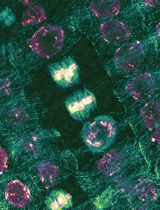
Figure 5. Chloroplast Movement Index calculated for each pixel of N. benthamiana leaves. Detached leaves were irradiated with either 1.6 or 120 µmol·m-2·s-1 of blue light for 1 h. Half of the blade was covered with aluminum foil, and the other half with polyester foil. The chloroplast movement index was calculated for each pixel of the hyperspectral images.
1. Perform steps D1–5.
2. Display a map of values of the chloroplast movement index, using the command hyperspectralImage [displayChloroplastMovementIndex].
3. Calculate the average value of the CMI, executing hyperspectralImage[calculateMeanChloroplastMovementIndex][roiLeaf, roiStandard], where roiLeaf is the polygon drawn on the irradiated leaf part, and roiStandard is the polygon located within the image area occupied by the white reflectance standard.
Note: The histogram of CMI can be displayed for an arbitrary region of the leaf using the command displayChloroplastMovementIndexHistogram. If the histogram exhibits substantial deviations from the normal distribution, e.g., it has long tails, the median can be used instead of the arithmetic mean as a measure of the central tendency of values of the CMI. In such a case, use the function calculateMedianChloroplastMovementIndex instead of calculateMeanChloroplastMovementIndex.
Data analysis
A. Recommended number of biological and technical replicates
When one leaf from a plant is examined, either the mean or median of the values of the CMI calculated for pixels within a single leaf should be treated as a biological replicate. If multiple leaves collected from the same plant are analyzed, the obtained results for all leaves should be averaged before statistical tests are used. Variance in the results of measurements of chloroplast movements is often considerable. Usually, leaves from at least 15–20 plants should be measured for each experimental group. When plants are grown in laboratory conditions, at least three batches of plants cultivated at different times should be examined. The experiment should be balanced, ideally with the same number of replicates in each experimental group. Differences in plant responses are pronounced if light conditions during growth are heterogeneous. Irradiance in growth chambers is usually not uniform. Thus, the position of pots should be frequently exchanged to ensure that all plants receive a similar amount of light during growth. If more plant lines are used, the pots with the same line should never form spatial clusters. Instead, plants with all lines should be randomly distributed within the growth chamber.
B. Statistical analysis
Perform statistical analysis using the R software [21]. Values of chloroplast movement index may be modeled as linearly dependent on fixed factors (e.g., irradiation conditions during growth, mutant line). It is advisable to also include random factors in the analysis, such as the batch of plants (for laboratory-grown plants using multiple batches) or the plant collection site (for studies on leaves collected at multiple field sites). Such mixed linear models may be fitted using the lme command of the nlme package in the R software [22,23]. The fitted models should allow for variance to differ between groups. Accounting for the possibility of unequal variance yields a more reliable analysis. Variance often grows with the mean, which leads to bias in the estimated p-values if homogeneity of variance is assumed. Calculations of differences between means for specific groups may be performed using the emmeans package [24], which allows for a custom set of comparisons, with corrections preventing inflation of the family-wise error rate. Alternatively, Tukey’s method can be used by combining the emmeans and multcomp packages (cld method) [25]. An example statistical analysis of the data is given in Figures 5–6 of [20].
The following steps can be used to perform a simple test of statistical significance of differences in means using Tukey’s method in the absence of random factors (e.g., when differences between plant batches can be neglected):
1. Collect all results in a CSV file. The file should contain one column for every experimental factor (e.g., plant line) and one column that contains the values of the response variable—in our case, values of the CMI. Often, the plant line is the factor of interest, with several levels (e.g., wild type and mutants 1, 2, etc.). Every row of such a file should correspond to an independent replicate.
2. Open RStudio, a free code editor for the R programming language. In the main menu, choose Session → Set Working Directory → Choose directory and set the working directory to the directory that contains the CSV file with your results.
3. Install the required packages (emmeans, nlme, multcomp). For example, to install the emmeans package, execute the command install. packages(“ememans”). Note that the name of the package is in quotes. This step can be skipped if the packages are already installed.
4. Load the required packages, using the library command (e.g., library(emmeans); a bit confusingly, the name of the package should now be written without quotes).
5. Load the data to be analyzed, running myData = read.csv(“filename.csv”). We use only the file name and not the whole path to the file, as the file is in the working directory. Read-in data are stored in myData variable.
6. Fit a linear model of the relationship between the response (e.g., value of the CMI) and the experimental factors (e.g., plant line), running the command of the form myFit = gls(Response ~PlantLine, data = myData, weights=varIdent(form = ~ 1|PlantLine)). The purpose of the optional argument weights is to account for the possibility of unequal variances.
7. Perform analysis of variance to check whether testing the significance of the difference between means of particular groups is warranted. Run the command of the form summary(anova(myFit)). If the p-value assigned in the output to our factor of interest is smaller than 0.05, we can proceed to the next step.
8. Calculate the compact letter display of differences between group means, running the command of the form multcomp::cld(emmeans(myFit,~PlantLine), alpha=0.05)). In the compact letter display, two groups are marked as differing in means if they do not share a common letter.
Validation of protocol
This protocol was validated using chloroplast movement mutants of Arabidopsis thaliana, confirming that the observed differences in reflectance spectra are due to different chloroplast positions within cells. This protocol (or parts of it) has been used and validated in the following research article:
Hermanowicz, P. and Łabuz, J. (20). Hyperspectral imaging for chloroplast movement detection. J Exp Bot.: Figure 1D–G, Figure 2B, Figure 3, and Figure 4. Supplementary Information: Figure S2, Figure S3, Figure S4, and Figure S5.
General notes and troubleshooting
General notes
1. A light sensor in the PAR (photosynthetically active radiation) range is needed to measure light irradiance at all steps of the experiment. A sensor (e.g., LI-190R sensor) equipped with a flat diffuser (e.g., opal glass or ground glass) should be used. Unlike bare photodiodes, such sensors are cosine-corrected, properly accounting for the geometry of the light beam.
2. White light can be used instead of blue light to induce chloroplast movements. Such an approach may provide more ecologically relevant results, especially if the spectrum of the light is close to that of sunlight. However, as only the blue part of the spectrum triggers the response, higher irradiance is necessary. Irradiation with high light causes heating, which may result in loss of water. Thus, the use of blue light is recommended when working with detached leaves or cut-off shoots.
Acknowledgments
Specific contributions of each author: Conceptualization, P.H., J.L.; Investigation, P.H., J.L.; Writing—Original Draft, J.L., P.H., A.H.; Writing—Review & Editing, P.H, J.L.; Funding acquisition, J.L.; Supervision, J.L. The work was supported by the Foundation for Polish Science, project FIRST TEAM FENG.02.02-IP.05-0018/24, “Development of tools to increase the albedo of agricultural fields and urban greenery to counteract global warming.”
Original research paper in which the protocol was described and validated: Hermanowicz, P. and Łabuz, J. (2025). Hyperspectral imaging for chloroplast movement detection. J Exp Bot, 76(3), 882–898. https://doi.org/10.1093/jxb/erae407 [20].
Competing interests
The authors declare no conflicts of interest.
References
- Łabuz, J., Sztatelman, O. and Hermanowicz, P. (2022). Molecular insights into the phototropin control of chloroplast movements. J Exp Bot. 73(18): 6034–6051. https://doi.org/10.1093/jxb/erac271
- Senn, G. (1908). Die Gestalts- und Lageveränderung der Pflanzen-Chromatophoren: mit einer Beilage: Die Lichtbrechung der lebenden Pflanzenzelle. W. Leipzig: Engelmann, W.
- Kataoka, H. (2015). Gustav Senn (1875–1945): The pioneer of chloroplast movement research. J Integr Plant Biol. 57(1): 4–13. https://doi.org/10.1111/jipb.12311
- Kagawa, T. and Wada, M. (2000). Blue Light-Induced Chloroplast Relocation in Arabidopsis thaliana as Analyzed by Microbeam Irradiation. Plant Cell Physiol. 41(1): 84–93. https://doi.org/10.1093/pcp/41.1.84
- Shibata, K. (1958). Spectrophotometry of intact biological materials. J Biochem. 45(8): 599–623. https://doi.org/10.1093/oxfordjournals.jbchem.a126905
- Inoue, Y. and Shibata, K. (1974). Comparative examination of terrestrial plant leaves in terms of light-induced absorption changes due to chloroplast rearrangements. Plant Cell Physiol. 15(4): 717–721. https://doi.org/10.1093/oxfordjournals.pcp.a075058
- Walczak, T. and Gabrys, H. (1980). New type of photometer for measurements of transmission changes corresponding to chloroplast movements in leaves. Photosynthetica. 14: 65–72.
- Park, Y. I., Chow, W. S. and Anderson, J. M. (1996). Chloroplast Movement in the Shade Plant Tradescantia albiflora Helps Protect Photosystem II against Light Stress. Plant Physiol. 111(3): 867–875. https://doi.org/10.1104/pp.111.3.867
- Gorton, H. L., Williams, W. E. and Vogelmann, T. C. (1999). Chloroplast movement in Alocasia macrorrhiza. Physiol Plant. 106(4): 421–428. https://doi.org/10.1034/j.1399-3054.1999.106410.x
- Hermanowicz, P., Giza, A., Sowa, K., Korecki, P. and Łabuz, J. (2023). Sensitive detection of chloroplast movements through changes in leaf cross-polarized reflectance. bioRxiv: e563792. https://doi.org/10.1101/2023.10.24.563792
- Dutta, S., Cruz, J. A., Jiao, Y., Chen, J., Kramer, D. M. and Osteryoung, K. W. (2015). Non‐invasive, whole‐plant imaging of chloroplast movement and chlorophyll fluorescence reveals photosynthetic phenotypes independent of chloroplast photorelocation defects in chloroplast division mutants. Plant J. 84(2): 428–442. https://doi.org/10.1111/tpj.13009
- Davis, P. A., Caylor, S., Whippo, C. W. and Hangarter, R. P. (2011). Changes in leaf optical properties associated with light-dependent chloroplast movements. Plant Cell Environ. 34(12): 2047–2059. https://doi.org/10.1111/j.1365-3040.2011.02402.x
- Baránková, B., Lazár, D. and Nauš, J. (2016). Analysis of the effect of chloroplast arrangement on optical properties of green tobacco leaves. Remote Sens Environ. 174: 181–196. https://doi.org/10.1016/j.rse.2015.12.011
- Rouse, J. W., Haas, R. H., Schell, J. A. and Deering, D. W. (1974). Monitoring vegetation systems in the Great Plains with ERTS. NASA Special Publication. 351: 309–317. https://doi.org/10.1021/jf60203a024
- Huete, A. (1997). A comparison of vegetation indices over a global set of TM images for EOS-MODIS. Remote Sens Environ. 59(3): 440–451. https://doi.org/10.1016/s0034-4257(96)00112-5
- Kaufman, Y. J. and Tanré, D. (1996). Strategy for direct and indirect methods for correcting the aerosol effect on remote sensing: From AVHRR to EOS-MODIS. Remote Sens Environ. 55(1): 65–79. https://doi.org/10.1016/0034-4257(95)00193-x
- Gitelson, A. A. and Merzlyak, M. N. (1994). Spectral Reflectance Changes Associated with Autumn Senescence of Aesculus hippocastanum L. and Acer platanoides L. Leaves. Spectral Features and Relation to Chlorophyll Estimation. J Plant Physiol. 143(3): 286–292. https://doi.org/10.1016/S0176-1617(11)81633-0
- Carter, G. A. (1991). Primary and secondary effects of water content on the spectral reflectance of leaves. Am J Bot. 78(7): 916–924. https://doi.org/10.1002/j.1537-2197.1991.tb14495.x
- Stephen Wolfram. (2023). An elementary introduction to Wolfram Language. Wolfram Media, Inc. Retrieved from https://www.wolfram.com/language/elementary-introduction/3rd-ed/
- Hermanowicz, P. and Łabuz, J. (2025). Hyperspectral imaging for chloroplast movement detection. J Exp Bot. 76(3): 882–898. https://doi.org/10.1093/jxb/erae407
- Team, R. C. (2019). R: A language and environment for statistical computing. Vienna, Austria.: R Foundation for Statistical Computing. Retrieved from https://www.r-project.org/
- Pinheiro, J. C. and Bates, D. M. (2000). Mixed-Effects Models in S and S-PLUS. (Issue 1). Springer, New York.
- Pinheiro, J., Bates, D. and Team, R. C. (2023). nlme: Linear and Nonlinear Mixed Effects Models. R package version 3.1-162. https://cran.r-project.org/package=nlme
- Lenth, R. (2023). emmeans: Estimated Marginal Means, aka Least-Squares Means_. R package version 1.8.7.
- Hothorn, T., Bretz, F. and Westfall, P. (2008). Simultaneous Inference in General Parametric Models. Biom J. 50(3): 346–363. https://doi.org/10.1002/bimj.200810425
Article Information
Publication history
Received: Aug 20, 2025
Accepted: Nov 6, 2025
Available online: Nov 20, 2025
Published: Dec 20, 2025
Copyright
© 2025 The Author(s); This is an open access article under the CC BY-NC license (https://creativecommons.org/licenses/by-nc/4.0/).
How to cite
Hermanowicz, P., Hebda, A. and Łabuz, J. (2025). Chloroplast Movement Imaging Under Different Light Regimes With a Hyperspectral Camera. Bio-protocol 15(24): e5541. DOI: 10.21769/BioProtoc.5541.
Category
Plant Science > Plant cell biology > Cell imaging
Plant Science > Plant physiology
Bioinformatics and Computational Biology
Do you have any questions about this protocol?
Post your question to gather feedback from the community. We will also invite the authors of this article to respond.