- Protocols

- Articles and Issues
- For Authors
- About
- Become a Reviewer

Preparation and Negative Staining for Visualization of Cyanoglobule Lipid Droplets Using Transmission Electron Microscopy
Published: Vol 15, Iss 23, Dec 5, 2025 DOI: 10.21769/BioProtoc.5532 Views: 1311
Reviewed by: Samik BhattacharyaDawid S ZylaAnonymous reviewer(s)
Original research article
The authors used this protocol in:
Jul 2025

Protocol Collections
Comprehensive collections of detailed, peer-reviewed protocols focusing on specific topics


Related protocols
Abstract
Lipid droplets have emerged as dynamic organelles involved in diverse cellular processes beyond simple lipid storage. In plants and cyanobacteria, growing evidence highlights their importance in stress adaptation and signaling, yet methods to study their structure and purity remain limited. Traditionally, in situ transmission electron microscopy (TEM) has been used to visualize lipid droplets within intact cells. While powerful, this approach cannot easily evaluate isolated lipid droplets or confirm their purity. In this protocol, we describe a rapid method for preparing and visualizing cyanoglobule lipid droplets isolated from cyanobacteria. The isolated droplets are directly processed for TEM using negative staining with uranyl acetate, providing a straightforward and efficient workflow. The procedure can be applied broadly to lipid droplets from diverse organisms, independent of species or cellular origin. This protocol offers a simple, fast, and widely applicable approach to assessing lipid droplets, expanding the toolkit for researchers studying their structure and function.
Key features
• Provides a brief and detailed method to visualize cyanoglobule lipid droplets.
• Offers a rapid workflow (~1–2 h from preparation to imaging), enabling efficient sample processing and high-throughput analysis.
• Employs negative staining and TEM to directly assess droplet morphology and purity without complex sample preparation.
• Applicable to isolated lipid droplets from diverse organisms, making it a broadly useful tool beyond cyanobacteria.
Keywords: Lipid dropletsGraphical overview
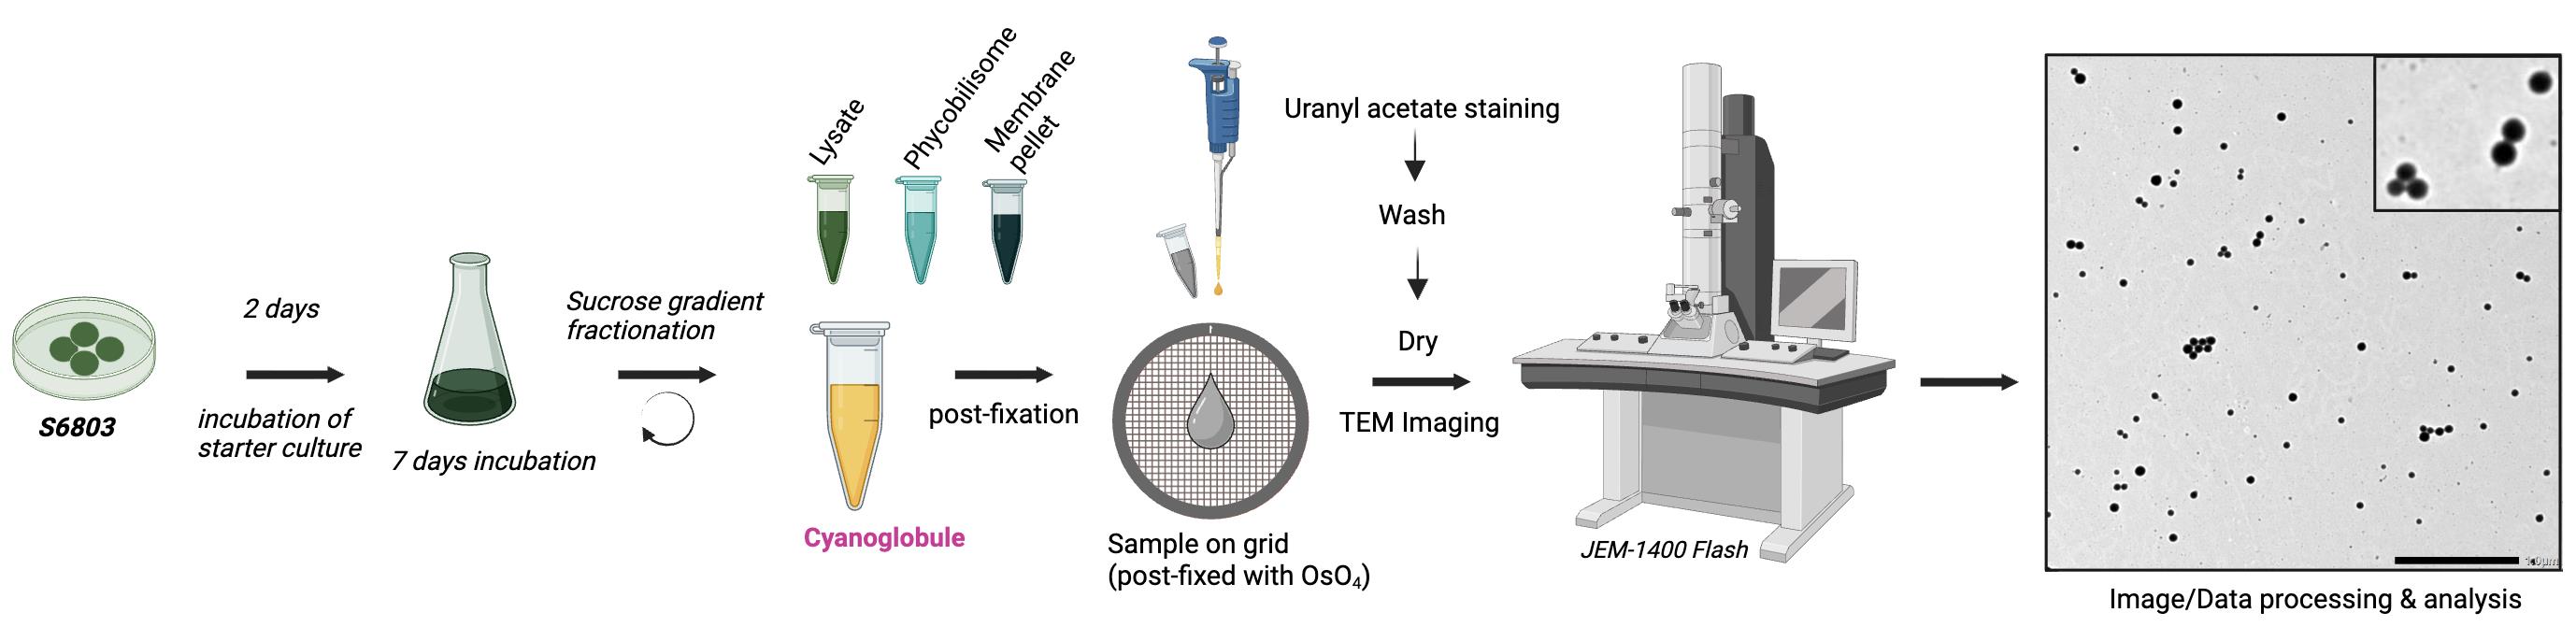
Overview of cyanoglobule lipid droplet preparation and negative staining for transmission electron microscopy (TEM) visualization
Background
Plastoglobules are lipid–protein droplets in chloroplasts that play important roles in membrane remodeling, stress adaptation, and redox balance [1,2]. They are closely associated with thylakoid membranes and change dynamically in number and size in response to stress [3]. Proteomic studies in Arabidopsis thaliana have revealed a specialized set of enzymes involved in lipid metabolism, redox regulation, and hormone biosynthesis, supporting the view that plastoglobules function as metabolic platforms rather than passive storage sites [4–7]. Despite these insights, knowledge of plastoglobule lipid and protein composition remains limited outside of model systems.
In cyanobacteria, various inclusion bodies such as carboxysomes, glycogen granules, and polyhydroxy alkanoate (PHA) bodies are well studied, while lipid droplets have only recently attracted attention. These structures, now termed cyanoglobules, are widely observed across species and increase in abundance under nutrient stress conditions [8–10,16]. Early studies suggested they contained triacylglycerol, though recent work has shown that they also harbor unique plastoquinone derivatives [11,12,16]. Notably, the lipid composition of cyanoglobules can vary depending on environmental stress and species, reflecting their dynamic metabolic roles. Proteomic and lipidomic analyses indicate that cyanoglobules share core features with plastoglobules, including enrichment in prenyl lipids and conserved proteins, while also exhibiting unique attributes such as stress-induced carotenoid accumulation [2,7,16]. These findings suggest that cyanoglobules are metabolically active compartments with important roles in stress physiology and share an evolutionary relationship with plastoglobules [13,14,16].
Traditionally, plastoglobules and cyanoglobules have been studied using in situ transmission electron microscopy (TEM), which provides high-resolution imaging within the cellular context but does not readily allow evaluation of isolated lipid droplets or assessment of sample purity [15]. Biochemical methods such as thin-layer chromatography (TLC) or gas chromatography–mass spectrometry (GC–MS) have advanced our understanding of lipid composition, but they do not provide rapid or direct visualization of droplet morphology. Negative staining TEM of isolated droplets offers a valuable complementary approach, enabling direct imaging of droplet morphology, size, and purity with minimal preparation.
Here, we present a rapid and broadly applicable protocol for visualizing cyanoglobule lipid droplets by negative staining TEM. Unlike conventional resin embedding and thin-section TEM, which require time-consuming fixation, dehydration, and sectioning steps that may alter droplet morphology, negative staining enables direct observation of isolated structures in near-native form. This approach provides a straightforward workflow to directly assess droplet morphology and integrity immediately after isolation, thereby expanding the toolkit available for studying cyanobacterial lipid droplets. Beyond cyanobacteria, this method can also be applied to plastoglobules and potentially to cytosolic lipid droplets in diverse organisms. Its simplicity, speed, and reproducibility make it a powerful method for advancing the study of lipid droplet biology, stress adaptation, and evolutionary connections across the photosynthetic lineage.
Materials and reagents
Biological materials
1. Isolated Synechocystis sp. PCC 6803 cyanoglobule lipid droplets (prepared as described previously [17])
Reagents
1. Osmium tetroxide (OsO4) 4% (Electron Microscopy Sciences, catalog number: 19140)
2. 1% uranyl acetate (Electron Microscopy Sciences, catalog number: 22400-1)
Note: The uranyl acetate working solution should be stored at 4 °C, protected from light, for up to one month. Before use, filter the solution through a 0.22 μm syringe filter to remove particulates and ensure optimal staining quality.
3. HPLC-grade distilled water (Sigma-Aldrich, catalog number: 270733)
Solutions
1. 1% osmium tetroxide (see Recipes)
Recipes
1. 1% osmium tetroxide (OsO4)
| Reagent | Final concentration | Quantity or volume |
|---|---|---|
| OsO4 4% (w/v) | 1% (w/v) | 2.5 mL |
| HPLC-grade distilled water | n/a | 7.5 mL |
| Total | 10 mL |
Note: OsO4 is extremely toxic and volatile, so always prepare and handle it in a certified fume hood, with gloves and eye/face protection. Store in sealed glass vials at 4 °C, under refrigeration in secondary containment. Vials should display appropriate universal hazard symbols according to local environmental, health, and safety guidelines.
Laboratory supplies
1. Parafilm (Heathrow Scientific, catalog number: 470201-930)
2. Formvar-coated grid (100 mesh) (Electron Microscopy Sciences, catalog number: FCF100-Cu)
3. Micropipette
4. P1000, P200, P10 pipette tips
5. Petri dish (glass) (VWR, catalog number: 75845-542)
6. Forceps (anti-capillary) (Electron Microscopy Sciences, catalog number: 72700-D)
7. Filter paper (VWR, catalog number: 470201-456)
Equipment
1. JEM-1400 Flash Electron Microscope, equipped with a Matataki EM-14661 Flash High Sensitive CMOS camera (sCMOS) (JEOL Ltd.)
Software and datasets
1. Operation GUI (TEM Center version 1.7.16) (JEOL Ltd)
Procedure
A. Sample preparation and negative staining with uranyl acetate
1. The isolated fraction of cyanoglobules obtained from sucrose gradient purification [17] is used for direct staining and visualization.
2. Mix 180 μL of sample with 500 μL of 1% (w/v) OsO4 inside a fume hood. Incubate for 10 min. Although droplets are already isolated, osmium tetroxide serves as a secondary fixative that stabilizes and contrasts unsaturated lipid components, preserving their structural integrity for TEM visualization.
3. Place a piece of Parafilm in a Petri dish. Arrange Formvar-coated copper grids on top of the Parafilm, shiny side facing up.
4. Pipette 20 μL of cyanoglobule sample onto each grid and incubate for 20 min. Cover the Petri dish with its lid during incubation.
5. Blot excess liquid from the back side of the grid using filter paper, ensuring the sample remains on the grid surface.
6. Prepare the negative staining setup as shown in Figure 1, with one drop of 1% uranyl acetate and three drops of HPLC-grade water (200 μL each).
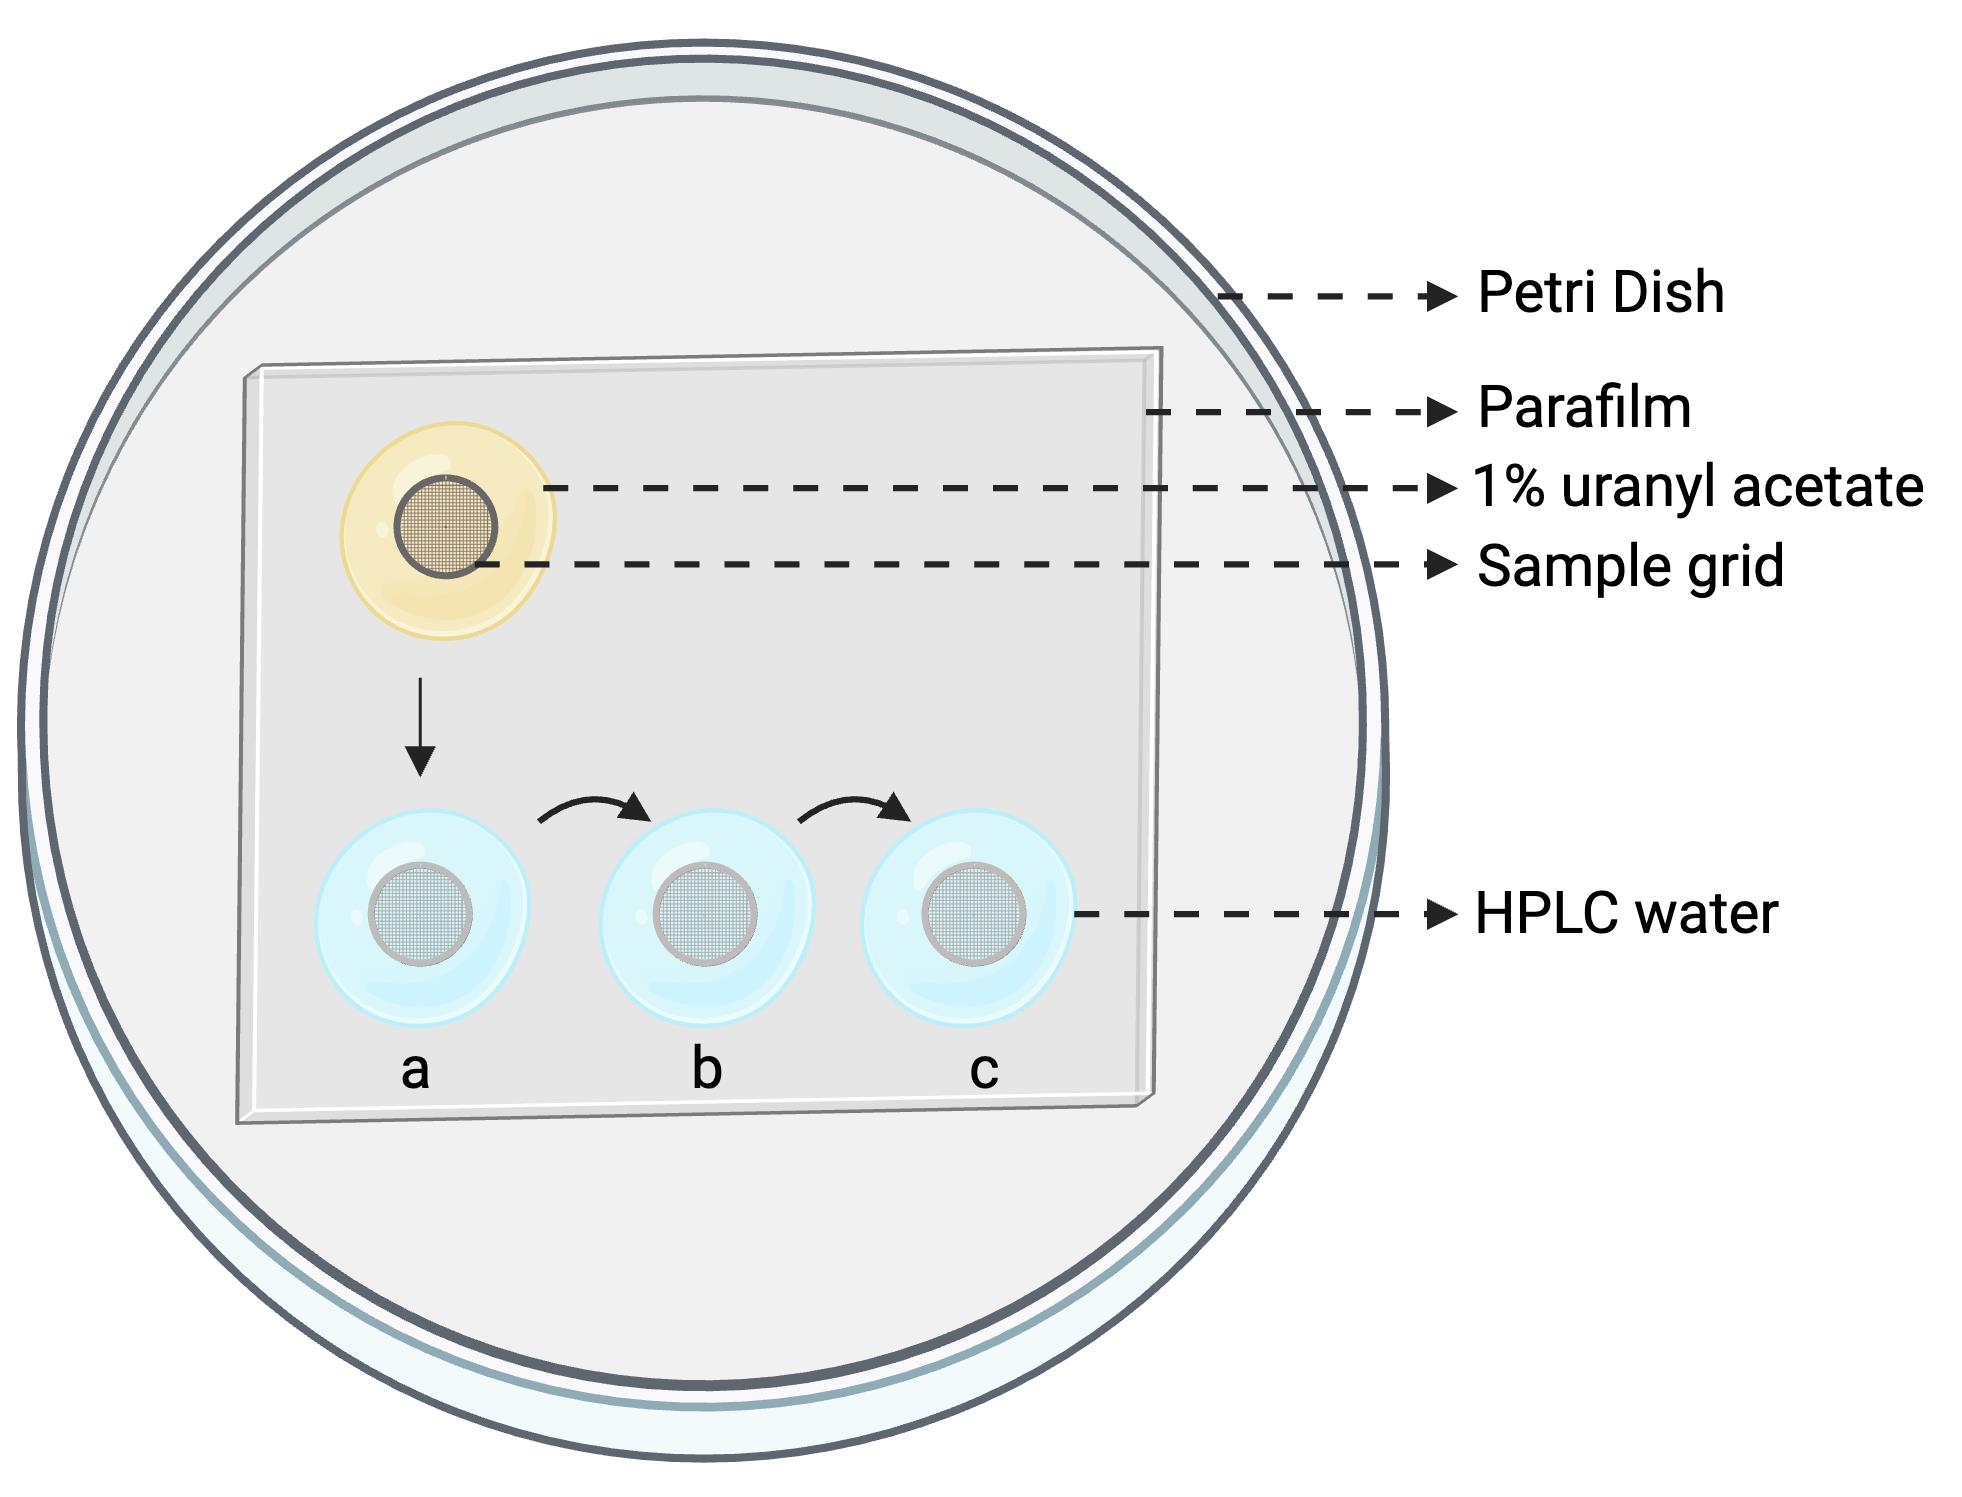
Figure 1. Setup configuration for negative staining. A Petri dish lined with Parafilm holds one drop of uranyl acetate (for staining) and three drops of HPLC-grade water (for sequential washes). Sample grids are incubated on the Parafilm surface.
7. Transfer the dried sample grid into the drop of 1% (w/v) uranyl acetate for 20 s using anti-capillary forceps (handle the grid carefully to avoid film damage).
8. Sequentially wash the grid by transferring it into the three drops of HPLC-grade water (30 s per drop).
9. Blot the grid dry from the edge using filter paper held at a ~45° angle, using the dull side to wick away excess liquid.
10. Allow the grid to fully air-dry. Once dry, the grid is ready for imaging.
B. Data collection (imaging cyanoglobules)
1. Grid mounting
a. Using clean anti-capillary forceps, gently pick up a stained copper grid by the edge.
b. Place the grid into the TEM specimen holder, ensuring the carbon-coated side is facing the electron beam.
c. Lock the holder securely before insertion.
2. Inserting the grid holder
a. Carefully insert the holder into the JEM-1400 Flash goniometer stage.
b. Engage the vacuum interlock sequence following instrument instructions.
c. Wait until the system confirms that the specimen chamber has reached operating vacuum.
3. Initial microscope setup
a. Switch to low magnification (e.g., 1,000×) to locate the grid square and ensure proper alignment.
b. Adjust condenser lens aperture and illumination for even contrast.
c. Center and focus the beam over an area of interest.
4. Imaging at higher magnification
a. Gradually increase magnification (e.g., 10,000× to 30,000×) to visualize lipid droplets.
b. Adjust focus, astigmatism correction, and contrast for clarity.
c. Use a low-dose imaging mode to minimize beam-induced damage and droplet collapse (recommended beam current ≤ 10 μA and dose rate < 5 e-·Å-2·s-1).
d. Optimize the electron beam to avoid grid damage.
5. Image acquisition
a. Open TEM Center software on the acquisition workstation.
b. Capture live images using the sCMOS camera.
c. Adjust exposure time, gain, and binning settings for optimal resolution.
d. Save images in TIFF format for high-quality analysis, and optionally in JPEG/PNG for quick viewing. TIFF image acquisition is compulsory for accurate downstream processing and quantitative analysis (preserves full image fidelity and metadata). For larger experiments, users should anticipate that a typical session may require tens to hundreds of gigabytes of disk space, depending on magnification and exposure settings. A workstation equipped with at least 32 GB RAM, a multi-core CPU, and a dedicated GPU are recommended for smooth image acquisition and post-processing.
6. Documentation: Note grid ID and sample details for traceability.
7. Finishing up
a. Once imaging is complete, return to low magnification and move to an empty grid square.
b. Remove the specimen holder following the JEOL shutdown procedure.
c. Store imaged grids in a labeled grid box for future reference.
Data analysis
The electron micrographs obtained from negatively stained grids were analyzed to assess the presence, morphology, and purity of cyanoglobule lipid droplets. Images were first examined qualitatively for droplet distribution, shape, and structural integrity, while noting any background contamination or staining artifacts. Representative images were selected across multiple grid areas to ensure reproducibility and avoid sampling bias. For quantitative analysis, droplet diameter, circularity, and particle density were measured using open-source image analysis software (ImageJ/Fiji). The measurement process involved thresholding to segment individual droplets, followed by the Analyze Particles function to automatically extract area and circularity values (defined as 4π × [area/perimeter2]). Particle counts were normalized to image area to estimate droplet density (number·μm-2). As a benchmark, Synechocystis cyanoglobule lipid droplets typically range from ~25 to 120 nm in diameter, consistent with previous reports under nutrient stress conditions [16]. Depending on the quality and contrast of the TEM micrographs, analyses were performed either automatically using Fiji’s particle detection tools or manually by outlining droplets to ensure accuracy. Data were recorded as mean ± standard deviation from at least three independent preparations. All micrographs were saved in lossless TIFF format to preserve image detail. Readers are referred to the standard ImageJ/Fiji user guide for detailed instructions on thresholding and particle analysis. This approach enables both qualitative confirmation of droplet morphology and quantitative assessment of their structural characteristics.
Validation of protocol
This protocol, or parts of it, has been used and validated in the following research articles:
1. Cyanoglobules staining:
Susanto et al. [16]. Cyanoglobule lipid droplets are a stress-responsive metabolic compartment of cyanobacteria and the progenitor of plant plastoglobules (Figure 3C, Supplementary Figure S8).
2. Maize plastoglobules staining:
Devadasu et al. [18]. Dynamic changes to the plastoglobule lipidome and proteome in maize during heat stress and recovery (Figure 4B).
3. Representative validation: A representative TEM image of negatively stained cyanoglobules prepared using this protocol is shown in Figure 2, demonstrating the preservation of droplet morphology and contrast quality.
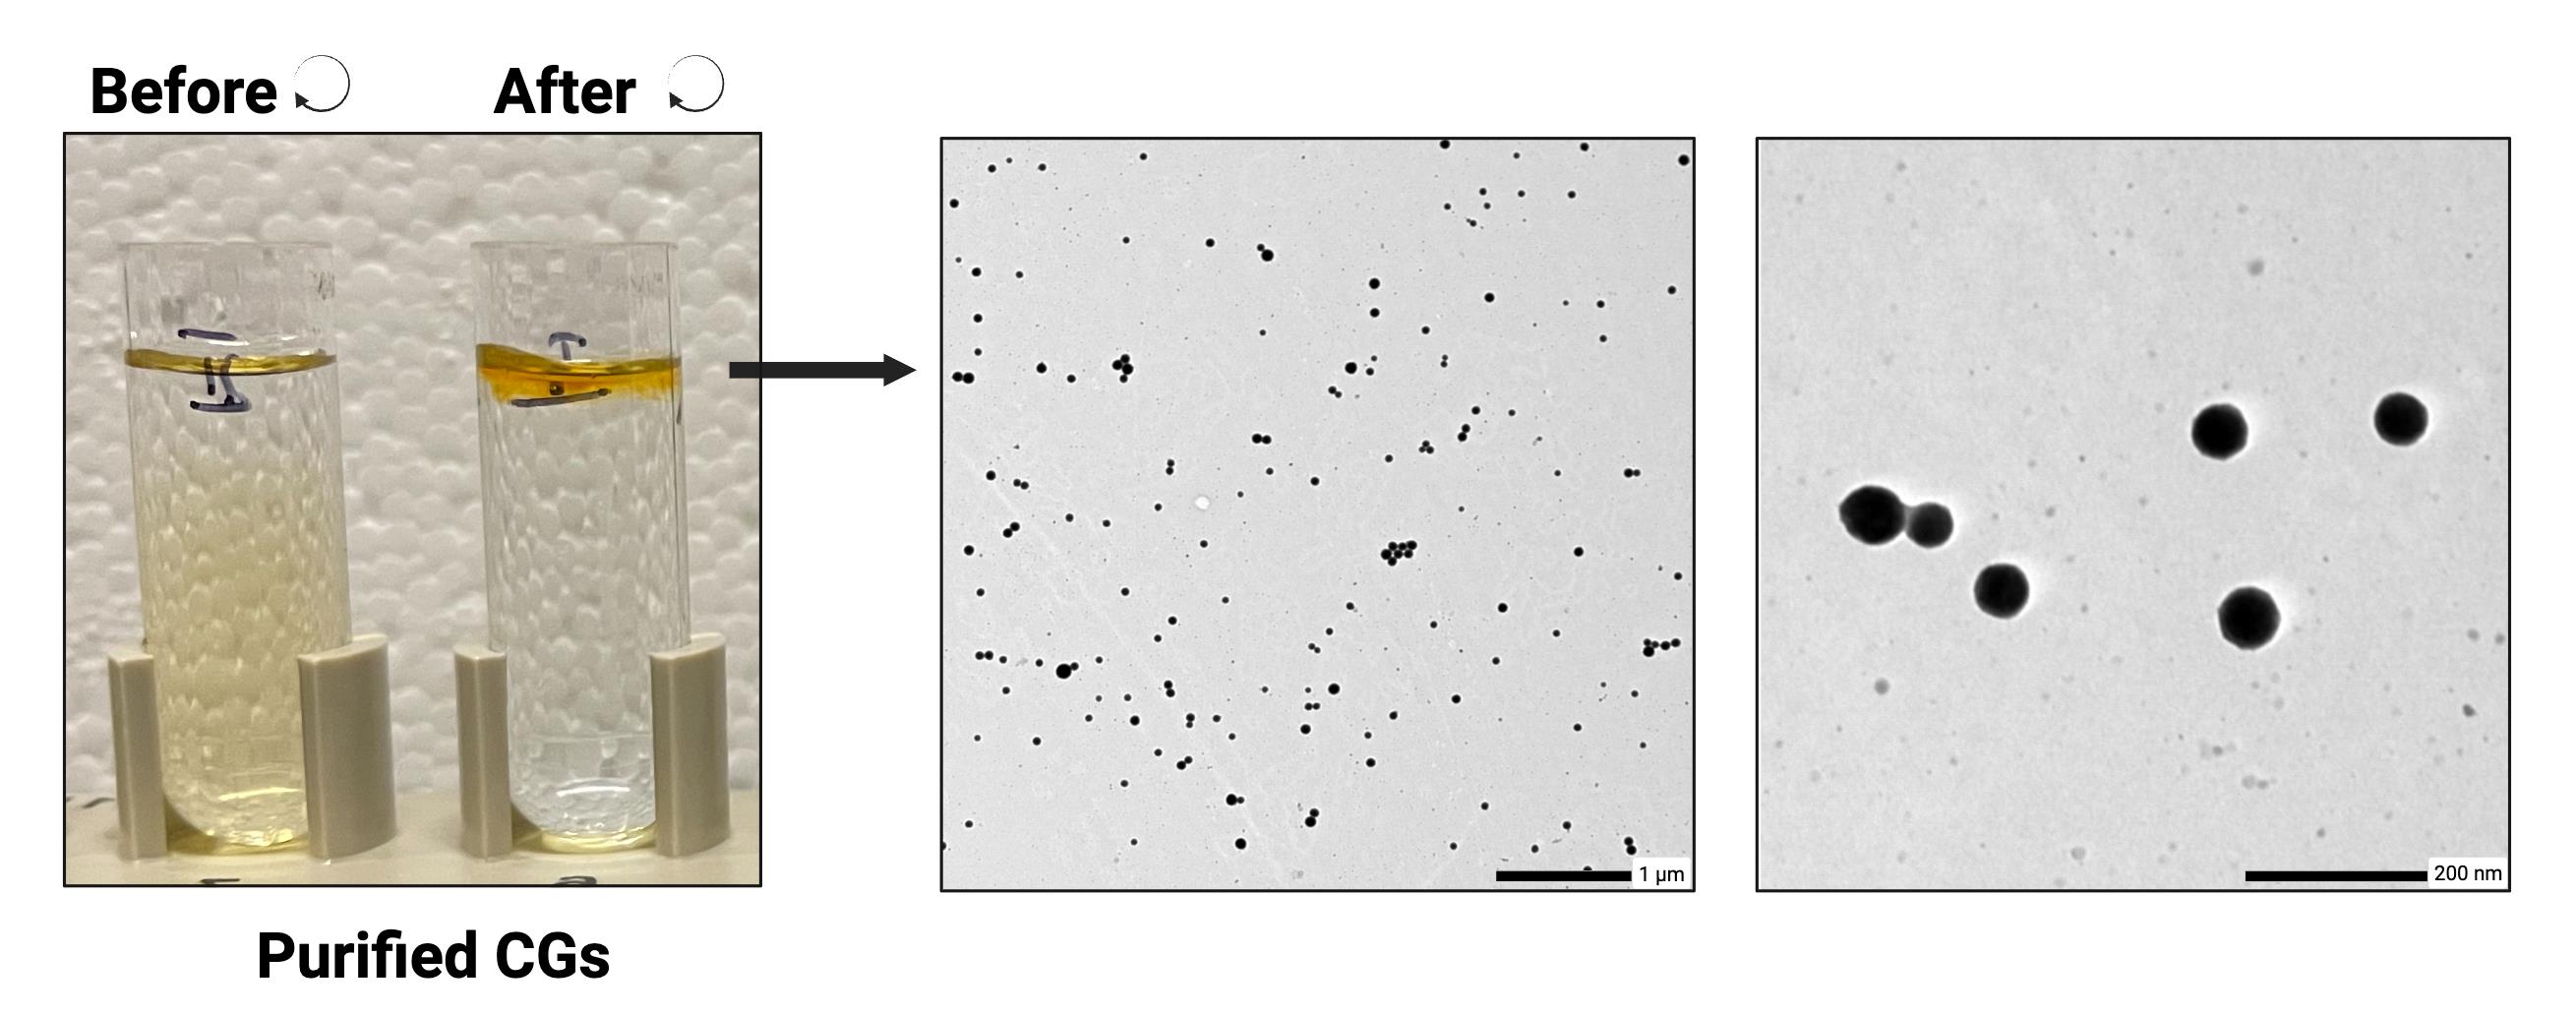
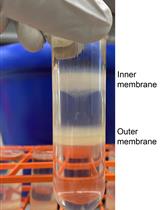
Figure 2. Representative transmission electron micrographs of negatively stained purified cyanoglobules. Isolated cyanoglobules from Synechocystis sp. PCC 6803 were prepared using the described protocol and visualized by transmission electron microscopy (TEM) after osmium tetroxide fixation and uranyl acetate negative staining. Distinct, spherical lipid droplets (~50–100 nm diameter) are observed with strong contrast and minimal background debris, demonstrating the preservation of droplet morphology and staining quality achieved with this method. Left: Sucrose gradient fractions before and after ultracentrifugation of cyanoglobule purification. Middle: TEM image of isolated cyanoglobules showing uniform distribution (scale bar: 1 μm). Right: Higher-magnification view highlighting their spherical, osmiophilic nature (scale bar: 200 nm).
General notes and troubleshooting
General notes
1. For lipid droplet morphology, imaging at 10,000–30,000× magnification typically provides optimal visualization.
2. Use minimal beam exposure to reduce the risk of droplet collapse caused by electron beam damage or stain instability.
3. Handle grids and forceps with care, as both the samples and equipment are fragile. Reagents such as osmium tetroxide and uranyl acetate are toxic and must be handled in a certified fume hood with appropriate PPE.
4. Sample preparation and staining require approximately 45 min, and imaging takes 1–2 h, depending on sample number. Overall, the protocol is rapid, reproducible, and robust.
5. If samples are resuspended in a phosphate-containing buffer such as PBS, rinse grids 2–3 times with HPLC-grade water before staining with uranyl acetate. Phosphate residues are a common source of staining artifacts, and thorough rinsing is essential to remove buffer components and prevent crystal formation or debris that can interfere with sample integrity and imaging.
6. OsO4 is extremely toxic. Always use it in a certified fume hood while wearing appropriate PPE (lab coat, gloves, and safety goggles). Dispose of it mixed with corn oil to neutralize it.
7. Uranyl acetate is a radioactive and highly toxic heavy metal, and its handling, storage, and disposal are strictly regulated in many institutions. Researchers should consult their local Environmental Health and Safety (EHS) office before use to ensure compliance with institutional and governmental regulations. For laboratories where uranyl acetate is not permitted, 1% phosphotungstic acid (PTA) can be used as a non-radioactive negative-staining alternative, although image contrast may differ slightly.
8. Safety note: Always follow institutional safety regulations for handling hazardous chemicals and dispose of chemical waste according to local environmental health and safety guidelines.
Troubleshooting
Problem 1: Sample too diluted, making cyanoglobules difficult to locate or widely spaced.
Possible cause: Insufficient material collected during cyanoglobule isolation.
Solution: Pool diluted fractions and rerun a second sucrose gradient to concentrate cyanoglobules.
Problem 2: Excessive stain crystallization on grids.
Possible causes: Uranyl acetate was not filtered before use, or drying occurred too quickly.
Solution: Filter stain solutions through a 0.22 μm syringe filter before use and allow grids to air-dry slowly in a dust-free environment.
Problem 3: Lipid droplets collapse or appear distorted.
Possible cause: Overexposure to the electron beam during imaging.
Solution: Use low-dose imaging settings and reduce exposure time with the Matataki Flash camera.
Acknowledgments
Author contributions: Conceptualization, P.K.L., F.A.S., A.W.; Investigation, F.A.S., A.W.; Writing—Original Draft, F.A.S.; Writing—Review & Editing, F.A.S., A.W., P.K.L.; Funding Acquisition, P.K.L.; Supervision, P.K.L.
This work was supported by the Department of Energy grant DE-SC0025952 to P.K.L., the National Science Foundation grant MCB-2338327 to P.K.L., and a Fulbright PhD fellowship to F.A.S.
This protocol was originally described in Susanto et al. [16], The Plant Cell (2025), DOI: https://doi.org/10.1093/plcell/koaf127, and was adapted from methods developed for plastoglobule and cyanoglobule lipid droplet research. Figures and the Graphical overview were created in BioRender. Susanto, F. (2025) https://BioRender.com/wghm7vv.
Competing interests
The authors declare no conflicts of interest.
Ethical considerations
This work did not use human or animal subjects and has no ethical considerations.
References
- Lundquist, P. K., Poliakov, A., Bhuiyan, N. H., Zybailov, B., Sun, Q. and van Wijk, K. J. (2012). The Functional Network of the Arabidopsis Plastoglobule Proteome Based on Quantitative Proteomics and Genome-Wide Coexpression Analysis. Plant Physiol. 158(3): 1172–1192. https://doi.org/10.1104/pp.111.193144
- Lundquist, P. K., Poliakov, A., Giacomelli, L., Friso, G., Appel, M., McQuinn, R. P., Krasnoff, S. B., Rowland, E., Ponnala, L., Sun, Q., et al. (2013). Loss of Plastoglobule Kinases ABC1K1 and ABC1K3 Causes Conditional Degreening, Modified Prenyl-Lipids, and Recruitment of the Jasmonic Acid Pathway. Plant Cell. 25(5): 1818–1839. https://doi.org/10.1105/tpc.113.111120
- van Wijk, K. J. and Kessler, F. (2017). Plastoglobuli: Plastid Microcompartments with Integrated Functions in Metabolism, Plastid Developmental Transitions, and Environmental Adaptation. Annu Rev Plant Biol. 68(1): 253–289. https://doi.org/10.1146/annurev-arplant-043015-111737
- Austin, J. R., Frost, E., Vidi, P. A., Kessler, F. and Staehelin, L. A. (2006). Plastoglobules Are Lipoprotein Subcompartments of the Chloroplast That Are Permanently Coupled to Thylakoid Membranes and Contain Biosynthetic Enzymes. Plant Cell. 18(7): 1693–1703. https://doi.org/10.1105/tpc.105.039859
- Vidi, P. A., Kanwischer, M., Baginsky, S., Austin, J. R., Csucs, G., Dörmann, P., Kessler, F. and Bréhélin, C. (2006). Tocopherol Cyclase (VTE1) Localization and Vitamin E Accumulation in Chloroplast Plastoglobule Lipoprotein Particles. J Biol Chem. 281(16): 11225–11234. https://doi.org/10.1074/jbc.m511939200
- Ytterberg, A. J., Peltier, J. B. and van Wijk, K. J. (2006). Protein Profiling of Plastoglobules in Chloroplasts and Chromoplasts. A Surprising Site for Differential Accumulation of Metabolic Enzymes. Plant Physiol. 140(3): 984–997. https://doi.org/10.1104/pp.105.076083
- Espinoza‐Corral, R., Schwenkert, S. and Lundquist, P. K. (2021). Molecular changes of Arabidopsis thaliana plastoglobules facilitate thylakoid membrane remodeling under high light stress. Plant J. 106(6): 1571–1587. https://doi.org/10.1111/tpj.15253
- Pankratz, H. S. and Bowen, C. C. (1963). Cytology of Blue‐Green Algae. I. The Cells of Symploca Muscorum. Am J Bot. 50(4): 387–399. https://doi.org/10.1002/j.1537-2197.1963.tb07207.x
- Peramuna, A. and Summers, M. L. (2014). Composition and occurrence of lipid droplets in the cyanobacterium Nostoc punctiforme. Arch Microbiol. 196(12): 881–890. https://doi.org/10.1007/s00203-014-1027-6
- Aizouq, M., Peisker, H., Gutbrod, K., Melzer, M., Hölzl, G. and Dörmann, P. (2020). Triacylglycerol and phytyl ester synthesis in Synechocystis sp. PCC6803. Proc Natl Acad Sci USA. 117(11): 6216–6222. https://doi.org/10.1073/pnas.1915930117
- Ishikawa, T., Takano, S., Tanikawa, R., Fujihara, T., Atsuzawa, K., Kaneko, Y. and Hihara, Y. (2023). Acylated plastoquinone is a novel neutral lipid accumulated in cyanobacteria. PNAS Nexus. 2(5): pgad092. https://doi.org/10.1093/pnasnexus/pgad092.
- Mori-Moriyama, N., Yoshitomi, T. and Sato, N. (2023). Acyl plastoquinol is a major cyanobacterial substance that co-migrates with triacylglycerol in thin-layer chromatography. Biochem Biophys Res Commun. 641: 18–26. https://doi.org/10.1016/j.bbrc.2022.12.003
- Zimorski, V., Ku, C., Martin, W. F. and Gould, S. B. (2014). Endosymbiotic theory for organelle origins. Curr Opin Microbiol. 22: 38–48. https://doi.org/10.1016/j.mib.2014.09.008
- Martin, W. F., Garg, S. and Zimorski, V. (2015). Endosymbiotic theories for eukaryote origin. Philos Trans R Soc Lond B Biol Sci. 370(1678): 20140330. https://doi.org/10.1098/rstb.2014.0330
- van de Meene, A. M., Hohmann-Marriott, M. F., Vermaas, W. F. and Roberson, R. W. (2005). The three-dimensional structure of the cyanobacterium Synechocystis sp. PCC 6803. Arch Microbiol. 184(5): 259–270. https://doi.org/10.1007/s00203-005-0027-y
- Susanto, F. A., Jones, A. D., Donnelly, S. L. and Lundquist, P. K. (2025). Cyanoglobule lipid droplets are a stress-responsive metabolic compartment of cyanobacteria and the progenitor of plant plastoglobules. Plant Cell. 37(7): e1093/plcell/koaf127. https://doi.org/10.1093/plcell/koaf127
- Shivaiah, K., Susanto, F. A., Devadasu, E. and Lundquist, P. K. (2022). Plastoglobule Lipid Droplet Isolation from Plant Leaf Tissue and Cyanobacteria. J Visualized Exp. (188): e64515. https://doi.org/10.3791/64515-v
- Devadasu, E., Susanto, F. A., Schilmiller, A. L., Mahey, M., Johnny, C. and Lundquist, P. K. (2025). Dynamic changes to the plastoglobule lipidome and proteome in maize during heat stress and recovery. J Exp Bot. e1093/jxb/eraf452. https://doi.org/10.1093/jxb/eraf452
Article Information
Publication history
Received: Sep 3, 2025
Accepted: Nov 3, 2025
Available online: Nov 13, 2025
Published: Dec 5, 2025
Copyright
© 2025 The Author(s); This is an open access article under the CC BY-NC license (https://creativecommons.org/licenses/by-nc/4.0/).
How to cite
Susanto, F. A., Withrow, A. and Lundquist, P. K. (2025). Preparation and Negative Staining for Visualization of Cyanoglobule Lipid Droplets Using Transmission Electron Microscopy. Bio-protocol 15(23): e5532. DOI: 10.21769/BioProtoc.5532.
Category
Plant Science > Plant cell biology > Organelle isolation
Microbiology > Microbial cell biology > Organelle isolation
Cell Biology > Organelle isolation
Do you have any questions about this protocol?
Post your question to gather feedback from the community. We will also invite the authors of this article to respond.