- Protocols

- Articles and Issues
- For Authors
- About
- Become a Reviewer

Utilizing EdU to Track Leukocyte Recruitment to the Brain
Published: Vol 15, Iss 23, Dec 5, 2025 DOI: 10.21769/BioProtoc.5527 Views: 1804
Reviewed by: Ivonne SehringAnonymous reviewer(s)
Original research article
The authors used this protocol in:
Apr 2025
Advertisement


Protocol Collections
Comprehensive collections of detailed, peer-reviewed protocols focusing on specific topics


Abstract
Detecting the proliferation of cells with copper(I)-catalyzed azide-alkyne cycloaddition (click chemistry) and the thymidine analogue, 5-ethynyl-2’-deoxyuridine (EdU), is a simpler and more versatile method than traditional antibody-based approaches. Instead of the harsh series of steps typically used for 5-bromo-2’-deoxyuridine (BrdU) detection, detecting EdU does not require DNA denaturation and is suitable for use with other applications. This approach was implemented in an animal model of ischemic stroke. The following protocol details how to use EdU to label, track, and visualize leukocyte recruitment for flow cytometry and fluorescence microscopy, including the processes for EdU injection and blood and tissue sample preparation. Considerations for timing, dosing, and cell viability are also outlined to tailor the protocol to experimental needs. This method could be applied to various models that require extended tracking periods, as the signal from EdU can last several cell divisions, depending on cell type and condition.
Key features
• EdU labeling is simple and compatible with routine laboratory methods.
• This method is compatible with genetically encoded fluorophores, such as GFP and tdTomato.
• EdU incorporation in circulating leukocytes varies depending on the specific cell subtype.
• This technique can be adapted to track leukocyte recruitment, including when cells are recruited from the bloodstream.
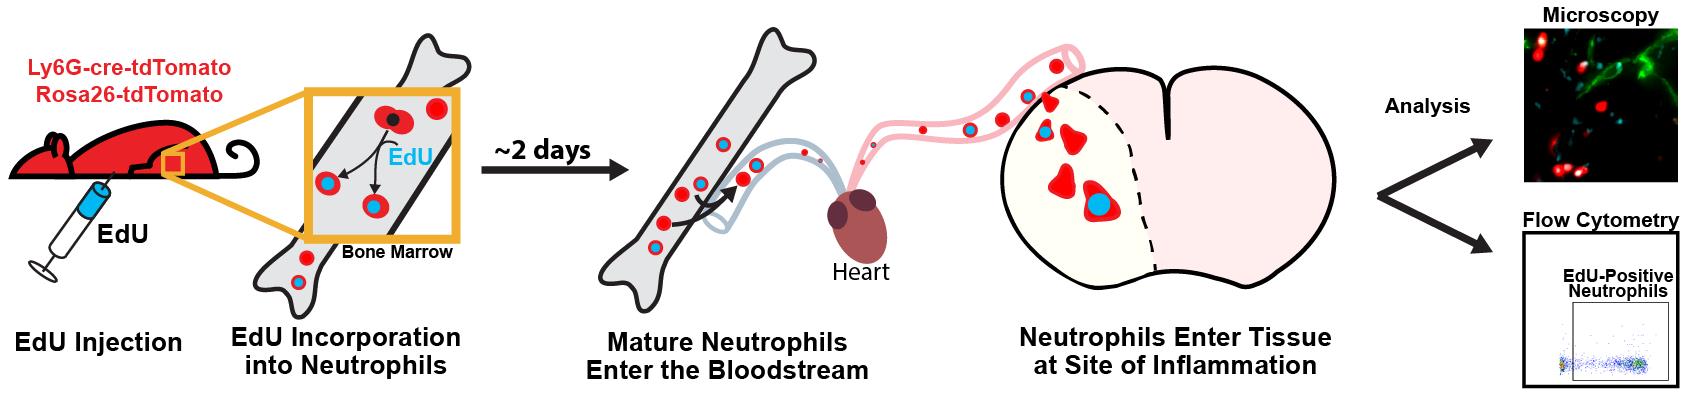
Keywords: EdUGraphical overview
Background
Leukocytes play a key role in the body’s inflammatory response, and understanding the patterns and activity of leukocyte recruitment yields valuable insight for therapeutic interventions. Cell-tracking tools like the nucleotide analogues 5-ethynyl-2’-deoxyuridine (EdU) and 5-bromo-2’-deoxyuridine (BrdU) help to reveal the behavior of leukocytes, as well as many other cell types, across a wide range of pathological processes [1,2]. With EdU labeling, cells incorporate EdU into their DNA during replication, mimicking the nucleoside thymidine. A copper(I)-catalyzed reaction then allows for a fluorescent azide to attach to the alkyne group (click chemistry) on EdU, enabling the detection of dividing cells [2,3]. This is similar to BrdU; however, EdU has greater utility for multiplexed staining and minimizes the disruption of protein epitopes because it does not require DNA denaturation for visualization [4,5]. EdU can be injected intraperitoneally for rapid labeling or given through food or drinking water to prolong the labeling window. EdU is incorporated into the DNA of cells during the S phase of the cell division cycle. As such, for myeloid cells like neutrophils and monocytes, it is incorporated into immature precursors in the bone marrow, which enter the bloodstream after maturation [6–8]. EdU injections could be staggered over several hours or days to label a higher proportion of cells, if desired [9]. One current limitation with EdU compared to other cell-labeling protocols, such as carboxyfluorescein succinimidyl ester or fluorescent antibodies, is that EdU cannot be visualized for live-cell imaging, since the sample must be fixed to detect the EdU signal. Additionally, high concentrations of EdU or prolonged exposure could have cytotoxic effects and may impact cell viability [10].
Here, we detail a protocol for using EdU to label and track leukocytes that also have a genetically encoded fluorophore in an ischemia/reperfusion model of ischemic stroke in mice. While it is optimized for leukocytes, this method can be adapted to investigate other cell types and aims [11,12]. This model demonstrates the dynamics of leukocyte recruitment following an inflammatory event, including which cells are preferentially recruited, how long they circulate in the blood or persist in tissue, and the fraction of each leukocyte subset involved in the response [13]. The methodology here can be used to unobtrusively label a wave of leukocytes in circulation. The labeled leukocytes can be identified in tissue at a later point to gain insights into their location, recruitment patterns, and enrichment.
Materials and reagents
Biological materials
1. Transgenic mice with fluorescent reporter(s)
Note: Here, we describe methods done with the Catchup mouse line, which is on the C57BL/6 background [14], but the methodology could be applied to other mouse lines and reporters. The Catchup mouse has cre-ERT2 and tdTomato inserted into the Ly6G locus and also the Rosa26-CAG-tdTomato reporter. This results in >95% of the circulating neutrophils expressing the red fluorescent protein, tdTomato.
Reagents
1. 2'-Deoxy-5-ethynyluridine (EdU) (Biosynth, catalog number: NE08701)
2. Ammonium-chloride-potassium (ACK) lysing buffer (VWR International, catalog number: 10128-802)
3. Accutase (Gibco, catalog number: A11105)
4. Alexa Fluor 647 conjugated Azide Plus (picolyl azide) (Vector Labs, catalog number: CCT-1482)
5. Copper (II) sulfate pentahydrate (Sigma-Aldrich, catalog number: 209198)
6. Phosphate-buffered saline (PBS), without calcium and magnesium, 10× concentration (Corning, catalog number: 20-031-CV)
7. PBS (without calcium and magnesium), 1× concentration (Corning, catalog number: 21-031-CV)
8. Ethylenediaminetetraacetic (EDTA) powder (Sigma-Aldrich, catalog number: E9884)
9. DyLight 650 Antibody Labeling kit (Thermo Fisher, catalog number: 84535)
10. Fetal bovine serum (FBS) (GeminiBio, catalog number: 100-500)
11. Glycerol (Sigma-Aldrich, catalog number: 5516)
12. Hank’s balanced salt solution (HBSS) with calcium, magnesium, no phenol red, 10× concentration (Gibco, catalog number: 14065-056)
13. HBSS with calcium, magnesium, and phenol red, 1× concentration (Corning, catalog number: 21-020-CV)
14. Hydrochloric acid (HCl) (37%) (VWR Chemicals, catalog number: 7647-01-0)
15. NP-40 (10%) (Thermo Fisher, catalog number: 28324)
16. Optimal cutting temperature (OCT) compound (Thermo Fisher, catalog number: 23-730-571)
17. Paraformaldehyde (PFA) powder (Sigma-Aldrich, catalog number: 158127)
18. Percoll (Sigma-Aldrich, catalog number: P1644)
19. Sodium ascorbate (Sigma-Aldrich, catalog number: 134-03-2)
20. Sodium chloride (NaCl) (Thermo Fisher, catalog number: BP358-212)
21. Sodium hydroxide (NaOH) (Thermo Fisher, catalog number: S320-500)
22. Sucrose (Thermo Fisher, catalog number: BP220-1)
23. Tris base, white crystals (Thermo Fisher, catalog number: BP152-1)
24. Triton X-100 (Sigma-Aldrich, catalog number: 9002-93-1)
25. 2,3,5-Triphenyltetrazolium chloride (Sigma-Aldrich, catalog number: T8877)
26. Zombie violet live dead stain (BioLegend, catalog number: 423114)
Antibodies
1. Anti-Fc receptor (BD Biosciences, catalog number: 553142, stock concentration 500 μg/mL)
2. Anti-CD45 antibody-BV510 conjugated (BioLegend, catalog number: 103138, stock concentration 200 μg/mL)
3. Anti-CD11b antibody-BV650 conjugated (BioLegend, catalog number: 101259, stock concentration 200 μg/mL)
4. Anti-PECAM antibody, clone 390 (Millipore-Sigma, catalog number: CBL1337, stock concentration 500 μg/mL)
Solutions
1. EdU solution (see Recipes)
2. EDTA solution (see Recipes)
3. 40% Percoll solution (see Recipes)
4. Fluorescence-activated cell sorting (FACS) buffer (see Recipes)
5. 4% Formaldehyde solution (see Recipes)
6. Permeabilization buffer (see Recipes)
7. Fluorophore-conjugated Azide Plus (see Recipes)
8. Copper (II) sulfate pentahydrate solution (see Recipes)
9. Sodium ascorbate solution (see Recipes)
10. 5 N sodium hydroxide (see Recipes)
11. Tris-buffered saline (TBS buffer) (see Recipes)
12. 2% Triphenyltetrazolium chloride (TTC) (see Recipes)
13. 0.5% NP-40 (see Recipes)
14. Click reaction solution (see Recipes)
15. Vessel labeling antibody (see Recipes)
16. 15% sucrose (see Recipes)
17. 30% sucrose (see Recipes)
Recipes
1. EdU solution
For a 5 mg/mL stock, dissolve 50 mg of EdU in 10 mL of 1× PBS.
Note: EdU stock solution should be kept at -20 °C.
2. EDTA solution
For 100 mM EDTA, add 2.92 g of EDTA powder to 80 mL of deionized (DI) H2O while stirring. Add 1.5 g of NaOH and allow for EDTA to begin dissolving. Adjust to final pH 8.0 (with 37% HCl or 5 N NaOH). Adjust final volume to 100 mL with DI H2O.
3. 40% Percoll solution
Add 5 mL of 10× HBSS and 45 mL of 100% Percoll to make 90% Percoll in 1× HBSS. This solution may be stored at 4 °C for 6 months. For 40% Percoll, add 27.8 mL of 1× HBSS to 22.2 mL of the 90% Percoll solution to make the final concentration 40% Percoll in 1× HBSS.
Note: We make this fresh for each experiment.
4. Fluorescence-activated cell sorting (FACS) buffer
For 5% composition, add 2 mL of FBS to 48 mL of 1× PBS; mix and filter through a 0.2 μm filter.
5. 4% Formaldehyde solution (pH 7–7.5)
For 100 mL of solution, heat 85 mL of DI H2O to 55–60 °C on a heater; add 4 g of paraformaldehyde powder while stirring (use a magnetic stir bar). Add 1–3 drops of NaOH and wait for the powder to go into solution. Chill to room temperature and add 10 mL of 10× PBS. Adjust pH to 7.5 (with 37% HCl or 5 N NaOH) as needed, then adjust volume to a final 100 mL with DI H2O and filter through a 0.2 μm filter.
Note: All reagents should be combined in a fume hood. The solution should turn clear in a few minutes after adding the drops of NaOH. Adding NaOH starts a chain reaction that converts the powder into dissolved formaldehyde gas. Care should be taken to ensure the temperature of the solution stays below 60 °C and that it is chilled promptly after the powder dissolves to limit the release of formaldehyde from the solution.
6. Permeabilization buffer
For a 0.5% Triton X-100 solution, add 500 μL of 10% Triton X-100 to 9.5 mL of 1× PBS.
7. Fluorophore-conjugated Azide Plus
For 1 mM Azide Plus, dissolve 1 mg of the powder in 915 μL of DI H2O. Store 20 μL aliquots at -20 °C.
Note: Azide Plus was designed to improve copper binding for a more efficient and quicker conjugation reaction compared to simple azide. Using it allows the researcher to minimize the length of time the sample is in the click solution, as the reaction mixture will decrease the genetic fluorescent signal with time. Additionally, azides conjugated to different fluorophores are sold and can be chosen based on your needs.
8. Copper (II) sulfate pentahydrate solution
For 200 mM, dissolve 0.5 g of copper (II) sulfate pentahydrate in a final volume of 10 mL of DI H2O.
Note: This solution may be stored for a week at room temperature.
9. Sodium ascorbate solution
For 1 M, dissolve 0.3 g of sodium ascorbate in a final volume of 1.5 mL of DI H2O.
Note: We make this solution fresh daily.
10. 5 N sodium hydroxide
For 100 mL, dissolve 20 g of NaOH pellets in 80 mL of DI H2O in a beaker. When cooled, bring the final volume to 100 mL.
11. Tris-buffered saline (TBS buffer)
For 50 mM Tris base with 150 mM NaCl, dissolve 6.05 g of Tris base and 8.76 g of NaCl in 800 mL of DI H2O; adjust pH to 7.5 (with 37% HCl or 5 N NaOH) and bring the final volume to 1 L.
12. 2% triphenyltetrazolium chloride (TTC)
For 2%, dissolve 2.0 g of TTC in 100 mL of PBS.
13. 0.5% NP-40
Add 0.5 mL of 10% NP-40 to 9.5 mL of FACS buffer.
Note: We make this solution fresh daily.
14. Click reaction solution
For 550 μL of solution: start with 542 μL of TBS buffer and add 1.4 μL of copper (II) sulfate pentahydrate solution, 1.1 μL of 1 mM Azide Plus solution, and 5.5 μL of sodium ascorbate solution. Final concentrations: 50 mM Tris, 150 mM NaCl, 0.5 mM copper sulfate, 2 μM Azide Plus reagent, and 10 mM sodium ascorbate.
Note: The click reaction should be prepared in the order listed and used within 10 min of preparation. Total volume is sufficient to label one sample for flow cytometry or one 1 mm or 2 mm slice in a 24-well dish.
15. Vessel labeling antibody
To label blood vessels, we use anti-PECAM antibody that we conjugate to DyLight 650 in the lab according to the manufacturer’s protocol. The volume of the antibody stock is adjusted to 0.5 mg/mL with 10× PBS, DI H2O, and glycerol so that the final concentration is 1× PBS and 40% glycerol. The stock solution is stored at -20 °C. To label vessels, 40 μL of conjugated antibody stock is diluted into 100 μL of 1× PBS and injected retro-orbitally 30 min before euthanizing the animal.
Note: Several different fluorophores are available for conjugation. We found that far red fluorophores work well when imaging brain tissue, whereas green fluorophores often do not rise above background in brain tissue for widefield imaging, particularly with thicker samples (>0.5 mm). Alternatively, fluorophore-conjugated lectins could be used. We have had good success with tomato lectin.
16. 15% sucrose
For 100 mL of solution, mix 80 mL of DI H2O with 10 mL of 10× PBS and 5.76 g of sucrose. Adjust the pH to 7.5 (with 37% HCl or 5 N NaOH) and bring the final volume to 100 mL.
17. 30% sucrose
For 100 mL of solution, mix 80 mL of DI H2O with 10 mL of 10× PBS and 11.53 g of sucrose. Adjust the pH to 7.5 (with 37% HCl or 5 N NaOH) and bring the final volume to 100 mL.
Laboratory supplies
1. Magnetic stir bar
2. Brain matrix coronal block (World Precision Instruments, catalog number: RBMS-200C)
3. Coverslips (MatTek, catalog number: PCS-1.5-10)
4. Coverslip dish (MatTek, catalog number: P35G-1.5-10-C)
5. 15 mL tubes (Thermo Fisher, catalog number: 05-539-4)
6. 50 mL conical tubes (Thermo Fisher, catalog number: 339652)
7. 2 mL microcentrifuge tubes (Thermo Fisher, catalog number: 02-681-5)
8. Single-edged razor blades (World Precision Instruments, catalog number: BLADES-2)
9. Straight tip forceps (Sigma-Aldrich, catalog number: F4267)
10. Fine tip forceps (Henry Schein, catalog number: 19-3045)
11. Corneal spring scissors (World Precision Instruments, catalog number: WP2120R)
12. 1 mL syringe (Thermo Fisher, catalog number: 14-823-434)
13. 30 mL syringe (Thermo Fisher, catalog number: 14-823-16K)
14. 25 G needle tip (BD Biosciences, catalog number: 305125)
15. 0.2 μm filter (Sartorius, catalog number: 16532)
16. 70 μm cell strainer (Corning, catalog number: 352350)
17. 100 μm cell strainer (Corning, catalog number: CLS431752)
18. Flow cytometry tubes (Thermo Fisher, catalog number: 50-233-5738)
19. 12-well plate (Thermo Fisher, catalog number: 150200)
20. 24-well plate (Thermo Fisher, catalog number: 142275)
21. Dry ice
22. Superfrost Plus slides (Thermo Fisher, catalog number: 22-034979)
23. Tissue-Tek cryomolds (Sakura, catalog number: 4566)
Equipment
1. Centrifuge (Beckman Coulter, model: GS-6R)
2. Flow cytometer (BD Biosciences, model: LSRFortessa)
3. Widefield microscope (Nikon, model: Eclipse Ni-E)
4. UV cryostat (Leica, model: CM18-60)
Software and datasets
1. NIS Elements Advanced Research Imaging Software (Nikon, version 5.41.02)
2. FIJI image processing software (version 2.17.0)
3. FACSDiva software (BD Biosciences, version 9.0)
4. FlowJo (BD Biosciences, version 10.10), license required
Procedure
A. Intraperitoneal EdU injection
1. Prepare the EdU solution (see Recipes).
Caution: EdU is a suspected carcinogen and should be handled with care.
2. Inject the appropriate dose of EdU (depending on mouse weight) into the abdomen with the needle bevel facing up.
Note: Dosage was 50 mg per kilogram of body weight, e.g., 200 μL for a 20-g mouse. Previous studies have shown that maximal incorporation is reached by 50 mg/kg of EdU dosage [6]. EdU will only label bone marrow dividing at that time and is rapidly cleared (~30 min) [6–8]. To approach a more complete labeling of a population of leukocytes, mice can be injected several times with smaller doses over several hours to catch more cells in the S phase of the cell division cycle. For example, for neutrophils, we found that 100 μL of 5 mg/mL of EdU injected every 1.5 h for 6 total injections will effectively label ~100% of circulated neutrophils two days after the injections. Incorporation may vary depending on mouse age and strain. Therefore, blood leukocytes should be checked by flow cytometry to confirm EdU incorporation as outlined below.
B. Blood lysis for circulating cell collection
1. Coat a microcentrifuge tube with 50 μL of 100 mM EDTA.
2. Collect 10–100 μL of blood using standard methods (i.e., tail vein puncture, cheek bleed, cardiac puncture) and transfer to the coated tube.
Note: A minimum of 10 μL of blood should be collected in an EDTA-coated Eppendorf tube to ensure sufficient leukocyte numbers for analysis. 10 μL is sufficient for simple analysis of EdU incorporation levels.
3. Transfer blood into a 15 mL conical tube and add 2 mL of ACK lysing buffer to the tube, which lyses red blood cells, and incubate for 5 min at room temperature.
4. Add at least 10 mL of 1× PBS to the tube and centrifuge at 300× g for 10 min with the brake on at room temperature.
5. Aspirate the supernatant, leaving a small amount just above the cells at the bottom of the tube.
6. Repeat the lysis process and centrifugation until the red blood cells have been removed.
Note: Typically, 10 μL of blood will only need to undergo this process one time. Larger quantities of blood, such as 100 μL, may need to undergo lysis two or three times.
7. After aspiration, resuspend the cell pellet in 300 μL of FACS buffer (see Recipes) and transfer to a flow tube.
8. Centrifuge at 300× g for 5 min at room temperature.
9. See section C for staining samples for flow cytometry.
C. Detection of EdU using flow cytometry
1. Incubate the sample in 300 μL of FACS buffer with 1 μL of Fc blocking antibody for 10–20 min on ice.
2. Wash the sample one time (add 1 mL of FACS buffer per sample and centrifuge at 300× g for 5 min at 4 °C). Remove the supernatant.
3. Incubate cells in antibody cocktail (1 μL of CD45 antibody and 1 μL of CD11b antibody in 300 μL of FACS buffer, final concentration for each antibody is 0.67 μg/mL) for 20 min on ice and protected from light.
Note: The recipe will vary based on needs.
4. Repeat wash (step C2).
5. Wash cells once in PBS only at 300× g for 5 min. Remove the supernatant.
6. Incubate cells in live/dead stain (typically 0.5 μL of viability dye in 300 μL of PBS only per sample) for 10 min on ice and protected from light.
7. Repeat wash (step C2).
8. Resuspend cells in 350 μL of FACS buffer.
9. Fix samples by adding 350 μL of 4% formaldehyde (for a final concentration of 2%) and incubating at room temperature for 10 min.
10. Repeat wash (step C2).
11. Resuspend cells in 300 μL of 0.5% NP-40 in FACS buffer. Incubate at room temperature for 10 min.
12. Repeat wash (step C2).
13. Prepare the click reaction solution (see Recipes) fresh during the spin above.
14. Resuspend the samples in 0.5 mL of the click reaction solution and incubate at room temperature for 5 min.
15. Repeat wash (step C2).
16. If staining with antibodies containing PE is desired, it can be done now by repeating steps C3 and C4 above.
Note: For the best results, it may be necessary to block the sample with non-labeled rat and/or rabbit IgG to prevent binding of the antibodies from this round to the newly exposed intracellular epitopes.
17. Filter samples through a 70 μm cell strainer into a new flow tube for analysis. See Figure 1 for an example of cytometric analysis and gating strategies.
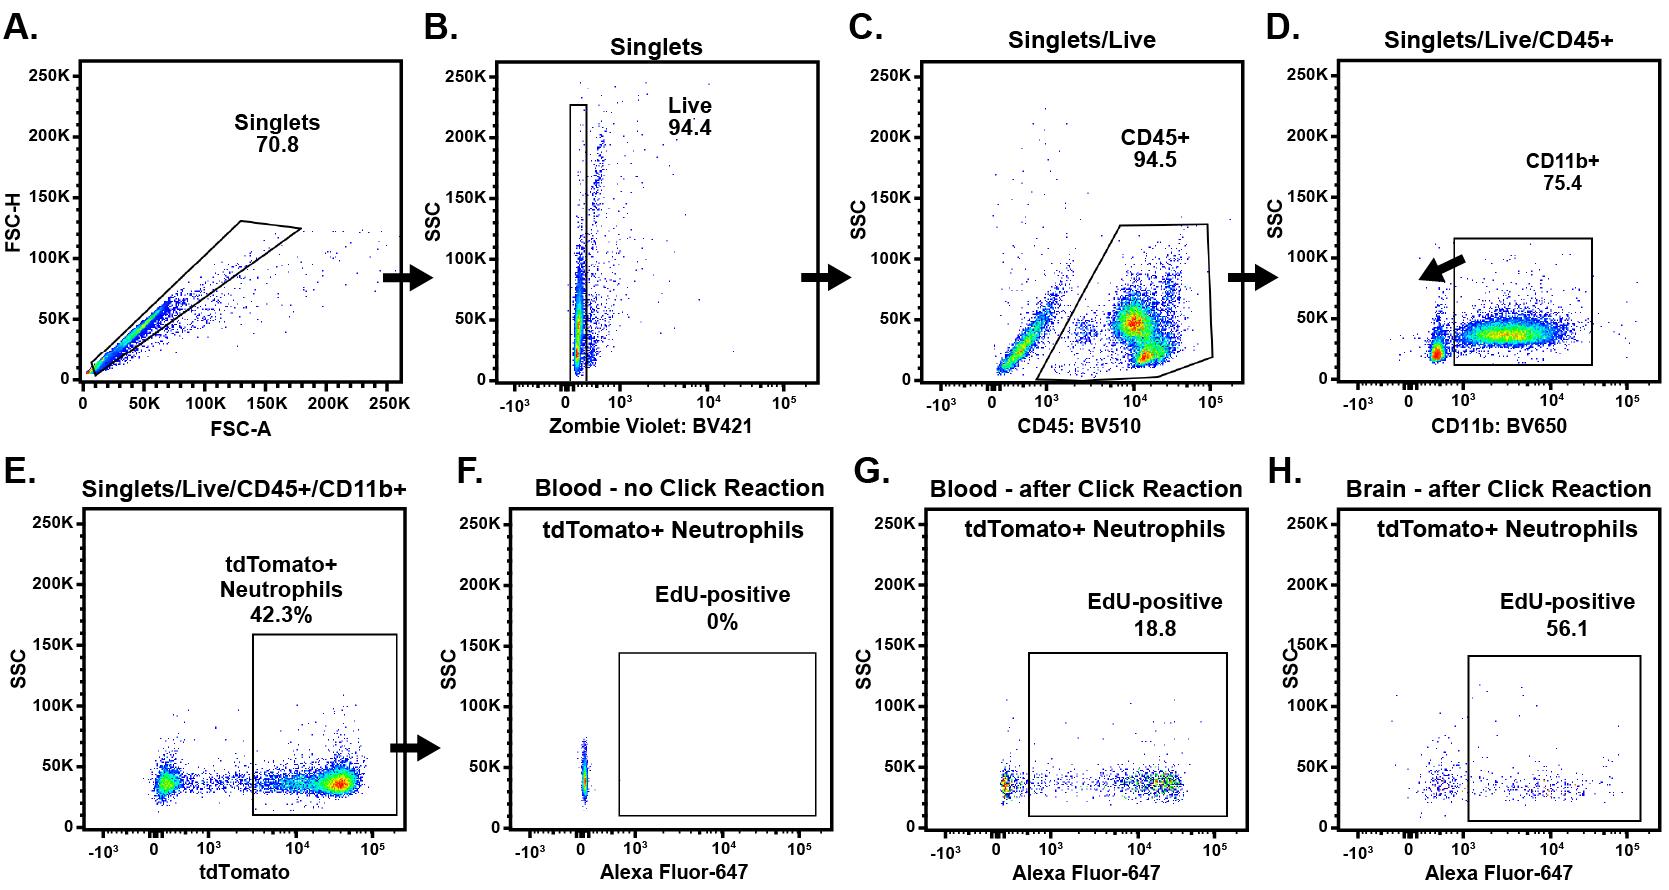
Figure 1. Analyzing EdU using flow cytometry. 50 mg/kg of EdU was injected i.p. one day before subjecting the mouse to transient middle cerebral artery occlusion (tMCAO) performed for 90 min [15]. After 24 h, the mouse was euthanized, and the brain was recovered and processed for EdU detection, as described above in sections C and F. The panels here show our typical gating strategy to identify neutrophils, which went sequentially from (A) FSC Area vs. Height for singlets, to (B) Zombie violet negative, (C) CD45 positive, (D) CD11b positive, and (E) tdTomato positive. EdU positivity in the neutrophil populations was determined using Alexa Fluor 647 fluorescence (F–H). If other cell types are of interest, the flow panel and gating strategy can be adjusted accordingly.
D. EdU detection in brain tissue slices by fluorescent microscopy imaging
1. Euthanize the mouse with CO2 in accordance with approved institutional animal care and euthanasia guidelines.
2. Place the mouse on its back and conduct a thoracotomy by using scissors to make an incision from the abdomen up to the neck.
3. Reflect the skin laterally to expose the thoracic cavity, being careful to avoid poking the heart.
4. Collect blood from the left ventricle, if desired.
5. For transcardial perfusion, make a small nick on the right atrium and perfuse the mouse with a syringe of 30 mL of cold PBS.
Note: Well-perfused mice will have a blanched liver. Poorly perfused mice may have leukocytes that will interfere with the determination of leukocyte position in relation to the blood vasculature.
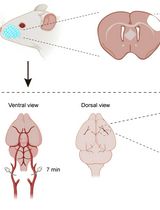
6. Place the animal ventral side down and pin the front limbs (Figure 2). Slice the skin over the cranium along the dorsal midline and pin it to the sides, exposing the cranium.
Note: Some researchers decapitate the mouse and remove the body to allow for more room to maneuver; however, that is not necessary.
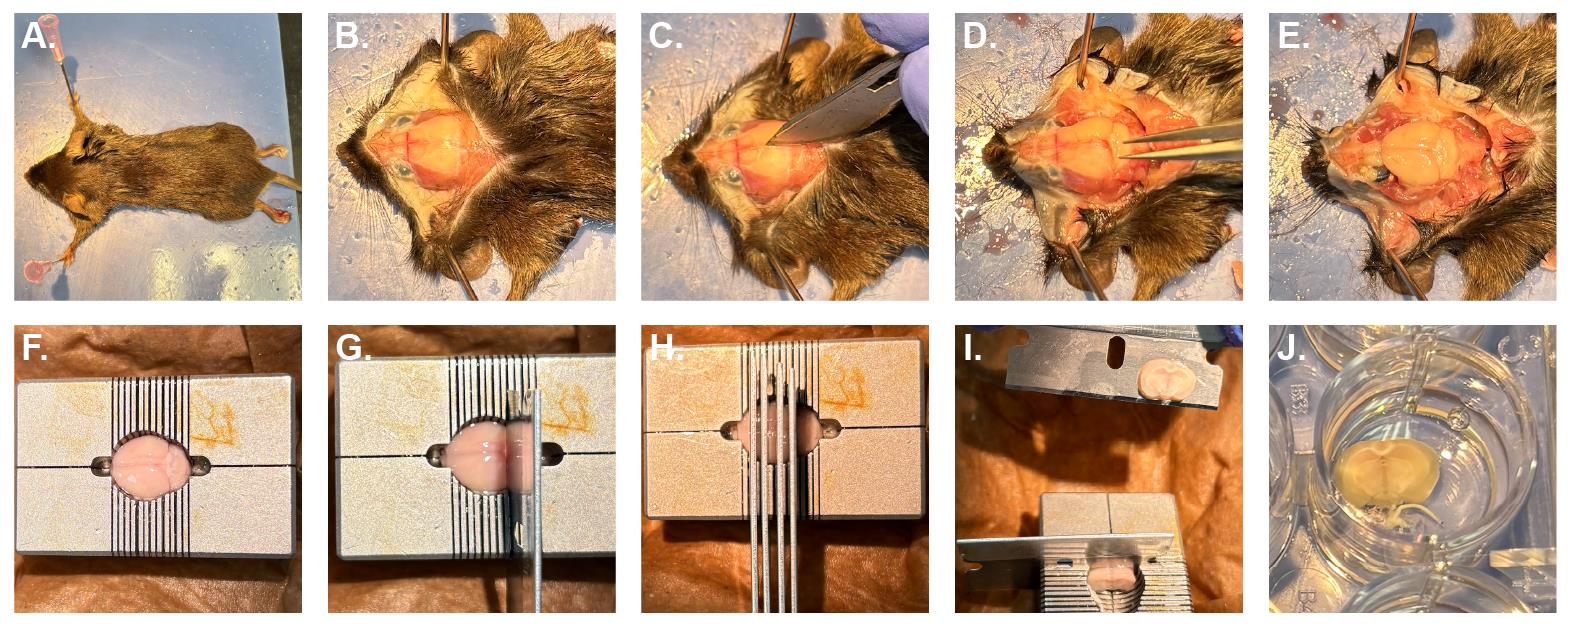
Figure 2. Removing and slicing the mouse brain. (A) Animals are placed on their ventral side and secured. (B) The skin over the cranium is cut along the dorsal midline and secured. (C) The cranium is scored and then gently removed with forceps (D) to expose the brain. After severing the spinal cord (E), the brain is transferred to the brain matrix block (F). Razor blades are placed at the desired thickness (G) and pressed down simultaneously (H). Sections are removed (I) and transferred to a 24-well plate (J) using forceps, a paintbrush, or a gentle stream of PBS.
7. Lightly score the skull along the midline with a razor blade without damaging the brain underneath.
8. Sever the spinal column below the brainstem and gently remove the cranium with forceps. Remove the brain, making sure that both hemispheres are together and intact.
9. Place the brain into the brain matrix slicing block and slice the brain into 1 or 2 mm sections using single-edged razor blades.
Notes:
1. Keep the brain matrix and razor blades on a paper towel over ice to cool the equipment. Rinse all equipment with chilled 1× PBS before using. To help maintain proper anatomy during slicing, place each razor blade in succession into the brain until it slightly engages the slots of the matrix. When all razor blades are in place, push down evenly on all of them at the same time.
2. At this point, samples could be processed instead for TTC staining (see section E) and/or flow cytometry (see section F).
10. Transfer slices to a well plate and cover each slice in 4% formaldehyde.
11. Incubate at room temperature for at least 30–60 min.
Note: Incubation times depend on the thickness of the brain intervals. Longer times may quench the fluorescence signal.
12. Transfer slices to new wells and wash with 1× PBS for 10 min × 3 times at room temperature.
13. Transfer slices to new wells and cover slices in permeabilization buffer (see Recipes).
14. Incubate slices in permeabilization buffer for at least 30 min at room temperature.
15. Transfer slices to new wells and wash with 1× PBS for 10 min × 3 times at room temperature.
16. Prepare the click reaction solution while the slices are washing.
17. Transfer slices to new wells and cover each slice in 500 μL of click reaction solution (see Recipes).
18. Incubate slices in click reaction solution for 5 min at room temperature.
19. Transfer slices to new wells and wash with 1× PBS for 10 min × 3 times at room temperature. Wash slices overnight at 4 °C.
20. Place the brain slice on a coverslip dish and add a drop of PBS to create a seal between the brain and coverslip.
21. Mount the sample on the microscope and image it using fluorescence microscopy (Figures 3 and 4).
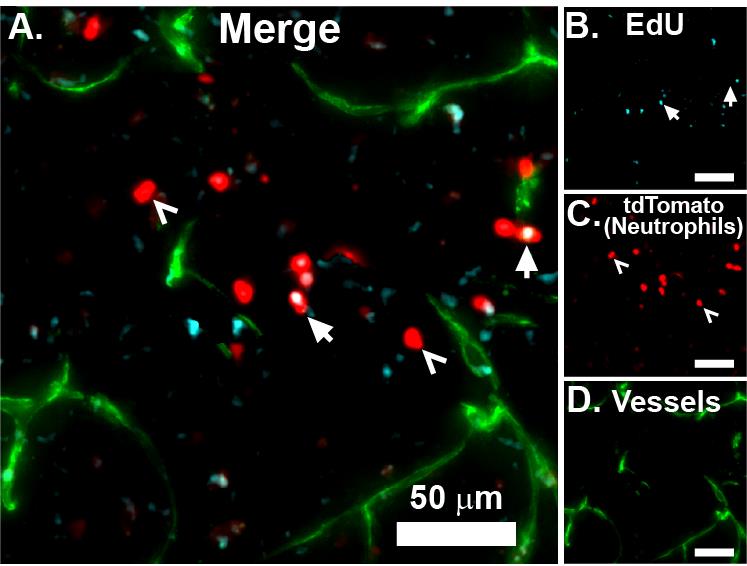
Figure 3. Imaging EdU with widefield microscopy. EdU was injected i.p. one day before subjecting the mouse to transient middle cerebral artery occlusion (tMCAO) surgery. After 24 h, the mouse was euthanized and the brain recovered, sliced into 1 mm sections, fixed, embedded in optimal cutting temperature (OCT) media, and snap frozen on dry ice. Coronal slices (25 μm) were acquired with a cryostat and mounted on Superfrost Plus slides. Tissue was processed for EdU detection as described above and imaged using widefield microscopy at 10× magnification (A). Insets show individual channels for EdU (B, cyan), tdTomato (C, red), and vessels (D, green). Arrows indicate EdU-positive neutrophils, and open arrowheads indicate EdU-negative neutrophils. Widefield image acquisition on 1 or 2 mm sections is straightforward, making it possible to capture the entire brain cross-sections at 10× or even 20×. These image series can be stitched together using a number of free or commercial software programs. We prefer NIS Elements and FIJI. All scale bars are 50 µm.
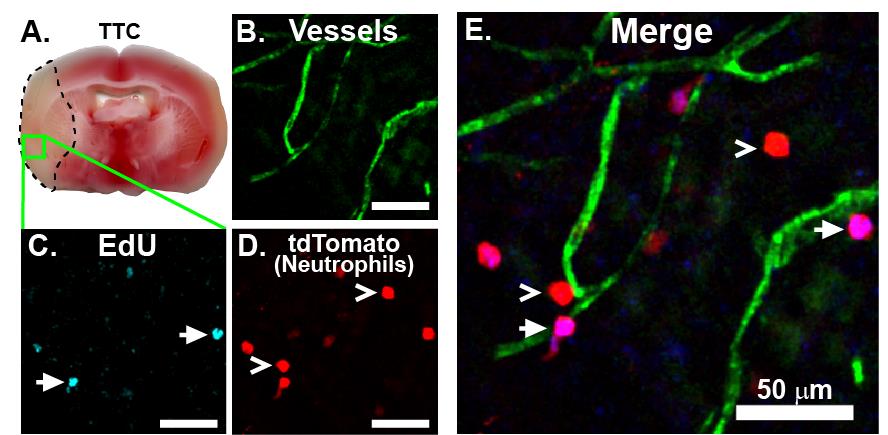
Figure 4. Imaging EdU with confocal microscopy. EdU was injected i.p. one day before subjecting the mouse to transient middle cerebral artery occlusion (tMCAO) surgery. After 24 h, 50 μg of PECAM-labeling antibody was injected retro-orbitally. The mouse was sacrificed 30 min later, and the brain was recovered, sliced into 1 mm sections, stained with TTC (A), and fixed and processed for EdU detection as described above. The entire 1 mm slice was mounted in a coverslip dish and imaged with confocal microscopy for vessels (B, green), EdU (C, cyan), and tdTomato (D, red), shown merged in (E). EdU-labeled Catchup neutrophils readily infiltrate into the infarcted brain and can be easily distinguished from non-labeled Catchup neutrophils. Arrows indicate EdU-positive neutrophils, and open arrowheads indicate EdU-negative neutrophils. For visualization using a different Azide Plus fluorophore combination, please see [13] https://pubmed.ncbi.nlm.nih.gov/40260638/. All scale bars are 50 µm.
E. TTC staining
1. Prepare a well plate with 0.5 mL of 2% TTC (see Recipes) per well, depending on the number of brain slices.
2. Place each slice into its corresponding well and let it sit for 7–10 min at room temperature.
3. Flip slices and let them sit for 5 min or until desired redness is achieved.
4. Add 1× PBS to new wells and transfer slices to wash for 1 min.
Note: If desired, slices can be imaged now and then processed further for flow cytometry (see section F).
5. Transfer slices to new wells with 4% formaldehyde (see Recipes) for fixation.
Note: For 1 or 2 mm slices, 30–60 min is sufficient for fixation. Prolonging incubation can reduce the fluorescence of some fluorescent proteins.
6. Transfer slices to 1× PBS and image (Figure 3A).
F. Processing brain tissue for flow cytometry
1. Add 300 μL of Accutase to a microcentrifuge tube and add the brain hemisphere.
Note: We typically only process the ischemic hemisphere (i.e., half of the brain). Quantities should be adjusted if processing both hemispheres (i.e., the whole brain) or pooling multiple brains. Keep on ice during this process, except where noted.
2. Finely mince the brain with scissors.
3. Transfer to a 15 mL conical tube using a 1 mL pipette with the tip cut off.
4. Wash the microcentrifuge tube with 1 mL of Accutase and add it to the 15 mL conical tube.
5. Incubate the 1.3 mL of Accutase for 30 min at 37 °C. At 15 min, pipette up and down with a 1 mL pipette to help with digestion.
6. After 30 min of incubation, place the samples on ice and add 100 μL of HBSS +5% FBS to each sample.
7. Transfer the sample to a 100-μm mesh strainer on top of a 50 mL conical tube. Keep on ice.
8. Grind and push the tissue through the mesh using the blunt end of a 1 mL syringe plunger.
9. Wash the strainer twice with 10 mL of HBSS +5% FBS each time.
10. Centrifuge the tube at 300× g for 10 min at 4 °C.
11. Resuspend the pellet in 5 mL of 40% Percoll and transfer to a 15 mL conical tube. Keep on ice.
12. Centrifuge tube at 650× g for 25 min with no brake at 4 °C.
13. Remove the myelin layer and supernatant on top by aspiration.
14. Resuspend cells in the pellet in 300 μL of FACS buffer and transfer to a flow tube.
15. Wash once at 300× g for 5 min at 4 °C.
16. Continue processing samples for flow cytometry as detailed in section C.
G. Preparing thin (<50 μm) coronal sections using a cryostat
1. Transfer the fixed 1 or 2 mm sections to 1 mL of 15% sucrose in a 24-well plate.
2. Incubate the sample in a refrigerator at 4 °C until the sample sinks (usually 8–12 h).
3. Transfer the slice to a new well with 30% sucrose.
4. Incubate the sample in a refrigerator at 4 °C until the sample sinks (usually overnight).
5. Add enough OCT compound to a cryomold to cover the bottom.
6. Add the thick coronal section to the cryomold so that it is parallel to the bottom of the mold.
7. Cover the section with additional OCT compound, taking care to avoid bubbles.
8. Transfer the mold and brain to dry ice, placing it on a piece large enough that the base of the mold makes full contact.
9. Allow the sample and OCT to freeze completely.
10. Transfer the sample to a sealed container (i.e., a bag or tube) in a -20 °C freezer for longer-term storage.
Note: Samples will slowly desiccate, so it is best to process them for cryosectioning within a week.
11. Transfer the molds with the samples to the cryostat chamber and allow them to equilibrate for >30 min.
12. Remove the block from the mold and mount it to the pedestal.
13. Section the sample according to the manufacturer’s instructions for mouse brains (i.e., we found that acceptable slices with minimal rolling could be produced with the cryostat set to 18 °C with a blade angle of 5° and a section thickness of 25 μm).
14. Sections are mounted onto Superfrost Plus microscope slides.
15. If coronal sections were stained for EdU before freezing, they can be covered with mounting media and a coverslip immediately.
Note: Sections cut from deeper in the sample (>100 μm from the surface) will have reduced EdU signal. The click reaction can be performed on these sections directly on the slide. Simply perform section D, starting at step 13, on the slide, but with reduced volumes. Typically, the volume needed for one section is ~100 μL for all washes and buffers.
Data analysis
Data collected using flow cytometry should be processed and analyzed with the appropriate controls for compensation and fluorescence-minus-one samples. EdU signal and gating should be determined by comparing EdU-labeled samples to samples not injected with EdU (but the sample was processed identically), as well as samples where the click reaction was omitted. The click reaction will mute the signal from genetically encoded fluorophores, and gates should be adjusted accordingly. Similarly, for fluorescence microscopy, samples should be analyzed alongside replicates collected from animals not injected with EdU, as well as samples that did not undergo the click reaction. For all methods, the fluorescence intensity of fluorescent proteins will be reduced and, as such, should be quantified before (or without) the click reaction. After the click reaction, fluorescent proteins may have reduced fluorescence but should still be fluorescent enough to identify positive populations using fluorescence microscopy and flow cytometry, at least for tdTomato (described here) and eGFP [13]. Researchers may need training in flow cytometry and image analysis software and methods to fully interpret their data.
Validation of protocol
This protocol has been used and validated in the following research article:
• Arias et al. [13]. EdU tracking of leukocyte recruitment in mouse models of ischemic stroke and sterile lung inflammation. https://doi.org/10.1242/jcs.263835.
General notes and troubleshooting
General notes
1. EdU injection can be timed either before or after experimental manipulation, depending on the specific objectives of the study.
2. The timing of EdU appearance in leukocytes in the bloodstream (or other cell populations) may be affected by the experimental treatment and should be determined experimentally.
3. Different azide-conjugated fluorophores may be more or less suitable for different applications. For example, we found that the azide conjugated to green fluorophores was not bright enough to be easily observed above background brain autofluorescence. Researchers should consider their available microscope filter sets, cytometer laser/detector combinations, and the inherent quantum yield of a fluorophore when designing their experiment.
4. Because all terminal alkynes (like those contained in PE and PE-tandem dyes) can react with the azide during the click reaction, researchers should either omit them from their cytometry panel or stain for them after the click reaction (see section C).
Troubleshooting
Problem 1: High background in the azide channel.
Possible cause: Insufficient washes following the click reaction solution incubation.
Solutions: Increase the number and/or time of washes; use a different azide-fluorophore conjugate.
Problem 2: No azide signal.
Possible causes: Poor incorporation of EdU into dividing cells; reagents were added incorrectly when making the click reaction solution; sample incubation time in the click reaction was insufficient.
Solutions: Increase the number of EdU injections; change the injection or stimulus timing; make the click reaction solution in the correct order; increase the click reaction incubation time.
Problem 3: Weak genetic fluorescence.
Possible causes: Cells are overfixed; cells were incubated in the click reaction solution for too long.
Solution: Reduce the incubation time in 4% formaldehyde; reduce the incubation time in the click reaction solution.
Problem 4: Weak signal from PE/PE-tandem fluorophores.
Possible causes: Cells were incubated in PE/PE-tandem fluorophore-conjugated antibodies prior to click reaction solution incubation; insufficient washes following the click reaction solution incubation prior to incubation in PE/PE-tandem fluorophore-conjugated antibodies.
Solution: Incubate cells in PE/PE-tandem fluorophore-conjugated antibodies after the click reaction solution; increase washes following the click reaction solution incubation.
Acknowledgments
The specific contributions of each author were: Conceptualization, A.B. and D.P.S.; Investigation, Z.K.L., E.A., A.B., and D.P.S.; Writing—Original Draft, Z.K.L. and D.P.S.; Writing, Review, & Editing, Z.K.L., D.P.S., and A.B.; Funding acquisition, A.B. and D.P.S.; Supervision, A.B. and D.P.S. This work was supported by the National Institutes of Health (NS130939 to E.A. and AG086751 to A.B. and D.P.S.) Imaging work was supported in part at the Northwestern University Center for Advanced Microscopy (RRID: SCR_020996), which is generously supported by the CCSG P30 CA060553 grant awarded to the Robert H. Lurie Comprehensive Cancer Center. The original research paper [13] in which the protocol was described and validated can be found here: https://pubmed.ncbi.nlm.nih.gov/40260638/.
Competing interests
The authors declare no conflicts of interest.
Ethical considerations
All experiments with animals were performed using protocols approved by Northwestern University’s Institutional Animal Care and Use Committee [Public Health Service (PHS) assurance number A328301]. Mice were housed in the institute’s animal facility managed by the Center for Comparative Medicine and were maintained according to standard AAALAC methods.
References
- Dolbeare, F. (1995). Bromodeoxyuridine: a diagnostic tool in biology and medicine, Part I: Historical perspectives, histochemical methods and cell kinetics. Histochem J. 27(5): 339–369. https://doi.org/10.1007/bf02389022
- Salic, A. and Mitchison, T. J. (2008). A chemical method for fast and sensitive detection of DNA synthesis in vivo. Proc Natl Acad Sci USA. 105(7): 2415–2420. https://doi.org/10.1073/pnas.0712168105
- Uttamapinant, C., Tangpeerachaikul, A., Grecian, S., Clarke, S., Singh, U., Slade, P., Gee, K. R. and Ting, A. Y. (2012). Fast, cell-compatible click chemistry with copper-chelating azides for biomolecular labeling. Angew Chem Int Ed Engl. 51(24): 5852–5856. https://doi.org/10.1002/anie.201108181
- Flomerfelt, F. A. and Gress, R. E. (2016). Analysis of Cell Proliferation and Homeostasis Using EdU Labeling. Methods Mol Biol. 1323: 211–220. https://doi.org/10.1007/978-1-4939-2809-5_18
- Mead, T. J. and Lefebvre, V. (2014). Proliferation assays (BrdU and EdU) on skeletal tissue sections. Methods Mol Biol. 1130: 233–243. https://doi.org/10.1007/978-1-62703-989-5_17
- Cappella, P., Gasparri, F., Pulici, M. and Moll, J. (2008). A novel method based on click chemistry, which overcomes limitations of cell cycle analysis by classical determination of BrdU incorporation, allowing multiplex antibody staining. Cytometry A. 73(7): 626–636. https://doi.org/10.1002/cyto.a.20582
- Cheraghali, A. M., Morin, K. W., Kumar, R., Knaus, E. E. and Wiebe, L. I. (1995). Accumulation of 5-ethyl-2'-deoxyuridine and its 5,6-dihydro prodrugs in murine lung and its potential clinical application. J Pharm Pharmacol. 47(7): 595–600. https://doi.org/10.1111/j.2042-7158.1995.tb06721.x
- Miller, M. W. and Nowakowski, R. S. (1988). Use of bromodeoxyuridine-immunohistochemistry to examine the proliferation, migration and time of origin of cells in the central nervous system. Brain Res. 457(1): 44–52. https://doi.org/10.1016/0006-8993(88)90055-8
- Bradford, J. A. and Clarke, S. T. (2011). Dual‐Pulse Labeling Using 5‐Ethynyl‐2′‐Deoxyuridine (EdU) and 5‐Bromo‐2′‐Deoxyuridine (BrdU) in Flow Cytometry. Curr Protoc Cytom. 55(1): ecy0738s55. https://doi.org/10.1002/0471142956.cy0738s55
- Diermeier-Daucher, S., Clarke, S. T., Hill, D., Vollmann-Zwerenz, A., Bradford, J. A. and Brockhoff, G. (2009). Cell type specific applicability of 5-ethynyl-2'-deoxyuridine (EdU) for dynamic proliferation assessment in flow cytometry. Cytometry A. 75(6): 535–546. https://doi.org/10.1002/cyto.a.20712
- Li, F., Piattini, F., Pohlmeier, L., Feng, Q., Rehrauer, H. and Kopf, M. (2022). Monocyte-derived alveolar macrophages autonomously determine severe outcome of respiratory viral infection. Sci Immunol. 7(73): eabj5761. https://doi.org/10.1126/sciimmunol.abj5761
- Lechner, A. J., Driver, I. H., Lee, J., Conroy, C. M., Nagle, A., Locksley, R. M. and Rock, J. R. (2017). Recruited Monocytes and Type 2 Immunity Promote Lung Regeneration following Pneumonectomy. Cell Stem Cell. 21(1): 120–134 e127. https://doi.org/10.1016/j.stem.2017.03.024
- Arias, E., Haynes, M. E., Nadkarni, N. A., Lipfert, Z. K., Muller, W. A., Batra, A. and Sullivan, D. P. (2025). EdU tracking of leukocyte recruitment in mouse models of ischemic stroke and sterile lung inflammation. J Cell Sci. 138(8): jcs263835. https://doi.org/10.1242/jcs.263835
- Hasenberg, A., Hasenberg, M., Mann, L., Neumann, F., Borkenstein, L., Stecher, M., Kraus, A., Engel, D. R., Klingberg, A., Seddigh, P., et al. (2015). Catchup: a mouse model for imaging-based tracking and modulation of neutrophil granulocytes. Nat Methods. 12(5): 445–452. https://doi.org/10.1038/nmeth.3322
- Nadkarni, N. A., Arias, E., Fang, R., Haynes, M. E., Zhang, H. F., Muller, W. A., Batra, A. and Sullivan, D. P. (2022). Platelet Endothelial Cell Adhesion Molecule (PECAM/CD31) Blockade Modulates Neutrophil Recruitment Patterns and Reduces Infarct Size in Experimental Ischemic Stroke. Am J Pathol. 192(11): 1619–1632. https://doi.org/10.1016/j.ajpath.2022.07.008
Article Information
Publication history
Received: Sep 9, 2025
Accepted: Oct 30, 2025
Available online: Nov 11, 2025
Published: Dec 5, 2025
Copyright
© 2025 The Author(s); This is an open access article under the CC BY-NC license (https://creativecommons.org/licenses/by-nc/4.0/).
How to cite
Lipfert, Z. K., Arias, E., Batra, A. and Sullivan, D. P. (2025). Utilizing EdU to Track Leukocyte Recruitment to the Brain. Bio-protocol 15(23): e5527. DOI: 10.21769/BioProtoc.5527.
Category
Immunology > Immune cell function > Neutrophil
Cell Biology > Cell movement > Cell migration
Neuroscience > Nervous system disorders > Stroke
Do you have any questions about this protocol?
Post your question to gather feedback from the community. We will also invite the authors of this article to respond.