- Protocols

- Articles and Issues
- For Authors
- About
- Become a Reviewer

A Comparative Protocol for Preserving Deep-Water Marine Invertebrate Tissues: DNA/RNA Shield vs. Liquid Nitrogen for Dual Extraction of High-Quality Nucleic Acids
Published: Vol 15, Iss 22, Nov 20, 2025 DOI: 10.21769/BioProtoc.5521 Views: 1637
Reviewed by: Alba BlesaKirsten A. CoprenAnonymous reviewer(s)
Original research article
The authors used this protocol in:
Oct 2021

Protocol Collections
Comprehensive collections of detailed, peer-reviewed protocols focusing on specific topics


Related protocols
Abstract
Preserving biological samples in the field is essential for ensuring high-quality nucleic acid extraction and reliable downstream molecular analyses. Broadly, two main preservation strategies are available: physical preservation, such as flash freezing in liquid nitrogen, which halts enzymatic activity by rapid cooling, and chemical preservation, using stabilizing reagents that inactivate nucleases and protect nucleic acids even at ambient temperatures. This protocol presents a comparative approach using liquid nitrogen and a commercial stabilizing reagent (DNA/RNA Shield, Zymo Research) to preserve tissue from five marine invertebrate species: two cold-water corals, two sponges, and one bivalve. Samples preserved by each method were processed with the AllPrep DNA/RNA Mini kit (Qiagen) to extract both RNA and DNA. RNA quality was assessed using RNA Integrity Number (RIN) scores. The stabilizing reagent preserved high-quality RNA in sponge and bivalve samples but did not prevent RNA degradation in coral tissues, which showed lower RIN scores compared to those preserved in liquid nitrogen. DNA yields were also consistently lower in tissues preserved with DNA/RNA Shield across all species. These findings suggest that DNA/RNA Shield can be a viable alternative to liquid nitrogen for some marine invertebrates, particularly in field conditions where cryopreservation is impractical. However, for cold-water corals, liquid nitrogen remains essential to ensure RNA integrity for transcriptomic analyses and other sensitive molecular applications (e.g., RT-qPCR).
Key features
• Comparative evaluation of preservation methods across five marine invertebrate species.
• Liquid nitrogen is essential for maintaining high RNA integrity in cold-water corals, whereas DNA/RNA Shield effectively preserved RNA in sponges and bivalves.
• Streamlined co-extraction protocol using the AllPrep DNA/RNA Mini Kit (Qiagen) enables reliable recovery of DNA and RNA from field-collected marine samples for downstream molecular applications.
• Integrated quality control workflow (Qubit, Nanodrop, Bioanalyzer RIN) ensuring robust assessment of nucleic acid yield and integrity for downstream molecular applications.
Keywords: RNA preservationGraphical overview
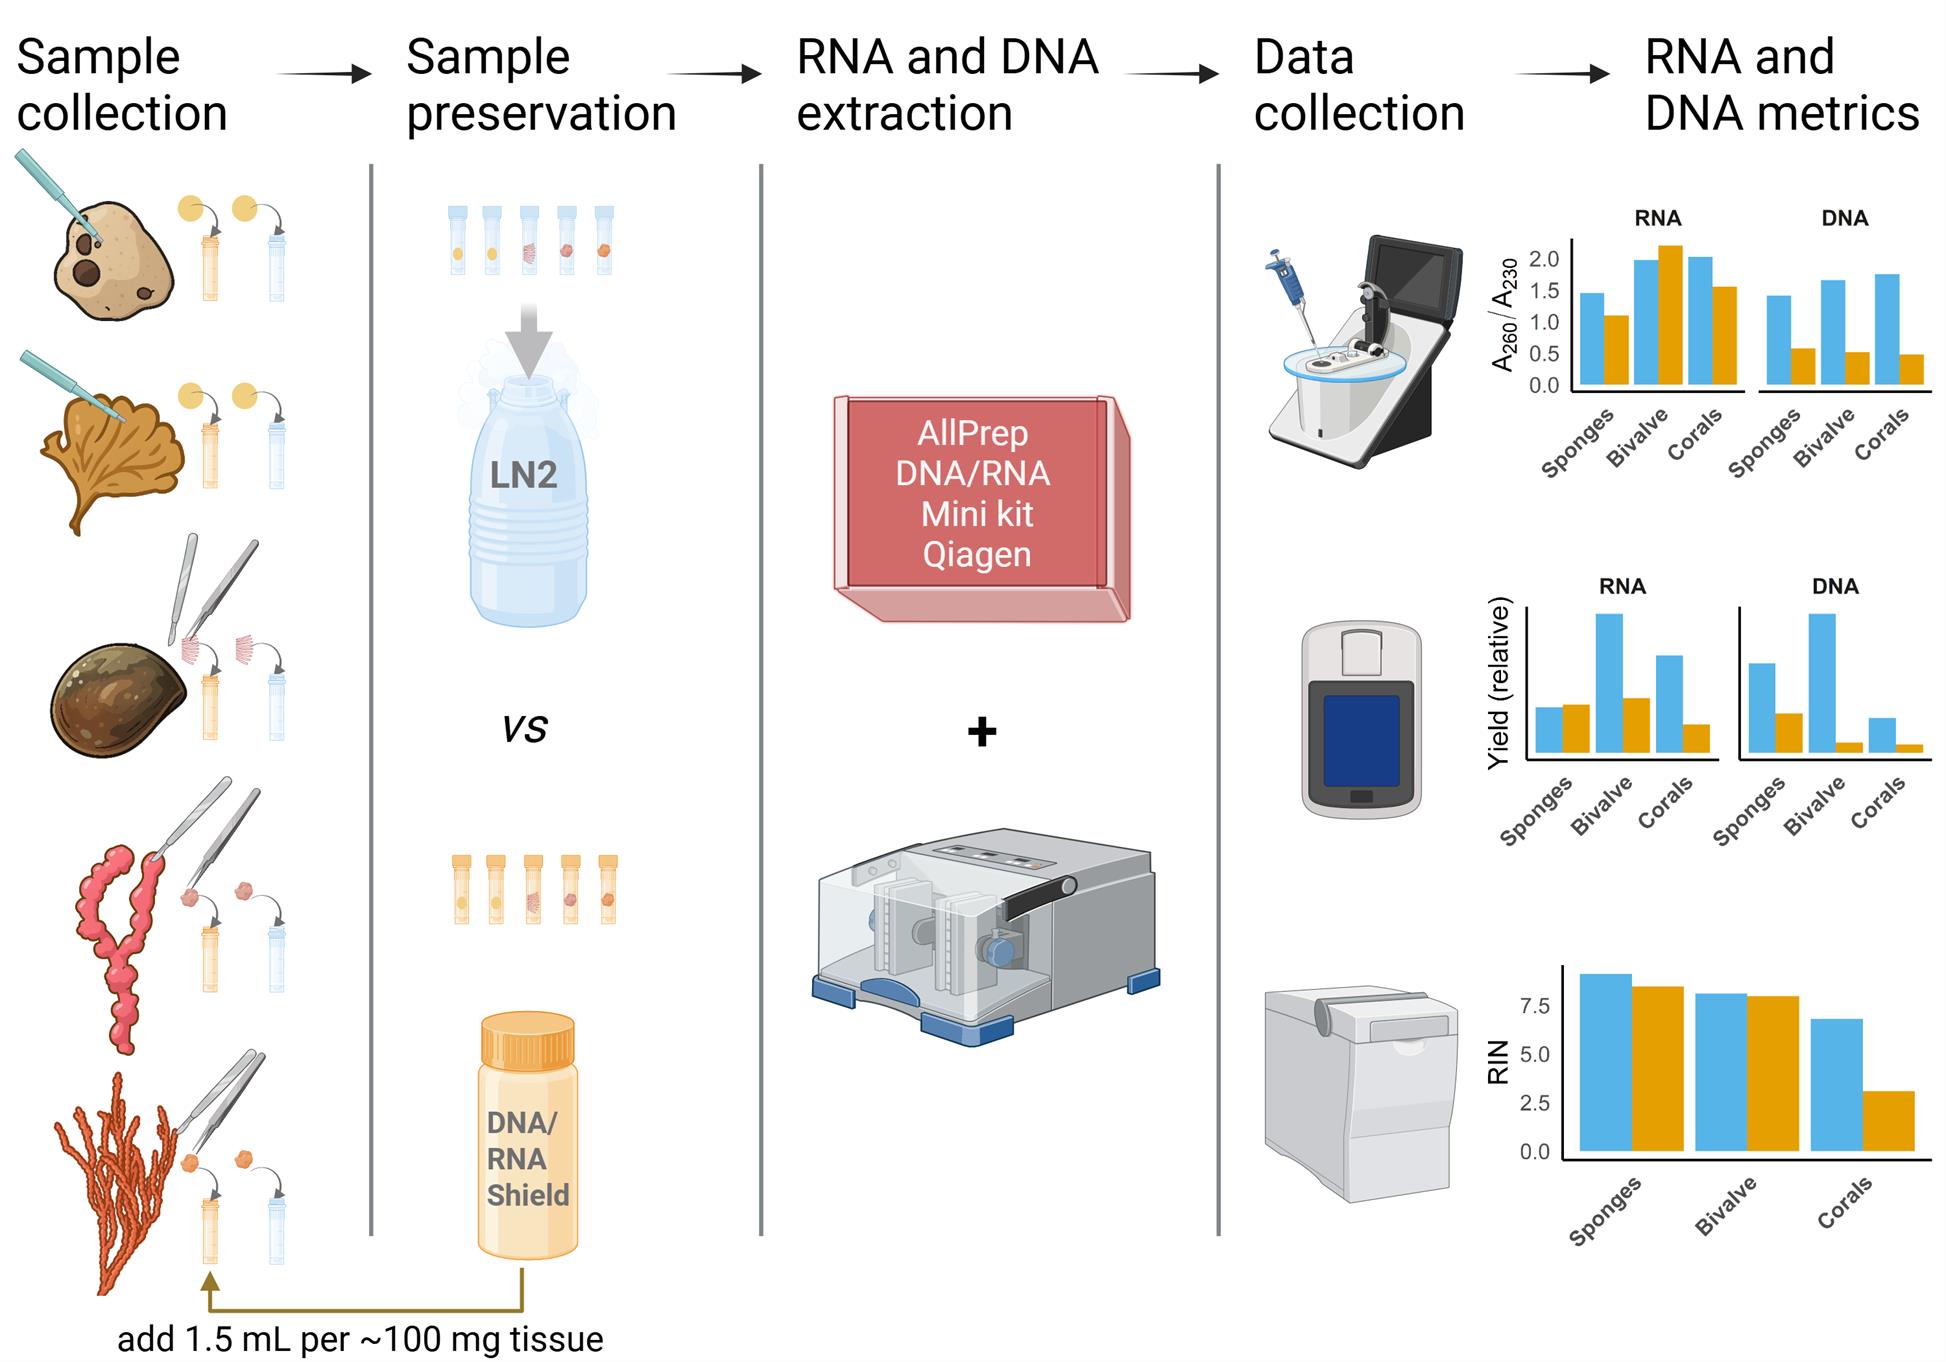
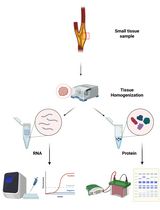
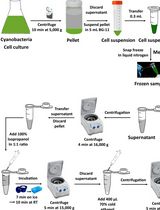
Graphical overview of sample preservation, RNA and DNA co-extraction, and quality assessment protocol for marine invertebrates. Blue indicates samples preserved in liquid nitrogen (LN2); orange indicates samples preserved in DNA/RNA Shield (Zymo Research). Species illustrations were created using ChatGPT based on photos taken by the authors. The graphical abstract was created using https://BioRender.com.
Background
High-quality DNA and RNA are essential for modern molecular applications in ecology, physiology, and environmental monitoring. In marine invertebrate research, particularly involving non-model species such as cold-water corals, sponges, and bivalves, obtaining intact nucleic acids is often complicated by remote sampling locations, tissue heterogeneity, and logistical challenges during field preservation. RNA is particularly unstable and prone to degradation [1], making its preservation a critical step for maintaining its integrity.
Traditionally, flash freezing in liquid nitrogen has been the gold standard for preserving DNA and RNA (see, for example, [2–4]). However, the use of liquid nitrogen is often impractical or hazardous in field settings due to transportation restrictions and the requirement for specialized containers and storage infrastructure. Furthermore, -80 °C storage is frequently unavailable during transit between field sites and centralized research laboratories, and storage or evaporation issues on long trips can further compromise sample integrity. Thus, chemical preservation agents such as DNA/RNA Shield (Zymo Research) offer a more field-adaptable alternative. This reagent stabilizes both DNA and RNA at ambient temperature while simultaneously inactivating nucleases. Prior studies have demonstrated its effectiveness in microbial 16S rRNA gene studies and for preserving RNA in various marine invertebrates [5,6]; however, comparative evaluations of its performance for dual RNA and DNA extraction in diverse marine invertebrates remain limited.
In this study, we evaluated the performance of DNA/RNA Shield in the preservation of nucleic acids relative to liquid nitrogen across five marine invertebrate species, using the AllPrep DNA/RNA Mini kit (Qiagen) for co-extraction. The species are native to the Norwegian coast and include two sponges, Geodia barretti and Phakellia ventilabrum, two soft corals, Paragorgia arborea and Primnoa resedaeformis, and one bivalve, Acesta excavata. These species were selected to represent a diversity of tissue types, structural complexity, and ecological roles. Additionally, all are slow-growing and vulnerable, making them susceptible to human impacts such as bottom trawling and habitat degradation, and therefore important targets for monitoring. RNA integrity and DNA/RNA yield were assessed to identify species-specific preservation outcomes and to determine the feasibility of chemical preservation for multi-taxon molecular sampling. This protocol provides a practical framework for researchers conducting nucleic acid extractions from marine invertebrate tissues in field-limited or remote conditions.
Materials and reagents
Biological materials
Three samples per species (Geodia barretti, Phakellia ventilabrum, Paragorgia arborea, Primnoa resedaeformis, and Acesta excavata) were collected by a remotely operated vehicle (ROV) at a depth range of 115–450 m in the Norwegian coast of Norland and Møre & Romsdal in September 2023 (see Supplementary Information Dataset S1 for sample coordinates and Dataset S2 for examples of species/tissue samples).
Reagents
1. Liquid nitrogen
2. DNA/RNA Shield (Zymo Research, catalog number: R1100–250)
3. Dry ice
4. Commercial bleach (Orkla HPC, Norway)
5. RNaseZap RNase decontamination solution (Invitrogen, catalog number: AM9780)
6. DNA AWAY surface decontaminant (Thermo Scientific, catalog number: 7010)
7. UltraPure DNase/RNase-free distilled water (Invitrogen, catalog number: 10977–035)
8. 14.3 M 2-mercaptoethanol (Merck, catalog number: M6250–250ML)
9. 96% Ethanol (VWR, catalog number: 20824.365)
10. AllPrep DNA/RNA Mini kit (Qiagen, catalog number: 80204)
11. Qubit dsDNA Quantification BR (Invitrogen, catalog number: Q32850)
12. Qubit RNA Quantification BR (Invitrogen, catalog number: Q10210)
13. Bioanalyzer RNA 6000 Nano assay (Agilent Technologies, catalog number: 5067-1511)
Solutions
1. 10% bleach solution (see Recipes)
2. 50% bleach solution (see Recipes)
3. 70% ethanol (see Recipes)
Recipes
1. 10% bleach solution
To prepare 200 mL of 10% bleach, add 20 mL of commercial bleach solution to 180 mL of distilled water.
2. 50% bleach solution
To prepare 50 mL of 50% bleach in a 50 mL Falcon tube, mix 25 mL of commercial bleach solution with 25 mL of distilled water. The solution should be prepared fresh daily, and more frequently (2–3 times per day) if needed.
3. 70% ethanol
To prepare 50 mL of 70% ethanol in a 50 mL Falcon tube, mix 36 mL of 96% ethanol with 14 mL of UltraPure DNase/RNase-free distilled water.
Laboratory supplies
1. Disposable gloves
2. Unicore punch kit 6.00 mm (Merck, catalog number: WHAWB100082)
3. Scalpel blades No. 11 (Swann-Morton, catalog number: 0303)
4. CryoPure tubes 2 mL (Sarstedt, catalog number: 72.379)
5. Stainless steel beads 5 mm (Qiagen, catalog number: 69989)
6. Screw cap micro tubes 2 mL sterile (Sarstedt, catalog number: 72.694.005)
7. Weighing boats, sterile (VWR, catalog number: 611-5272)
8. 10 μL pipette tips (VWR, catalog number: 732-3631)
9. 100 μL pipette tips (VWR, catalog number: 732-3633)
10. 200 μL pipette tips (VWR, catalog number: 732-3634)
11. 1,000 μL pipette tips (VWR, catalog number: 732-3637)
12. Collection tubes 2 mL (Qiagen, catalog number: 19201)
13. Qubit assay tubes (Invitrogen, catalog number: Q32856)
14. Lens paper (Hecht Glaswarenfabrik GmbH & Co KG, catalog number: 41019010)
15. PCR tubes 0.2 mL (VWR, catalog number: 732-0548)
16. Falcon 50 mL conical centrifuge tubes (Fisher Scientific, catalog number: 10203001)
17. Falcon 15 mL conical centrifuge tubes (Fisher Scientific, catalog number: 11507411)
Equipment
1. Cryogenic GT26 Dewar (Air Liquide, catalog number: GT26-1)
2. Forceps (Fine Science Tools, catalog number: 00632-11)
3. Scalpel handle No. 3 (Fine Science Tools, catalog number: 10003-12)
4. Plastic cutting boards (standard kitchen cutting boards)
5. Centrifuges (Fisher scientific accuSpi Micro 17 Microcentrifuge, catalog number: 13-100-675 and Eppendorf MiniSpin plus, catalog number: 5453000015)
6. Fume hood (Labflex, model: 625)
7. Ice machine (Migel ice line, model: KF85)
8. TissueLyser II homogenizer (Qiagen, catalog number: 85300)*
9. TissueLyser Adapter Set 2 × 24 (Qiagen, catalog number: 69982)
10. Nanodrop One spectrophotometer (Thermo Fisher, catalog number: ND-ONE-W)
11. Qubit 2.0 fluorometer (Invitrogen, catalog number: Q32866)
12. Vortex-Genie2 (Scientific Industries, Inc., model: SI-0256)
13. Prime Thermal Cycler (Bibby Scientific, catalog number: 3PRIMEX/02)
14. Agilent 2100 Bioanalyzer (Agilent, catalog number: G2938C)*
15. Chip Priming Station (Agilent, catalog number: 5065-4401)
16. MS2 S8 minishaker (IKA Works Inc.)*
17. Freezer able to maintain -80 °C
18. Fridge able to maintain 4 °C
19. Micropipette P2, Eppendorf Research plus (Eppendorf, catalog number: 3123000012)
20. Micropipette P10, Eppendorf Research Plus (Eppendorf, catalog number: 3123000020)
21. Micropipette P20, Eppendorf Research Plus (Eppendorf, catalog number: 3123000039)
22. Micropipette P100, Eppendorf Research Plus (Eppendorf, catalog number: 3123000047)
23. Micropipette P200, Eppendorf Research Plus (Eppendorf, catalog number: 3123000055)
24. Micropipette P1000, Eppendorf Research Plus (Eppendorf, catalog number: 3123000063)
25. Wash bottle 500 mL (VWR, catalog number: 215-0111)
Note: * indicates equipment that has been discontinued by the manufacturer.
Software and datasets
1. Microsoft Office Excel (Microsoft Office 365), or similar
2. R version 4.3 or later [7]
3. R packages: tidyverse [8], emmeans [9], ggplot2 [10], readxl [11], janitor [12], cowplot [13]
4. Agilent Software (for RIN scoring)
Procedure
A. Sample collection and preservation
Note: To prevent cross-contamination between specimens, soak forceps in 50% bleach for at least 5 min, rinse in clean water for 1 min, and dry thoroughly. Clean gloves with 10% bleach between specimens and change them when handling different species. Disinfect the plastic cutting board with 10% bleach after each specimen using a wash bottle.
1. Excise tissue sample (~1 cm):
Soft corals (Paragorgia arborea and Primnoa resedaeformis): Use sterile forceps to hold the skeleton and cut soft tissue away using a clean scalpel blade.
Note: Change scalpel blades between specimens to avoid cross-contamination.
Sponges (Geodia barretti and Phakellia ventilabrum): Use a sterile UniCore tissue punch to excise the sample.
Note: Change the tissue punch between specimens to avoid cross-contamination.
Bivalve (Acesta excavata): Open the bivalve gently and place it with the open side facing down on a clean cutting board to allow excess water to drain. Then, use sterile forceps and a clean scalpel blade to excise a small portion of gill filaments.
Note: Handle tissues gently to avoid cross-contamination and change blades between specimens.
2. Immediately transfer the sample either to the 2 mL cryotube containing the DNA/RNA Shield solution or to an empty 2 mL cryotube and flash-freeze in liquid nitrogen (LN2) immediately.
Note: LN2-preserved samples remained in the cryogenic Dewar while on board. The shield-preserved samples were kept at 4 °C on board. All samples were transported in dry ice to the lab.
3. Store samples in a -80 °C freezer.
B. DNA and RNA co-extraction
Note: The co-extraction of DNA and RNA was carried out using the AllPrep DNA/RNA Mini kit following the Qiagen’s protocol for spin columns [14]. While all the core steps adhere to Qiagen’s official guidelines, we have incorporated additional details to optimize the protocol for deep-water marine invertebrate tissues. Specifically, we provide clarifications related to sample preparation, tissue disruption, and nucleic acid elution. Reagents from the kit should be prepared according to Qiagen’s instructions and kept at room temperature (RT).
Caution: All steps involving 2-mercaptoethanol, including lysis and co-extraction, should be performed in a fume hood to minimize exposure to toxic vapors.
B1. Sample preparation and homogenization
1. Prepare the lysis buffer by adding 10 μL of 2-Mercaptoethanol per 1,000 μL of Buffer RLT Plus.
Note: Prepare a lysis buffer master mix for all samples that are to be processed on the same day. 2-Mercaptoethanol is a hazardous chemical. Users should familiarize themselves with its safety data sheet (SDS) before use. Handle it in a fume hood and wear appropriate personal protective equipment (PPE).
2. Add 600 μL of lysis buffer to a sterile screw-cap microtube containing one 5 mm bead.
3. Excise a piece of tissue of 25–30 mg and add it to the tube containing the lysis buffer.
Note: For Shield-preserved samples, first thaw the sample on ice. For LN2-preserved samples, keep the sample in dry ice while excising the tissue.
4. Use a TissueLyser II with a TissueLyser Adapter Set 2 × 24 [15]. Place the tubes in the adapter, fasten the adapter in the instrument, and shake for 2.5 min at a speed of 25 Hz. Reorient the adapter so that the side that was closest to the machine body is now furthest from it and shake again for 30 s at 25 Hz.
5. Centrifuge the lysate at 10,000× g for 3 min at RT and carefully pipette the supernatant into an AllPrep DNA spin column placed in a 2 mL collection tube. Close the lid and centrifuge at 10,000× g for 1 min at RT.
Note: Make sure no liquid remains in the column membrane after centrifugation. If necessary, repeat the centrifugation until no visible liquid is left in the column membrane.
6. Place the AllPrep DNA spin column in a new 2 mL collection tube and store it at 4 °C until RNA purification (which requires the flowthrough) steps are completed.
B2. RNA purification
1. Add 600 μL of 70% ethanol to the flowthrough from step B1.6 and mix thoroughly by pipetting.
2. Transfer up to 700 μL of the mixture (including any precipitate) to a RNeasy spin column placed in a 2 mL collection tube. Centrifuge at 10,000× g for 1 min at RT and discard the flowthrough.
Note: Contrary to what Qiagen recommends, even if the sample volume exceeds 700 μL, do not centrifuge more than the first 700 μL and discard the rest of the sample. Trying to centrifuge successive aliquots will result in a clogged column and compromise the downstream steps.
3. Add 700 μL of Buffer RW1 to the spin column. Centrifuge at 10,000× g for 1 min at RT and discard the flowthrough.
4. Add 500 μL of Buffer RPE to the spin column. Centrifuge at 10,000× g for 1 min at RT and discard the flowthrough.
5. Add another 500 μL of Buffer RPE to the column. Centrifuge at 10,000× g for 2 min at RT to dry the membrane.
6. Place the spin column in a fresh collection tube and centrifuge at 10,000× g for 1 min at RT to remove residual wash buffer.
7. Transfer the spin column to a new 1.5 mL RNase-free microcentrifuge tube. Add 20 μL of RNase-free water directly to the membrane and centrifuge at 10,000× g for 1 min at RT.
Note: Phakellia ventilabrum was eluted in only 25 μL (final volume). This elution was reused in the next step because a low RNA yield was expected.
8. Perform a second elution using another 20 μL of fresh RNase-free water.
9. Immediately place the RNA samples on ice.
10. Prepare three aliquots from each sample for the quantity/quality analyses:
1.2 μL for Nanodrop
1.2 μL for RIN analyses
2.5 μL for Qubit
11. Store all aliquots, as well as the remaining stock, at -80 °C.
B3. DNA purification
1. Add 500 μL of Buffer AW1 to the AllPrep DNA spin column (from step B1.6) placed in a 2 mL collection tube. Centrifuge at 10,000× g for 1 min at RT and discard the flowthrough.
2. Add 500 μL of Buffer AW2 to the same spin column and centrifuge at 10,000× g for 2 min at RT. Discard the flowthrough.
3. Place the spin column again in the same collection tube and centrifuge at 10,000× g for 1 min at RT to remove residual wash buffer.
Note: While the Qiagen handbook recommends this additional centrifugation step only if the spin column contacts the flowthrough, we incorporated it routinely by placing the spin column in the collection tube and centrifuging for 1 min at full speed. We found that this consistently improved the removal of residual wash buffer and enhanced the purity of eluted nucleic acids.
4. Transfer the spin column to a new 1.5 mL microcentrifuge tube. Add 50 μL of Buffer EB directly to the membrane. Let the column stand at room temperature for 1 min, then centrifuge at 10,000× g for 1 min at RT.
Note: Phakellia ventilabrum was eluted in 30 μL in this step because a low DNA yield was expected.
5. Repeat the elution using 20 μL of fresh Buffer EB (except for Phakellia ventilabrum).
6. Immediately place the eluates on ice.
7. Prepare two aliquots from each sample for the quantity analyses:
1.2 μL for Nanodrop
2.5 μL for Qubit
8. Store all aliquots, as well as the remaining stock, at -80 °C.
C. Quantification and quality control
Note: Samples were retrieved from -80 °C, thawed on ice, and kept on ice until RNA and DNA quantification and RNA integrity assessment.
C1. Measurement of RNA and DNA concentration using Qubit
Note: Refer to the Qubit fluorometer protocols for detailed instructions and workflow, including illustrative photos [16,17].
1. Use Qubit 0.5 mL assay tubes and label only the caps of the tubes.
2. Prepare a fresh Qubit working solution by diluting the reagent (dsDNA BR or RNA BR reagent) 1:200 in buffer (dsDNA BR or RNA BR Buffer) in a Falcon tube.
Note: For example, to measure two standards and 20 samples, prepare a total volume of 4,600 µL to account for pipetting losses (basically one extra sample) by mixing 23 µL of reagent with 4,577 µL of buffer.
3. Prepare the assay mixture (final volume in all tubes should be 200 μL):
Standards: 190 μL of working solution + 10 μL of standard
Samples: 198 μL of working solution + 2 μL of sample
4. Vortex gently (3 s). Remove any visible bubbles after this.
5. Incubate at RT for 2 min.
6. In the Qubit 2.0 Fluorometer home screen, select either dsDNA → Broad Range or RNA → Broad Range.
7. Tap Read Standards:
Insert Standard #1, close lid, tap Read standard.
Repeat with Standard #2.
8. Tap Run Samples, set the sample volume to 2 μL and units to ng/μL.
9. Insert each sample tube, close lid, tap Read tube.
10. Repeat and record the displayed concentration for all samples.
C2. Measure A260/A280 and A260/A230 using Nanodrop
Note: Refer to the Nanodrop One user guide for detailed instructions and workflow, including illustrative photos [18].
1. Turn on the Nanodrop spectrophotometer and open the software.
2. Clean the measurement pedestal by adding 5 μL of distilled water and wait 2 min. Then, clean it using a lens paper.
3. Select the appropriate measurement type (Nucleic Acid → RNA or dsDNA).
4. Blank the instrument by pipetting 1 μL of the elution solution (RNase-free water for the RNA and buffer EB for the DNA samples).
5. Lower the arm, wait for the measurement, lift the arm, and clean the pedestal.
Note: Wipe both pedestals after each measurement with a clean lens paper.
6. Measure each sample by pipetting 1 μL of sample onto the lower pedestal. Lower the arm and initiate reading.
7. Repeat and record the displayed concentration (ng/μL) and purity ratios (260/280 and 260/230) for all samples.
8. Clean both pedestals with clean lens paper.
C3. Evaluate RNA integrity using the Bioanalyzer RNA 6000 Nano assay (RIN)
Note: The Agilent RNA 6000 Nano Assay protocol was followed exactly as described by the manufacturer [19]. For clarity, the procedure is described step-by-step below, based directly on the manufacturer’s instructions. Electrode decontamination was performed prior to running any RNA Nano assays and the “Cleaning up after the RNA 6000 Nano Chip Run” procedure was carried out between each chip to ensure consistent performance and prevent cross-contamination.
1. Preparation
a. Allow all reagents (Agilent RNA 6000 Nano Gel Matrix, Agilent RNA 6000 Nano Marker, RNA Nano Dye Concentrate) to equilibrate to RT for 30 min.
b. Switch on the Agilent 2100 Bioanalyzer and open the 2100 Expert software.
c. Check that the chip priming station is correctly assembled (base plate in position C, syringe clip locked at the top).
2. Electrode cleaning
a. Fill one well of the electrode cleaner (provided with the kit) with 350 µL of RNaseZAP.
b. Place in the Bioanalyzer, close the lid carefully, wait for 1 min, and then remove.
c. Fill another electrode cleaner with 350 µL of RNase-free water. Insert, close the lid carefully, wait for 10 s, and then remove.
d. Allow electrodes to air-dry for 10 s before closing the lid.
3. Sample and RNA ladder preparation
a. Thaw RNA samples (use 1.2 µL of a concentration between 25 and 250 ng/µL; if needed, dilute the samples using RNase-free water) and one 1.2 µL of RNA ladder aliquot (both prepared PCR tubes) on ice.
b. Heat-denature at 70 °C for 2 min in a PCR machine, then immediately cool on ice.
c. Keep all samples and ladder on ice until loading into the chip.
4. Gel preparation
a. Transfer 550 µL of RNA 6000 Nano gel matrix into a spin filter.
b. Centrifuge at 1,500× g for 10 min at RT.
c. Aliquot 65 µL of filtered gel into RNase-free tubes (store at 4 °C for ≤1 month).
5. Gel–dye mix
a. Vortex the dye concentrate briefly and spin down.
b. Add 1 µL of dye to 65 µL of filtered gel. Mix thoroughly by vortexing.
c. Spin at 13,000× g for 10 min at RT.
d. Protect from light and use within 1 day.
6. Chip priming
a. Pipette 9 µL of gel–dye mix into the priming well (marked with a G; see [19] page 16).
b. Place the chip in the priming station, set the plunger at exactly 1 mL, and close until it clicks.
c. Press the plunger, hold for exactly 30 s, and release with the clip.
d. Wait 5 s and then slowly pull the plunger back to 1 mL.
e. Add 9 µL of the gel–dye mix to each of the two remaining wells marked (see [19] page 17).
7. Marker and sample loading
a. Pipette 5 µL of RNA 6000 Nano marker into each sample well and the ladder well.
b. Pipette 1 µL of RNA ladder into the designated ladder well.
c. Pipette 1 µL of RNA sample into each sample well.
Note: If fewer than 12 samples are being analyzed, add 1 µL of RNA 6000 Nano marker into any sample-empty well.
8. Chip mixing
a. Place the loaded chip in the IKA vortex mixer.
b. Vortex at 2,400 rpm for 60 s.
c. Start the run within 5 min of mixing.
9. Running the chip
a. Insert the chip into the Bioanalyzer (fits only one orientation).
b. Close the lid carefully.
10. Data acquisition
a. Review electropherograms and virtual gels.
b. Record RNA concentration, ribosomal RNA peaks, and RNA integrity number (RIN).
c. Export data for documentation.
11. Cleaning the electrodes after each run
a. Remove and discard the used chip following lab safety rules.
b. Perform electrode cleaning (RNaseZAP followed by RNase-free water) as described in step C3.2.
Data analysis
Statistical analyses were performed in R (version 4.4.3 [7]). For each species, three biological replicates were used for all measurements. The analytical pipeline consisted of the following steps (see Figure 1): (i) raw data were imported from Excel files using readxl and column names standardized with janitor; (ii) data were prepared with dplyr, including renaming variables for clarity, calculating total RNA and DNA yields and defining categorical variables for species and storage method with explicit levels; (iii) generalized linear models (GLMs) with a Gamma distribution and log link were fitted using base R (glm) to test the effects of storage method, species, and their interaction on RNA yield, RIN, and DNA yield; (iv) model diagnostics were performed with DHARMa to assess residual patterns and distributional assumptions; (v) estimated marginal means and Tukey-adjusted pairwise contrasts were computed using emmeans; and (vi) results were visualized using ggplot2, with figure formatting improved via cowplot. Statistical significance was set at p < 0.05. The raw data used for these analyses can be found in the Supplementary Information Dataset S1.

Figure 1. Flowchart summarizing the analytical pipeline for RNA/DNA analysis (R packages in parentheses)
RNA yield and purity
Clear differences in RNA yield (Figure 2) and concentration (Table 1) were observed between storage methods across all species tested. Samples flash frozen in liquid nitrogen (LN2) consistently exhibited a higher RNA yield, as measured by Qubit, compared to samples preserved with DNA/RNA Shield. Significantly higher RNA yields were observed for the sponge Phakellia ventilabrum (p = 0.0011), the bivalve Acesta excavata (p = 0.002), and the soft coral Primnoa resedaeformis (p < 0.0001) when samples were flash frozen in LN2 and stored at -80 °C.
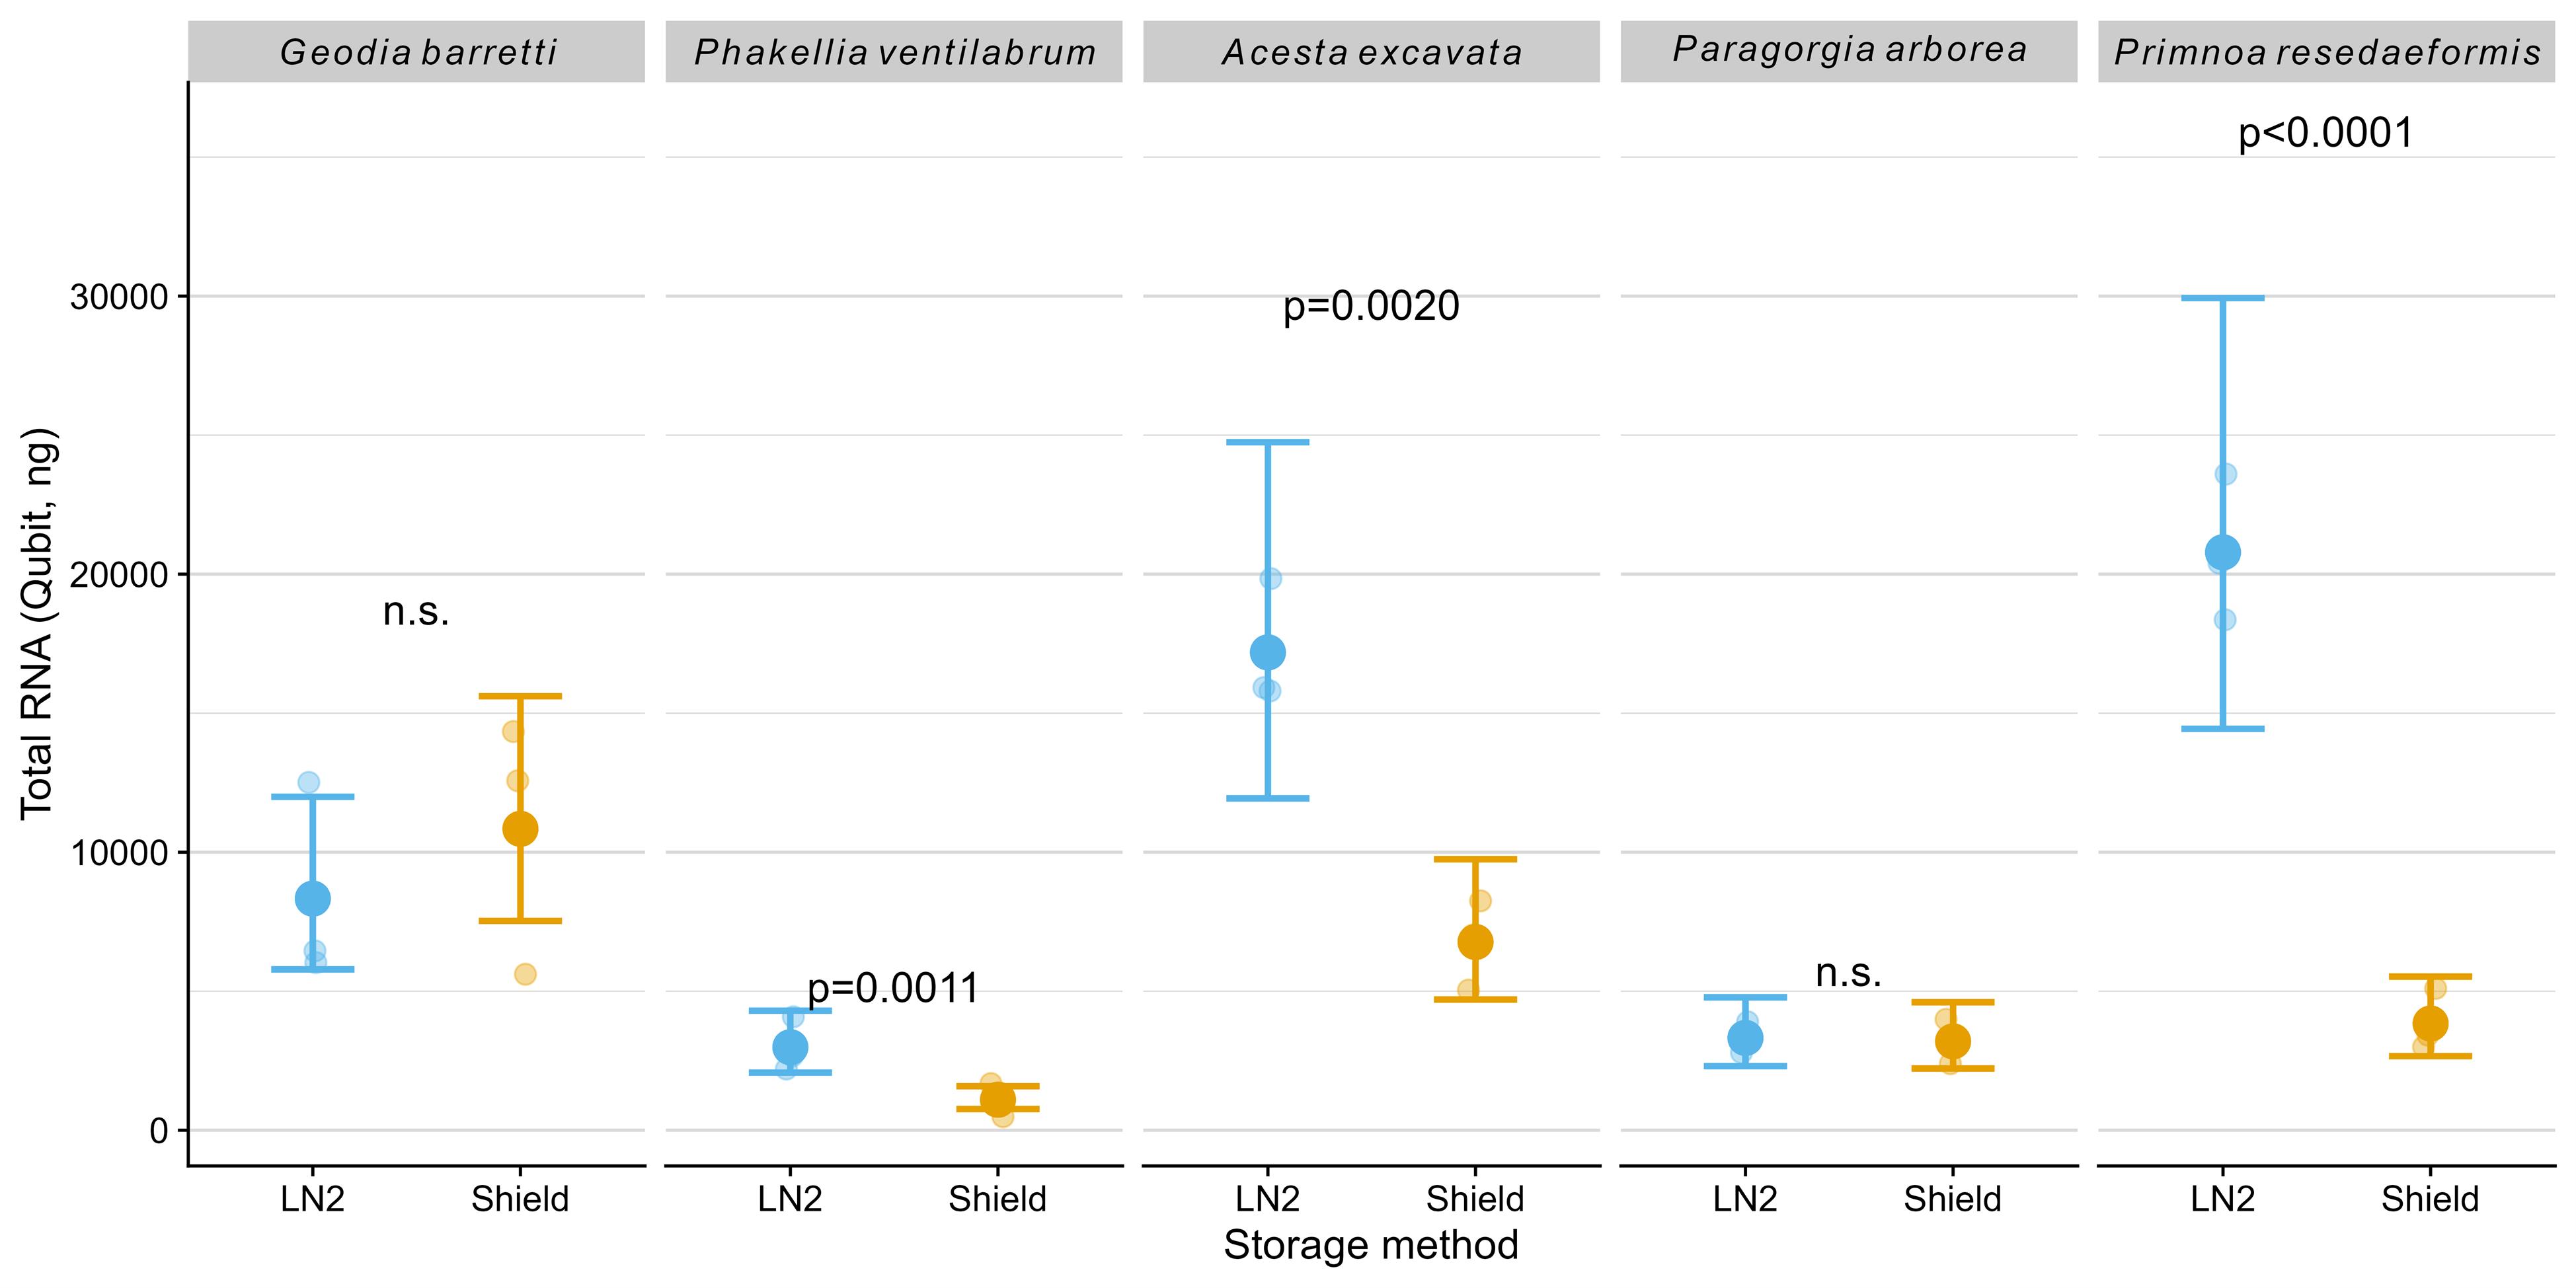
Figure 2. Total RNA amount (ng) measured using Qubit. The plot shows model-predicted means (large dots) with 95% confidence intervals (error bars) and raw data points (smaller, horizontally jittered dots for visualization). P-values from post-hoc comparisons between storage methods within species are shown; n.s. indicates non-significant differences (p ≥ 0.05).
As shown in Table 1, RNA concentration and the ratio of absorbance at 260 and 230 nm (A260/230) varied widely, with DNA/RNA Shield samples often showing lower concentration values and reduced A260/230 values suggestive of increased organic contaminants, particularly in Phakellia ventilabrum. The parameter A260/280 was generally similar and within the expected range (~2.0), indicating minimal protein contamination regardless of storage method.
RNA integrity number (RIN)
The RIN was markedly higher in LN2-stored samples, with RIN values predominantly above 7 (Figure 3, Table 1). The difference in RIN values was not significantly higher between the two storage methods for the bivalve Acesta excavata and the sponge Geodia barretti, but the DNA/RNA Shield samples demonstrated lower integrity scores for the sponge Phakellia ventilabrum (p = 0.0164) and dropped to below 4 in the soft coral species Paragorgia arborea (p < 0.0001) and Primnoa resedaeformis (p < 0.0001), indicative of substantial degradation (Figure 3; see Supplementary Dataset S3 for sample electrograms and gels). Primnoa resedaeformis consistently showed lower RIN values across both preservation methods, possibly reflecting species-specific tissue properties; however, the mean RIN of 5.8 under LN2 preservation still permits downstream molecular applications compared to the highly degraded RNA in Shield-preserved samples (mean RIN of 2.8). These results highlight that LN2 storage is superior for maintaining RNA yield and integrity in marine tissue samples, which is critical for downstream molecular applications.
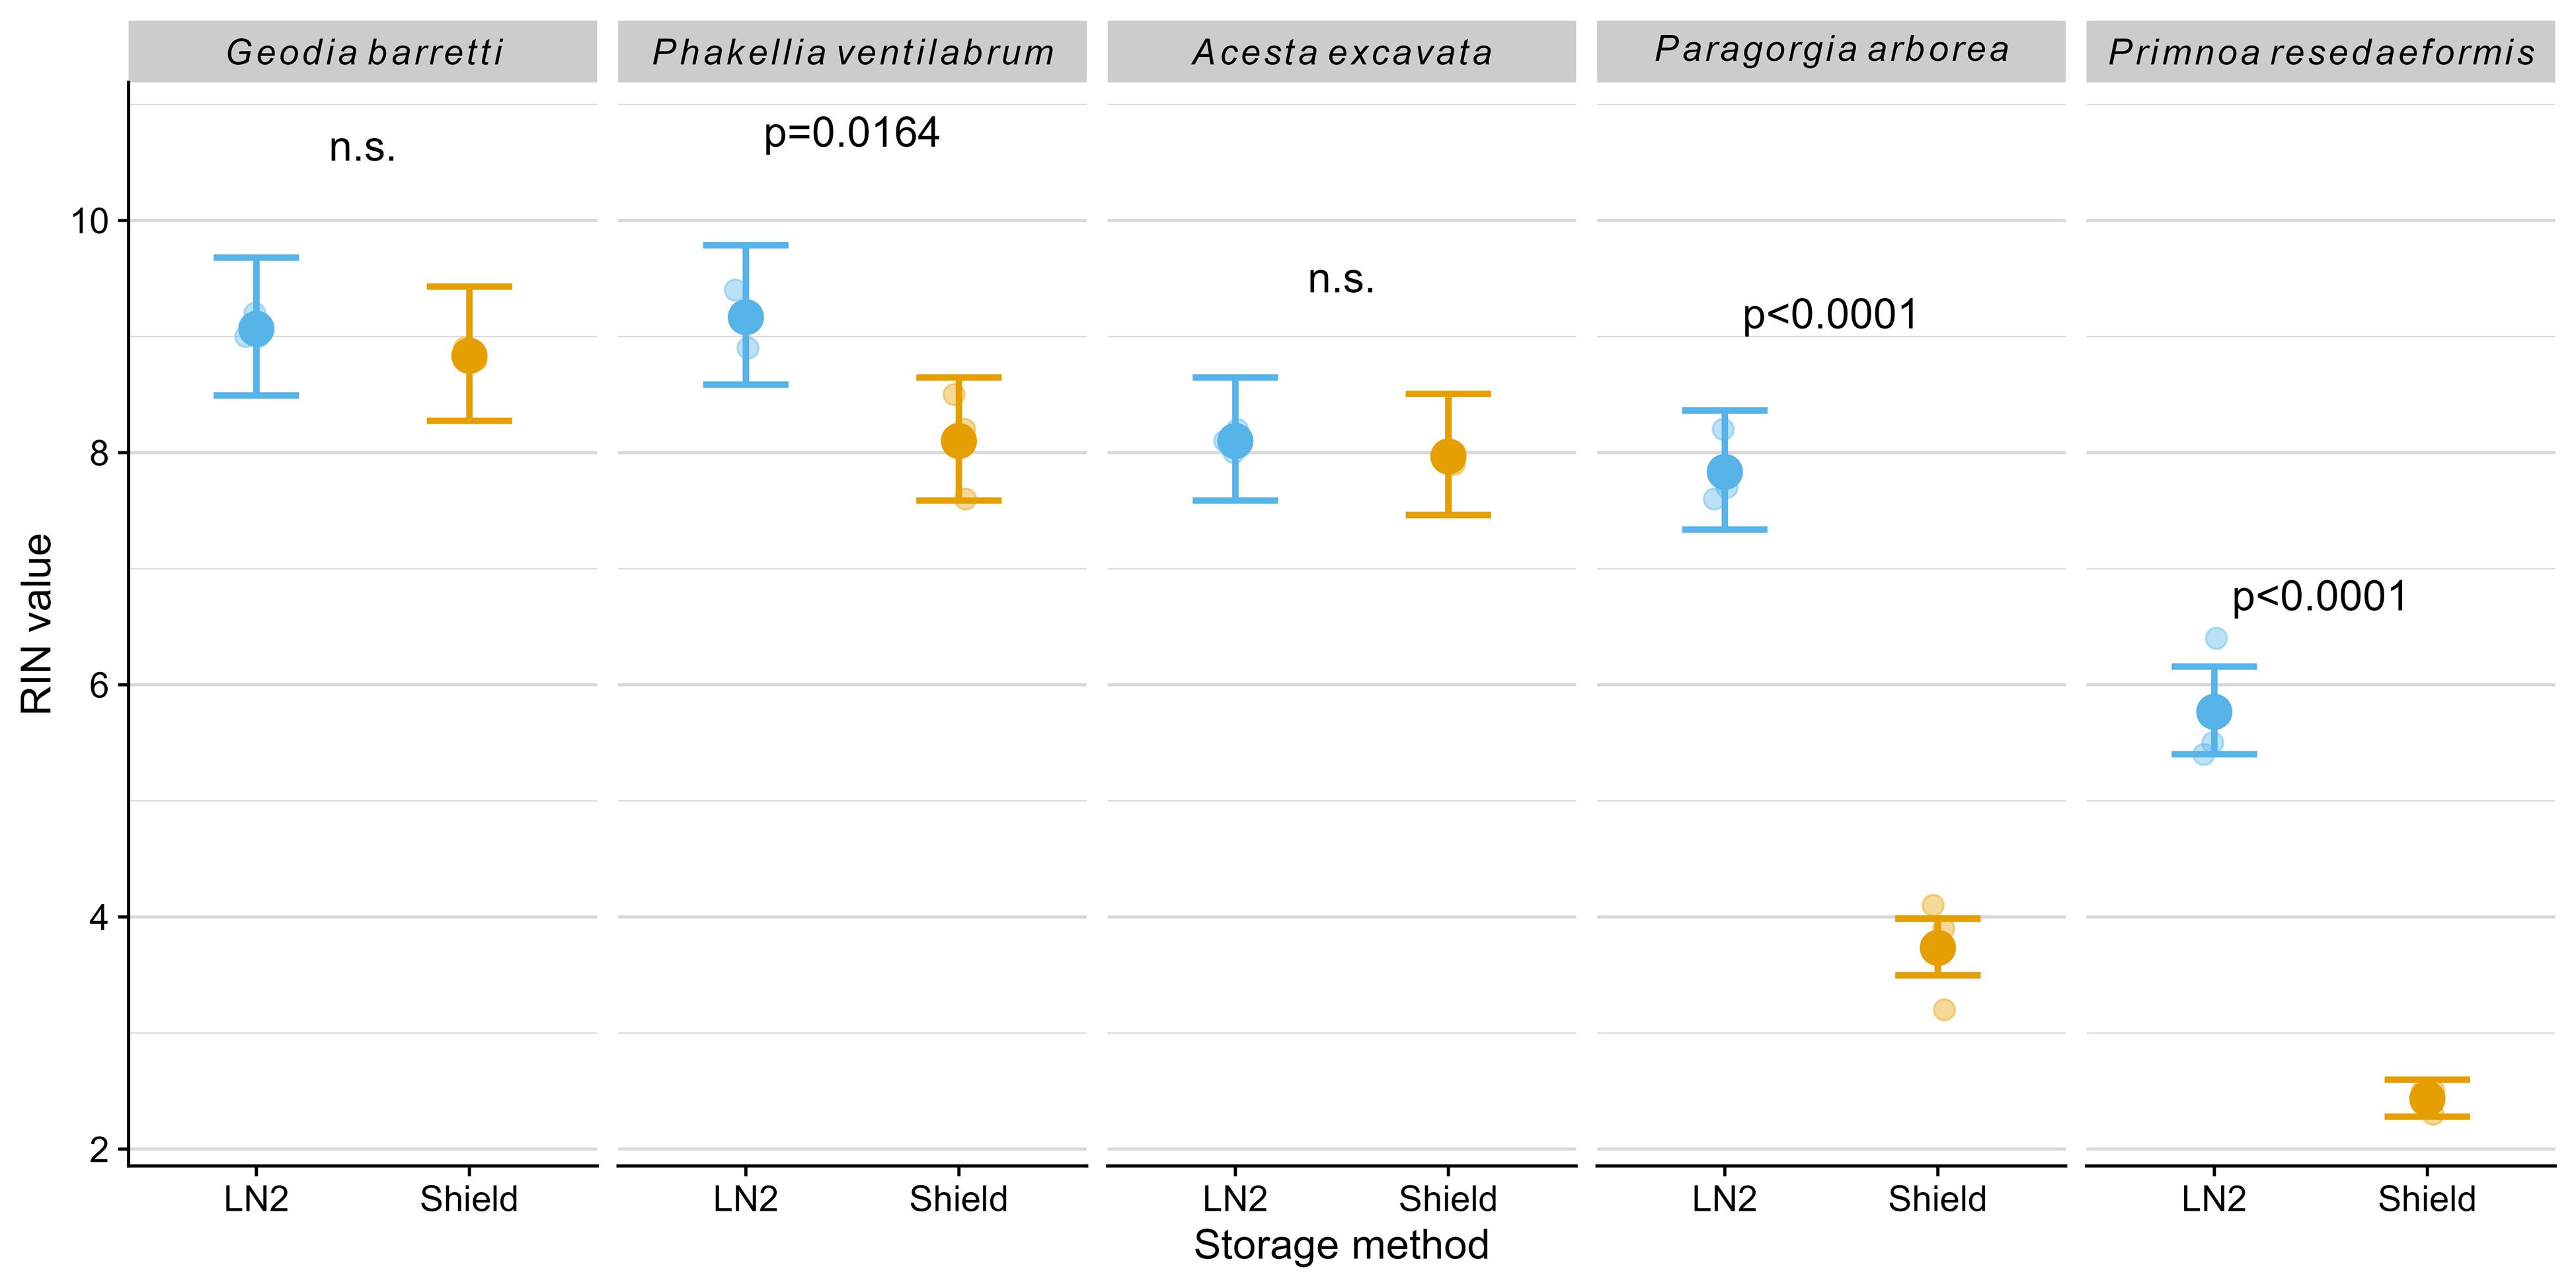
Figure 3. RNA integrity number (RIN) values obtained using an Agilent Bioanalyzer. The plot shows model-predicted means (large dots) with 95% confidence intervals (error bars) and raw data points (smaller, horizontally jittered dots for visualization). P-values from post-hoc comparisons between storage methods within species are shown; n.s. indicates non-significant differences (p ≥ 0.05).
Table 1. Summary of RNA quantity and purity metrics for marine benthic species under two storage conditions: liquid nitrogen (LN2) and DNA/RNA Shield. Values are presented as mean ± standard deviation.
| Species | Storage | RNA qubit (ng/µL) | A260/A280 | A260/A230 | RIN |
|---|---|---|---|---|---|
| Geodia barretti | DNA/RNA Shield | 271 ± 115 | 2.15 ± 0.03 | 1.91 ± 0.57 | 8.8 ± 0.1 |
| Geodia barretti | LN2 | 208 ± 91 | 2.11 ± 0.02 | 2.07 ± 0.20 | 9.1 ± 0.1 |
| Phakellia ventilabrum | DNA/RNA Shield | 44 ± 24 | 2.18 ± 0.04 | 0.28 ± 0.09 | 8.1 ± 0.5 |
| Phakellia ventilabrum | LN2 | 119 ± 39 | 2.09 ± 0.03 | 0.83 ± 0.43 | 9.2 ± 0.3 |
| Acesta excavata | DNA/RNA Shield | 169 ± 40 | 2.13 ± 0.03 | 2.20 ± 0.07 | 8.0 ± 0.1 |
| Acesta excavata | LN2 | 430 ± 57 | 2.18 ± 0.01 | 1.97 ± 0.23 | 8.1 ± 0.1 |
| Paragorgia arborea | DNA/RNA Shield | 80 ± 20 | 2.19 ± 0.02 | 1.78 ± 0.45 | 3.7 ± 0.5 |
| Paragorgia arborea | LN2 | 83 ± 14 | 2.18 ± 0.00 | 1.83 ± 0.37 | 7.8 ± 0.3 |
| Primnoa resedaeformis | DNA/RNA Shield | 96 ± 28 | 2.18 ± 0.05 | 1.33 ± 1.02 | 2.4 ± 0.1 |
| Primnoa resedaeformis | LN2 | 520 ± 66 | 2.19 ± 0.03 | 2.21 ± 0.04 | 5.8 ± 0.6 |
DNA yield and purity
DNA yield and concentration varied noticeably between species and preservation methods. Differences among species were evident, with Geodia barretti and the gill of Acesta excavata yielding substantially more DNA compared to the other species (Figure 4). All samples preserved in LN2 consistently provided significantly higher total DNA amounts: Geodia barretti (p = 0.034), Phakellia ventilabrum (p = 0.001), Acesta excavata (p<0.0001), Paragorgia arborea (p = 0.002), and Primnoa resedaeformis (p < 0.0001) and concentrations compared to those stored in DNA/RNA Shield (Table 2).
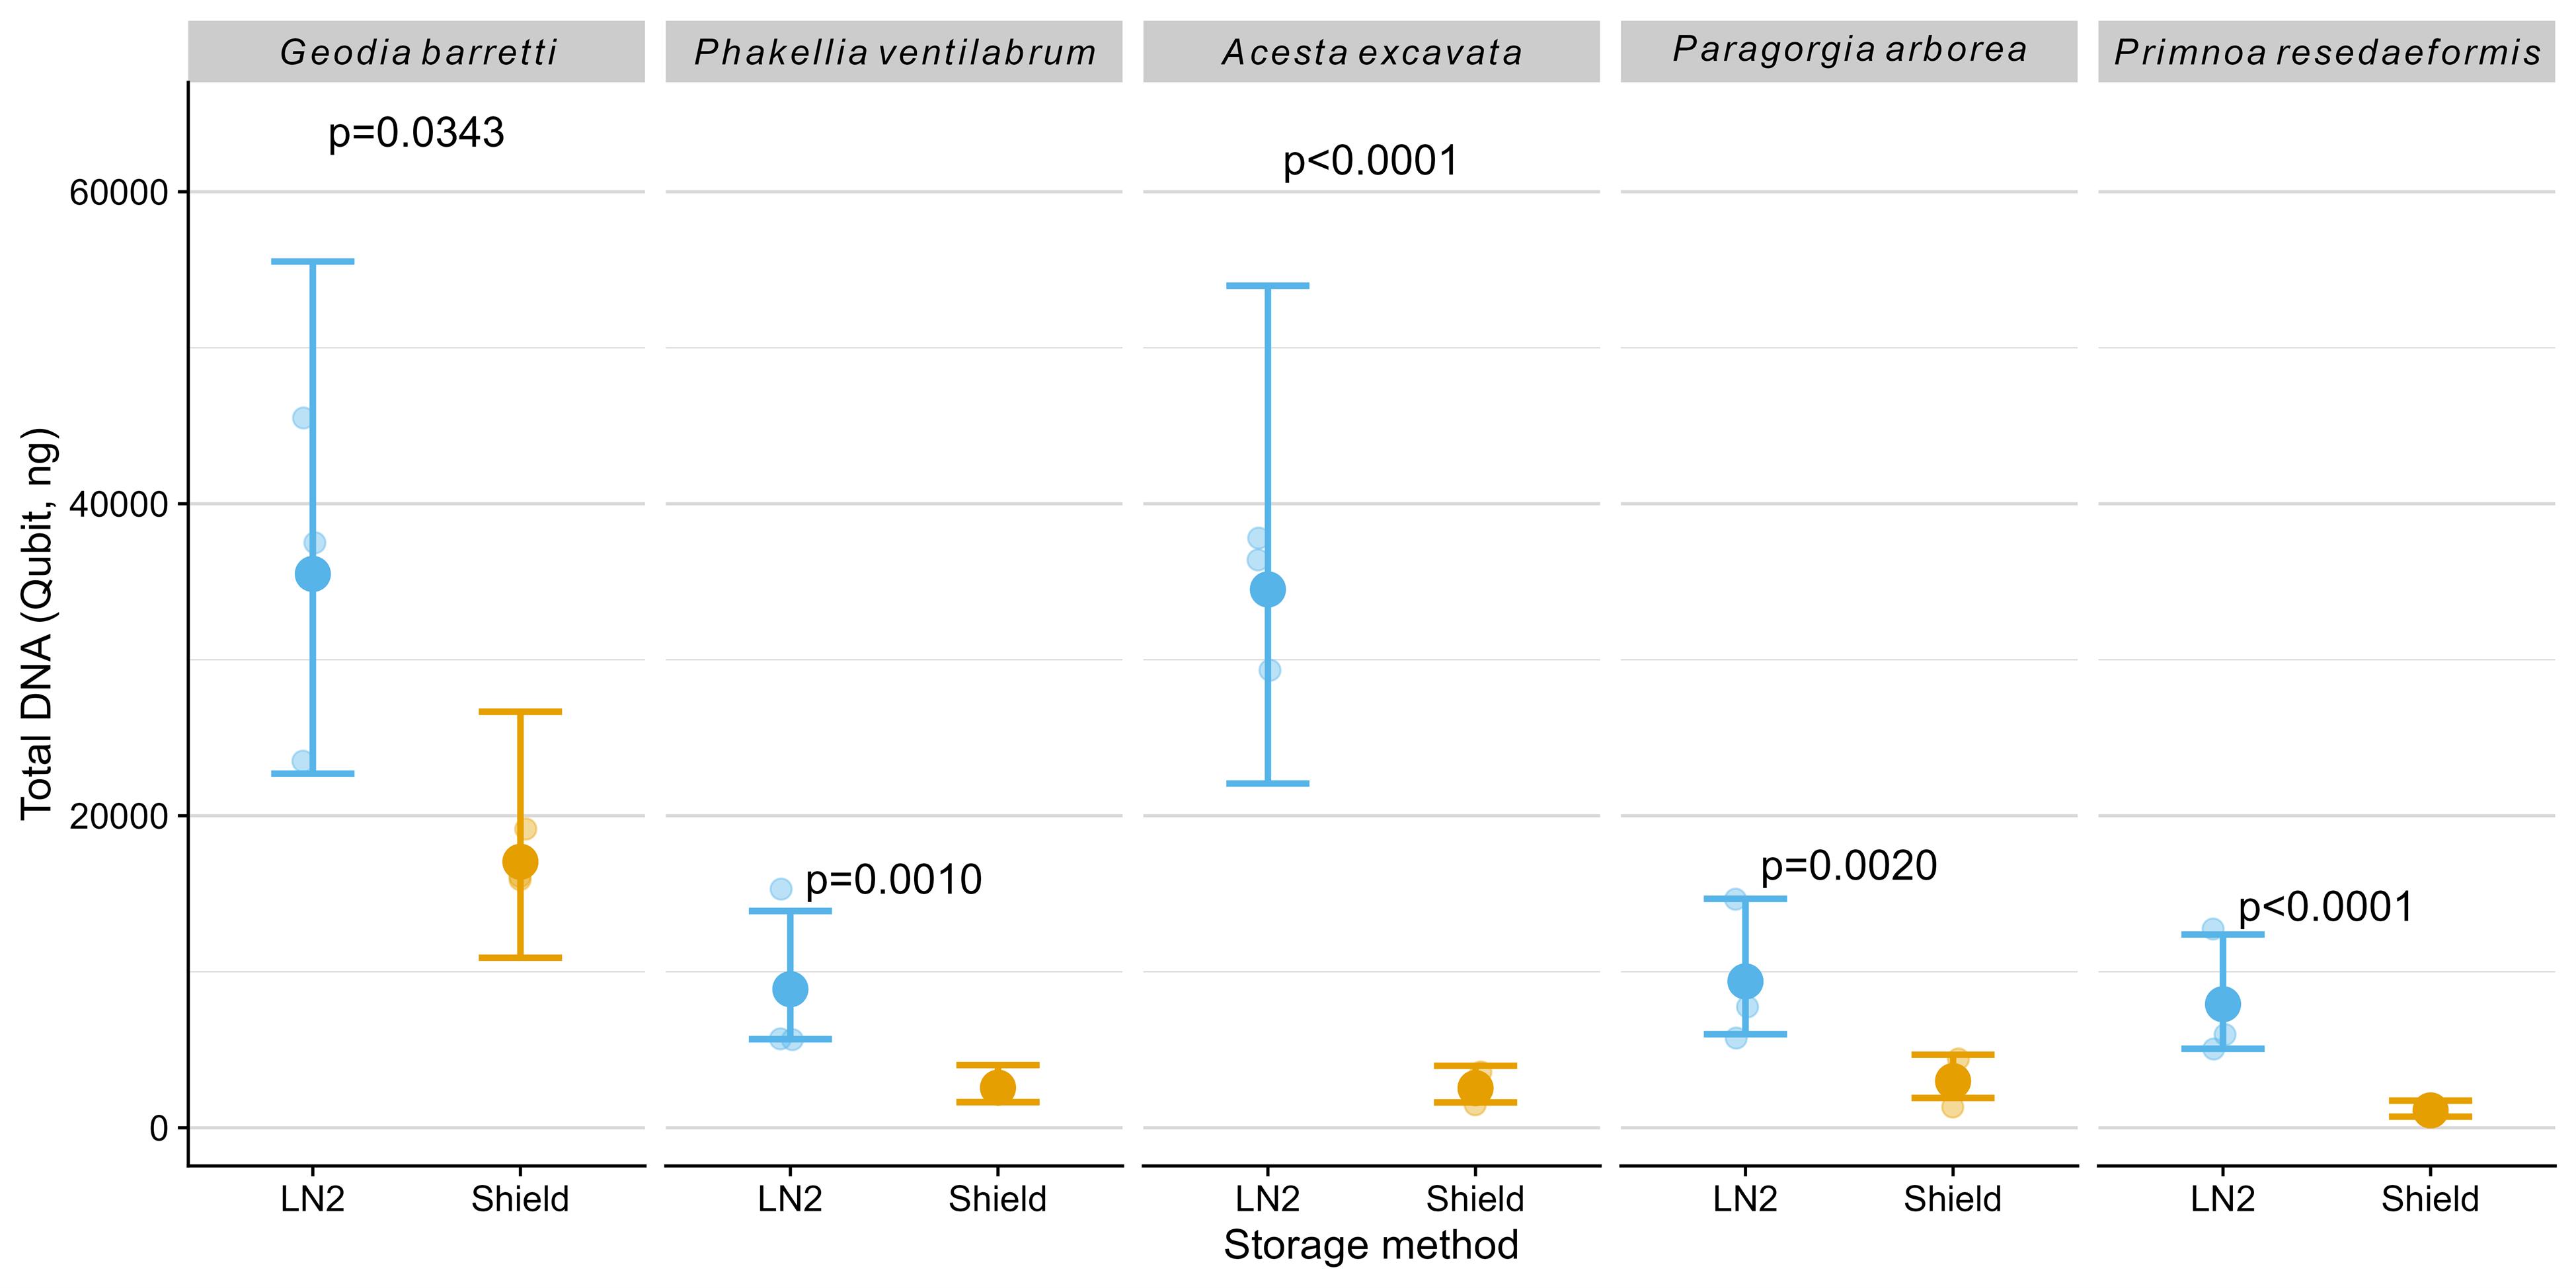
Figure 4. Total DNA amount (ng) measured using Qubit. The plot shows model-predicted means (large dots) with 95% confidence intervals (error bars) and raw data points (smaller, horizontally jittered dots for visualization). P-values from post-hoc comparisons between storage methods within species are shown; n.s. indicates non-significant differences (p ≥ 0.05).
DNA purity ratios (A260/280) were within the expected range (~1.8) across samples, indicating minimal protein contamination (Table 2). In contrast, the A260/230values were consistently lower in DNA/RNA Shield-preserved samples, suggesting the presence of residual contaminants such as guanidine salts or other buffer components.
In summary, preservation in LN2 provided consistently higher DNA yields and better purity metrics across all examined species, underscoring its suitability for high-quality DNA extraction from deep-sea invertebrates.
Table 2. Summary of DNA quantity and purity metrics for marine benthic species under two storage conditions: liquid nitrogen (LN2) and DNA/RNA Shield. Values are presented as mean ± standard deviation.
| Species | Storage | DNA qubit (ng/µL) | A260/A280 | A260/A230 |
|---|---|---|---|---|
| Geodia barretti | DNA/RNA Shield | 244 ± 26 | 1.90 ± 0.01 | 0.87 ± 0.35 |
| Geodia barretti | LN2 | 507 ± 159 | 1.91 ± 0.01 | 1.60 ± 0.75 |
| Phakellia ventilabrum | DNA/RNA Shield | 51 ± 5 | 1.91 ± 0.03 | 0.28 ± 0.31 |
| Phakellia ventilabrum | LN2 | 178 ± 111 | 1.86 ± 0.02 | 1.22 ± 0.46 |
| Acesta excavata | DNA/RNA Shield | 36 ± 15 | 1.90 ± 0.01 | 0.51 ± 0.40 |
| Acesta excavata | LN2 | 493 ± 65 | 1.92 ± 0.01 | 1.66 ± 0.58 |
| Paragorgia arborea | DNA/RNA Shield | 43 ± 22 | 1.87 ± 0.02 | 0.80 ± 0.21 |
| Paragorgia arborea | LN2 | 134 ± 67 | 1.88 ± 0.01 | 1.71 ± 0.28 |
| Primnoa resedaeformis | DNA/RNA Shield | 16 ± 4 | 1.89 ± 0.03 | 0.16 ± 0.07 |
| Primnoa resedaeformis | LN2 | 113 ± 60 | 1.89 ± 0.00 | 1.79 ± 0.36 |
Validation of protocol
1. The AllPrep DNA/RNA Mini kit has been previously validated for successful extraction of nucleic acids from benthic species [20,21].
2. RNA and DNA concentration, integrity (RIN), and A260/A230 were consistently higher in LN2-preserved samples.
3. Similar results regarding the preservation methods in soft corals have been reported by [5]. In the latter study on Alcyonium antarcticum, higher RNA degradation was observed in samples preserved using the commercial reagent RNAlater (Ambion), compared to those flash-frozen in LN2.
General notes and troubleshooting
General notes
DNA/RNA Shield can be a viable alternative preservation method when LN2 is unavailable for sponges [22] and bivalves. However, our results demonstrate that flash freezing in LN2 consistently yields superior preservation of both DNA quantity and RNA integrity, especially in soft coral species. DNA/RNA Shield compromised the quality of the coral RNA samples, making it unsuitable for downstream molecular steps (omics). These results contrast with those of Trivedi et al. [23], where microbial nucleic acids from water samples were similarly preserved by freezing in liquid nitrogen and DNA/RNA Shield. This discrepancy may stem from the slower penetration and action of DNA/RNA Shield, particularly in dense or heterogeneous tissues, allowing degradation to occur before effective stabilization [24]. In contrast, liquid nitrogen acts almost instantaneously, rapidly halting enzymatic activity (e.g., RNase, DNase, proteinase) and preventing degradation [4]. Consequently, while DNA/RNA Shield may be practical for field conditions or taxa with permeable tissues, LN2 flash freezing remains the most reliable method for maximizing both the integrity and yield of DNA and RNA in benthic invertebrates.
Troubleshooting
Problem 1: RNA degradation in LN2-preserved samples.
Possible causes:
1. Accidental thawing prior to extraction.
2. Delays or suboptimal conditions during sample collection and handling.
Solutions:
1. Ensure samples are kept consistently on dry ice until the lysis buffer is added.
2. Minimize handling time and exposure to ambient temperatures during processing.
3. After ROV collection and upon arrival on board, place specimens in freshly collected deep-seawater, kept chilled and in the dark, to reduce physiological stress.
4. Dissection and preservation steps should be carried out as quickly as possible once on board, to minimize degradation of tissue nucleic acids.
Problem 2: Low nucleic acid yield.
Possible cause: Excess tissue input or incomplete lysis.
Solutions:
1. Use no more than 30 mg of tissue per extraction, as recommended by the manufacturer’s kit.
2. Thoroughly homogenize tissue to improve yield.
Problem 3: Poor RNA purification and purity.
Possible cause: Overloading column or improper handling of buffers.
Solutions:
1. During total RNA purification, do not exceed 700 μL in step B2.2 to avoid column saturation.
2. Perform the extra centrifugation (step B2.6) to ensure that the RNeasy spin column is completely dry.
Note: Please also refer to the Troubleshooting Guide from Qiagen AllPrep DNA/RNA Mini Handbook [7].
Supplementary information
The following supporting information can be downloaded here:
1. Dataset S1. Species information. RNA and DNA extraction metrics for each sample, including concentration, purity ratios, and RNA integrity.
2. Dataset S2. Representative images of collected specimens.
3. Dataset S3. Electropherograms summary and gel images retrieved from the Agilent Bioanalyzer.
Acknowledgments
We thank the crew of the research vessel Prinsesse Ingrid Alexandra and all field participants. We acknowledge that his protocol was developed based on standard manufacturer instructions and guidelines for the AllPrep DNA/RNA Mini Kit (Qiagen), Qubit fluorometric quantification (Invitrogen), NanoDrop spectrophotometry (Thermo Fisher Scientific), and Bioanalyzer RNA quality assessment (Agilent Technologies). This work was supported by FHF Grant No. 901785. Author contributions: Conceptualization: A.S.G., X.P., N.K., O.L.; Sample collection: A.S.G., N.K.; Laboratory work: A.S.G., E.M.G.; Data analyses: A.S.G., X.P., O.L.; Figure preparation: A.S.G.; Funding acquisition: N.K., O.L., X.P.; Writing – original draft: A.S.G. All authors contributed to reviewing and editing the final manuscript.
The following figures were created using BioRender: Graphical overview, https://BioRender.com/0artho7.
Competing interests
The authors declare no competing financial or non-financial interests.
References
- Voet, D. and Voet, J. G. (1995). Biochemistry. John Wiley and Sons. New York. ISBN: 0-471-58651-X.
- Camacho‐Sanchez, M., Burraco, P., Gomez‐Mestre, I. and Leonard, J. A. (2013). Preservation of RNA and DNA from mammal samples under field conditions. Mol Ecol Resour. 13(4): 663–673. https://doi.org/10.1111/1755-0998.12108
- Riesgo, A., Pérez-Porro, A. R., Carmona, S., Leys, S. P. and Giribet, G. (2011). Optimization of preservation and storage time of sponge tissues to obtain quality mRNA for next‐generation sequencing. Mol Ecol Resour. 12(2): 312–322. https://doi.org/10.1111/j.1755-0998.2011.03097.x
- Van Cise, A. M., Switzer, A. D., Apprill, A., Champagne, C. D., Chittaro, P. M., Dudek, N. K., Gavery, M. R., Hancock‐Hanser, B. L., Harmon, A. C., Jaffe, A. L., et al. (2024). Best practices for collecting and preserving marine mammal biological samples in the ‘omics era. Mar Mammal Sci. 40(4): e13148. https://doi.org/10.1111/mms.13148
- Hillyard, G. and Clark, M. S. (2011). RNA preservation of Antarctic marine invertebrates. Polar Biol. 35(4): 633–636. https://doi.org/10.1007/s00300-011-1088-9
- Pratte, Z. A. and Kellogg, C. A. (2021). Comparison of Preservation and Extraction Methods on Five Taxonomically Disparate Coral Microbiomes. Front Mar Sci. 8: e684161. https://doi.org/10.3389/fmars.2021.684161
- RCoreTeam. (2023). R: A Language and Environment for Statistical Computing. R Foundation for Statistical Computing. https://www.R-project.org/
- Wickham, H., Averick, M., Bryan, J., Chang, W., McGowan, L., François, R., Grolemund, G., Hayes, A., Henry, L., Hester, J., et al. (2019). Welcome to the Tidyverse. J open source softw. 4(43): 1686. https://doi.org/10.21105/joss.01686
- Lenth, R. V. (2025). emmeans: Estimated Marginal Means, aka Least-Squares Means. https://CRAN.R-project.org/package=emmeans
- Wickham, H. (2016). ggplot2: Elegant Graphics for Data Analysis. Springer-Verlag. New York, NY. ISBN: 978-3-319-24277-4.
- Wickham, H. and Bryan, J. (2025). readxl: Read Excel Files. https://readxl.tidyverse.org
- Firke, S. (2024). janitor: Simple Tools for Examining and Cleaning Dirty Data. https://github.com/sfirke/janitor
- Wilke, C. O. (2025). cowplot: Streamlined Plot Theme and Plot Annotations for 'ggplot2'. https://github.com/wilkelab/cowplot
- Qiagen. (2020). AllPrep DNA/RNA Mini Handbook https://www.qiagen.com/us/resources/resourcedetail?id=580866a6-56c6-4674-8566-2852164d8519&lang=en.
- Qiagen. (2022). TissueLyser II User Manual. https://www.qiagen.com/us/resources/resourcedetail?id=01db8e6a-7ad3-4b50-be75-a80f5f45d028.
- Scientific, T. F. (2011). The Qubit 2.0 Fluorometer: The Next Generation in Nucleic Acid and Protein Quantitation. https://www.thermofisher.com/no/en/home/references/newsletters-and-journals/bioprobes-journal-of-cell-biology-applications/bioprobes-issues-2011/bioprobes-64-april-2011/the-qubit-2-0-fluorometer-april-2011.html.
- Invitrogen. (2010). Invitrogen Qubit 2.0 User Manual. https://www.manualslib.com/manual/1639323/Invitrogen-Qubit-2-0.html?page=23#manual.
- Thermoscientific. (2022). NanoDrop One User Guide. https://documents.thermofisher.com/TFS-Assets/MSD/manuals/nanodrop-one-user-guide-EN-309102-REV-A.pdf.pdf.
- Agilent Technologies, I. (2013). Agilent RNA 6000 Nano Kit Guide Rev. B, Manual Part No. G2938-90034. https://www.agilent.com/cs/library/usermanuals/public/G2938-90034_RNA6000Nano_KG.pdf.
- Laroche, O., Meier, S., Mjøs, S. A. and Keeley, N. (2021). Effects of fish farm activities on the sponge Weberella bursa, and its associated microbiota. Ecol Indic. 129: 107879. https://doi.org/10.1016/j.ecolind.2021.107879
- Laroche, O., Meier, S., Mjøs, S. A. and Keeley, N. (2022). Suspension-Feeding Benthic Species’ Physiological and Microbiome Response to Salmon Farming and Associated Environmental Changes. Front Mar Sci. 9: e841806. https://doi.org/10.3389/fmars.2022.841806
- Jeunen, G., Lamare, M., Cummings, V., Treece, J., Ferreira, S., Massuger, J., Pryor Rodgers, L., Tait, L., Lust, B., Wilkinson, S., et al. (2023). Unveiling the hidden diversity of marine eukaryotes in the Ross Sea: A comparative analysis of seawater and sponge eDNA surveys. Environ DNA. 5(6): 1780–1792. https://doi.org/10.1002/edn3.500
- Trivedi, C. B., Keuschnig, C., Larose, C., Rissi, D. V., Mourot, R., Bradley, J. A., Winkel, M. and Benning, L. G. (2022). DNA/RNA Preservation in Glacial Snow and Ice Samples. Front Microbiol. 13: e894893. https://doi.org/10.3389/fmicb.2022.894893
- Salehi, Z. and Najafi, M. (2014). RNA Preservation and Stabilization. Biochem Physiol. 3(126). https://doi.org/10.4172/2168-9652.1000126.
Article Information
Publication history
Received: Aug 12, 2025
Accepted: Oct 14, 2025
Available online: Oct 31, 2025
Published: Nov 20, 2025
Copyright
© 2025 The Author(s); This is an open access article under the CC BY-NC license (https://creativecommons.org/licenses/by-nc/4.0/).
How to cite
Gomes, A. S., Guerreiro, E. M., Pochon, X., Keeley, N. and Laroche, O. (2025). A Comparative Protocol for Preserving Deep-Water Marine Invertebrate Tissues: DNA/RNA Shield vs. Liquid Nitrogen for Dual Extraction of High-Quality Nucleic Acids. Bio-protocol 15(22): e5521. DOI: 10.21769/BioProtoc.5521.
Category
Environmental science
Molecular Biology > RNA > RNA extraction
Molecular Biology > DNA > DNA extraction
Do you have any questions about this protocol?
Post your question to gather feedback from the community. We will also invite the authors of this article to respond.