- Protocols

- Articles and Issues
- For Authors
- About
- Become a Reviewer

Monitoring Endocytosis of Integral Membrane Proteins Using Western Blot-Based Detection of Biotinylated Antibody Uptake
Published: Vol 15, Iss 22, Nov 20, 2025 DOI: 10.21769/BioProtoc.5511 Views: 2194
Reviewed by: Anonymous reviewer(s)


Protocol Collections
Comprehensive collections of detailed, peer-reviewed protocols focusing on specific topics


Related protocols
Abstract
The antibody-uptake assay is a commonly used technique to monitor endocytosis of integral membrane proteins including transmembrane and glycosylphosphatidylinositol-anchored proteins (GPI-APs). The antibody-uptake assay typically involves incubating live cells with fluorophore-conjugated antibodies directed against the extracellular domain of the integral membrane protein of interest. Antibody uptake is then detected by flow cytometry or confocal microscopy. However, these detection modalities may be inaccessible to some labs or require extensive training to operate. Thus, we developed an easy and novel sodium dodecyl sulfate-polyacrylamide gel electrophoresis (SDS-PAGE) and western blot-based approach to the antibody-uptake assay that exploits the strong affinity between biotin and streptavidin. Instead of incubating cells with fluorophore-conjugated antibodies to monitor antibody uptake, our assay involves incubating cells with biotinylated antibodies, processing the cell lysates for western blot, and probing the membrane with detectably conjugated streptavidin. From preparation to quantification, this protocol requires less hands-on time than other approaches and is amenable to small-scale drug or siRNA screens. Here, we demonstrate the utility of our approach using the well-characterized misfolded GPI-AP, YFP-tagged C179A mutant of prion protein (YFP-PrP*), as our model substrate. YFP-PrP* constitutively traffics to the plasma membrane (PM), where it binds to anti-GFP antibody, and immediately undergoes endocytosis to lysosomes. To validate our protocol, we present measurements of antibody uptake under conditions known to enhance or inhibit YFP-PrP*’s traffic to the PM. Using this assay, we present new evidence that, under certain conditions, YFP-PrP* is able to undergo degradation via a pathway that does not involve exposure on the cell surface.
Key features
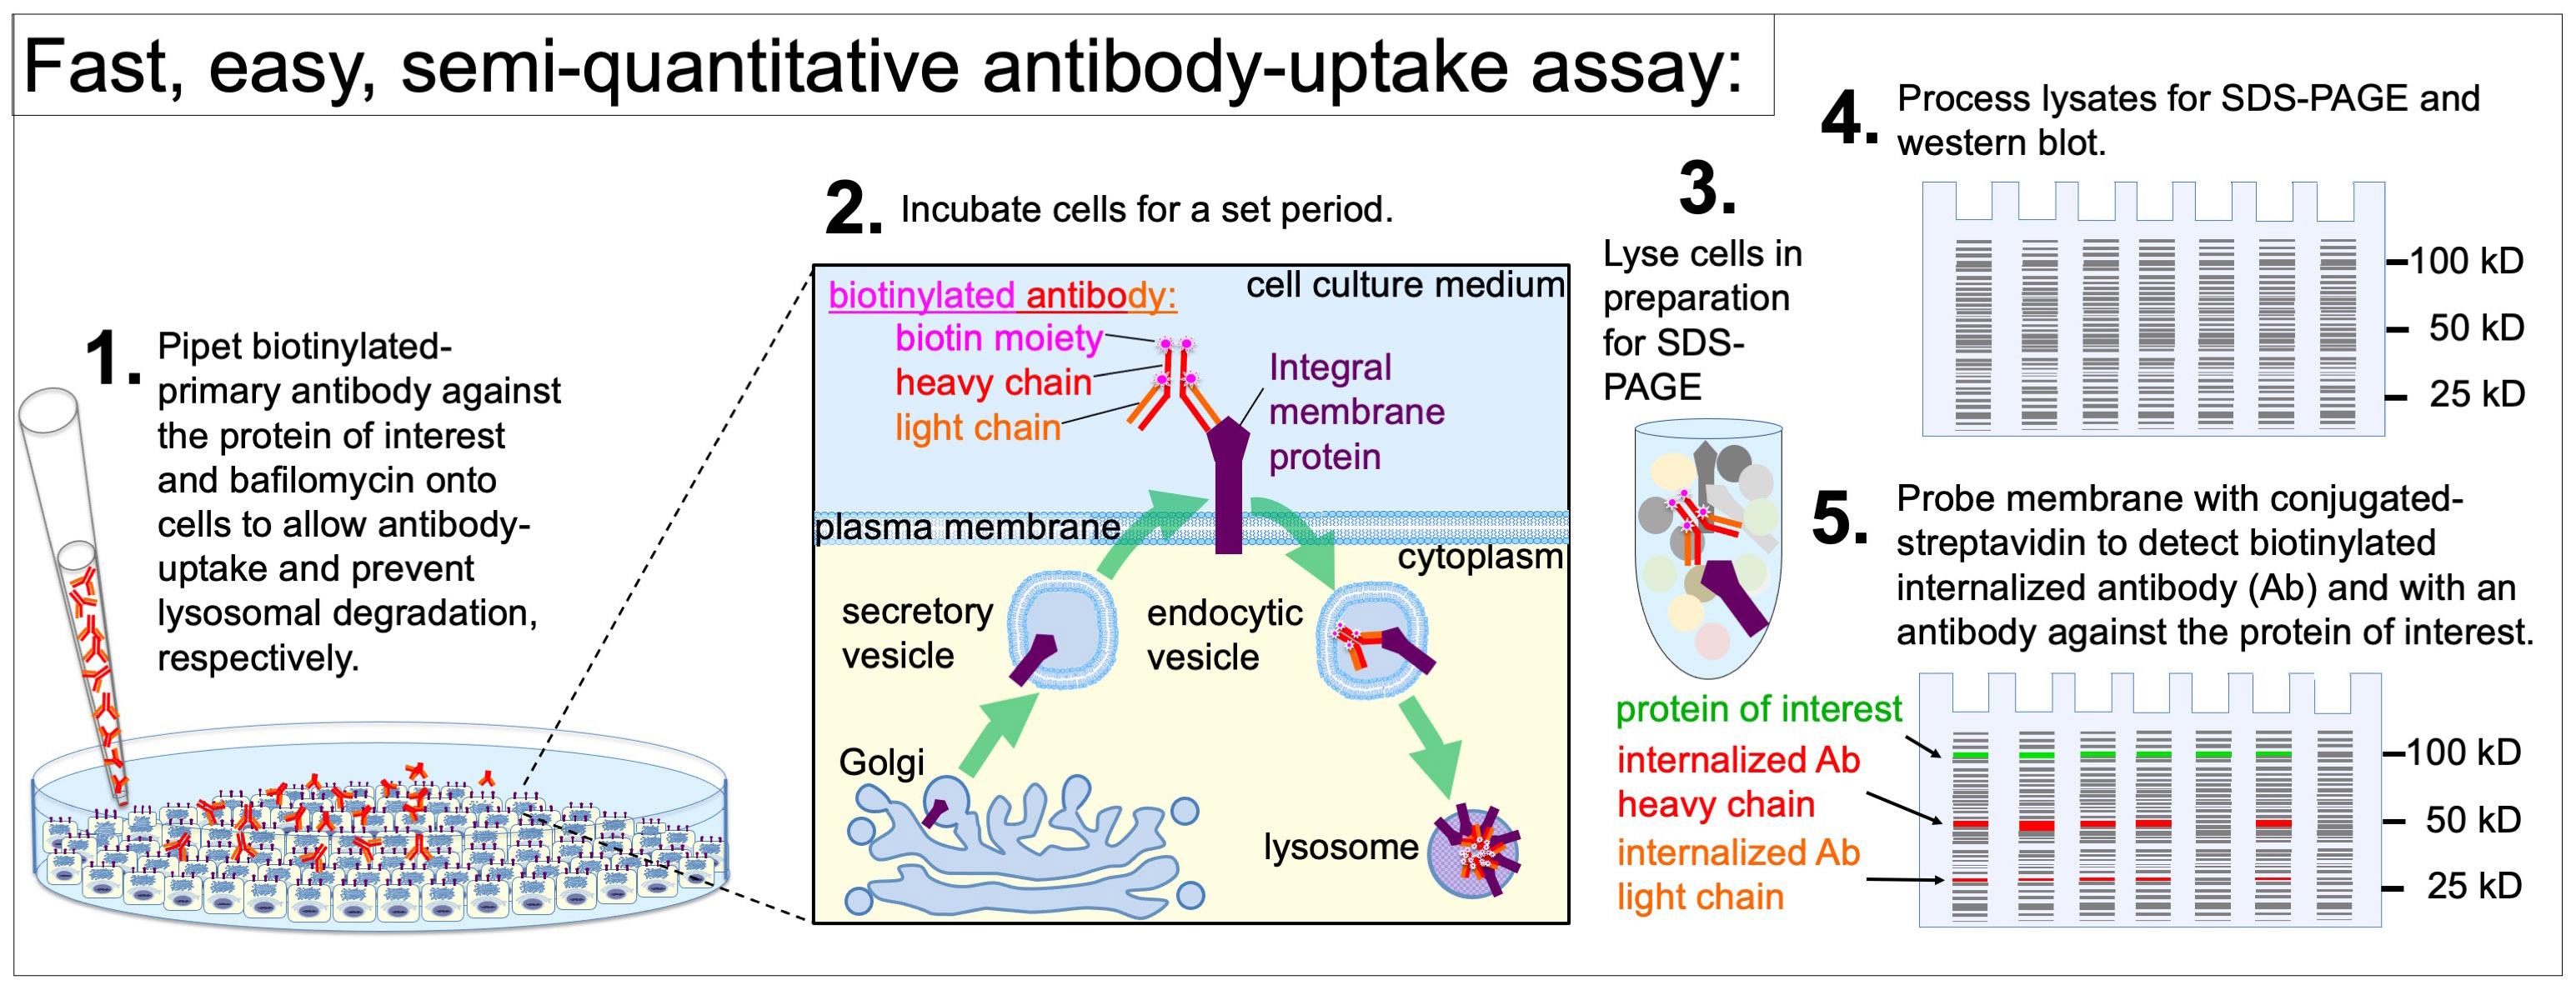
• Incubate live cells with biotinylated primary antibody and a lysosomal degradation inhibitor, process lysates for western blot, and probe the blot with detectably conjugated streptavidin.
• Fast, easy, and semi-quantitative assay to test whether integral membrane proteins are degraded through pathways involving exposure on the plasma membrane.
• Conduct screens for small molecules, siRNAs, or conditions that promote or inhibit traffic of your protein of interest through the plasma membrane.
• Pair this protocol with a synchronized trafficking assay to detect changes in the rate of proteins traversing the plasma membrane.
Keywords: Antibody uptakeGraphical overview
Background
History and concept of the antibody-uptake assay
Antibody uptake utilizes the specific binding of primary antibodies to membrane proteins that are displayed on the plasma membrane (PM) and subsequently internalized via endocytosis. Integral membrane proteins, including transmembrane proteins and glycosylphosphatidylinositol (GPI)-anchored proteins, are synthesized in the endoplasmic reticulum (ER) and are able to traffic from the “cradle” to the “grave” by a variety of membrane trafficking pathways (Figure 1, thin black arrows and thick dark purple arrows). Antibody-uptake assays exclusively reveal whether a population of the integral membrane proteins traffic to, and is endocytosed from, the PM (Figure 1, thick purple arrows). Determining whether a population of proteins traffic to the cell surface is essential for delineating the possible trafficking pathways an integral membrane protein may take prior to degradation. Additionally, antibody-uptake assays may inform our understanding of the signal transduction pathways that regulate the secretion and internalization of integral membrane protein receptors and channels.
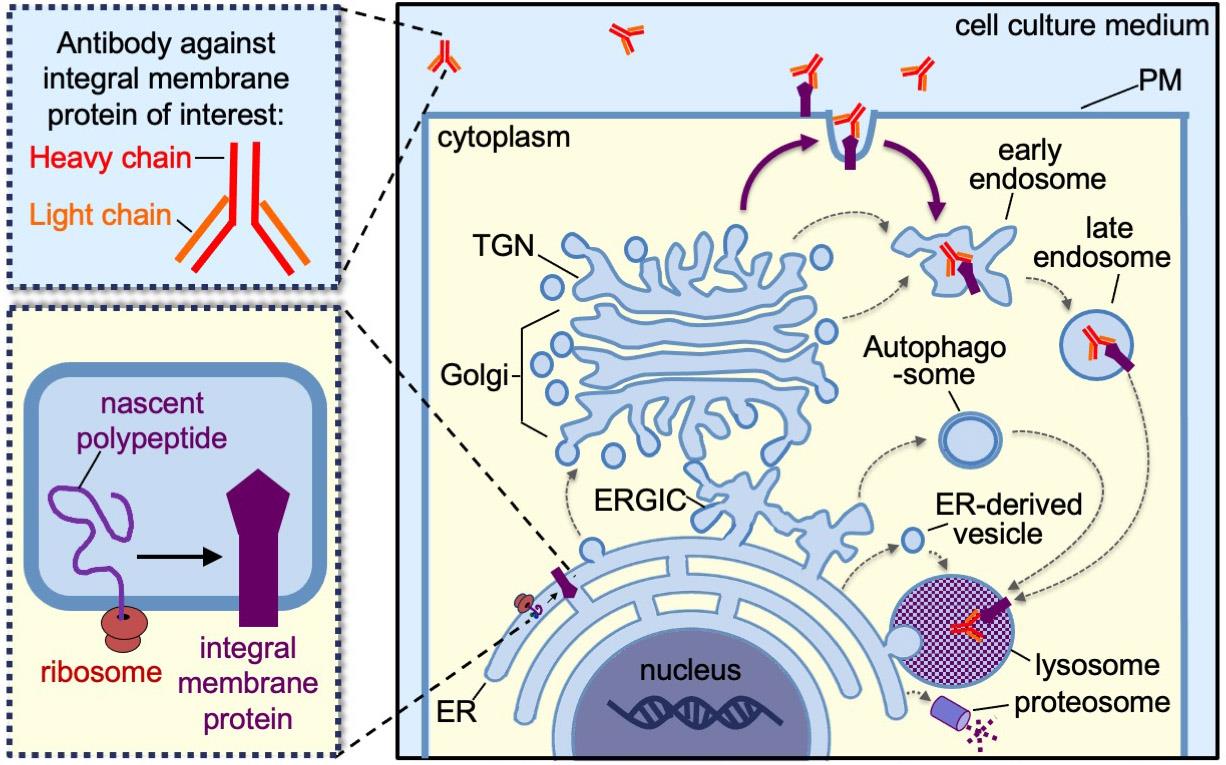
Figure 1. Schematic depicting the various trafficking pathways of an integral membrane protein from the endoplasmic reticulum, where it is synthesized (i.e., the cradle) to the lysosomes or proteosomes, where it is degraded (i.e., the grave). The thin black arrows indicate possible internal trafficking steps from one compartment to the next. The thick dark purple arrows indicate the possible trafficking steps involving transit through the PM, which specifically can be detected by antibody-uptake assays. ER, endoplasmic reticulum; ERGIC, ER–Golgi intermediate compartment; TGN, trans-Golgi network; PM, plasma membrane.
Over the past 40 years, a variety of antibody-uptake approaches have been employed to monitor the internalization of integral membrane proteins from the PM. The primary antibodies are either directly conjugated to a detectable tag (e.g., fluorophore, gold particle, radiolabel) or are unlabeled and detected by incubating lysed or permeabilized fixed cells with detectable secondary antibodies. Immunofluorescence, immunogold electron microscopy, live-cell fluorescence imaging, flow cytometry, autoradiography, and western blot have each been performed to detect the internalized primary antibodies [1–8]. Each of these approaches to detect and quantify antibody-uptake results poses distinct challenges. Quantification of fluorophore-conjugated antibody uptake using microscopy-based techniques is time-consuming. Measuring fluorescence intensity in individual cells requires imaging software for volumetric analysis and can be cost-prohibitive if a microscope is not readily available. Quantification of antibody uptake of fluorophore-conjugated antibodies by flow cytometry allows for rapid readout of large populations of cells under various conditions; however, many labs do not have ready access to a flow cytometer. Both fluorescence imaging–based and flow cytometry–based quantification may be thwarted by fluorescence quenching from fluorophore crowding or the low pH of the endocytic vesicles and lysosomes. Quantification of radioactively labeled antibody uptake by autoradiography requires designated space and equipment for radioactive work. Microscopy, flow cytometry, and radioactive work all require extensive training. By contrast, SDS-PAGE followed by western blot–based protocols using secondary antibodies to detect internalized primary antibodies utilize relatively inexpensive and standard lab equipment, require less training, and can be completed in 1 or 2 workdays. However, the standard western blot approach using primary and secondary antibodies has not provided a clear, reliable, or measurable readout for antibody uptake beyond a binary yes/no [1,7], and has not gained traction in the cell biology field. This may be in part because detection with secondary antibodies on western blot membranes depends on the internalized primary antibody maintaining antigenicity during denaturation in the lysosomes and during the subsequent cell lysis and SDS-PAGE process.
A new approach to the antibody-uptake assay
To address the practical, technical, and biological limitations of the conventional approaches to detect antibody uptake, we developed a novel approach that builds on the advantages of SDS-PAGE and western blot. Our approach exploits the extraordinarily high binding specificity and affinity between biotin and streptavidin [9–11]. The bond between streptavidin and biotin-conjugated molecules is one of the strongest naturally existing non-covalent bonds, with an equilibrium dissociation constant (KD) between 10-14 and 10-16 M [12,13]. This is stronger than most antibody–antigen interactions, which were reported by the Abcam company and academic investigators to have a KD between 10-6 and 10-9 M or, in the case of very-high-affinity antibodies, a KD of 10-12 M [14–17]. Our approach involves incubating live cells with biotinylated primary antibodies, processing the cells for western blot, and detecting antibody uptake by probing the western blot membrane with either HRP-conjugated or fluorophore-conjugated streptavidin. Biotinylated primary antibodies are available commercially or can be easily generated using biotinylation kits. Additionally, a wide selection of labeled streptavidin is commercially available. Unlike microscopy-based antibody-uptake assays that require image analysis on a cell-by-cell basis, the western blot-based antibody-uptake approach produces population-level results that are quickly quantifiable through mean band intensities normalized against the total protein in the lysates. The expression level of the target integral membrane protein can be cross-correlated with antibody uptake on the same western blot membrane by employing standard western blotting to probe for the integral membrane protein of interest. An additional advantage of our western blot–based approach is that cell lysates and western blot membranes can be preserved for extended periods at -20 °C.
Since this protocol is new and has not been previously validated, we present an extensive Validation of protocol section at the end of this manuscript. Although the Materials and reagents, Procedure, and Data analysis sections for our antibody-uptake assay apply generally to any protein of interest expressed within any cell culture model system, we include specific notes on how we performed the proof-of-principle experiments that are presented in the Validation of protocol section.
Rationale of our proof-of-principle experiments
To demonstrate the utility of this approach, we use a fluorescent protein (FP)-tagged variant of prion protein C179A (PrP*). Untagged PrP*, yellow fluorescent protein (YFP)-PrP*, cerulean fluorescent protein (CFP)-PrP*, and green fluorescent protein (GFP)-PrP* were each shown to leave the ER, traffic to the PM, and rapidly undergo endocytosis [18–22]. The FP-tag, however, does not drive the trafficking of PrP*, but merely provides a detectable label to monitor PrP* trafficking by live-cell imaging [20]. During steady-state conditions, tagged variants of PrP* undergo ER-to-Golgi export via an ER stress-inducible pathway called RESET, which is short for rapid ER stress-induced export [19,20]. After undergoing RESET, PrP* gains access to the PM [18,20]. Since the YFP-tag of YFP-PrP* is derived from and structurally similar to GFP, it is recognized by the same anti-GFP antibodies that bind GFP [20,23]. Critically, YFP-PrP* or GFP-PrP*-expressing cells were previously shown to internalize anti-GFP antibodies based on specific affinity between the anti-GFP antibody and the YFP- or GFP-tag by confocal microscopy and flow cytometry–based approaches [18–21]. In the Validation of protocol section, we present proof-of-principle experiments using anti-GFP antibodies to monitor YFP-PrP* traffic through the PM en route to lysosomes. However, we expect that this antibody-uptake protocol will be applicable to monitor any protein displaying an antigen on an extracellular domain for which there is a biotinylated primary antibody available.
Materials and reagents
Biological materials
1. Healthy cells. This protocol applies to any adherent, proliferating, or differentiated cultured cells.
Note: Since we are monitoring traffic of YFP-PrP* to the cell surface via the RESET pathway for the proof-of-principle experiments presented below in the Validation of protocol section, we opted to use normal rat kidney (NRK) cells. NRK cells were used by Satpute-Krishnan et al. in the Lippincott–Schwartz lab to identify the RESET pathway [20]. In follow-up work, we used them to further dissect the RESET pathway [18,19,22]. These NRK cells were derived from a clonal line previously characterized by the Lippincott-Schwartz lab as adherent cells and used in membrane trafficking studies [24].
Recommendations:
1. Determine the number of replicates per condition within and across experiments.
For experimental results that one plans to quantify, we recommend a minimum of three biological replicates. Each biological replicate should be executed on a different day using freshly prepared medium and drug treatments. For example, in our proof-of-principle experiments, we conducted three biological replicates to obtain measurements and perform statistical analysis (described below). If the experimentalist has little to no experience executing cell culture experiments or carrying out western blots, we recommend a minimum of three technical replicates within a single experiment. This will allow for troubleshooting in the case of varied results.
2. Include a positive control to verify that your biotinylated antibody binds to the antigen (i.e., your integral membrane protein of interest) in the context of the antibody-uptake conditions.
If there is no preexisting evidence that your integral membrane protein of interest traffics to the PM, consider overexpressing a fusion protein to test the antigen–antibody interaction. This fusion protein would include the extracellular domain of your integral membrane protein of interest (i.e., the antigen) on a known PM-resident protein and function as a positive control.
To validate our protocol, we used the following cells for our positive controls:
a. YFP-PrP* NRK cells: These NRK cells stably express the well-characterized RESET substrate, YFP-PrP*, at physiological levels, similar to the prion protein in mouse brain lysate [19,20]. YFP-PrP* includes an N-terminal prolactin signal sequence to ensure ER-translocation, a yellow fluorescent protein (YFP) tag, followed by the Syrian hamster prion protein (PrP) mature domain containing a C179A point mutation [20]. YFP-PrP* and GFP-PrP* were each previously shown to bind and internalize anti-GFP antibodies upon accessing the PM [18–21].
b. YFP-PrP* NRK cells treated with thapsigargin (TG): TG-treatment of YFP-PrP* NRK cells was shown to increase the flux of YFP-PrP* traffic to the PM and antibody uptake when compared to untreated YFP-PrP* NRK cells [20].
3. Include negative controls to determine baseline antibody uptake. This can be cells treated with RNAi or CRISPR knockout technology to remove the integral membrane protein of interest, or cells treated with chemical or siRNA-based inhibitors of the secretory pathway to prevent the integral membrane protein of interest from accessing the PM.
To validate our protocol, we used the following cells for our negative controls:
a. NRK cells: These untransfected cells serve as a negative control for anti-GFP antibody uptake because they do not express an FP-tagged protein. They are the “parental” cell line from which the YFP-PrP* NRK stable cell line was derived.
b. YFP-CD3δ NRK cells: These NRK cells stably express YFP-CD3δ, a well-characterized ER-associated degradation (ERAD) substrate [25,26], at similar levels to the expression of YFP-PrP* in YFP-PrP* NRK cells [19,20]. They serve as a negative control because YFP-CD3δ would not be expected to undergo ER export but is instead degraded at the ER [25,26].
c. YFP-PrP* NRK cells treated with BRD4780: BRD4780-treatment of YFP-PrP* NRK cells was shown to inhibit RESET of YFP-PrP* [18]. Thus, BRD4780 would be expected to block traffic to the PM and thereby prevent anti-GFP antibody uptake.
d. YFP-PrP* NRK cells treated without biotinylated anti-GFP antibody in media: These cells would not be expected to show a streptavidin-binding band by western blot, because no biotinylated antibodies would have been added in the medium for the cells to uptake.
Reagents
Cell culture
1. Cell culture medium
a. Dulbecco’s modified Eagle's medium (DMEM) (Corning, catalog number: 17-205-CV)
b. Fetal bovine serum (FBS) (Corning, catalog number: 35-011-CV)
c. L-glutamine (Corning, catalog number: 25-005-CL)
2. Trypsin (Corning, catalog number: 25-051-CI)
3. Biotinylated primary antibody: biotinylated goat anti-GFP antibody (Genetex, catalog number: GTX26658)
4. Optional: Inducers or inhibitors that promote or block the protein-of-interest’s traffic to the PM. We used the following:
a. Inducer of ER-export via RESET: Thapsigargin (Sigma, catalog number: 586005)
b. Inhibitor of ER-export via RESET: BRD4780, also called AGN1924 hydrochloride (Tocris, catalog number: 1072)
5. Lysosomal degradation inhibitor to prevent degradation of biotinylated antibody and protein of interest: bafilomycin A1 (LC Laboratories, catalog number: B-1080)
6. Wash buffer to wash away excess non-internalized antibody: phosphate-buffered saline (PBS), pH 7.4 (KD Medical, catalog number: RGF-3210)
Western blot
7. 2× Laemmli sample buffer (ready-made 2× sample buffer) (Bio-Rad, catalog number: 1610737)
8. Reducing agent to break disulfide bonds for optimal SDS PAGE and western blot: tris(2-carboxyethyl)phosphine (TCEP) (Sigma, CAS number: 51805-45-9, catalog number: 646547)
9. Protein gels for SDS-PAGE: ready-made 12% Mini-PROTEAN® TGX Stain-FreeTM 15-well gels (Bio-Rad, catalog number: 4568046)
10. Molecular weight ladder: Precision Plus ProteinTM All Blue PreStained Protein Standards (Bio-Rad, catalog number: 1610373)
11. Transfer reagents for western blot: Transfer kit, including PVDF membrane (low fluorescence, 0.45 μm) that requires ethanol for activation, filter paper, and 5× transfer buffer (Bio-Rad, catalog number: 1704275) that requires supplementation with ethanol, 200 Proof (Sigma, catalog number: 459829-2L)
12. Gel running buffer: Tris glycine SDS, pH 8.3 (Santa Cruz Biotechnology, catalog number: sc-296527)
13. Membrane washing buffer: Tris-buffered saline 10×, pH 7.4 (Santa Cruz Biotechnology, catalog number: sc-362308) supplemented with Tween® 20 (Sigma, catalog number: P1379-1L)
14. Blocking buffer: EveryBlot blocking buffer (Bio-Rad, catalog number: 12010020)
15. Labeled streptavidin to detect the internalized biotinylated primary antibody: DyLight800-conjugated streptavidin (Streptavidin-DyLight800, Bio-Rad, catalog number: STAR152D800GA); an alternative is HRP-conjugated streptavidin (Proteintech, catalog number: SA-0000-10)
16. Enhanced chemiluminescence reagents to detect HRP-conjugated streptavidin or secondary antibodies: Chemiluminescence, long duration (Clarity ECL, Bio-Rad, catalog number: 1705061) and chemiluminescence, high sensitivity (Clarity Max ECL, Bio-Rad, catalog number: 1705062)
Solutions
1. Complete DMEM (see Recipes)
2. Thapsigargin (TG) (see Recipes)
3. BRD4780 (also called AGN192403 hydrochloride) (see Recipes)
4. Bafilomycin A1 (see Recipes)
5. Biotinylated goat anti-GFP antibody (see Recipes)
6. 2× Laemmli sample buffer (2× SB) + tris(2-carboxyethyl)phosphine (TCEP) (see Recipes)
7. Tris glycine SDS (see Recipes)
8. TBST (see Recipes)
9. Streptavidin-DyLight800 (see Recipes)
Recipes
1. Complete DMEM
10% FBS and 2 mM L-glutamine in DMEM
2. Thapsigargin (TG)
0.1 μM TG in complete DMEM
3. BRD4780 (also called AGN192403 hydrochloride)
100 μM in complete DMEM
4. Bafilomycin A1
500 nM bafilomycin A1 in complete DMEM
5. Biotinylated goat anti-GFP antibody
1 μg/mL in complete DMEM
6. 2× Laemmli sample buffer (2× SB) + tris(2-carboxyethyl)phosphine (TCEP)
5 mM TCEP in 2× SB
7. Tris Glycine SDS
0.025 M Tris, 0.192 M glycine, and 0.1% SDS at pH 8.3
8. TBST
250 mM Tris, 27 mM KCl, 1.37 M NaCl at pH 7.4 with 0.1% Tween® 20
9. Streptavidin-DyLight800
Diluted 1:5,000 in EveryBlot Bio-Rad blocking buffer
Laboratory supplies
1. 10 cm tissue culture-treated dish (VWR, catalog number: 25382-428)
2. 6-well tissue culture-treated plates, sterile, flat-bottom wells (Genesee, catalog number: 25-105MP)
3. Gel loading tips, 1–200 μL pipette tip for gel loading (Bio-Rad, catalog number: 12021140)
4. Boil-proof microfuge tubes (Genesee Scientific, catalog number: 24-282C)
Equipment
1. Gel electrophoresis apparatus (Mini-PROTEAN® Tetra Electrode Assembly) (Bio-Rad, catalog number: 1658037)
2. Western blot transfer apparatus (Trans-Blot Turbo Transfer System) (Bio-Rad, catalog number: 1704150)
3. Gel and western blot documentation apparatus (ChemiDocTM MP Imaging System) (Bio-Rad, catalog number: 12003154)
Software and datasets
1. FIJI “Fiji is just ImageJ” (National Institutes of Health)
2. Excel (Microsoft)
3. Prism (GraphPad)
Procedure
A. Cell culture and preparation
1. Thaw cells into a 10 cm tissue culture-treated dish in standard cell culture medium.
Note: To validate our protocol, we used NRK, YFP-PrP* NRK, and YFP-CD3δ NRK cells cultured in DMEM supplemented with 10% FBS and 2 mM L-glutamine. We did not include penicillin/streptomycin. We cultured the cells at 37 °C in 5% CO2 and maintained them in the growth phase.
2. Split the cells into a multi-well tissue culture-treated dish. Depending on the cell type, split them at the optimal confluency for growth or differentiation. For our validation experiments, we used a 6-well tissue culture-treated dish. We split cells so they were at 35% confluency and allowed the cells to double over 24 h to approximately 70% confluency.
Notes:
1. The optimal tissue-culture treatment may depend on the cell type. For example, we have observed that NRK cells are naturally adherent and adhere to untreated glass or commercially available tissue culture-treated plastic in under 1 h after trypsinization. However, other cell types may require the dish to be prepared with additional coatings, such as extracellular matrix proteins or poly-L-lysine.
2. Prior to performing the antibody-uptake experiment, we recommend optimizing cell culture seeding, incubation, and splitting procedures, because these depend on the cell type. For example, we have observed NRK cells double within 24 h and do not require being cultured at high densities (e.g., they can easily form colonies when single cells are seeded alone in a well). However, other cell types need to be seeded at greater than 50% confluency to survive. The growth behavior of NRK cells under our standard culturing conditions is predictable, allowing us to split and seed them based on confluency. However, for cell types that have limited proliferative capacity such as primary cells or iPSC-derived differentiated cells, an absolute cell count may be required to seed the cells for optimal cell culture viability and antibody-uptake results.
B. Treatment with biotinylated antibody diluted in culture media and cell lysis
1. Check cells under a phase microscope on the day of the experiment to ensure healthy growth and confluency. We performed our experiments on cells that were 70% confluent in order to avoid overcrowding and contact inhibition.
2. Prepare all media in advance of treating cells. We allowed media to warm up to room temperature for 15 min before preparing treatments. We prepared the following treatments:
a. +Baf condition: Complete medium with 500 nM bafilomycin A1.
b. +Baf +Ab condition: Complete medium with 500 nM bafilomycin A1 and 1 μg/mL biotinylated antibody.
c. +Baf +TG +Ab condition: Complete medium with 500 nM bafilomycin A1, 0.1 μM TG, and 1 μg/mL biotinylated antibody.
d. BRD4780 pretreatment media: Complete medium with 100 μM BRD4780.
e. +BRD4780 +Baf +Ab condition: Complete medium with 100 μM BRD4780 added to cells for a 3 h pretreatment, followed by the addition of 500 nM bafilomycin A1 and 1 μg/mL biotinylated antibody.
f. +BRD4780 +Baf +BRD4780 +TG +Ab condition: Complete medium with 100 μM BRD4780 added to cells for a 3 h pretreatment, followed by the addition of 500 nM bafilomycin A1, 0.1 μM TG, and 1 μg/mL biotinylated antibody.
Note: Depending on the cell type, it may be necessary to warm the medium to 37 °C before adding medium and antibodies to cells.
3. Aspirate existing culture media and add prepared media containing bafilomycin, +/- biotinylated antibody, and +/- drug modulators.
Notes:
1. We included bafilomycin A1 in each treatment. Bafilomycin A1 is a potent inhibitor of vacuolar ATPases that prevents acidification of lysosomes and consequently prevents lysosomal degradation [27]. Blocking lysosomal degradation of the internalized biotinylated antibody is necessary for subsequent western blot analysis.
2. Specifically for +BRD4780 treatments, we pretreated cells with 100 μM BRD4780 for 3 h to induce degradation of TMED9, which we previously showed causes complete inhibition of RESET [18]. After pretreating the cells with BRD4780 for 3 h, we added bafilomycin A1 and biotinylated anti-GFP antibody or bafilomycin A1, TG, and biotinylated anti-GFP antibody to the culture medium for an additional 2 h.
4. Incubate cells for 2 h at 37 °C, 5% CO2 (normal cell culture conditions).
5. Remove cells from the incubator and aspirate all culture media.
6. Wash cells three times with PBS prechilled to 4 °C.
Critical: During each of the three washes, rock the dish back-and-forth three times to wash away biotinylated antibody that was not internalized by the cells.
7. Add lysis buffer to cells, scrape with precut pipette tips, and collect lysates in prelabeled boil-proof microfuge tubes.
Note: We used 200 μL of 2× SB+TCEP pipetted directly into each well of the 6-well plates to lyse cells. We precut p200 pipette tips using standard desk scissors at approximately the 10 μL point at a 45° angle to increase the bore size and the surface area for scraping the cells. However, the key is to scrape the surface of the well and gather the lysate together to move it into boil-proof microfuge tubes.
8. Boil the lysates for 1 min and vortex for 5 s three times in order to break up all of the DNA and solubilize the lysate.
9. Store lysates at -20 °C.
C. Western blot
Note: Western blot procedure may be conducted based on the individual lab’s specific western blot workflows.
1. Allow frozen samples stored at -20 °C to thaw at room temperature (approximately 5 min).
2. Vortex all samples briefly (approximately 5 s) to ensure a homogenous mixture.
Note: If samples were collected in lysis buffer (i.e., RIPA buffer) instead of directly in sample buffer (i.e., Laemmli buffer with reducing agent), add appropriate volumes of western blot sample buffer to each sample.
3. Load samples into the prepared polyacrylamide gel in a gel running apparatus.
Note: We use Bio-Rad Mini-PROTEAN Protein electrophoresis equipment and tris-glycine SDS as running buffer.
Critical: Ensure equal or near-equal loading of total protein across all lanes. We do this by seeding the same number of cells in each well at the start of the experiment. Alternatively, immediately after cell lysis, one can employ total protein normalization techniques (e.g., BCA assay).
4. Run gel for approximately 60–75 min at 100 V.
Note: If using Bio-Rad’s Stain-FreeTM system, activate and collect an image of Stain-FreeTM gel to detect total protein.
5. Transfer the gel to an activated PVDF membrane for blotting.
Note: After transfer, image the Stain-FreeTM blot. The Stain-FreeTM system provides an image of total protein, which we use as a loading control. If the Stain-FreeTM system is not available, stain the blot with Ponceau S to image total protein loaded into each lane. Ponceau S washes away during the following steps. We recommend using a low fluorescence membrane to improve the western blot signal, especially when using fluorescent secondary antibodies.
6. Block membrane.
Note: We used Bio-Rad’s EveryBlot blocking buffer for 10 min at room temperature on a gentle shaker. An alternative is 2% bovine serum albumin (biotin-free) in TBST.
Critical: Do not use milk as a blocking buffer. Milk naturally contains biotin, which may interfere with the streptavidin binding and blotting procedure.
7. Probe the blot with streptavidin that was pre-conjugated to a detectable label. Dilute the streptavidin in blocking buffer for 1 h at room temperature with gentle shaking.
Note: We used DyLight800-conjugated streptavidin and diluted it at 1:5,000 in Bio-Rad’s EveryBlot blocking buffer. An alternative is HRP-conjugated streptavidin. An advantage of probing DyLight800-conjugated streptavidin is that the same blot may be reprobed with an antibody against your protein of interest and detected using an HRP-conjugated secondary with no cross-talk between western blot images. Alternatively, run the lysates on two identical gels, and probe one with HRP-streptavidin and the other with the primary antibody against your protein of interest for a standard western blot procedure using an HRP-conjugated secondary antibody.
8. Wash the blot three times for 10 min each time with TBST.
9. Image the streptavidin blot with a gel documentation imaging system, selecting exposure times that allow the light collected to remain within the camera’s dynamic range.
Note: We use Bio-Rad’s ChemiDoc MP gel documentation imaging system to collect images of the DyLight 800 or chemiluminescence. This system displays an indicator when pixels are oversaturated due to excessively long exposure times.
Note: Avoid saturating the pixels during image collection. Stay within the camera’s dynamic range of the gel documentation system because saturated pixels are not quantifiable.
Optional: Reprobe using a standard western blot procedure for your integral membrane protein of interest.
Data analysis
To measure western blot bands, we utilized the following step-by-step procedure:
1. After collecting unsaturated western blot images, download .tif images onto a computer or laptop with Fiji installed.
2. Open .tif file corresponding to the streptavidin blot in Fiji.
Note: If needed, rotate the blot to straighten it. Ensure bands appear white and background appears black by inverting if needed.
3. Draw a rectangle (bounding box) that encompasses the largest band of interest in the blot (see Figure 2).
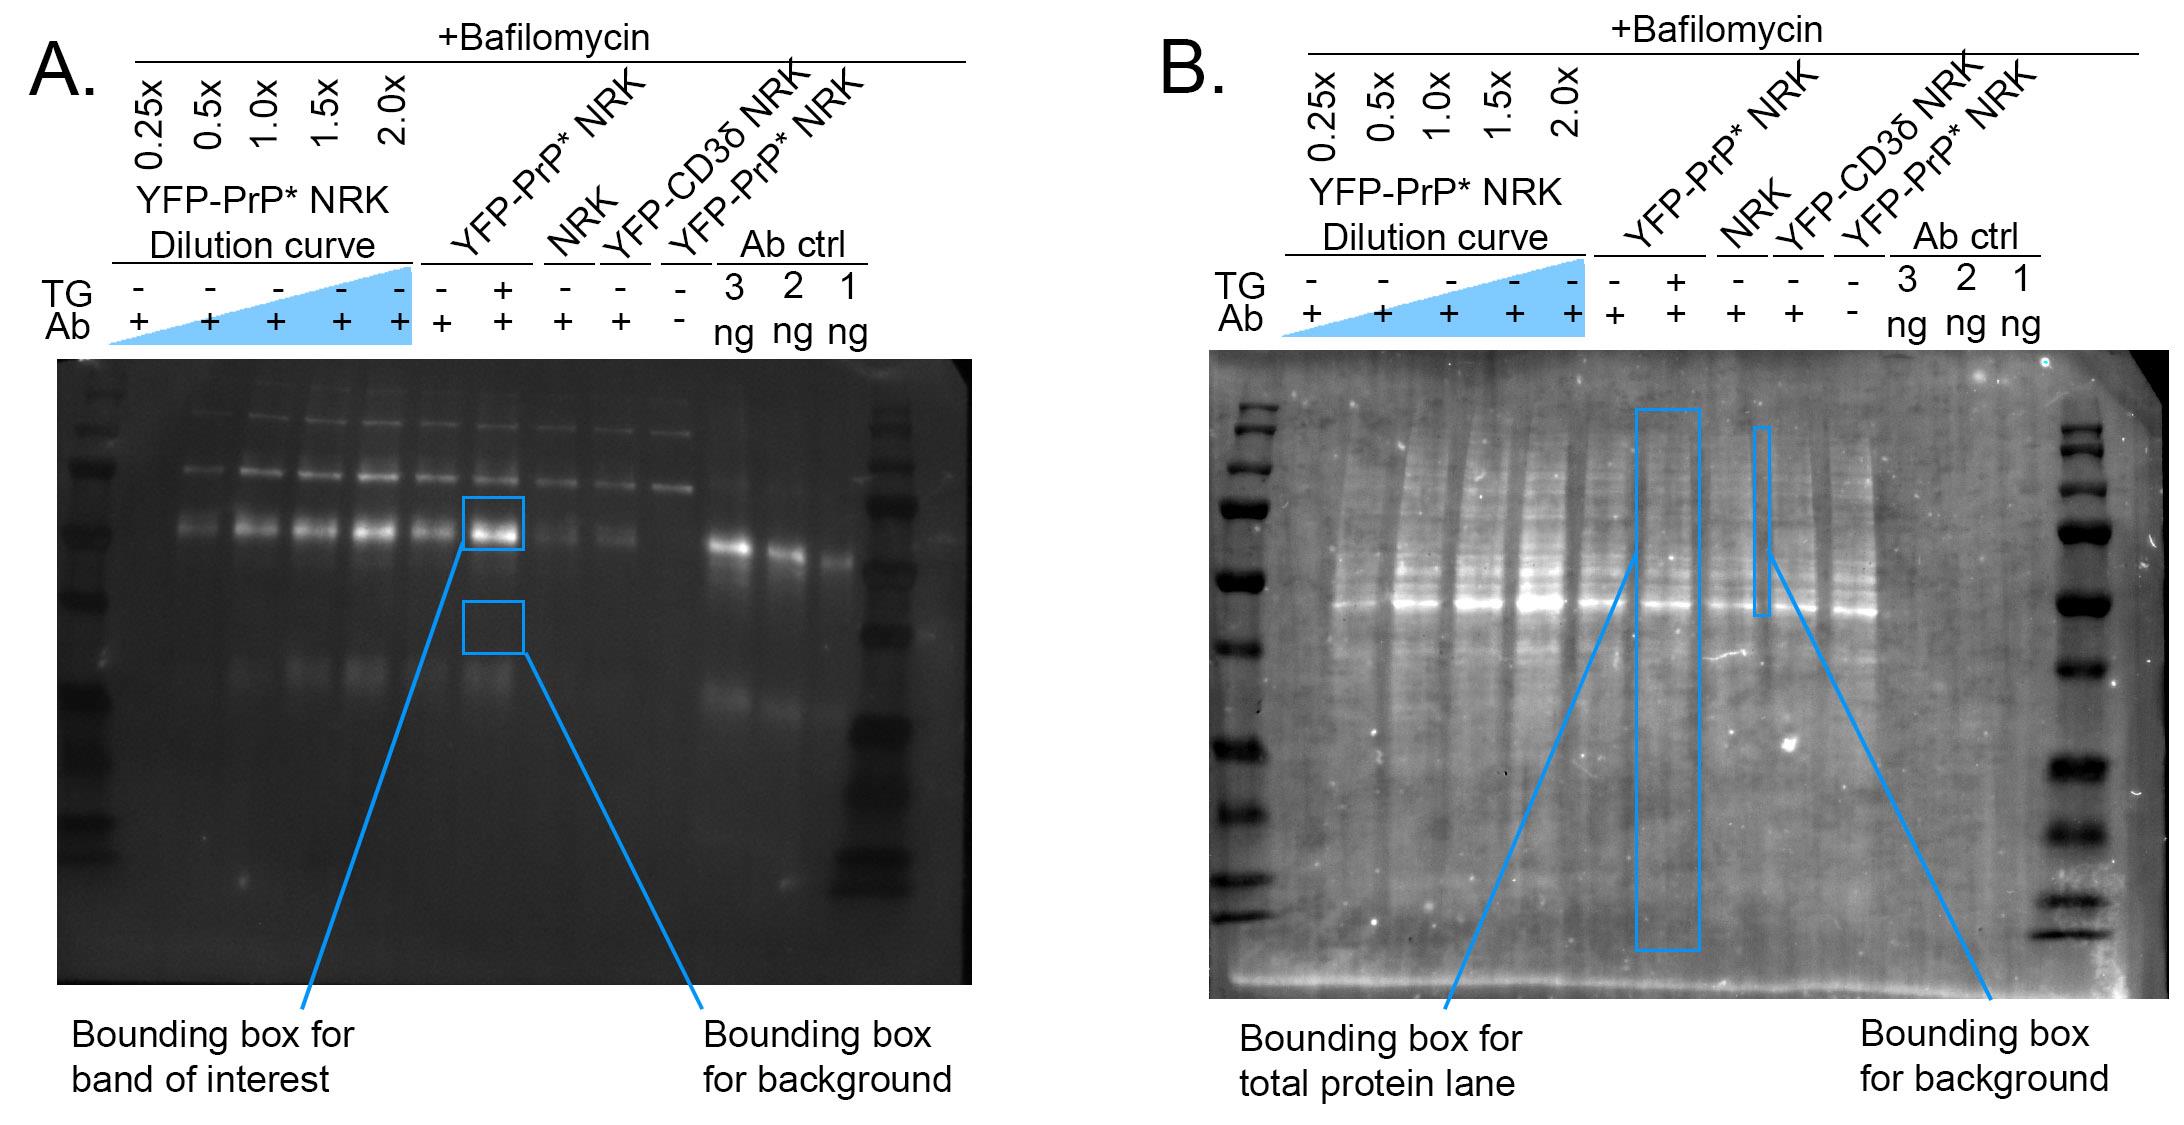
Figure 2. Example of western blot band and background measurements. (A) Depiction of the rectangular bounding box used to measure the mean gray value of western blot bands of interest and background measurements. (B) Depiction of the rectangular bounding box used to measure the mean gray value of stain-free blot bands of interest representing total protein loaded and background measurements.
4. Save as region of interest (ROI).
5. Measure the mean gray value (MGV) of each band of interest using the saved ROI. In Fiji, drag the ROI rectangle over each band and press “M” to measure.
Note: Mean gray value is the average intensity of all the pixels within a given area. Therefore, MGV is a measure of blot band intensity in this case.
6. Measure the mean gray value (MGV) of the background for each lane by measuring two bounding boxes below the band of interest (Figure 2).
7. Copy measurements from Fiji to the Excel worksheet to perform calculations.
8. Generate background-subtracted MGV for each band of interest by subtracting background MGV from the back of interest MGV for each lane.
9. To normalize to total protein loaded, repeat steps 2–8 with the .tif file of loading control (stain-free blot, Ponceau S blot, or housekeeping protein blot). Then divide the background-subtracted MGV of the band of interest by the background-subtracted loading control. This is the normalized, background-subtracted MGV of the band of interest.
Note: We used Bio-Rad’s Stain-FreeTM blot system to show the total protein loaded.
10. To normalize by one condition and therefore reflect all other conditions as a multiple, fraction, or percentage of the baseline condition, divide the background-subtracted MGV of the band of interest of each lane by the baseline condition.
Note: In our experiments, YFP-PrP* +Baf +Ab is our baseline condition. The internalized antibody heavy-chain band for this condition is expressed as 1 on all graphs. Therefore, the internalized antibody heavy-chain bands for all other conditions are expressed as a multiple, fraction, or percentage of this condition. For example, 2.5 represents 250% the intensity of the internalized antibody heavy-chain band YFP-PrP* +Baf +Ab. Similarly, 0.10 represents 10%.
11. After normalizing, statistical testing can be run by transferring the data from Excel into GraphPad Prism.
Note: General familiarity with Prism GraphPad and a background in statistical analysis are helpful for conducting quantifications. We recommend conducting three biological replicates for each quantified experiment.
To conduct statistical testing on the analyzed data, we followed the following step-by-step procedure:
1. Before beginning, it is important to understand that data generated from western blots is semi-quantitative. Therefore, protein expressions are only relative to each other and can only be described as a fold-change more or less than another condition. Due to this semi-quantitative nature and small sample sizes (typically n = 3 replicates), careful consideration must be taken before performing any statistical testing.
2. After transferring data from Excel to Prism, plot data with appropriate descriptive statistics to examine variance and skew. It is important to evaluate variance and skew to determine appropriate statistical testing (if any).
3. Conduct statistical tests and multiple comparisons if applicable.
Note: We have chosen to compare all conditions to our control condition (YFP-PrP* +Baf +Ab). We have decided to use an ordinary one-way ANOVA with Dunnett’s correction for multiple tests. We chose this test because our data is relatively normally distributed and the variances are approximately equal across experimental conditions. We visually assessed the data to determine that the data follow a bell curve fit to the histogram of the individual points of each replicate experiment. We chose to utilize this visual histogram method over statistical tests for normalcy (e.g., Kolmogorov–Smirnov or Shapiro–Wilk test) and variance equality (e.g., F-test or Bartlett’s test) because these statistical tests are not generally appropriate for such small sample sizes. Alternatively, if comparing only two groups, a t-test could be used. If the data does not have equal variance and is skewed, then comparing confidence intervals may be more appropriate. Additionally, a one sample t-test or Wilcoxon test to compare one experiment condition to a control condition with a set value (i.e., 1 after normalization) could be used.
4. If statistical significance is found, include asterisks to denote this finding on the graph.
Note: Specific statistical tests that we used are denoted in the figure legend accompanying each graph. Importantly, some differences may be statistically insignificant but still demonstrate meaningful biological differences.
Validation of protocol
In order to interrogate and validate our new protocol, we have taken advantage of two key features of PrP* trafficking. First, tagged variants of PrP* were previously documented to be rapidly endocytosed upon arriving at the PM [20,21]. Second, rates of PrP* trafficking from the ER to the PM were shown to be increased or decreased by small molecule drugs [18–20]. Thus, by controlling PrP* trafficking from the ER to the PM, we are able to control antibody uptake in predictable ways.
During steady-state conditions, YFP-PrP* is slowly released from the ER-resident chaperone, calnexin, for secretion to the PM via an ER-stress inducible ER-to-Golgi export pathway called RESET, which is short for rapid ER-stress induced export [19,20]. At the PM, YFP-PrP* gets rapidly endocytosed and traffics to lysosomes [20]. Flux through the RESET pathway and subsequent access to the PM are rapidly enhanced with the chemical ER stressor, thapsigargin (TG), which triggers dissociation of YFP-PrP* from calnexin [18–20]. Expression of the p24-family members TMED9, TMED2, and TMP21 is required for the ER-to-Golgi export of YFP- or GFP-PrP* via RESET [18,20,21]. BRD4780, which degrades the essential RESET factors TMED9, TMED2, and TMP21 [18,28–31], inhibits RESET of YFP-PrP* [18].
To demonstrate that our western blot–based approach to monitor antibody uptake provides a measurable readout for protein trafficking through the PM, we exploit the following established discoveries:
1. Untransfected “parental” NRK cells do not efficiently internalize anti-GFP antibody, while YFP-PrP* NRK cells do internalize anti-GFP antibody (Figure 3A, B) [20]. This implicates the direct interaction between the anti-GFP antibody and the cell surface–exposed YFP-tag of YFP-PrP*. Thus, we expect to see no anti-GFP antibody uptake in parental NRK cells (Figure 3A), but some antibody uptake in YFP-PrP* NRK cells (Figure 3B).
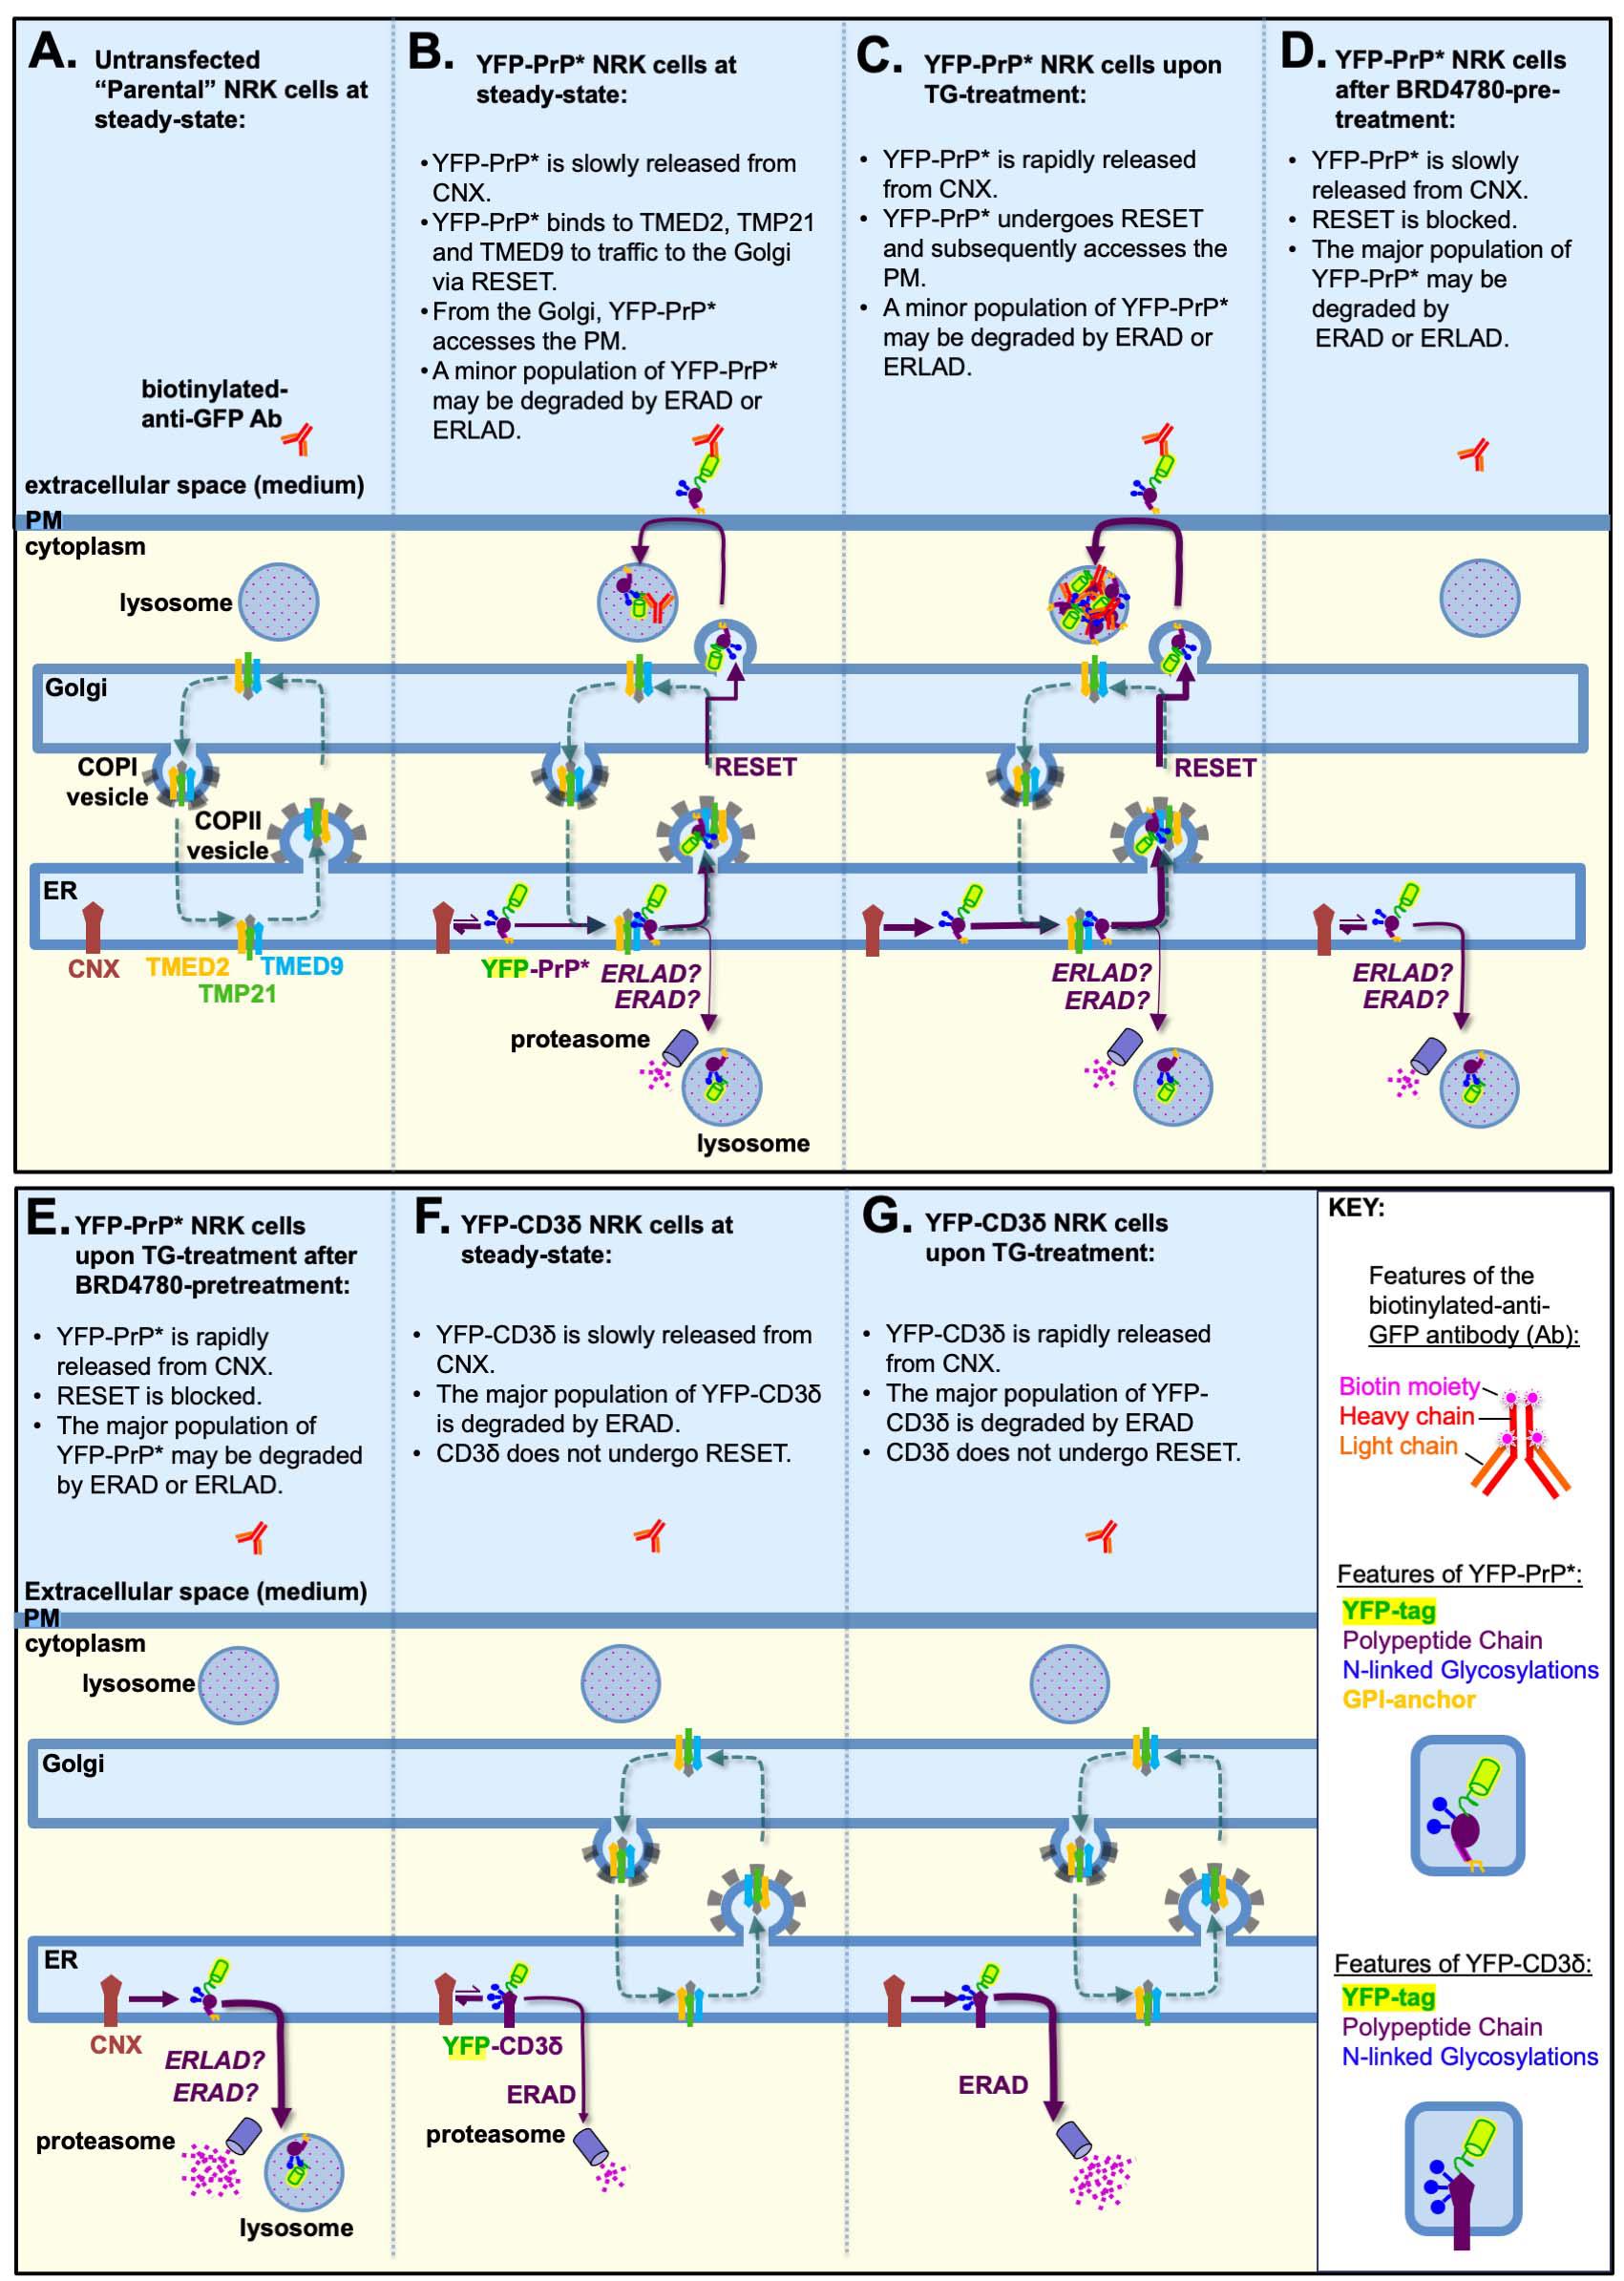
Figure 3. Model depicting the expected antibody-uptake results based on previously published experiments. (A–G) Starting from the left side of the image, each shape is labeled the first time that it appears in the figure. The “KEY” provides a magnified view of the features of the biotinylated primary antibody, YFP-PrP*, and YFP-CD3δ. The p24-family members, TMED9, TMED2, and TMP21, are depicted to hetero-oligomerize with each other and possibly other p24-family members, and constitutively cycle between the ER and Golgi [35–37], unless they are selectively degraded upon BRD4780-treatment [28–30]. Calnexin (CNX) is an ER-resident chaperone [38–41]. (B–E) The italicized “ERAD? ERLAD?” indicates that a role for these degradation pathways was not previously detected or investigated. (A) Parental (untransfected) NRK cells would not be expected to internalize detectable levels of anti-GFP antibodies because they do not express an FP (e.g., YFP) tagged integral membrane protein (e.g., YFP-PrP*). (B) During steady-state conditions in YFP-PrP* NRK cells, CNX strongly associates with the misfolded GPI-anchored protein YFP-PrP*. Occasionally, CNX releases YFP-PrP* and YFP-PrP* engages with the p24-family members to undergo ER-to-Golgi export via the RESET pathway. From the Golgi, YFP-PrP* gains access to the cell surface, where it can bind and internalize anti-GFP antibodies. (C) Thapsigargin (TG)-treatment induces rapid release of the entire population of YFP-PrP* from CNX for the RESET pathway, allowing for increased anti-GFP antibody uptake. (D) Three-hour BRD4780-pretreatment shuts down the RESET pathway by inducing the degradation of the requisite RESET factors, TMED9, TMED2, and TMP21. Thus, BRD4780-pretreatment would be expected to block constitutive turnover of YFP-PrP* via RESET and thereby prevent anti-GFP antibody uptake. (E) Three-hour BRD4780-pretreatment of YFP-PrP* NRK cells shuts down RESET. Thus, coincubation of BRD4780-pretreated YFP-PrP* NRK cells with TG, which forces YFP-PrP* release from CNX, would be expected to increase the rate of YFP-PrP* degradation via an alternate internal pathway. (F) During steady-state conditions, CNX occasionally releases the integral membrane protein, YFP-CD3δ. However, YFP-CD3δ is a well-characterized ERAD substrate that was shown not to undergo ER-export or RESET. Thus, we expect that YFP-CD3δ would not access the cell surface and internalize the anti-GFP antibody. (G) TG-treatment is known to increase the rate of ERAD of YFP-CD3δ. YFP-CD3δ does not undergo RESET and therefore would not be expected to internalize anti-GFP antibody.
2. Increasing the flux of YFP-PrP* through the RESET pathway with TG-treatment consequently increases the rate of anti-GFP antibody uptake (Figure 3C) [20]. Thus, we expect to see an increase in anti-GFP antibody uptake by YFP-PrP* NRK cells that are treated with TG (Figure 3C) when compared to untreated YFP-PrP* cells (Figure 3B).
3. BRD4780 inhibits the traffic of YFP-PrP* through the RESET pathway [18]. Thus, we expect that BRD4780 treatment of YFP-PrP* NRK cells would block anti-GFP antibody uptake during steady-state or TG-induced ER stress conditions (Figure 3D, E).
4. YFP-tagged version of the classic ERAD substrate CD3δ, called YFP-CD3δ [32], remains in the ER for constitutive or TG-induced ERAD [25,32–34]. Therefore, we expect that YFP-CD3δ would not internalize anti-GFP antibodies in untreated or TG-treated YFP-CD3δ NRK cells (Figure 3F, G).
To validate our protocol, we first tested whether internalized anti-GFP antibody can be detected in cells. We compared cell lysates of YFP-PrP* NRK cells treated with bafilomycin A1 with or without anti-GFP antibody diluted in media (+Baf +Ab vs. +Baf –Ab; Figure 4, lanes 1 and 2) against anti-GFP antibody directly dissolved into the sample buffer (Figure 4, lane 3). We probed the blot with an antibody against GFP to detect YFP-PrP* and with Streptavidin-DyLight800 to detect the biotinylated antibody heavy and light chains. Critically, we were able to detect the antibody bands specifically in the lanes where the antibody was included. Taken together, the biotinylated primary antibody that has been internalized into cells is readily detectable by SDS-PAGE and western blot when using streptavidin to probe the blot (Figure 4).
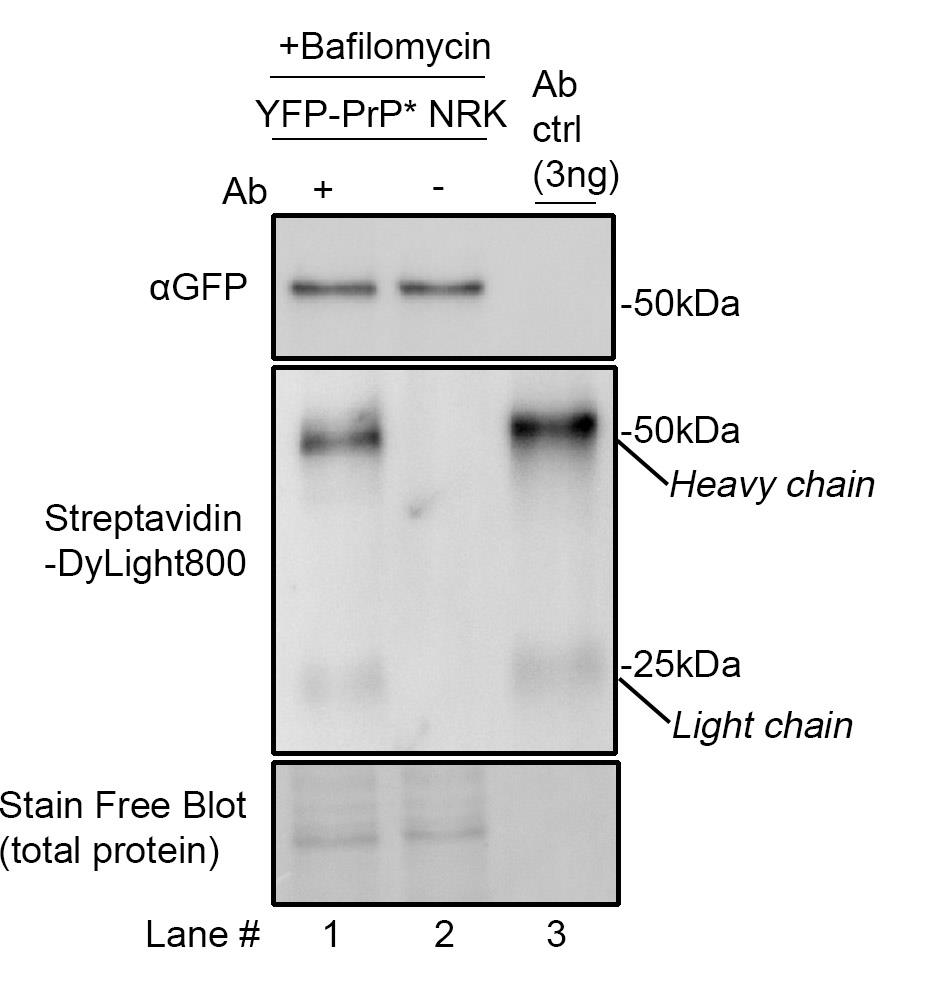
Figure 4. Western blot demonstrating the detection of internalized biotinylated anti-GFP antibody with streptavidin. YFP-PrP* NRK cells were incubated for 2 h with 500 nM bafilomycin A1 with 1 μg/mL antibody (Ab) (lane 1) or, as a negative control, without antibody (lane 2). To generate the antibody control lane (“Ab ctrl”), the biotinylated anti-GFP antibody was diluted directly into sample buffer to a final concentration of 0.2 μg/mL, and then 15 μL was run on the gel, resulting in 3 ng loaded into the gel. The same membrane was imaged for total protein using the Stain-FreeTM system, then probed with Streptavidin-DyLight800, and a homemade rabbit anti-GFP polyclonal antibody, which was previously described [19,20] and detected using HRP-conjugated anti-rabbit secondary antibody.
Next, we tested whether we could detect differences in anti-GFP antibody uptake by YFP-PrP* NRK cells, untransfected parental NRK cells, and YFP-CD3δ NRK cells based on the trafficking concepts diagrammed in Figure 3. To provide an internal measurement guide, we included a dilution curve of YFP-PrP* NRK cell lysates from cells that were incubated with bafilomycin A1 and anti-GFP antibody during steady-state conditions (Figure 5A, B, lanes 1–5). We generated this dilution curve by diluting lysate in 2× SB+TCEP prior to running it on the gel. Since heavy- and light-chains are stoichiometric in functional antibodies [42,43], we opted to measure the band intensities of only the 50 kDa biotinylated heavy chains that were stained by Streptavidin-DyLight800. We normalized measurements against the 1× dilution of the cell lysate. This dilution curve reveals that while this western blot approach is semi-quantitative, it is useful to estimate decreases or increases in internalized antibody levels. Furthermore, using this approach, we detected the expected increase in anti-GFP antibody uptake that occurs upon the additional treatment of YFP-PrP* NRK cells with TG. Our results suggest that TG-treatment increased anti-GFP antibody uptake (Figure 5A, B, compare lanes 6 and 7). Critically, TG-treatment only induced an obvious increase in anti-GFP antibody uptake by YFP-PrP* NRK cells, but not by the negative controls, including untransfected parental NRK cells or the YFP-CD3δ-expressing NRK cells (Figure 5A, B, compare lanes 6 and 7 to 8–11). This verifies the specificity of the anti-GFP antibody for the extracellularly exposed YFP-tag of the YFP-PrP*.
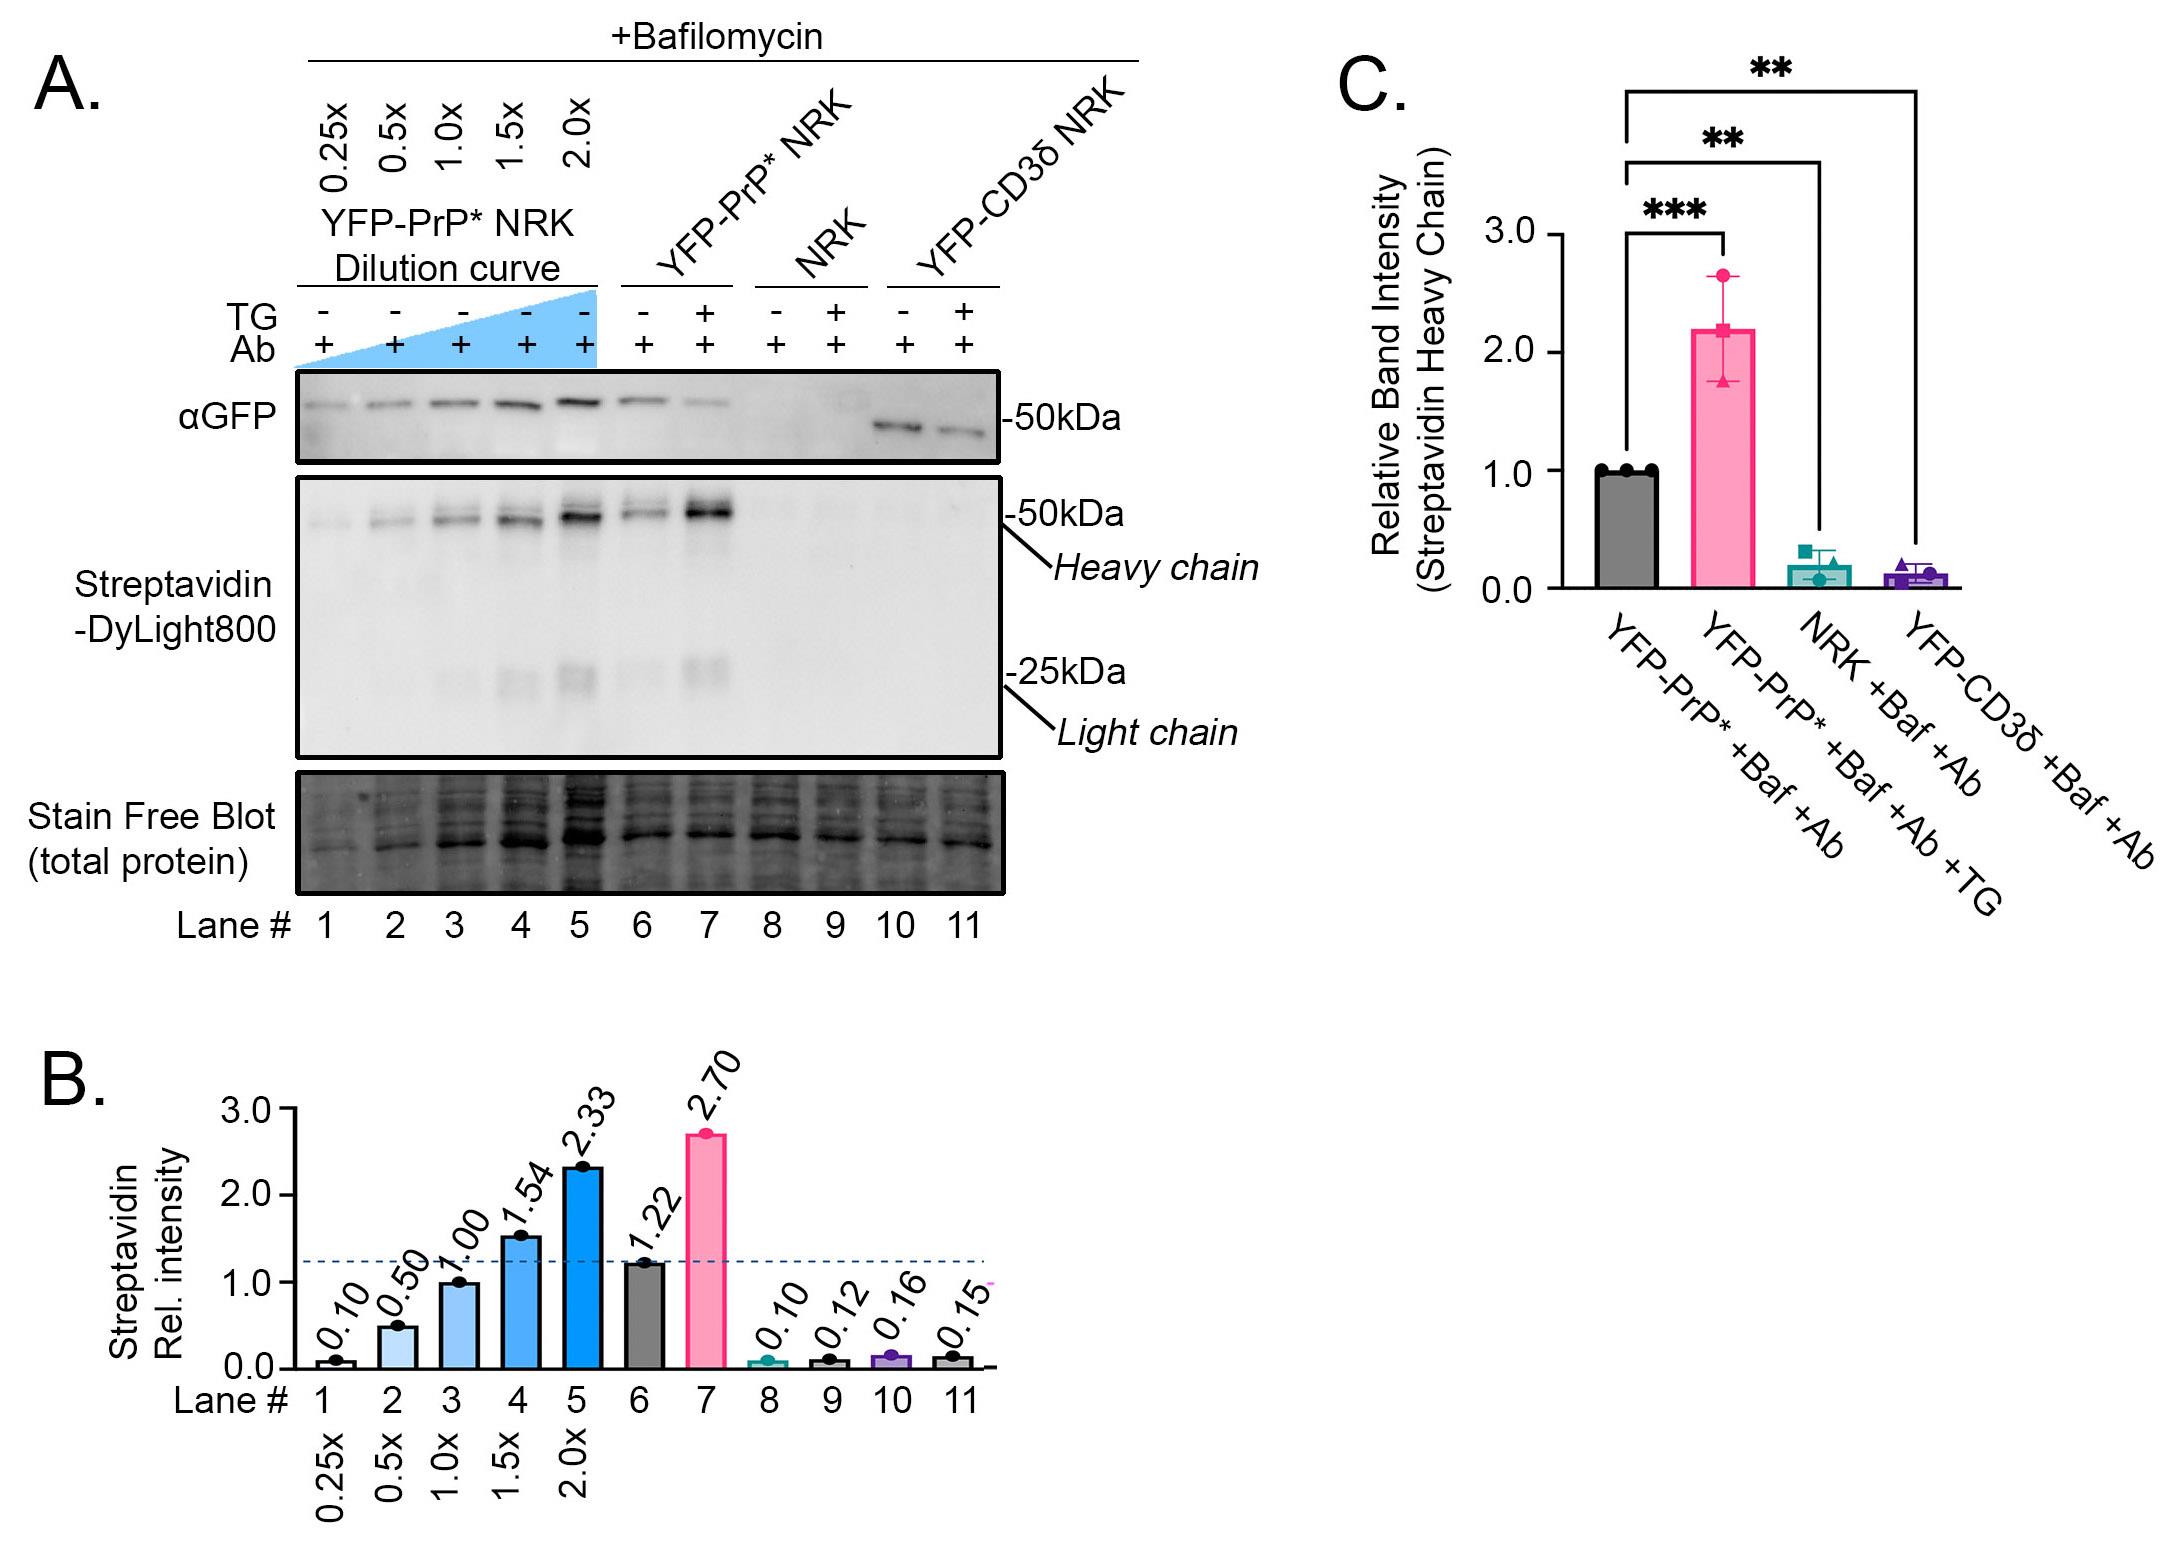
Figure 5. Proof-of-principle experiment demonstrating the expected differences in anti-GFP antibody uptake as detected by our western blot–based approach. (A) Western blot of YFP-PrP* NRK, parental NRK, or YFP-CD3δ NRK cell lysates from cells that were incubated for 2 h with 500 nM Bafilomycin A1, 1 μg/mL antibody (Ab), and 0.1 μM TG as indicated. Lanes 1–5 represent a dilution curve of the YFP-PrP* NRK cell lysates that were incubated for 2 h with 500 nM bafilomycin A1 and 1 μg/mL Ab. The same membrane was imaged for total protein using the Stain-FreeTM system, then probed with Streptavidin-DyLight800 and rabbit anti-GFP polyclonal antibody, followed by HRP-conjugated anti-rabbit secondary antibody. (B) Quantification of the Streptavidin-DyLight800-bound heavy chain bands of the internalized biotinylated anti-GFP antibody. All of the band intensities were normalized against the 1× dilution of the YFP-PrP* NRK cell lysates. (C) Triplicate quantification of Streptavidin-DyLight800-bound heavy chain bands of the internalized biotinylated anti-GFP antibody. Data is described as means and standard deviations. Asterisks indicate a statistically significant difference when comparing each condition to the control condition (YFP-PrP* +Baf +Ab, p < 0.05) using an ordinary one-way ANOVA test with Dunnett’s correction for multiple comparisons. The initial ANOVA test resulted in a statistically significant difference between groups [p < 0.0001, F(3,8) = 51.07], and multiple comparisons with Dunnett’s corrections resulted in a significant difference between YFP-PrP* +Baf +Ab vs. YFP-PrP* +Baf +Ab +TG (adjusted p = 0.0006); vs. NRK +Baf +Ab (adjusted p = 0.0077); and vs. YFP-CD3δ +Baf +Ab (adjusted p = 0.0046). All of the band intensities were normalized against the total protein loaded in the Stain-FreeTM blot and also the 1× dilution of the YFP-PrP* NRK cell lysates. Means and standard deviations for each condition are as follows: YFP-PrP* +Baf +Ab, 1.000 ± 0.000; YFP-PrP* +Baf +Ab +TG, 2.202 ± 0.444; parental NRK +Baf +Ab, 0.199 ± 0.123; YFP-CD3δ NRK +Baf +Ab, 0.126 ± 0.080. Symbols represent each of the 3 trials. The circles correspond to the blot shown in (A).
After determining that the anti-GFP antibody uptake by YFP-PrP* NRK cells is specifically due to the cell-surface exposure of the YFP-tag on YFP-PrP* in Figure 5A and B, we repeated a subset of the experimental conditions in triplicate for quantification (Figure 5C). Specifically, we measured anti-GFP antibody uptake for YFP-PrP* NRK cells that were cultured with bafilomycin A1 and anti-GFP antibodies (Ab) in the absence of TG (YFP-PrP* +Baf +Ab) or presence of TG (YFP-PrP* +Baf +Ab +TG). We measured two negative controls, parental untransfected and YFP-CD3δ NRK cells cultured with bafilomycin A1 and anti-GFP antibodies (NRK +Baf +Ab and YFP-CD3δ +Baf +Ab, respectively). Triplicate quantifications revealed that in YFP-PrP* NRK cells, approximately double the amount of anti-GFP antibodies are internalized upon TG-treatment. This suggests that twice as many molecules of YFP-PrP* traffic through the PM within the 2-h period when RESET is induced with TG. The negative controls demonstrated a low level of nonspecific antibody uptake during the 2-h incubation. Taken together, we have demonstrated the utility of our western blot–based approach to detect specific antibody uptake and increased antibody uptake in response to a small molecule that promotes the traffic of an integral membrane protein of interest to the PM (Figure 5).
We then set out to demonstrate the utility of our protocol to detect inhibition of YFP-PrP* trafficking to the PM in response to a small molecule drug. As previously published, 3 h of pretreatment with BRD4780 induces degradation of TMED9 and blocks traffic of YFP-PrP* through the RESET pathway [18]. Thus, we expected that a 3-h BRD4780-pretreatment would block the consequent anti-GFP antibody uptake during steady-state and TG-treatment conditions (Figure 3D, E). BRD4780-pretreatment visibly induced the degradation of TMED9 (Figure 6A, TMED9-blot, compare lanes 6–7 with 8–9). To provide an internal measurement guide for antibody uptake, we included a dilution curve of YFP-PrP* NRK cell lysates from cells that were incubated with bafilomycin A1 and anti-GFP antibody (Figure 6A, lanes 1–5). We measured the band intensities of the 50 kDa biotinylated heavy chains that were stained by Streptavidin-DyLight800 and normalized the measurements against the 1× dilution of the cell lysate (Figure 6A, B, Streptavidin-DyLight800 blot, compare lanes 1–9 with lane 3). As predicted for conditions in which RESET was blocked with BRD4780, we detected a sharp decrease in antibody uptake after the 3-h BRD4780 pretreatment of YFP-PrP* NRK cells (Figure 6A, B, Streptavidin-DyLight800-blot, compare lanes 6 and 8). Despite demonstrating the expected increase of antibody uptake in TG-treated cells (Figure 6A, B, Streptavidin-DyLight800-blot, compare lanes 6 and 8), the 3-h BRD4780 pretreatment inhibited TG-induced antibody uptake (Figure 6A, B, Streptavidin-DyLight800-blot, compare lanes 7 and 9).
To quantify the effects of BRD4780 on antibody uptake and YFP-PrP* levels, we performed the experiment in triplicate (Figure 6C, D). As shown previously (Figure 5C), anti-GFP antibody uptake in YFP-PrP* NRK cells approximately doubled in the presence of TG YFP-PrP* +Baf +Ab +TG when compared to baseline-levels YFP-PrP* +Baf +Ab (Figure 6C). However, anti-GFP antibody uptake was inhibited in cells with 3-h BRD4780 pretreatment in the absence of TG YFP-PrP* BRD4780 P-T +Baf +Ab or the presence of TG YFP-PrP* BRD4780 P-T +Baf +Ab +TG (Figure 6C). Taken together, we have demonstrated the utility of our western blot–based approach to detect decreased antibody uptake in response to a small molecule that inhibits traffic of an integral membrane protein of interest to the PM (Figure 6).
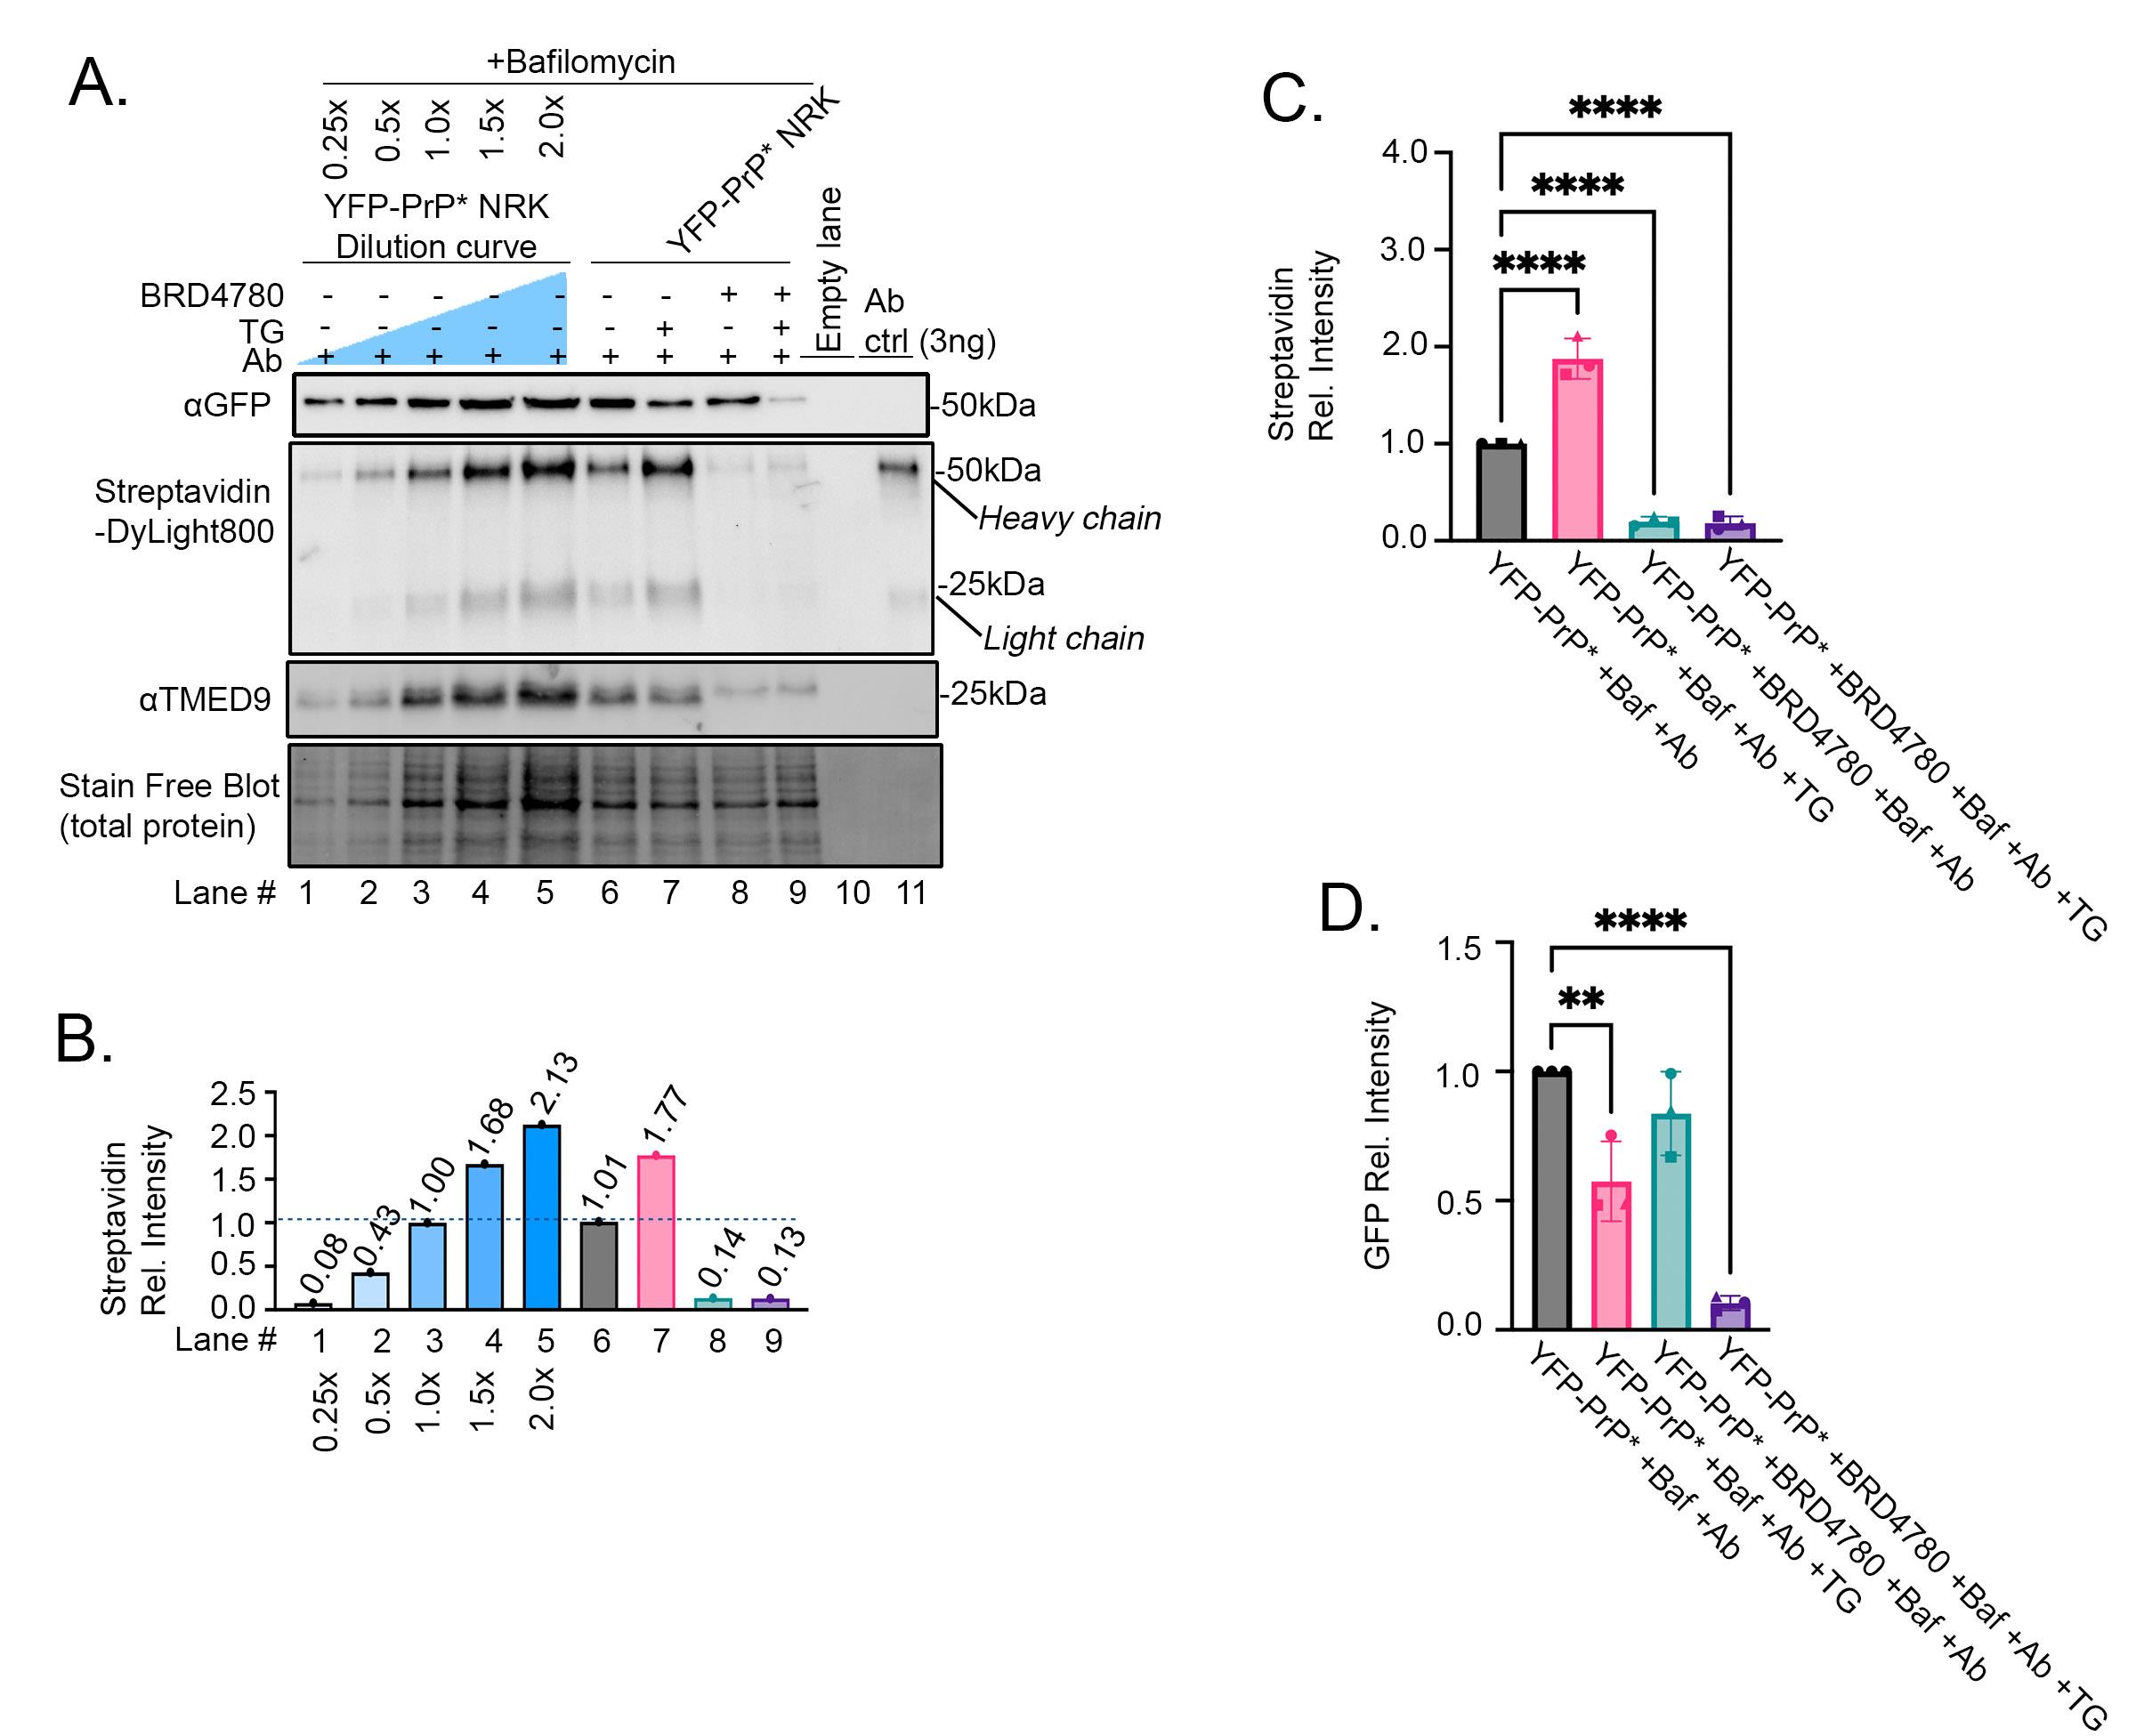
Figure 6. Proof-of-principle experiment demonstrating the expected decrease in anti-GFP antibody uptake after BRD4780 treatment as detected by our western blot–based approach. (A) Western blot of YFP-PrP* NRK cell lysates from cells that were incubated for 2 h with 500 nM bafilomycin A1, 1 μg/mL antibody (Ab), 100 μM BRD4780, and 0.1 μM TG as indicated. For conditions with BRD4780 treatment, a 3-h pretreatment was included prior to the 2-h coincubation with bafilomycin, antibody, and TG as indicated. Lanes 1–5 represent a dilution curve of the YFP-PrP* NRK cell lysates that were incubated for 2 h with 500 nM bafilomycin A1 and 1 μg/mL antibody (Ab). The membrane was imaged for total protein using the Stain-FreeTM system, and then probed with Streptavidin-DyLight800. A second membrane was probed with rabbit anti-GFP polyclonal antibody, followed by HRP-conjugated anti-rabbit secondary antibody, and with mouse anti-TMED9 antibody, followed by a fluorescent anti-mouse secondary antibody. (B) Quantification of the streptavidin-DyLight800-bound heavy chain bands of the biotinylated anti-GFP antibody. All of the band intensities were normalized against the 1× dilution of the YFP-PrP* NRK cell lysates. (C) Quantification of streptavidin-DyLight800-bound heavy chain bands of the internalized biotinylated anti-GFP antibody. Data is presented as means and standard deviations (n = 3). Four asterisks indicate a statistically significant difference when comparing each condition to the control condition (YFP-PrP* +Baf +Ab, p < 0.0001) using an ordinary one-way ANOVA test with Dunnett’s correction for multiple comparisons. The initial ANOVA test resulted in a significant difference between groups [p < 0.0001, F(3,8) = 154.3)], and multiple comparisons with Dunnett’s corrections resulted in a significant difference between YFP-PrP* +Baf +Ab vs. YFP-PrP* +Baf +Ab +TG (adjusted p < 0.0001); vs. YFP-PrP* +BRD4780 +Baf +Ab (adjusted p < 0.0001); and vs. YFP-PrP* +BRD4780 +Baf +Ab +TG (adjusted p < 0.0001). All of the band intensities were normalized against the total protein loaded in the stain-free blot and also the 1× dilution of the YFP-PrP* NRK cell lysates. Means and standard deviations are as follows: YFP-PrP* +Baf +Ab, 1.000 ± 0; YFP-PrP* +Baf +Ab +TG, 1.876 ± 0.2080; YFP-PrP* +BRD4780 +Baf +Ab, 0.1989 ± 0.4944; YFP-PrP* +BRD4780 +Baf +Ab +TG, 0.1826 ± 0.06759. Symbols represent each of the three trials. The circles correspond to the blot shown in (A). (D) Quantification of anti-GFP antibody detecting YFP-PrP* western blot bands. Data is presented as means and standard deviations (n = 3). Asterisks indicate statistically significant differences from YFP-PrP* +Baf +Ab (p < 0.05) using an ordinary one-way ANOVA test comparing each group to the control condition (YFP-PrP* +Baf +Ab) with Dunnett’s correction for multiple comparisons. Four asterisks indicate p < 0.0001, two asterisks indicate p < 0.005. The initial ANOVA test resulted in a significant difference between groups [p < 0.0001, F(3,8) = 36.24], and multiple comparisons with Dunnett’s corrections resulted in a significant difference between YFP-PrP* +Baf +Ab vs. YFP-PrP* +Baf +Ab +TG (adjusted p = 0.0044); and vs. YFP-PrP* +BRD4780 +Baf +Ab +TG (adjusted p < 0.0001). All of the band intensities were normalized against the total protein loaded in the stain-free blot and also the 1× dilution of the YFP-PrP* NRK cell lysates. Symbols represent each of the three trials. The circles correspond to the blot shown in (A). Means and standard deviations are as follows: YFP-PrP* +Baf +Ab, 1.000 ± 0; YFP-PrP* +Baf +Ab +TG, 0.5745 ± 0.1544; YFP-PrP* +BRD4780 +Baf +Ab, 0.8372 ± 0.1618; YFP-PrP* +BRD4780 +Baf +Ab +TG, 0.1036 ± 0.02773.
An exciting observation revealed by this proof-of-principle experiment was that TG-treatment in 3-h BRD4780-pretreated cells induced rapid degradation of YFP-PrP*, despite coincubation of TG with the lysosomal degradation inhibitor bafilomycin A1 (Figure 6A, B, GFP-blot, compare lanes 6 and 9). Triplicate analysis and quantification of the GFP blots revealed that YFP-PrP* levels did not change significantly in the presence of the 3-h BRD4780 pretreatment YFP-PrP* BRD4780 P-T +Baf +Ab when compared to baseline-levels YFP-PrP* +Baf +Ab (Figure 6D). However, the combination of BRD4780 and TG YFP-PrP* BRD4780 P-T +Baf +Ab +TG induced a significant drop in the YFP-PrP* levels when compared to baseline-levels YFP-PrP* +Baf +Ab (Figure 6D). Thus, Figure 6 demonstrates that under conditions in which RESET is blocked, YFP-PrP* is degraded through an alternate pathway that (a) does not involve trafficking to the cell surface and (b) is not inhibited by bafilomycin A1. The depletion in YFP-PrP* levels in the presence of lysosomal degradation inhibitor, bafilomycin A1, suggests that this alternate pathway may not involve lysosomal degradation. Further studies will need to be performed in order to determine the mechanism underlying this new observation. Notably, the results in Figure 6 demonstrate that this new western blot–based antibody-uptake protocol facilitates new discoveries relating to protein trafficking pathways, degradation, and homeostasis.
In summary, we have used YFP-PrP* as a model substrate to demonstrate how biotinylated antibody uptake can be used to monitor integral protein trafficking to and internalization from the PM (Figure 1, bold purple arrows). To validate our new western blot–based antibody-uptake protocol, we took advantage of previous findings that tagged variants of PrP* that are efficiently endocytosed from the PM and that traffic to the PM can be pharmacologically modified (Figure 3B–E). Using this western blot–based biotinylated antibody uptake assay, we replicated the expected findings that TG or BRD4780 promote or inhibit YFP-PrP* trafficking to the PM, respectively. Interestingly, Figure 6 revealed that pretreatment with BRD4780 reroutes YFP-PrP* degradation through a pathway that does not involve trafficking to the cell surface and is not inhibited by bafilomycin A1. While performing these protocol validation experiments, we demonstrated and exploited the following benefits of our western blot–based approach to detect antibody uptake: (a) the accessibility of SDS-PAGE and western blot equipment and reagents, (b) the high binding affinity of streptavidin for biotinylated proteins and specificity surpassing that of traditional primary–secondary antibody pairs, (c) the relatively short training time for a new student to learn the entire workflow, (d) the short turnaround time from sample collection to quantified streptavidin bands, and (e) the semi-quantitative nature of western blots. Thus, we demonstrate here the facility of this protocol to make new discoveries relating to integral membrane protein trafficking pathways and degradation. This protocol may be easily adjusted to use with other adherent or non-adherent cell lines and primary or differentiated cell cultures, to monitor antibody uptake by any integral membrane protein.
General notes and troubleshooting
General notes
1. This protocol can be modified for use with non-adherent cell culture lines, differentiated cells, or primary cell culture derived from animal tissues.
2. Potential limitations of this technique that must be taken into account include the following:
a. In some cases, antibody binding to the integral membrane protein may alter the kinetics of endocytosis, either by crosslinking the integral membrane proteins or by interfering with their ligand binding [2,3,5,44].
b. This protocol is dependent on the availability and specificity of the biotinylated primary antibody to the antigen on the extracellular portion of the protein in the context of its native and folded form.
Troubleshooting
Problem 1: Specific antibody uptake of biotinylated primary antibody was undetectable.
Possible cause: Biotinylated antibody has poor binding affinity to the integral membrane protein of interest. The antibody may not recognize the epitope in the native folded protein as it is presented in live cell culture, but instead only recognize the epitope in its denatured, unfolded form.
Solution: Try a different biotinylated antibody, preferably a polyclonal antibody raised against an antigen that was introduced into the animal in its native form. Before landing on the biotinylated goat polyclonal anti-GFP antibody (Genetex, GTX26658) as the reagent that we used in our above proof-of-principle experiments, we tested other antibodies. For example, we found that anti-GFP antibody uptake did not work for Alpaca-derived GFP VHH, biotinylated recombinant nanobody (Proteintech, gtb-250, used at 1:500 dilution).
Problem 2: A high level of biotinylated antibody uptake was detected in the negative control conditions.
Possible cause 1: A low-level pinocytosis results in nonspecific antibody uptake. We detected this in our negative controls (Figure 5C, NRK +Baf +Ab and YFP-CD3δ +Baf +Ab), which display ~10%–20% antibody-uptake levels of the baseline positive control (Figure 5C, YFP-PrP* +Baf +Ab). Over time, or with too high a concentration of the biotinylated primary antibody in the medium, the nonspecific antibody uptake may mask the signal from specific antibody uptake.
Solution 1: Reduce either the incubation time or concentration of primary biotinylated antibody until you identify an incubation period or dilution where nonspecific antibody uptake can be differentiated from specific antibody uptake.
Possible cause 2: Biotinylated primary antibody binds to an alternate antigen that is displayed more dominantly on the cell surface than your protein of interest.
Solution 2: Try different primary biotinylated antibodies until you find one where nonspecific antibody uptake can be differentiated from specific antibody uptake.
Acknowledgments
Author contributions: Investigation, A.M.G. and P.S-K. Writing—Original Draft, A.M.G. and P.S-K. Writing—Review & Editing, A.M.G. and P.S-K. Conceptualization, funding acquisition, and supervision, P.S-K.
Funding sources: This research was supported by the National Institute of General Medical Sciences National Institutes of Health, grant no. R01 GM134327 and The Uniformed Services University of the Health Sciences (USU, 4301 Jones Bridge Rd., A1040C, Bethesda, MD 20814-4799) grant no. HU00012320103. This project is sponsored by USU; however, the information or content and conclusions do not necessarily represent the official position or policy of, nor should any official endorsement be inferred on the part of, USU, the Department of Defense, or the U.S. Government.
Competing interests
The authors declare no conflicts of interest.
Ethical considerations
This work did not use human or animal subjects and therefore has no ethical considerations.
References
- Tsaltas, G., Ford, C. H. and Gallant, M. (1992). Demonstration of monoclonal anti-carcinoembryonic antigen (CEA) antibody internalization by electron microscopy, western blotting and radioimmunoassay. Anticancer Res. 12(6B): 2133–2142. https://pubmed.ncbi.nlm.nih.gov/1295459/
- Garrigues, J., Garrigues, U., Hellstrom, I. and Hellstrom, K. E. (1993). Ley specific antibody with potent anti-tumor activity is internalized and degraded in lysosomes. Am J Pathol. 142(2): 607–622. https://pubmed.ncbi.nlm.nih.gov/8434651/
- Louvard, D. (1980). Apical membrane aminopeptidase appears at site of cell-cell contact in cultured kidney epithelial cells. Proc Natl Acad Sci USA. 77(7): 4132–4136. https://doi.org/10.1073/pnas.77.7.4132
- Herz, J., Kowal, R. C., Ho, Y. K., Brown, M. S. and Goldstein, J. L. (1990). Low density lipoprotein receptor-related protein mediates endocytosis of monoclonal antibodies in cultured cells and rabbit liver. J Biol Chem. 265(34): 21355–21362. https://doi.org/10.1016/s0021-9258(17)45368-3
- Beisiegel, U., Schneider, W., Goldstein, J., Anderson, R. and Brown, M. (1981). Monoclonal antibodies to the low density lipoprotein receptor as probes for study of receptor-mediated endocytosis and the genetics of familial hypercholesterolemia. J Biol Chem. 256(22): 11923–11931. https://doi.org/10.1016/s0021-9258(19)68494-2
- Gottlieb, T. A., Ivanov, I. E., Adesnik, M. and Sabatini, D. D. (1993). Actin microfilaments play a critical role in endocytosis at the apical but not the basolateral surface of polarized epithelial cells. J Cell Biol. 120(3): 695–710. https://doi.org/10.1083/jcb.120.3.695
- Ford, C. H., Tsaltas, G. C., Osborne, P. A. and Addetia, K. (1996). Novel flow cytometric analysis of the progress and route of internalization of a monoclonal anti-carcinoembryonic antigen (CEA) antibody. Cytometry. 23(3): 228–240. https://doi.org/10.1002/(SICI)1097-0320(19960301)23:3<228::AID-CYTO6>3.0.CO;2-E
- Liu, H., Rajasekaran, A. K., Moy, P., Xia, Y., Kim, S., Navarro, V., Rahmati, R. and Bander, N. H. (1998). Constitutive and antibody-induced internalization of prostate-specific membrane antigen. Cancer Res. 58(18): 4055–4060. https://pubmed.ncbi.nlm.nih.gov/9751609/
- Chivers, C. E., Koner, A. L., Lowe, E. D. and Howarth, M. (2011). How the biotin-streptavidin interaction was made even stronger: investigation via crystallography and a chimaeric tetramer. Biochem J. 435(1): 55–63. https://doi.org/10.1042/BJ20101593
- Liu, F., Zhang, J. Z. and Mei, Y. (2016). The origin of the cooperativity in the streptavidin-biotin system: A computational investigation through molecular dynamics simulations. Sci Rep. 6: 27190. https://doi.org/10.1038/srep27190
- Luong, J. H. T. and Vashist, S. K. (2020). Chemistry of Biotin-Streptavidin and the Growing Concern of an Emerging Biotin Interference in Clinical Immunoassays. ACS Omega. 5(1): 10–18. https://doi.org/10.1021/acsomega.9b03013
- Green, N. M. (1990). Avidin and streptavidin. Methods Enzymol. 184: 51–67. https://doi.org/10.1016/0076-6879(90)84259-j
- Laitinen, O. H., Hytonen, V. P., Nordlund, H. R. and Kulomaa, M. S. (2006). Genetically engineered avidins and streptavidins. Cell Mol Life Sci. 63(24): 2992–3017. https://doi.org/10.1007/s00018-006-6288-z
- Liu, S., Zhang, H., Dai, J., Hu, S., Pino, I., Eichinger, D. J., Lyu, H. and Zhu, H. (2015). Characterization of monoclonal antibody's binding kinetics using oblique-incidence reflectivity difference approach. Mabs. 7(1): 110–119. https://doi.org/10.4161/19420862.2014.985919
- Landry, J. P., Ke, Y., Yu, G. L. and Zhu, X. D. (2015). Measuring affinity constants of 1450 monoclonal antibodies to peptide targets with a microarray-based label-free assay platform. J Immunol Methods. 417: 86–96. https://doi.org/10.1016/j.jim.2014.12.011
- Belitzky, E., Cavaliere, A., Rajabimoghadam, K. and Marquez-Nostra, B. (2022). Determining Binding Affinity (KD) of Radiolabeled Antibodies to Immobilized Antigens. J Vis Exp. (184): e3791/63927–v. https://doi.org/10.3791/63927
- Abcam Company (2025). KD value: a quantitative measurement of antibody affinity. Weblink: https://www.abcam.co.jp/primary-antibodies/kd-value-a-quantitive-measurement-of-antibody-affinity
- Ronzier, E. and Satpute-Krishnan, P. (2025). TMED9 coordinates the clearance of misfolded GPI-anchored proteins out of the ER and into the Golgi. PLoS Biol. 23(4): e3003084. https://doi.org/10.1371/journal.pbio.3003084
- Cheatham, A. M., Sharma, N. R. and Satpute-Krishnan, P. (2023). Competition for calnexin binding regulates secretion and turnover of misfolded GPI-anchored proteins. J Cell Biol. 222(10): e202108160. https://doi.org/10.1083/jcb.202108160
- Satpute-Krishnan, P., Ajinkya, M., Bhat, S., Itakura, E., Hegde, R. S. and Lippincott-Schwartz, J. (2014). ER stress-induced clearance of misfolded GPI-anchored proteins via the secretory pathway. Cell. 158(3): 522–533. https://doi.org/10.1016/j.cell.2014.06.026
- Zavodszky, E. and Hegde, R. S. (2019). Misfolded GPI-anchored proteins are escorted through the secretory pathway by ER-derived factors. eLife. 8: e46740. https://doi.org/10.7554/eLife.46740
- Roberts, B. S., Mitra, D., Abishek, S., Beher, R. and Satpute-Krishnan, P. (2024). The p24-family and COPII subunit SEC24C facilitate the clearance of alpha1-antitrypsin Z from the endoplasmic reticulum to lysosomes. Mol Biol Cell. 35(3): ar45. https://doi.org/10.1091/mbc.E23-06-0257
- Tsien, R. Y. (1998). The green fluorescent protein. Annu Rev Biochem. 67: 509–544. https://doi.org/10.1146/annurev.biochem.67.1.509
- Hailey, D. W., Rambold, A. S., Satpute-Krishnan, P., Mitra, K., Sougrat, R., Kim, P. K. and Lippincott-Schwartz, J. (2010). Mitochondria supply membranes for autophagosome biogenesis during starvation. Cell. 141(4): 656–667. https://doi.org/10.1016/j.cell.2010.04.009
- Bonifacino, J. S., Suzuki, C. K., Lippincott-Schwartz, J., Weissman, A. M. and Klausner, R. D. (1989). Pre-Golgi degradation of newly synthesized T-cell antigen receptor chains: intrinsic sensitivity and the role of subunit assembly. J Cell Biol. 109(1): 73–83. https://doi.org/10.1083/jcb.109.1.73
- Chen, C., Bonifacino, J. S., Yuan, L. C. and Klausner, R. D. (1988). Selective degradation of T cell antigen receptor chains retained in a pre-Golgi compartment. J Cell Biol. 107(6 Pt 1): 2149–2161. https://doi.org/10.1083/jcb.107.6.2149
- Bowman, E. J., Siebers, A. and Altendorf, K. (1988). Bafilomycins: a class of inhibitors of membrane ATPases from microorganisms, animal cells, and plant cells. Proc Natl Acad Sci USA. 85(21): 7972–7976. https://doi.org/10.1073/pnas.85.21.7972
- Dvela-Levitt, M., Kost-Alimova, M., Emani, M., Kohnert, E., Thompson, R., Sidhom, E. H., Rivadeneira, A., Sahakian, N., Roignot, J., Papagregoriou, G., et al. (2019). Small Molecule Targets TMED9 and Promotes Lysosomal Degradation to Reverse Proteinopathy. Cell. 178(3): 521–535 e523. https://doi.org/10.1016/j.cell.2019.07.002
- Daoud Sarsour, A., Kinstlinger, S., Nizar, R., Amos, N., Arbeli, N., Kazimirsky, G., Bronshtein-Berger, I., Fried, I., Unger, R., Brodie, C., et al. (2025). Targeting the Cargo Receptor TMED9 as a Therapeutic Strategy Against Brain Tumors. Cells. 14(11): 772. https://doi.org/10.3390/cells14110772
- Vredevoogd, D. W., Apriamashvili, G., Levy, P. L., Sinha, S., Huinen, Z. R., Visser, N. L., de Bruijn, B., Boshuizen, J., van Hal-van Veen, S. E., Ligtenberg, M. A., et al. (2024). TMED inhibition suppresses cell surface PD-1 expression and overcomes T cell dysfunction. J Immunother Cancer. 12(11): e010145. https://doi.org/10.1136/jitc-2024-010145
- Bazua-Valenti, S., Brown, M. R., Zavras, J., Riedl Khursigara, M., Grinkevich, E., Sidhom, E. H., Keller, K. H., Racette, M., Dvela-Levitt, M., Quintanova, C., et al. (2024). Disrupted uromodulin trafficking is rescued by targeting TMED cargo receptors. J Clin Invest. 134(24): e1172/jci180347. https://doi.org/10.1172/JCI180347
- Lorenz, H., Hailey, D. W. and Lippincott-Schwartz, J. (2006). Fluorescence protease protection of GFP chimeras to reveal protein topology and subcellular localization. Nat Methods. 3(3): 205–210. https://doi.org/10.1038/nmeth857
- Wileman, T., Kane, L. P., Carson, G. R. and Terhorst, C. (1991). Depletion of cellular calcium accelerates protein degradation in the endoplasmic reticulum. J Biol Chem. 266(7): 4500–4507. https://doi.org/10.1016/s0021-9258(20)64351-4
- Wileman, T., Pettey, C. and Terhorst, C. (1990). Recognition for degradation in the endoplasmic reticulum and lysosomes prevents the transport of single TCR beta and CD3 delta subunits of the T-cell antigen receptor to the surface of cells. Int Immunol 2(8): 743–754. https://doi.org/10.1093/intimm/2.8.743
- Strating, J. R. and Martens, G. J. (2009). The p24 family and selective transport processes at the ER-Golgi interface. Biol Cell. 101(9): 495–509. https://doi.org/10.1042/BC20080233
- Pastor-Cantizano, N., Montesinos, J. C., Bernat-Silvestre, C., Marcote, M. J. and Aniento, F. (2016). p24 family proteins: key players in the regulation of trafficking along the secretory pathway. Protoplasma. 253(4): 967–985. https://doi.org/10.1007/s00709-015-0858-6
- Roberts, B. S. and Satpute-Krishnan, P. (2022). The many hats of transmembrane emp24 domain protein TMED9 in secretory pathway homeostasis. Front Cell Dev Biol. 10: 1096899. https://doi.org/10.3389/fcell.2022.1096899
- Wada, I., Rindress, D., Cameron, P., Ou, W., Doherty, J., Louvard, D., Bell, A., Dignard, D., Thomas, D., Bergeron, J., et al. (1991). SSR alpha and associated calnexin are major calcium binding proteins of the endoplasmic reticulum membrane. J Biol Chem. 266(29): 19599–19610. https://doi.org/10.1016/s0021-9258(18)55036-5
- Ahluwalia, N., Bergeron, J., Wada, I., Degen, E. and Williams, D. (1992). The p88 molecular chaperone is identical to the endoplasmic reticulum membrane protein, calnexin. J Biol Chem. 267(15): 10914–10918. https://doi.org/10.1016/s0021-9258(19)50105-3
- Degen, E. and Williams, D. B. (1991). Participation of a novel 88-kD protein in the biogenesis of murine class I histocompatibility molecules. J Cell Biol. 112(6): 1099–1115. https://doi.org/10.1083/jcb.112.6.1099
- David, V., Hochstenbach, F., Rajagopalan, S. and Brenner, M. (1993). Interaction with newly synthesized and retained proteins in the endoplasmic reticulum suggests a chaperone function for human integral membrane protein IP90 (calnexin). J Biol Chem. 268(13): 9585–9592. https://doi.org/10.1016/s0021-9258(18)98391-2
- Schlatter, S., Stansfield, S. H., Dinnis, D. M., Racher, A. J., Birch, J. R. and James, D. C. (2005). On the optimal ratio of heavy to light chain genes for efficient recombinant antibody production by CHO cells. Biotechnol Prog. 21(1): 122–133. https://doi.org/10.1021/bp049780w
- Murphy, K., Travers, P., Walport, M. and Janeway, C. (2012). Janeway's immunobiology. Garland Science. New York. ISBN: 9780815342434
- Paul, D., Stern, O., Vallis, Y., Dhillon, J., Buchanan, A. and McMahon, H. (2023). Cell surface protein aggregation triggers endocytosis to maintain plasma membrane proteostasis. Nat Commun. 14(1): 947. https://doi.org/10.1038/s41467-023-36496-y
Article Information
Publication history
Received: Sep 4, 2025
Accepted: Oct 8, 2025
Available online: Oct 29, 2025
Published: Nov 20, 2025
Copyright
© 2025 The Author(s); This is an open access article under the CC BY-NC license (https://creativecommons.org/licenses/by-nc/4.0/).
How to cite
Graninger, A. and Satpute-Krishnan, P. (2025). Monitoring Endocytosis of Integral Membrane Proteins Using Western Blot-Based Detection of Biotinylated Antibody Uptake. Bio-protocol 15(22): e5511. DOI: 10.21769/BioProtoc.5511.
Category
Cell Biology > Cell-based analysis > Protein secretion
Cell Biology > Cell-based analysis > Transport
Biochemistry > Protein > Immunodetection > Western blot
Do you have any questions about this protocol?
Post your question to gather feedback from the community. We will also invite the authors of this article to respond.