- Protocols

- Articles and Issues
- For Authors
- About
- Become a Reviewer

A Quantitative Spectrophotometric Assay Matched With Environmental Scanning Electron Microscopy to Measure Calcium Crystals in Human Osteoarthritic Synovial Fluid
Published: Vol 15, Iss 21, Nov 5, 2025 DOI: 10.21769/BioProtoc.5495 Views: 1253
Reviewed by: Olga KopachAnonymous reviewer(s)

Protocol Collections
Comprehensive collections of detailed, peer-reviewed protocols focusing on specific topics


Abstract
In the field of osteoarthritis (OA), the identification of reliable diagnostic and prognostic biomarkers in patients with hip lesions such as femoroacetabular impingement (FAI) could have an immeasurable value. Calcium crystal detection in synovial fluids (SFs) is one tool currently available to diagnose patients with rheumatologic disorders. Crystals, such as monosodium urate (MSU) and calcium pyrophosphate (CPP), are identified qualitatively by compensated polarized light, whereas basic calcium phosphate (BCP) crystals are visualized under conventional light microscopy by Alizarin red S (ARS) staining. Here, we present an efficient and straightforward protocol to quantify calcium crystals by spectrophotometric analysis in human osteoarthritic SFs after staining with ARS. The type and size of the different crystal species are confirmed by environmental scanning electron microscopy (ESEM).
Key features
• This protocol provides a quantitative assay to measure calcium crystals in human synovial fluids.
• ARS is specific for hydroxyapatite, calcium phosphate, tetrasodium pyrophosphate, sodium phosphate, calcium chloride/pyrophosphate dihydrate, and oxalate crystals; does not show any combination with SFs components.
• The standard curve for crystal quantification was prepared with a synthetic hydroxyapatite, which allows to prepare a series of stable and reproducible standards.
• The analysis with ESEM determines the elemental composition of all visible particles without any pretreatment of the biological sample prior to observation.
Keywords: BiomarkerGraphical overview
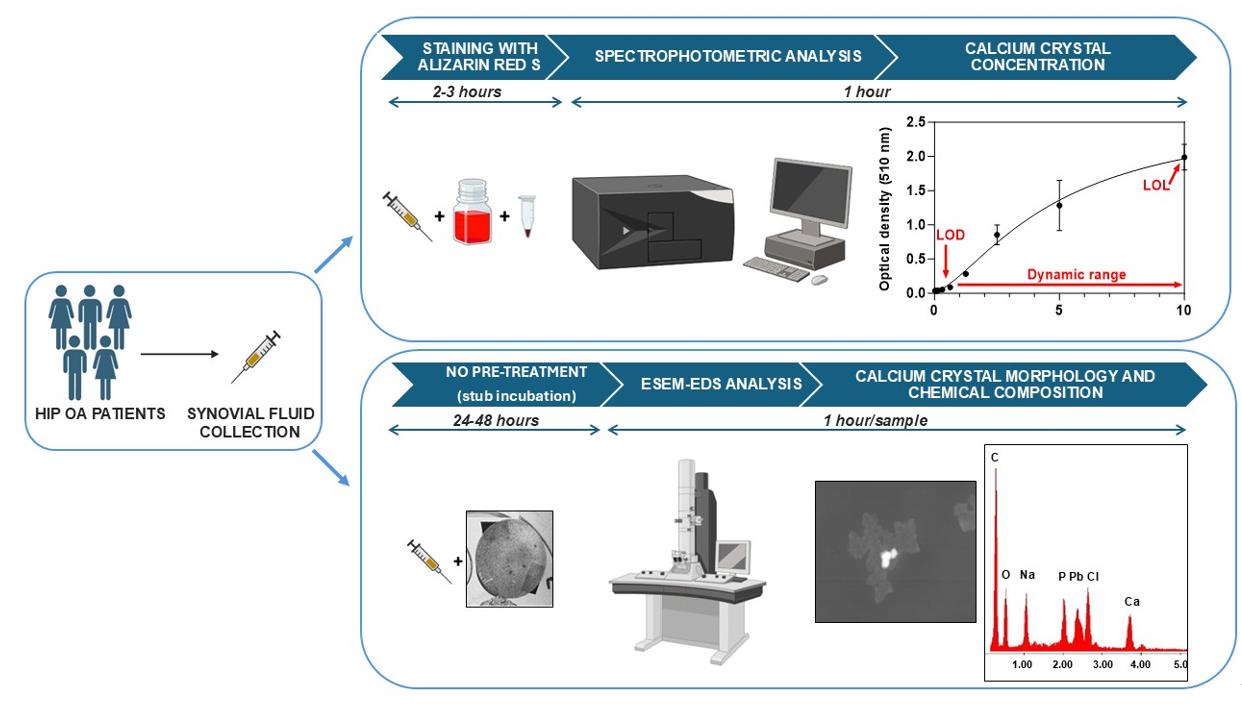
Overview of the calcium crystal quantification by spectrophotometric analysis and identification by environmental scanning electron microscope equipped with an energy dispersive spectrometer (ESEM-EDS)
Background
Biomarkers are biological molecules present in body fluids or tissues that may be used as indicators of physiological and pathophysiological processes. Moreover, they can be used to see how well patients respond to new treatments and interventions for a disease or condition [1]. In the field of osteoarthritis (OA), biomarkers of early OA represent a major unmet need, and more research is required to identify biomarkers that characterize early events in the pathogenesis of OA [2]. The identification of reliable diagnostic and prognostic biomarkers might help guide decision making in an efficient and cost-effective manner. In particular, the early recognition and management of patients with hip lesions, such as femoroacetabular impingement (FAI), may preempt significant hip morbidity as OA [3–5].
Calcium crystal detection in synovial fluid (SF) is one tool currently available to diagnose patients with rheumatologic disorders, associated with biochemical markers and advanced imaging [6]. Routinely, crystals such as monosodium urate (MSU) and calcium pyrophosphate (CPP) are identified qualitatively by compensated polarized light, whereas positivity for basic calcium phosphate (BCP) crystals is visualized under conventional light microscopy by Alizarin red S (ARS) staining [7]. There is a big limitation in the visualization under conventional light microscopy of the calcium crystals stained with ARS, related to the presence of crystal clumps in the SF. Therefore, interpreting BCP qualitative detection is challenging as ARS-stained crystal clumps may resemble apatite, and small CPP crystals might be missed under polarized light.
The detection of calcium crystals in synovial fluid can be performed using an environmental scanning electron microscope (ESEM) [8]. ESEM technology represents an upgrade of the conventional scanning electron microscope (SEM). Indeed, ESEM allows the observation of samples, even at high resolution and without any conductive coating on the sample, at different vacuum levels. This type of opportunity is particularly useful for biological samples, as it allows morphological analysis without any pretreatment prior to observation. In addition, when equipped with an energy dispersive spectrometer (EDS), the ESEM allows the semiquantitative detection of the chemical elements that constitute the ultrastructural components of the sample (point or areal analysis), with the same high spatial resolution as morphological analysis and without interference related to sample preparation (chemical stabilization, dehydration, and conductive coating), as using a conventional SEM.
Our protocol suggests a quantitative method to measure calcium crystals in human OA SF associated with ESEM to identify and measure the size of the different crystal species.
Materials and reagents
Biological materials
1. Synovial fluid samples were collected from five patients with late hip OA, assessed by the Kellgren–Lawrence grade system [9], aliquoted without any pretreatment and stored at -80 °C for longer storage
Reagents
1. Synthetic hydroxyapatite (HAP) (Bioteck, catalog number: HAP038C5SD09C)
2. Alizarin Red S (Merck, catalog number: A5533)
3. Ultrapure distilled water DNase/RNase-free (Invitrogen, catalog number: 10977-035)
4. Acetic acid glacial (Carlo Erba Reagents srl, catalog number: 401422)
5. Ammonium hydroxide solution, 28.0%–30.0% NH3 basis (Sigma-Aldrich, catalog number: 338818)
6. Phosphate buffer saline (PBS) w/o calcium w/o magnesium (BioNORDICA, catalog number: EC-ECB5004L)
Solutions
1. Alizarin Red S (ARS) solution (see Recipes)
2. 10% acetic acid (see Recipes)
3. 0.15% ammonium hydroxide (see Recipes)
4. 3% ammonium hydroxide (see Recipes)
5. Synthetic hydroxyapatite (HAP) stock solution (see Recipes)
Recipes
1. Alizarin Red S (ARS) solution
| Reagent | Final concentration | Quantity or volume |
|---|---|---|
| Alizarin Red S (powder) | 40 mM | 0.548 g |
| Distilled water | 40 mL |
a. Weigh 0.548 g of ARS in a beaker with an analytical balance and add 30 mL of distilled water with a 25 mL pipette.
b. Mix at room temperature (RT) in a magnetic stirrer until completely dissolved.
c. Adjust the solution to pH 4.2 by adding 0.15% of ammonium hydroxide drop by drop while stirring using an electrode pH meter.
d. Transfer the solution to a graduated cylinder and add distilled water up to 40 mL of final volume.
e. Filter the solution with a 0.45 µm microfilter and store in a dark bottle at RT for a maximum of one month.
f. Filter the solution with a 0.22 µm microfilter before use.
2. 10% acetic acid
| Reagent | Final concentration | Quantity or volume |
|---|---|---|
| Acetic acid glacial (liquid) | 10% | 10 mL |
| Distilled water | 90 mL |
a. Add 10 mL of acetic acid glacial to 90 mL of distilled water to make 100 mL of solution in a graduated cylinder.
b. Mix at RT in a magnetic stirrer until completely mixed and transfer the solution into a bottle to store at RT for a maximum of six months.
3. 0.15% ammonium hydroxide
| Reagent | Final concentration | Quantity or volume |
|---|---|---|
| Ammonium hydroxide (liquid) | 0.15% | 500 μL |
| Distilled water | 99.5 mL |
a. Add 500 μL of ammonium hydroxide commercial solution (28.0%–30.0% NH3 basis) and distilled water up to 100 mL of final volume in a graduated cylinder.
b. Mix at RT in a magnetic stirrer until completely mixed and transfer the solution into a bottle to store at RT for a maximum of six months.
c. Check the presence of possible precipitates and gently mix before use.
4. 3% ammonium hydroxide
| Reagent | Final concentration | Quantity or volume |
|---|---|---|
| Ammonium hydroxide (liquid) | 3% | 1 mL |
| Distilled water | 10 mL |
a. Prepare fresh before use.
b. Add 1 mL of ammonium hydroxide commercial solution (28.0%–30.0% NH3 basis) to 9 mL of distilled water in a 15 mL centrifuge tube.
c. Swirl the tube to mix.
5. Synthetic hydroxyapatite (HAP) stock solution
| Reagent | Final concentration | Quantity or volume |
|---|---|---|
| HAP (powder) | 10 mg/mL | 10 mg |
| PBS | 1 mL |
a. Prepare fresh before use.
b. Weigh 10 mg of HAP powder with an analytical balance in a 1.5 mL conical vial and mix with 1 mL of PBS.
c. Vortex the vial to mix.
Laboratory supplies
1. Safe-lock 1.5 mL conical vial (Eppendorf, catalog number: 0030120086)
2. Serological pipettes 5, 10, 25 mL (Sarsted, catalog numbers: 86.1253.001, 86.1254.001, 86.1685.001)
3. Pipette tips epTIPS 0.1–20 μL and 50–1,000 μL (Eppendorf, catalog numbers: 022492012 and 0030076176)
4. Pipette tips FINNTIP 250 universal (Thermofisher Scientific, catalog number: 9400230)
5. Sterile syringe filters MINISART NML 0.22 and 0.45 micron (Sartorius, catalog numbers: S6534 and S6555 FMGUK)
6. 20 mL syringe (Caress, catalog number: CCAR02003000)
7. 15 mL centrifuge tube (Euroclone, Primo EZ tubes 15 mL, catalog number: ET5015B)
8. 96-well, non-treated, flat-bottom microplate (Thermofisher Scientific, NUNC, catalog number: 267427)
9. Aluminum stub covered with a conductive carbon adhesive disk (TAAB Ltd., catalog number: C263/N)
Equipment
1. Refrigerated microcentrifuge (DuPont, model: RMC-14)
2. Analytical balance (Mettler Toledo, model: 303-S/FACT)
3. pH meter (CRISON, model: GLP21)
4. Maxi mixer vortex (SECURLAB, model: 714)
5. Microplate spectrophotometer (TECAN Trading AG, model: NanoQuant Infinite M200)
6. Chemical hood (BICASA SRL, model: Lite 120)
7. Environmental scanning electron microscope (FEI, model: Quanta 200 FEG) equipped with an energy-dispersive X-ray spectrometer with an ECON (Edax Carbon Oxigen Nitrogen) 6 utw X-ray detector (EDAX Inc.)
Software and datasets
1. i-control 1.10 (for infinite reader) (TECAN, Version 1.10)
2. GraphPad Prism (GraphPad Software Boston, MA, v. 10.0.2)
3. Genesis Spectrum (EDAX Inc., Version 4.61)
4. Adobe Photoshop CS2 (ADOBE, Version 9.0)
5. Image J (Microsoft Java, Version 1.54k)
Procedure
A. Standard curve preparation
1. Prepare the standard curve with a series of standards (STDs) across a range of concentrations near the expected concentration of the unknown samples. OA samples selected for the present procedure were collected from patients with late OA undergoing total hip replacement, previously selected for the presence of calcium crystals visualized roughly by light microscopy.
2. Prepare the reference standards for the quantification with serial dilution 1:2 in PBS of HAP from a 10 mg/mL working solution as follows: 5, 2.5, 1.25, 0.625, 0.3125, 0.15, and 0.078 mg/mL [10]. Include the 10 mg/mL concentration in the standard curve.
3. Stain 100 μL of each serial dilution point with ARS as described in Section B.
Note: Minimize error by using proper pipetting technique, holding the tip perpendicular to and just below the liquid surface. Holding it at an angle or deep under the surface can result in inaccurate volumes.
Critical: Carefully mix each dilution point before performing the serial dilution.
B. Staining with ARS
1. Thaw an aliquot of SF collected from OA patients by aspiration. Gently mix the SF before collecting the volume for the analysis without any pretreatment to avoid any possible loss of crystals during the procedure.
2. Add 100 μL of ARS solution to 100 μL of synovial fluid sample and standards, as prepared in section A, for crystal staining in a 1.5 mL conical vial. Vortex and incubate for 30 min at RT the 200 μL of STDs (prepared as described in Section A) and 200 μL of SFs mixed with ARS. After incubation, centrifuge the samples at 10,391× g for 10 min to obtain the crystal pellet.
3. After aspiration of the supernatant with a 1 mL tip, wash the pellets with 500 μL of distilled water at 10,391× g for 10 min. After supernatant discarding by aspiration with a 1 mL tip, add 300 μL of 10% acetic acid to the pellets to extract calcium crystals and incubate for 30 min at RT.
4. After centrifugation at 10,391× g for 10 min to eliminate possible debris, add 50 μL of 3% ammonium hydroxide to the samples to neutralize the acid [10].
Critical: Carefully aspirate the supernatant without touching the pellets to avoid possible disaggregation and loss of stained crystals.
C. Calcium crystals measurement by spectrophotometric analysis
1. Add 150 μL per well of samples and standards (SFs in duplicate and STDs in triplicate) in a 96-well plate and immediately read the absorbance at 510 nm with a plate reader [11]. Figure 1 shows the STD concentrations plotted on the X-axis and the absorbance on the Y-axis.
Critical: Read the absorbance of the samples within 15 min due to the stability of the samples.
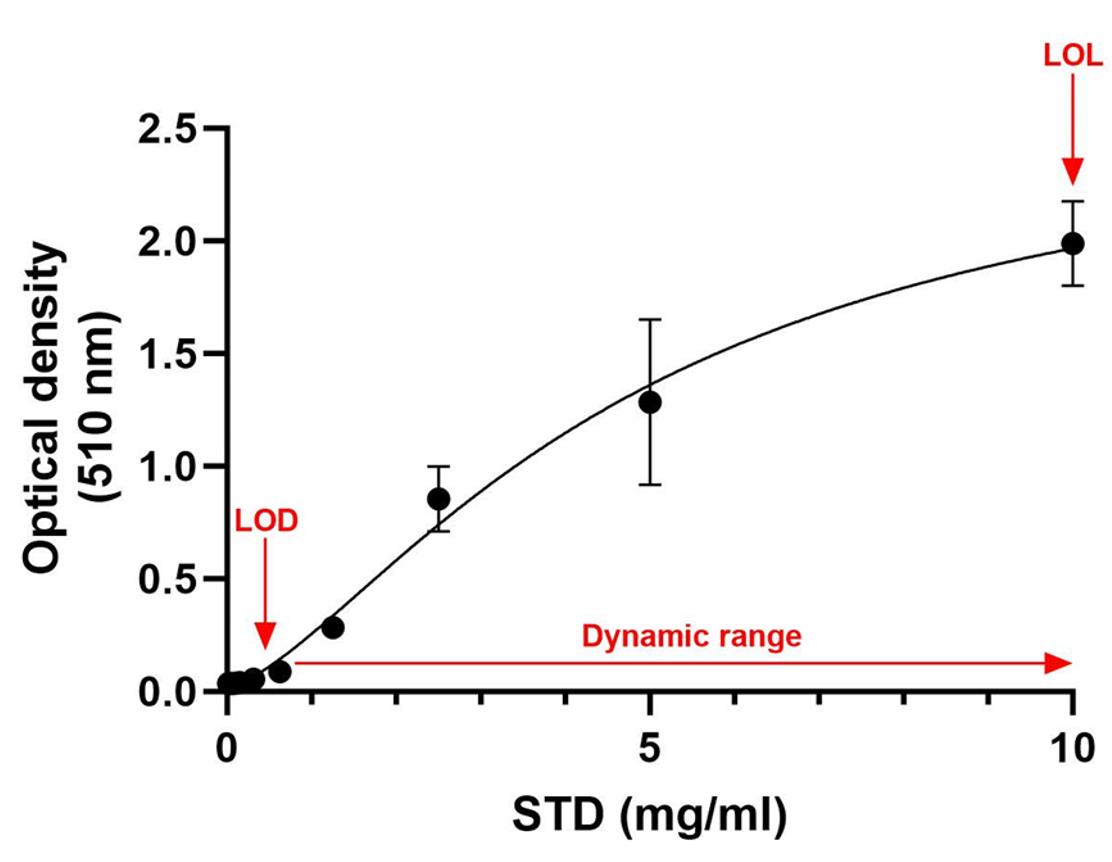
Figure 1. Four-parameter logistic (4PL) standard curve (R-squared = 0.9592). The STD concentrations are plotted on the X-axis and the absorbance on the Y-axis. STD, standard; LOD, limit of detection; LOL, limit of linearity.
D. Sample setup for ESEM analysis
Deposit 40 μL of SF samples on the aluminum stub previously covered with a conductive carbon adhesive disk and incubate the sample (Figure 2) in a humid chamber at 4 °C for 24–48 h before the analysis.
Note: The ESEM analysis of the elements present in the synovial fluid is a simple technique, as the samples are deposited without any type of treatment on the stub and observed after overnight incubation.
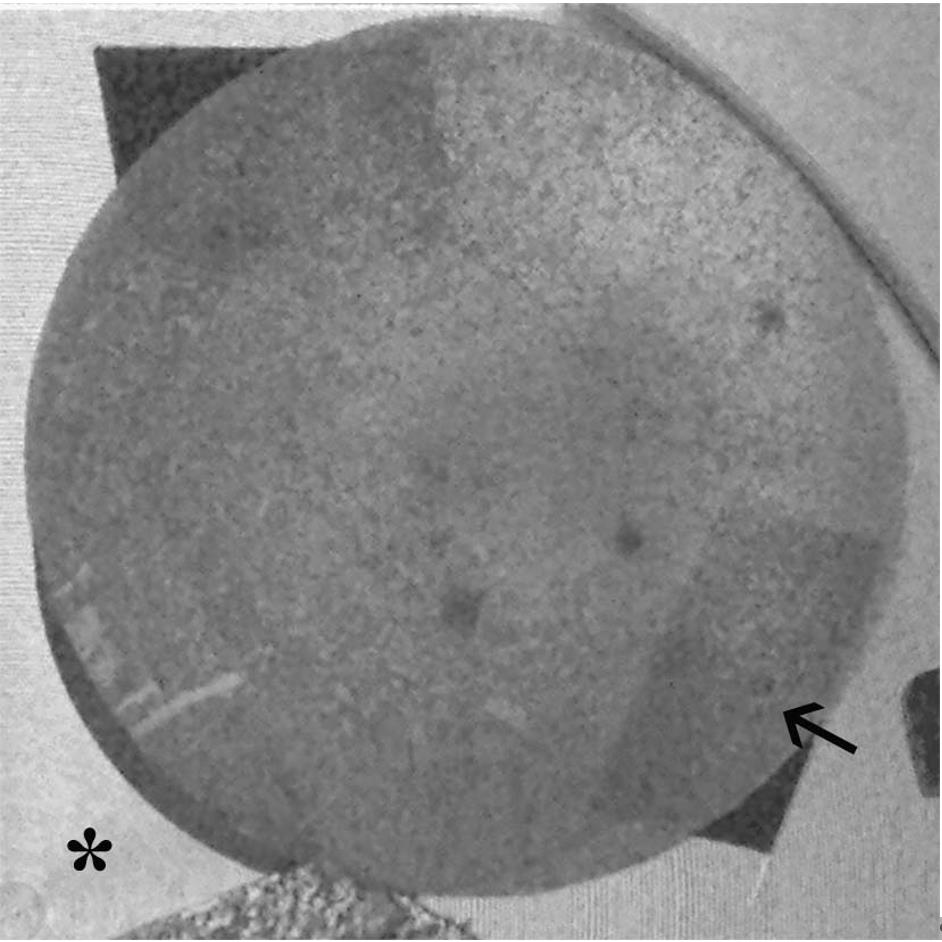
Figure 2. Aluminum stub covered with a conductive carbon adhesive disk (arrow) on the stub support inside the SEM camera (asterisk)
E. Calcium crystals identification by ESEM-EDS
1. Analyze the samples using a focused electron beam in a vacuum electron gun, with a pressure of 5.0 × 10⁻⁶ mbar.
Note. Use the ESEM in low-vacuum mode, with a specimen chamber pressure set at approximately 0.80 mbar, an accelerating voltage of 25 kV, a working distance of 10 mm, a tilt angle of 0°, a variable beam diameter, and a magnification between 250 and 120,000×.
2. Obtain the images by means of the back-scattered electron detector to highlight the presence of particles or aggregates. The spectrometric unit is equipped with an ECON (Edax Carbon Oxigen Nitrogen) 6 utw X-ray detector.
3. Analyze each sample with a time count of 100 s, an ampere time of 51, and a probe current of 290 μA.
4. Evaluate the central stub area considering the area with a diffuse presence of the crystal, excluding big crystal aggregates. Prepare the samples under complete sterility, changing the pipette for each sample.
5. Collect the morphometric data (number, size, and morphology) of all visible particles in the reference area through accurate observations and measurements in several ESEM images. For image analysis, use Photoshop and ImageJ software.
6. Select the images following two main criteria: (i) to be representative of the total area of each sample examined and (ii) to have a significant number of measurements. Examples of background images (Figure 3) and particles (Figure 4) are shown in Figure 3A and 3B.
Note: In the different single areas, examples of electrodense particles: 1) small particles with sizes ranging from 20 to 80 nm (not only calcium but also phosphate, sulfur, and potassium) in Figure 3; 2) big calcium particles with dimensions between 2 and 10 μm in Figure 4.
7. Use the ESEM-EDS equipment to determine the elemental composition of all visible particles in the selected area. Figures 3B and 4B show the composition (in % atomic) of the different types of particles detected.
Critical: The only precaution is to wait the same amount of time for all samples to obtain an effective and correct analysis. One minute of evaporation for 40 μL liquid samples is sufficient for an adequate analysis.
For reproducible data, the same operator prepared the entire series of samples.
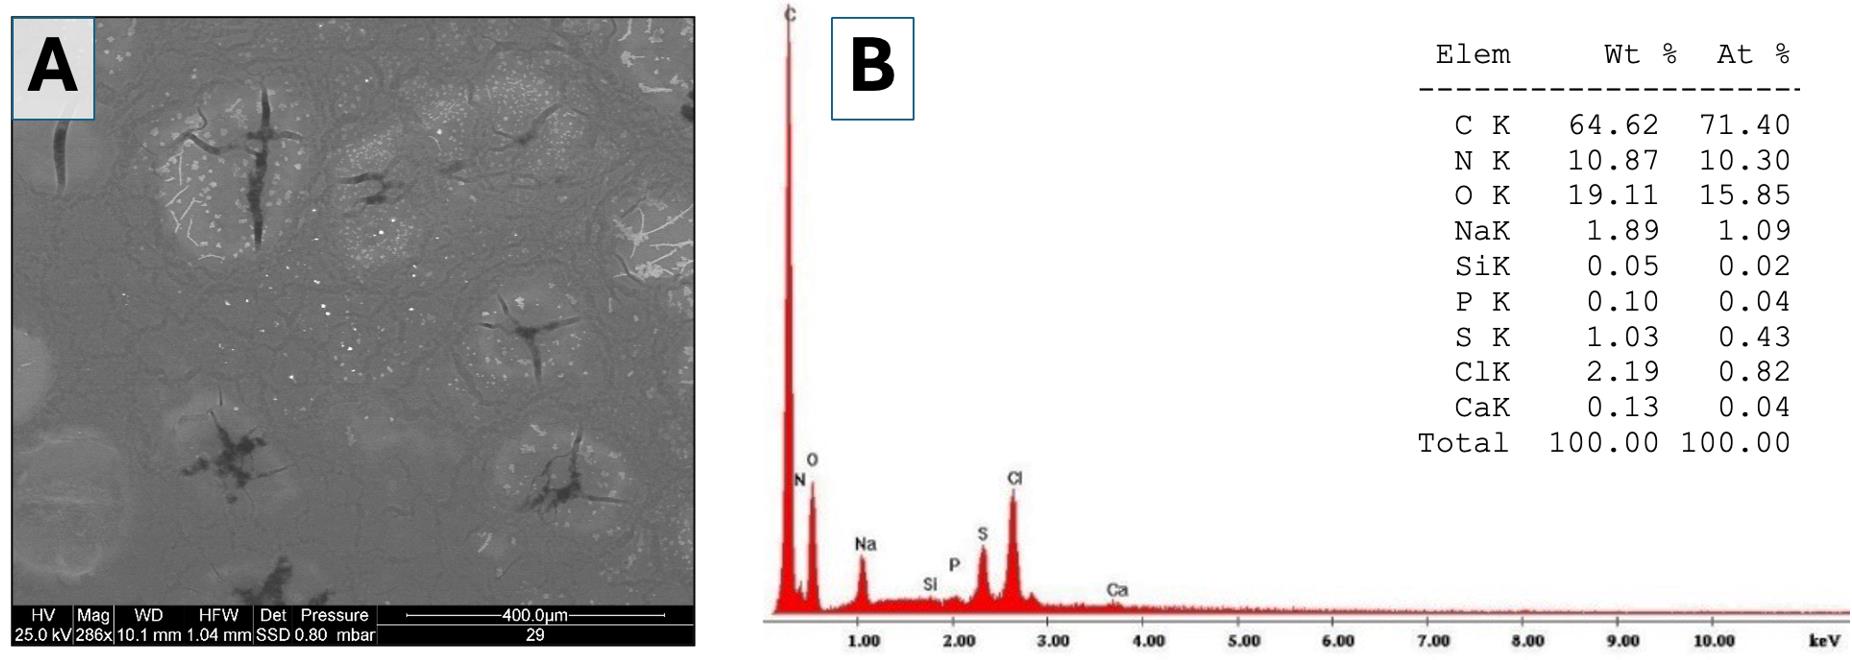
Figure 3. Environmental scanning electron microscopy (ESEM) analysis of the elements present in different areas of the background and evaluation of the elemental chemical composition of individual particles. (A) Low-magnification image (286×) acquired using backscattered electrons. Numerous particles (bright spots) are visible within a darker background matrix (synovial fluid). (B) Example of a spectrum showing the elemental chemical composition of a single particle. The table shows the weight percentages and atomic percentages of the detected elements (Elem = element; Wt = weight; At = atom).
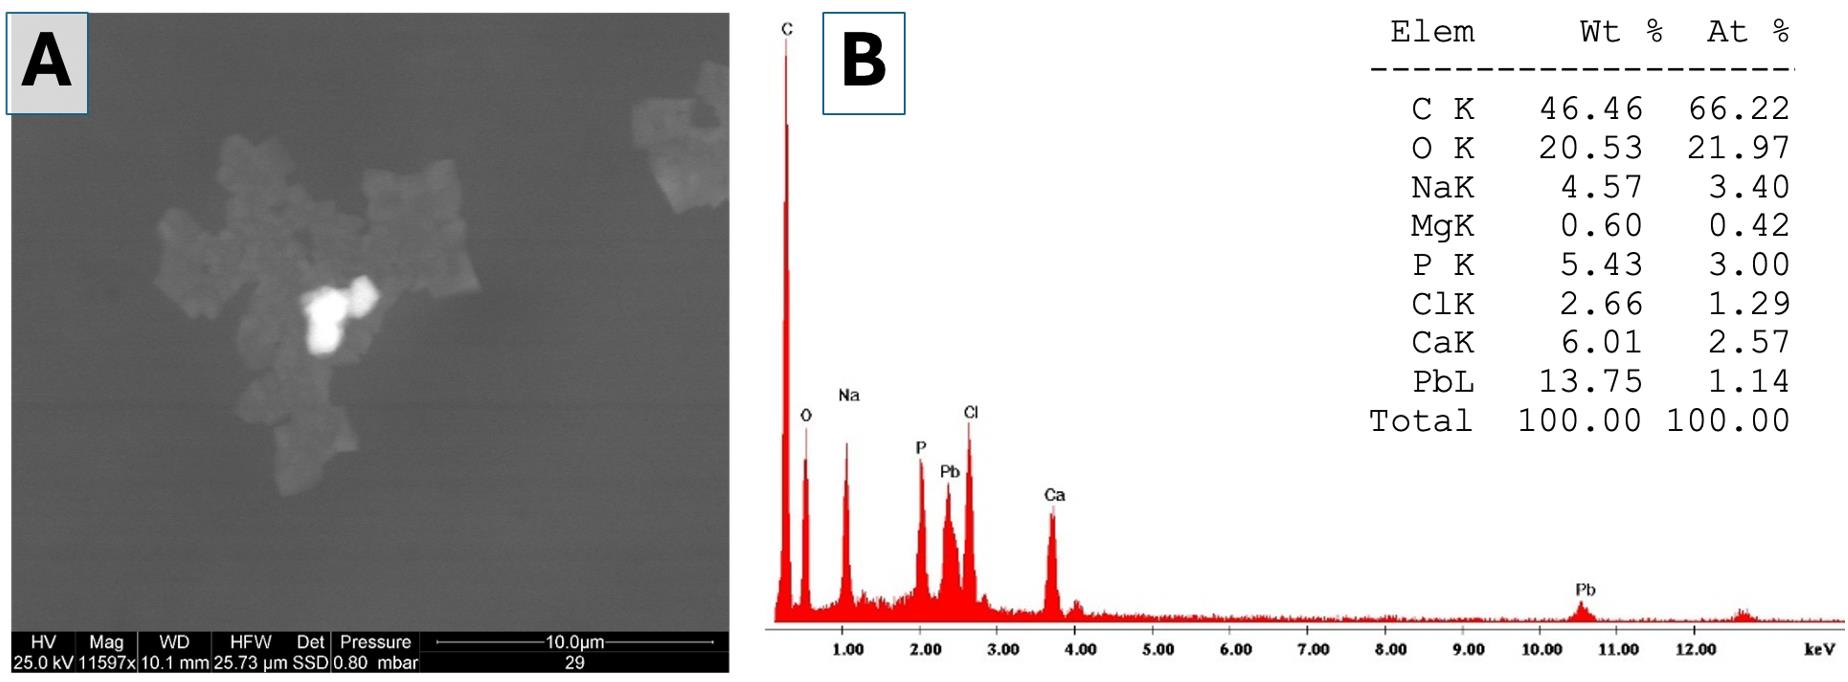
Figure 4. Environmental scanning electron microscopy (ESEM) analysis of the single element and evaluation of the elemental chemical composition. (A) Medium-magnification image (11,597×) acquired using backscattered electrons. A very bright particle is visible at the center, embedded in a dark organic aggregate. (B) Spectrum showing the elemental chemical composition of the bright particle in panel A. The table shows the weight percentages and atomic percentages of the detected elements (Elem = element; Wt = weight; At = atom).
Data analysis
A. Spectrophotometric analysis of ARS
To provide a reliable standard curve for ARS staining measurement, for each concentration of the STD curve, two separate vials were prepared, and each was measured in triplicate.
Data for known STDs were used by plotting the concentration on the X-axis and the absorbance on the Y-axis. To analyze the data, the measured absorbances of the unknown samples were plotted on the Y-axis, intersecting the standard curve, and the corresponding value on the X-axis was the concentration. The 4-parameter logistic (4PL) regression model, particularly useful for characterizing bioassays as they are often only linear across a specific range of concentration magnitudes, was highly suitable for the present assay (R-squared = 0.9592) (Figure 1). The standard curve shows a limit of detection (LOD) below 0.625 mg/mL and a limit of linearity (LOL) over 0.625 mg/mL with a wide dynamic range [12]. The STD curve was built using GraphPad Prism software to extrapolate the number of crystals in each sample.
The medium concentration of calcium crystal in SF samples was 1.705 mg/mL with a standard deviation (SD) of 0.215, which falls well within the assay’s detection range. The single concentration values are shown in Table 1.
Table 1. Concentration of calcium crystals in SF samples
| Sample | Concentration (mg/mL) |
|---|---|
| OA 1 | 1.748 |
| OA 2 | 1.523 |
| OA 3 | 1.443 |
| OA 4 | 1.924 |
| OA 5 | 1.888 |
B. ESEM analysis
Given the lack of a reference analytical procedure, an analytical method was established a priori that would allow the comparison of the results obtained in the different case studies. The surface of each sample was fully explored, selecting the zone richest in particulate matter. An area equivalent to 1 mm2 was then acquired, and the surface was carefully examined at high magnification (from about 2,000 to 4,000×), to highlight all the particles and to acquire images of their surface as well as their corresponding elemental chemical composition. The fields of reading were chosen so that the entire surface of the filter is explored, avoiding overlapping of the fields. For this purpose, a systematic path was followed on the filter according to a predetermined geometric pattern.
Validation of protocol
As for the ESEM analysis, in the absence of a standardized analytical procedure for the measurement of calcium crystals in synovial fluids using scanning electron microscopy (SEM), we adopted an analytical approach inspired by the current methodology used for the detection of hazardous mineral fibers on filters from environmental sampling (reference standard: UNI EN ISO 14966:2021). This method involves the identification and quantification of hazardous fibers by SEM within a 1 mm2 area on a polycarbonate filter, following environmental sampling. The analysis is conducted along a predefined geometric path, which ensures complete coverage of the selected surface without field overlap, at magnifications exceeding 2,000×.
General notes and troubleshooting
General notes
The present protocol is efficient and straightforward to quantify calcium crystals in human osteoarthritic synovial fluids by spectrophotometric analysis after staining with ARS.
One important limitation of using ARS staining to quantify calcium-containing crystals is related to the distinct stoichiometry (in terms of “number of calcium atoms”) and surface accessibility of the most abundant crystal types in SFs, CPP and BCP. Consequently, ARS staining generally produces a stronger signal for BCP than for CPP. In contrast, hydroxyapatite contains more calcium per formula unit than CPP. When a standard curve is generated using known concentrations of hydroxyapatite, the relative contribution of CPP in the sample is likely underestimated, providing a semi-quantitative measure of calcium present in synovial fluid. Therefore, the ESEM analysis was used to validate and confirm the elemental composition of the crystals quantified by spectrophotometric analysis.
It is noteworthy that ESEM analysis is an expensive tool, but also easy to use with no technical limitations, and that is why it can be used for careful and specific validation rather than for routine analysis. Certainly, future studies should be addressed toward testing the possibility of miniaturizing the process.
Troubleshooting
Problem 1: Standard curve preparation
A standard curve might have lower-than-expected absorbance values, leading to a flattening of the bottom of the curve, or higher absorbance values, leading to a flattening of the upper portion of the calibration curve.
Possible cause: Wrong concentration of the starting stock for a standard could lead to standards that are either under- or over-diluted.
Solution: Double-check standard stock concentration, dilutions calculations, and the dilutions. It is recommended to vortex vials to ensure all of the material has been reconstituted.
Problem 2: Crystal quantification
The crystal quantification assay has one potential limitation related to the sample quality. Standards and SFs are not in the same matrix, which might attenuate the signal of the analyte in some samples, especially in bloody SFs.
Possible cause: Presence of blood and small clots in the synovial fluid sample.
Solution: Sample selection.
Problem 3: Sample adhesion to the aluminum stub
Sample adhesion to the surface of the stub is crucial before placing it in the sample holder or stage.
Possible problem: Sample loss.
Solution: Secure the sample to the pin stub by using a double-sided carbon sticker.
Problem 4: Sample setup for ESEM analysis
When the electron microscopes operate at high vacuum levels, wet samples loaded in the imaging chamber will immediately start to outgas. In the case of liquid samples, as synovial fluids, it is necessary to prevent evaporation.
Possible problem: Sample loss.
Solution: Carefully dry the samples in a humid chamber before the analysis.
Problem 5: ESEM analysis
Spending a long time on a specific spot of the sample might cause damage to the sample over time.
Possible problem: Poor image quality.
Solution: Be quick during the analysis to prevent excessive alterations.
Acknowledgments
1) Specific contributions of each author: Conceptualization, E.O., M.B.; Investigation, E.O., M.B., L.V.; Writing–Original Draft, E.O., M.B.; Review & Editing, E.O., M.B., L.V.; Supervision, E.O.
2) The present study was funded by the Ministry of Health, 5xmille 2022 contribution (2021 income) to IRCCS Istituto Ortopedico Rizzoli.
We authors would like to underline that parts of this protocol modified and adapted to synovial fluid analysis the methods described in the following research articles:
Paul et al. [7]. Alizarin red S staining as a screening test to detect calcium compounds in synovial fluid. Arthritis Rheum. (Material and methods: “Alizarin red S staining techniques” pages 191–192 and Figure 1)
Gambari et al. [11]. Sulfurous thermal waters stimulate the osteogenic differentiation of human mesenchymal stromal cells - An in vitro study. Biomedicine and Pharmacotherapy (Figure 3A and B,c–d; Figure 4B).
Competing interests
The authors declare that they have no competing interests.
Ethical considerations
Written informed consent was obtained from all OA subjects who provided synovial fluid samples, with authorization granted by the Local Ethical Committee (Prot. gen. 0009072).
References
- Aronson, J. K. and Ferner, R. E. (2017). Biomarkers—A General Review. Curr Protoc Pharmacol. 76(1): e19. https://doi.org/10.1002/cpph.19
- Mobasheri, A., Fonseca, J. E., Gualillo, O., Henrotin, Y., Largo, R., Herrero-Beaumont, G. and Rocha, F. A. C. (2021). Editorial: Inflammation and Biomarkers in Osteoarthritis. Front Med. 8: e727700. https://doi.org/10.3389/fmed.2021.727700
- Lynch, T. S., O’Connor, M., Minkara, A. A., Westermann, R. W. and Rosneck, J. T. (2018). Biomarkers for Femoroacetabular Impingement and Hip Osteoarthritis: A Systematic Review and Meta-analysis. Am J Sports Med. 47(9): 2242–2250. https://doi.org/10.1177/0363546518803360
- Trisolino, G., Favero, M., Dallari, D., Tassinari, E., Traina, F., Otero, M., Goldring, S. R., Goldring, M. B., Carubbi, C., Ramonda, R., et al. (2020). Labral calcification plays a key role in hip pain and symptoms in femoroacetabular impingement. J Orthop Surg Res. 15(1): e1186/s13018–020–01610–z. https://doi.org/10.1186/s13018-020-01610-z
- Battistelli, M., Tassinari, E., Trisolino, G., Govoni, M., Ruspaggiari, G., De Franceschi, L., Dallari, D., Burini, D., Ramonda, R., Favero, M., et al. (2023). Hip Labral Morphological Changes in Patients with Femoroacetabular Impingement Speed Up the Onset of Early Osteoarthritis. Calcif Tissue Int. 112(6): 666–674. https://doi.org/10.1007/s00223-023-01076-1
- Oliviero, F. and Mandell, B. F. (2023). Synovial fluid analysis: Relevance for daily clinical practice. Best Pract Res Clin Rheumatol. 37(1): 101848. https://doi.org/10.1016/j.berh.2023.101848
- Paul, H., Reginato, A. J. and Ralph Schumacher, H. (1983). Alizarin red s staining as a screening test to detect calcium compounds in synovial fluid. Arthritis Rheum. 26(2): 191–200. https://doi.org/10.1002/art.1780260211
- Gatti, A., Manti, A., Valentini, L., Rocchi, M. B. L. and Montanari, S. (2021). Innovative scanning electron microscopic investigation in blood samples of patients affected by leukaemia: A physical-chemical-biological approach. Micron. 144: 103037. https://doi.org/10.1016/j.micron.2021.103037
- Kellgren, J. and Lawrence, J. (1957). Radiological Assessment of Osteo-Arthrosis. Ann Rheum Dis. 16(4): 494–502. https://doi.org/10.1136/ard.16.4.494
- Gregory, C. A., Grady Gunn, W., Peister, A. and Prockop, D. J. (2004). An Alizarin red-based assay of mineralization by adherent cells in culture: comparison with cetylpyridinium chloride extraction. Anal Biochem. 329(1): 77–84. https://doi.org/10.1016/j.ab.2004.02.002
- Gambari, L., Grigolo, B., Filardo, G. and Grassi, F. (2020). Sulfurous thermal waters stimulate the osteogenic differentiation of human mesenchymal stromal cells – An in vitro study. Biomed Pharmacother. 129: 110344. https://doi.org/10.1016/j.biopha.2020.110344
- Jarantow, S. W., Pisors, E. D. and Chiu, M. L. (2023). Introduction to the Use of Linear and Nonlinear Regression Analysis in Quantitative Biological Assays. Curr Protocol. 3(6): e801. https://doi.org/10.1002/cpz1.801
Article Information
Publication history
Received: Jun 27, 2025
Accepted: Sep 24, 2025
Available online: Oct 17, 2025
Published: Nov 5, 2025
Copyright
© 2025 The Author(s); This is an open access article under the CC BY-NC license (https://creativecommons.org/licenses/by-nc/4.0/).
How to cite
Battistelli, M., Valentini, L. and Olivotto, E. (2025). A Quantitative Spectrophotometric Assay Matched With Environmental Scanning Electron Microscopy to Measure Calcium Crystals in Human Osteoarthritic Synovial Fluid. Bio-protocol 15(21): e5495. DOI: 10.21769/BioProtoc.5495.
Category
Medicine > Inflammation
Biochemistry > Other compound
Biophysics > Microscopy > Scanning electron microscopy
Do you have any questions about this protocol?
Post your question to gather feedback from the community. We will also invite the authors of this article to respond.