- Protocols

- Articles and Issues
- For Authors
- About
- Become a Reviewer

Production of Genetically Engineered Extracellular Vesicles for Targeted Protein Delivery
Published: Vol 15, Iss 21, Nov 5, 2025 DOI: 10.21769/BioProtoc.5494 Views: 1638
Reviewed by: David PaulAnonymous reviewer(s)
Original research article
The authors used this protocol in:

Dec 2024

Protocol Collections
Comprehensive collections of detailed, peer-reviewed protocols focusing on specific topics


Related protocols
Abstract
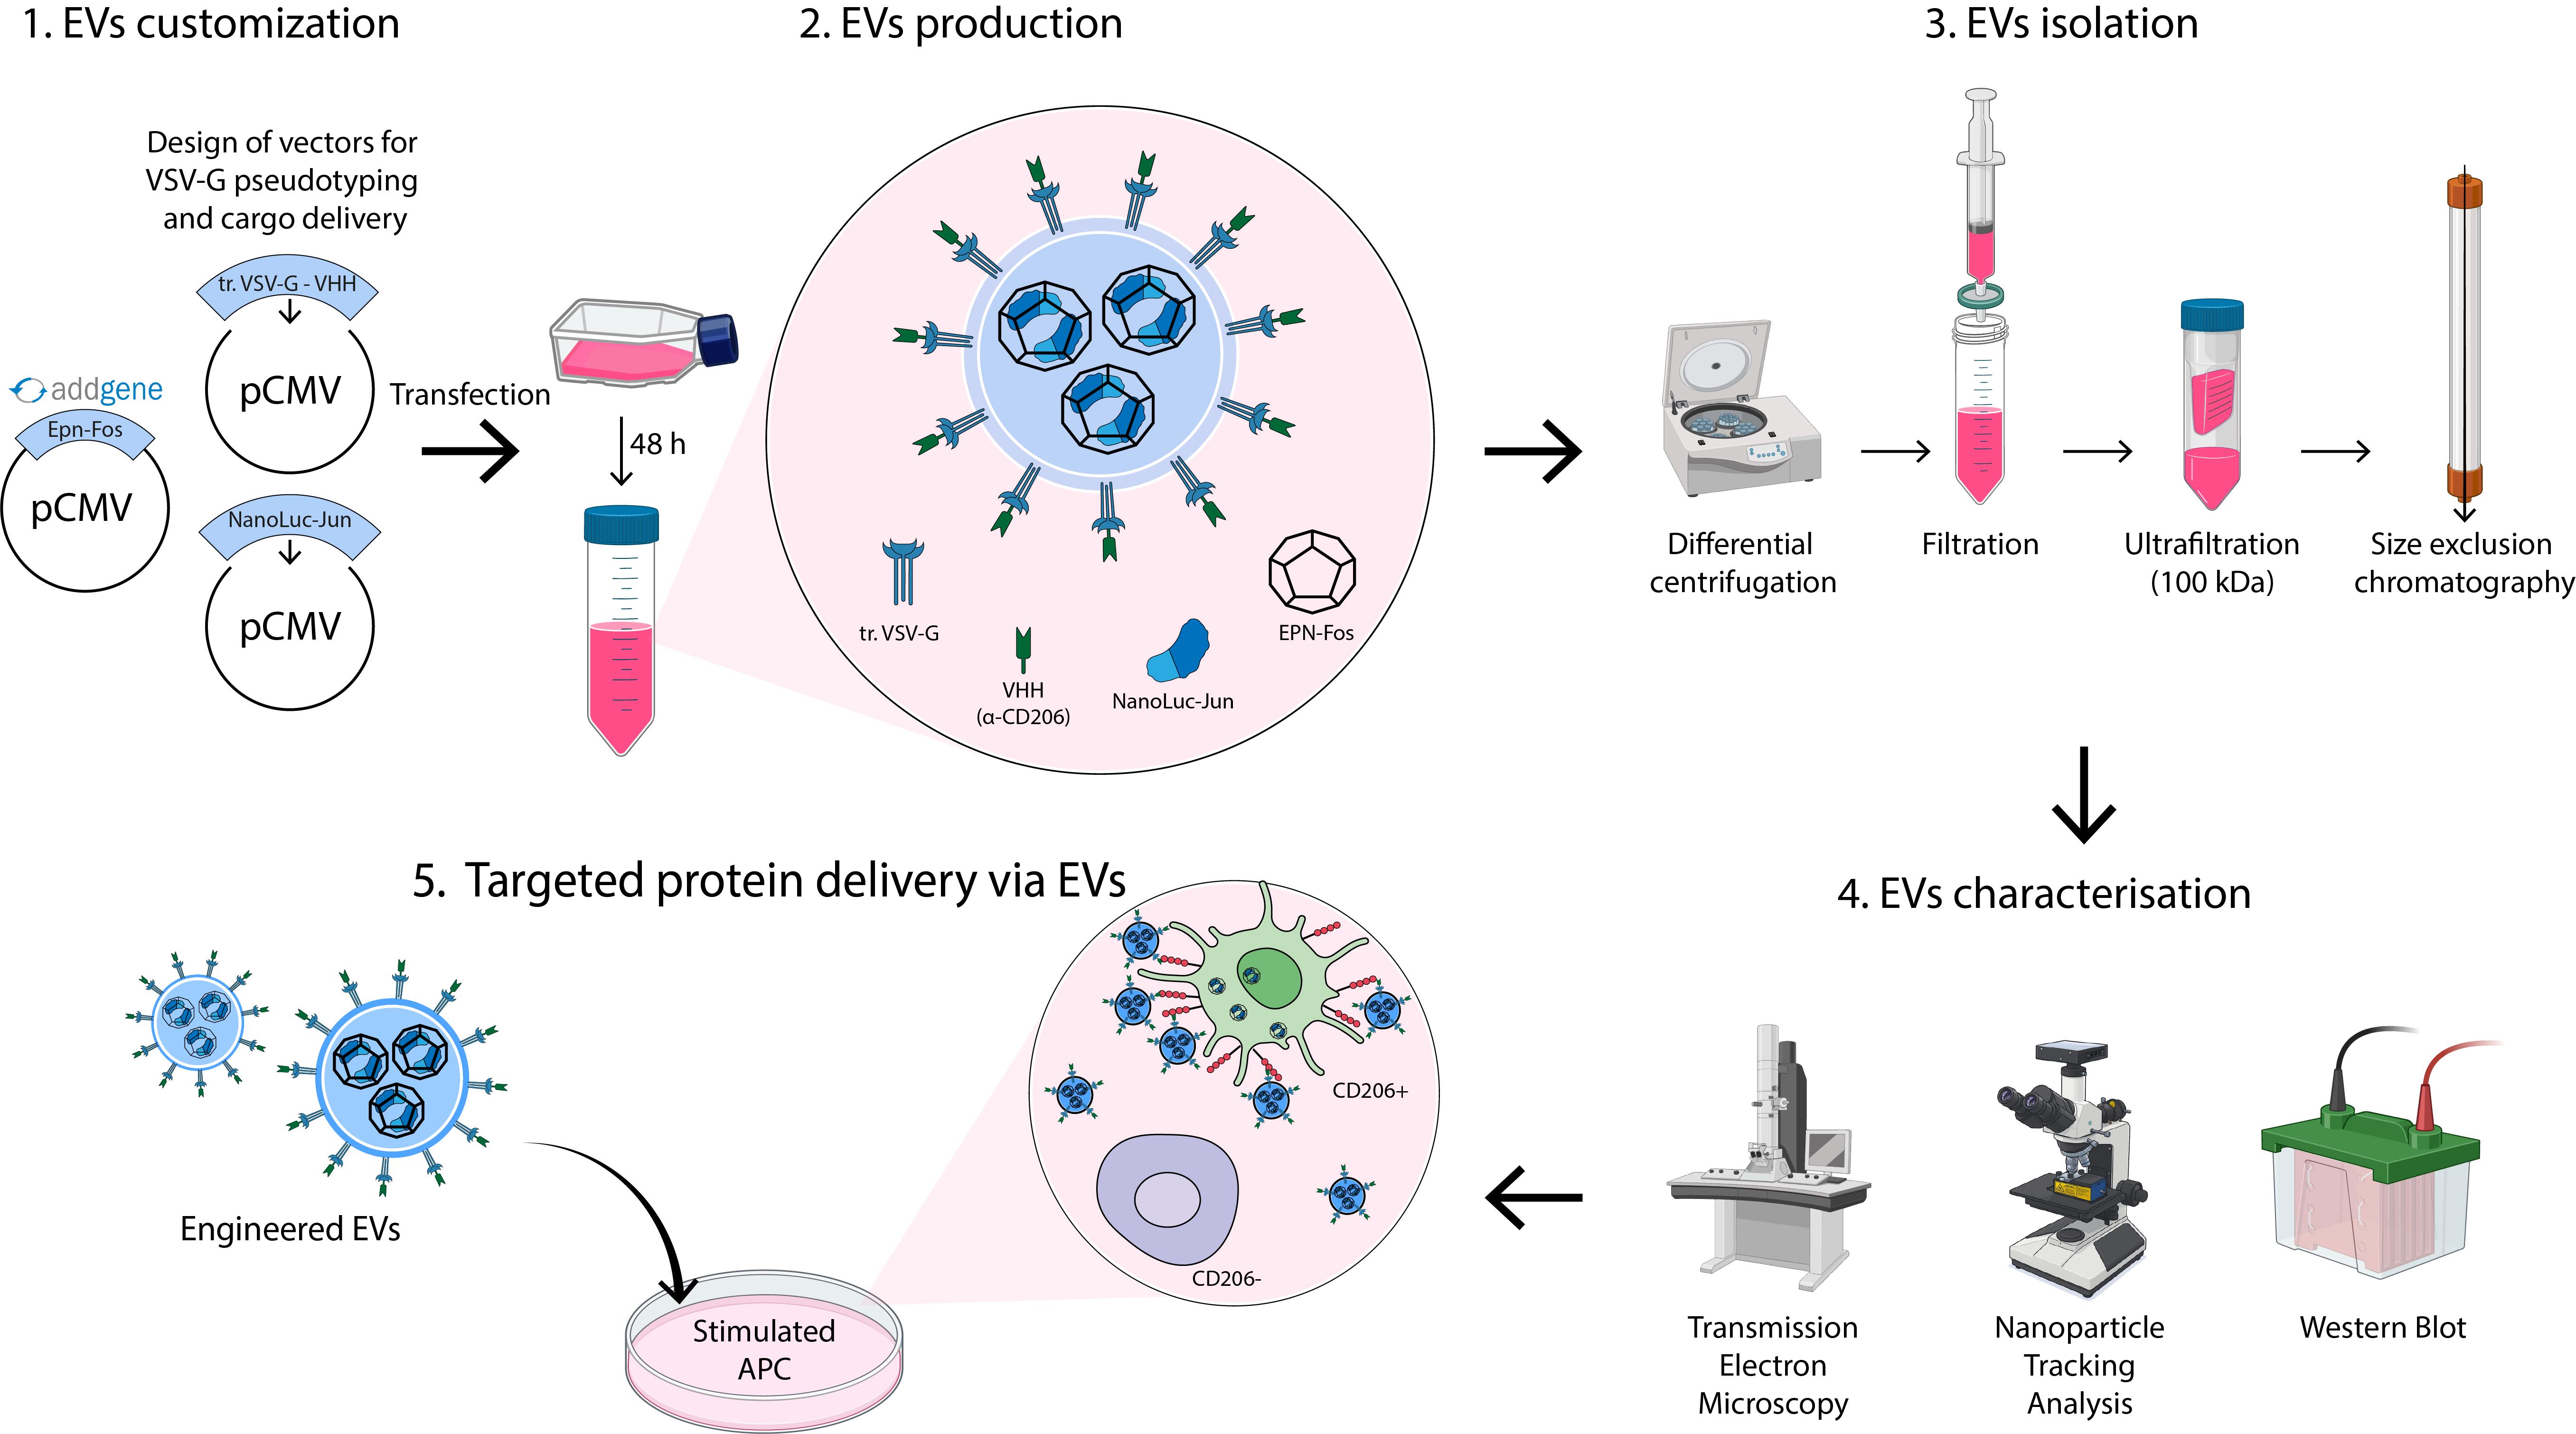
Extracellular vesicles (EVs) have emerged as promising carriers for the targeted delivery of therapeutic proteins to specific cells. Previously, we demonstrated that genetically engineered EVs can be used for targeted protein delivery. This protocol details the generation of mannose receptor (CD206)-targeted EVs using a modular plasmid system optimized for production in HEK293T cells. Three plasmids enable customizable EV budding, cargo loading, and surface modification for targeting to antigen-presenting cells (APCs). EVs are isolated via differential centrifugation and chromatography, characterized using transmission electron microscopy (TEM) and nanoparticle tracking analysis (NTA), and validated through functional uptake assays in primary human activated dendritic cells. Our approach combines flexibility in engineering required EVs with robust, reproducible isolation and characterization workflows. Its modularity allows easy adaptation to alternative targets or cargoes, which can be validated immediately through in vitro testing.
Key features
• First detailed protocol for generating genetically engineered EVs with fusogenic VSV-G protein and CD206-specific targeting.
• Enables rapid customization of EVs for diverse therapeutic cargo and cell-targeting applications.
• Integrates gold-standard EV isolation with multi-modal characterization to ensure reliability.
• A universal platform for customizable cell targeting: swapping VSV-G-linked llama nanobodies with diverse specificities.
Keywords: EVsGraphical overview
Background
Targeted delivery of therapeutic proteins to specific cells represents a promising strategy for treating a variety of autoimmune, cancer, and viral diseases. To maximize efficacy and safety, numerous delivery platforms are being developed, with the primary goals of widening the therapeutic window, minimizing off-target effects, and overcoming challenges related to the solubility and stability of bioactive molecules. Among the diverse range of carrier systems under investigation, extracellular vesicles (EVs) have emerged as particularly promising candidates due to their inherent biocompatibility and modularity [1,2].
A key advantage of EVs lies in their naturally derived, biodegradable lipid bilayer, which can be engineered to modulate protein composition, physicochemical properties, and surface markers for cell-specific targeting [3,4]. A prominent example of such engineering is the use of the vesicular stomatitis virus glycoprotein G (VSV-G). VSV-G-pseudotyped EVs have been demonstrated to mediate efficient intracellular protein delivery in vitro and facilitate genome-editing processes in vivo [5]. Parallel to the bioengineering of natural EVs, advances in protein engineering have enabled the de novo design of self-assembling protein scaffolds. For instance, the KDPG aldolase from Thermotoga maritima—which naturally forms trimeric building blocks—was engineered to assemble into hyperstable dodecahedron structures—enveloped protein nanocages (EPNs) [6]. A pivotal step toward integrating these fields was taken by Votteler et al., who designed a hybrid platform employing VSV-G-pseudotyped EVs to encapsulate such synthetic protein scaffolds [7]. The resulting EVs, which feature a protein dodecahedron nanocage within a lipid bilayer, are capable of efficient autonomous release from producer cells.
Accurate and efficient isolation of EVs is a critical step in EV research, yet it remains a significant challenge [8]. Currently, no universal isolation method exists; the choice of technique depends on the study’s specific requirements, including yield, purity, and downstream applications [9]. To enhance both recovery and purity, researchers often combine multiple methods. While novel EV isolation techniques are continually emerging, well-established protocols—such as differential centrifugation followed by ultracentrifugation and size-exclusion chromatography (SEC)—remain widely used due to their reproducibility and reliability [10–12].
Following isolation, EV characterization is essential to confirm identity, purity, and functionality. Imaging techniques play a pivotal role, with transmission electron microscopy (TEM), scanning electron microscopy (SEM), and cryo-electron microscopy (cryo-EM) being the most common [13]. Notably, TEM often produces cup-shaped EV images due to sample dehydration and staining, whereas cryo-EM preserves EVs’ native morphology, providing more accurate structural insights [14]. For size distribution analysis, dynamic light scattering (DLS) is frequently employed [15]. This non-invasive technique measures fluctuations in scattered light caused by Brownian motion to determine the hydrodynamic diameter and polydispersity index (PDI). However, while DLS is suitable for monodisperse particles in solution (PDI < 0.07, as per ISO 22412:2017), its accuracy is significantly compromised for heterogeneous EV samples due to inherent size polydispersity and sensitivity to larger particles/aggregates. Consequently, techniques like nanoparticle tracking analysis (NTA) or tunable resistive pulse sensing (TRPS) are strongly preferred for size profiling and concentration measurement of EVs. Both techniques operate on a particle-by-particle basis, well-suited for complex biological polydisperse samples like EVs [16]. Nevertheless, as they detect all particles within their size sensitivity range (e.g., protein aggregates or contaminants), appropriate blank controls are essential to ensure EV-specific measurements.
Beyond physical properties, molecular profiling of EVs is crucial. Mass spectrometry and western blotting are widely used to analyze EV cargo and surface markers, ensuring proper characterization per the MISEV guidelines [17]. These techniques are particularly valuable for engineered EVs, as they verify specific cargo loading.
Here, we detail an optimized protocol for producing mannose receptor (CD206)-targeting engineered EVs from HEK293T cells, adaptable to diverse producer cell lines via transient transfection [18,19]. Our protocol allows for the isolation of 1012 highly purified engineered EVs from 1 L of media. The system requires three plasmids:
1) truncated_VSV-G_VHH_pCMV: Encodes a truncated VSV-G protein fused to a nanobody (VHH) against CD206, facilitating EV budding and targeted delivery to antigen-presenting cells (APCs).
2) EPN-Fos_pCMV: Encodes a self-assembling enveloped protein nanocage (EPN), facilitating cargo loading into EVs.
3) cargo-protein-Jun_pCMV: Encodes the protein of interest fused to the Jun domain, enabling cargo loading into EPN via Fos-Jun heterodimerization. For initial experiments, we recommend using NanoLuc-Jun_pCMV (Addgene ID: 167308), encoding NanoLuc as a model cargo, followed by substitution of the NanoLuc sequence with the gene encoding your protein of interest.
The EPN-Fos_pCMV plasmid is available through Addgene (https://www.addgene.org/167306/). Additionally, precursor plasmids enabling the construction of the modular truncated_VSV-G_VHH_pCMV (https://www.addgene.org/80054/) and cargo-protein-Jun_pCMV (https://www.addgene.org/167308/) are also available. Other plasmids are available from the corresponding author upon request. Through this customization, researchers achieve tailored EV targeting (via VHH engineering) and specific protein delivery (via cargo substitution).
As a proof of concept, we detail the production of NanoLuc-loaded EVs targeted to CD206+ APCs and provide a protocol for differentiating primary human dendritic cells (DCs) to validate EV uptake and functionality.
Materials and reagents
Biological materials
1. HEK293T cell line [Russian Cell Culture Collection (RCCC), Institute of Cytology of the Russian Academy of Sciences]
Reagents
1. Advanced DMEM (Gibco, catalog number: 12491015)
2. Advanced RPMI 1640 medium (Gibco, catalog number: 12633012)
3. Ammonium chloride (Sisco Research Laboratories Pvt. Ltd., catalog number: 25103)
4. Antibiotic-antimycotic (100×) (Gibco, catalog number: 15240062)
5. Blotting-grade blocker non-fat dry milk (Bio-Rad, catalog number: 1706404XTU)
6. Bovine serum albumin (BSA) (Sigma-Aldrich, catalog number: A7030)
7. ClarityTM Western ECL substrate (Bio-Rad, catalog number: 1705060)
8. Ethylenediaminetetraacetic acid (EDTA) (PanReac Applichem, catalog number: A1103)
9. Fetal bovine serum (FBS) (Gibco, catalog number: A5670201)
10. Fetal bovine serum (FBS), exosome-depleted (Gibco, catalog number: A2720801)
11. Ficoll Paque Plus (Cytiva, catalog number: GE17-1440-03)
12. GlutaMAXTM supplement (Gibco, catalog number: 35050061)
13. Glycine (ITW Reagents, catalog number: A1067)
14. HyCloneTM characterized FBS, U.S. origin (Cytiva, catalog number: SH30071.04)
15. Laemmli buffer 4× (Bio-Rad, catalog number: 1610747)
16. LipofectamineTM 3000 transfection reagent (Invitrogen, catalog number: L3000015)
17. MEM non-essential amino acids solution (100×) (Gibco, catalog number: 11140035)
18. Nano-Glo luciferase assay (Promega, catalog number: N1110)
19. NEBuilder HiFi DNA Assembly Cloning kit (NEB, catalog number: E5520S)
20. Opti-MEMTM reduced serum medium (Gibco, catalog number: 31985070)
21. PBS pH 7.4 (10×), without calcium and magnesium (Gibco, catalog number: 70011-036)
22. PBS pH 7.4 (1×), without calcium and magnesium (Gibco, catalog number: 10010031)
23. PE anti-human CD206 (MMR) antibody (BioLegend, catalog number: 321105)
24. PierceTM BCA Protein Assay kit (Thermo Scientific, catalog number: 23225)
25. Potassium bicarbonate (Sigma-Aldrich, catalog number: 60339)
26. Proteinase K (Evrogen, catalog number: EK101)
27. Restriction endonuclease BstBI (NEB, catalog number: R0519S)
28. Restriction endonuclease MfeI-HF (NEB, catalog number: R3589S)
29. rhGM-CSF (Sci-Store, catalog number: PSG030-10)
30. rhIL-4 (Sci-Store, catalog number: PSG040-10)
31. Sodium pyruvate (100 mM) (Gibco, catalog number: 11360070)
32. T4 DNA ligase (NEB, catalog number: M0202S)
33. Tris(hydroxymethyl)aminomethane (Sigma-Aldrich, catalog number: 1.08307)
34. Trypan blue dye (Bio-Rad, catalog number: 1450013)
35. Trypsin-EDTA (0.05%), phenol red (Gibco, catalog number: 25300054)
36. Tween-20 (Servicebio, catalog number: GC204002-100ml)
37. Uranyl acetate (UA) reagent (EMS, catalog number 22400)
Solutions
1. Complete DMEM (see Recipes)
2. Complete RPMI-1640 (see Recipes)
3. PBS 0.1% BSA (see Recipes)
4. PBS-T (see Recipes)
5. Blocking buffer (see Recipes)
6. Transfer buffer (see Recipes)
7. ACK lysis buffer (see Recipes)
8. 1% uranyl acetate (see Recipes)
Recipes
1. Complete DMEM
| Reagent | Final concentration | Quantity or volume |
|---|---|---|
| Advanced DMEM | 1× | 440 mL |
| FBS | 10% | 50 mL |
| GlutaMAX supplement (100×) | 1× | 5 mL |
| Antibiotic-antimycotic (100×) | 1× | 5 mL |
Note: By default, standard FBS (catalog number: A5670201) is used unless exosome-free FBS (catalog number: A2720801) is specifically indicated.
2. Complete RPMI-1640
| Reagent | Final concentration | Quantity or volume |
|---|---|---|
| Advanced RPMI-1640 | 1× | 440 mL |
| FBS | 10% | 50 mL |
| GlutaMAX Supplement (100×) | 1× | 5 mL |
| Antibiotic-Antimycotic (100×) | 1× | 5 mL |
3. PBS 0.1% BSA
| Reagent | Final concentration | Quantity or volume |
|---|---|---|
| PBS (1×) (catalog number: 10010031) | 1× | 100 mL |
| BSA | 0.1% | 0.1 g |
Filter through a 0.22 μm filter.
4. PBS-T
| Reagent | Final concentration | Quantity or volume |
|---|---|---|
| PBS (1×) (catalog number: 10010031) | 1× | 999 mL |
| Tween-20 | 0.1% | 1 mL |
5. Blocking buffer
| Reagent | Final concentration | Quantity or volume |
|---|---|---|
| PBS-T | 1× | 50 mL |
| Blotting-grade blocker non-fat dry milk | 5% | 2.5 g |
6. Transfer buffer
| Reagent | Final concentration | Quantity or volume |
|---|---|---|
| Tris | 68.4 mM | 8.29 g |
| Glycine | 39 mM | 2.92 g |
| Ethanol 96% | 20% | 208 mL |
| Milli-Q water | n/a | to 1 L |
7. ACK lysis buffer
| Reagent | Final concentration | Quantity or volume |
|---|---|---|
| Ammonium chloride | 150 mM | 8.02 g |
| Potassium bicarbonate | 10 mM | 1 g |
| EDTA (300 mM) | 0.1 mM | 0.33 mL |
| Milli-Q water | n/a | to 1 L |
Adjust the pH to 7.2–7.4. Filter through a 0.22 μm filter. Store at 4 °C for short-term use or aliquot and freeze at -20 °C for long-term storage.
8. 1% uranyl acetate
| Reagent | Final concentration | Quantity or volume |
|---|---|---|
| Uranyl acetate (UA) | 1% | 500 mg |
| Milli-Q water | n/a | to 50 mL |
Use a magnetic stirrer. Filter through a 0.22 μm filter. Protect the solution from light and store at 4 °C.
Laboratory supplies
1. Cell culture flask 25 cm2 (T25) filter cap, treated (SPL, catalog number: 70025)
2. Cell culture flask 75 cm2 (T75) filter cap, treated (SPL, catalog number: 70075)
3. Conical tubes, 15 mL (SPL, catalog number: 50015)
4. Conical tubes, 50 mL (SPL, catalog number: 50050)
5. PES membrane syringe filters, 0.45 μm (Corning, catalog number: 09-754-29)
6. Amicon Ultra-15 100 kDa centrifugal filter units (Merck, Millipore, catalog number: UFC910024)
7. Protein LoBind tubes 1.5 mL (Eppendorf, catalog number: 0030108116)
8. Superose 6 10/300 column (Cytiva, catalog number: 17517201)
9. Microplates, 384-well, PS, μCLEAR®, black, non-binding (Greiner Bio-One, catalog number: 781906)
10. Nitrocellulose western blotting membrane Amersham Protran 0.45 (Cytiva, catalog number: 10600012)
11. VACUETTE® EDTA-K2-coated tubes 9.0 mL (Greiner Bio-One, catalog number: 455045)
12. Parafilm M laboratory film (Pechiney Plastic Packaging Company, catalog number: PM996)
13. Carbon-coated TEM grids 200 mesh (EMS, catalog number: CF200-Cu-50)
14. Sharp tweezers (Ted Pella, DUMONT Biology, catalog number: 504)
15. Glass reagent bottle with GL45 PP cap and PP outlet ring, 250 or 500 mL (Simax, catalog number: 1632414321250 or 1632414321500)
16. Two-piece 2 mL plastic medical syringe with needles BD DiscarditTM II (BD, catalog number: 300928)
17. Self-standing PP centrifuge tubes 50 mL (Corning, catalog number: 430921)
Equipment
1. Laboratory ultrapure water system (Merck Millipore, model: Milli-Q IQ 7000)
2. Autoclave (Tuttnauer, model: 2840EL)
3. pH meter (Mettler Toledo, model: SevenMulti)
4. Spectrophotometer (Thermo Fisher Scientific, model: ND-2000)
5. Thermal cycler (Bio-Rad, model: T100)
6. Microcentrifuge (Eppendorf, model: 5415R) with fixed-angle rotor (Eppendorf, model: FA-45-24-11)
7. Flow cytometer (ACEA Biosciences, model: NovoCyte 2060)
8. Nanoparticle tracking analysis system (Malvern Panalytical, NanoSight Ltd, model: NanoSight LM10 HS-BF with 405 nm, 65 mW laser unit and high sensitivity camera)
9. Transmission electron microscope (JEOL, model: JEM-1400)
10. Cell sorter (Sony Biotechnology, model: SH800)
11. Glow discharge unit (Emitech Ltd., model: K100X)
12. High performance liquid chromatography (HPLC) system (Waters, model: 1525 Binary HPLC Pump with 2487 Dual λ Absorbance Detector and In-line Degasser)
13. Multimode microplate reader (Thermo Fisher Scientific, model: Varioskan LUX)
14. Gel documentation system (Bio-Rad, model: ChemiDoc MP Imaging System)
15. Centrifuge (Eppendorf, model: 5804 R) with swing-bucket rotor (Eppendorf, model: S-4-72)
Software and datasets
1. NTA Analysis Software (Malvern Panalytical, Version: NanoSight NTA 2.3 Build 0033)
2. Flow Cytometry Acquisition Software (ACEA Biosciences, Version: NovoExpress 1.6.0)
3. Particle Analysis Software (ScanEV v2.1.1)
Procedure
A. Construction of required plasmids
Three plasmids are required to obtain genetically encoded EVs:
1) truncated_VSV-G_VHH_pCMV (Figure 1)
2) cargo-protein-Jun_pCMV (Figure 2)
3) EPN-Fos_pCMV.
EPN-Fos_pCMV plasmid is available through the Addgene plasmid repository (https://www.addgene.org/167306/). Truncated_VSV-G_VHH_pCMV and cargo-protein-Jun_pCMV should be customized for users’ specific experimental requirements.
A1. Cloning strategy for truncated_VSV-G_VHH_pCMV (Figure 1)
1. Generation of truncated_VSV-G_pCMV
a. Replace the region of the full-length VSV-G gene (https://www.addgene.org/80054/) between the BstBI and MfeI restriction sites with a truncated form amplified using the primers:
Forward primer: 5′- CATTGGGGTGAATTGCTTCGGAAGTCAGGTGCAGCTGCAGG -3′
Reverse primer: 5′- CGTCTTGAATGTGAGGATGTTCGAAGCTGCCTCCTCCTGAGCT -3′
Note: Although this resulting truncated VSV-G (UniProt: P03522 a.a. 1–16, 421–511) loses its ability to bind the low-density lipoprotein receptor (LDLR) and independently attach to mammalian cells, it remains sufficient for efficient vesicle budding and retains fusogenic activity to mediate EV cargo release into the cytoplasm of target cell via fusion with the endosomal membrane after endocytosis [20].
2. Generation of VHH-encoding PCR product
a. Obtain a synthetic DNA fragment encoding the VHH, flanked by 5′ and 3′ terminal sequences precisely complementary to the linearized ends of the truncated_VSV-G_pCMV vector backbone, enabling directional assembly:
5′ complementary region: CATTGGGGTGAATTGCTT
3′ complementary region: CGAACATCCTCACATTC
Note: For an effective anti-CD206 VHH, we recommend using clone 26.7, as previously published [19,21].
3. Assembly of final truncated_VSV-G_VHH_pCMV plasmid
a. Linearize the intermediate truncated_VSV-G_pCMV with BstBI (intermediate plasmid). BstBI restriction site is located within the truncated VSV-G coding sequence, specifically between the region encoding the native signal peptide (UniProt P03522, a.a. 1–16) and the region encoding the C-terminal domains of full-sized VSV-G (part of the membrane-proximal domain, the full transmembrane domain, and the cytosolic tail; a.a. 421–511).
b. Assemble the linearized plasmid and VHH-encoding fragment using HiFi DNA Assembly Master Mix.
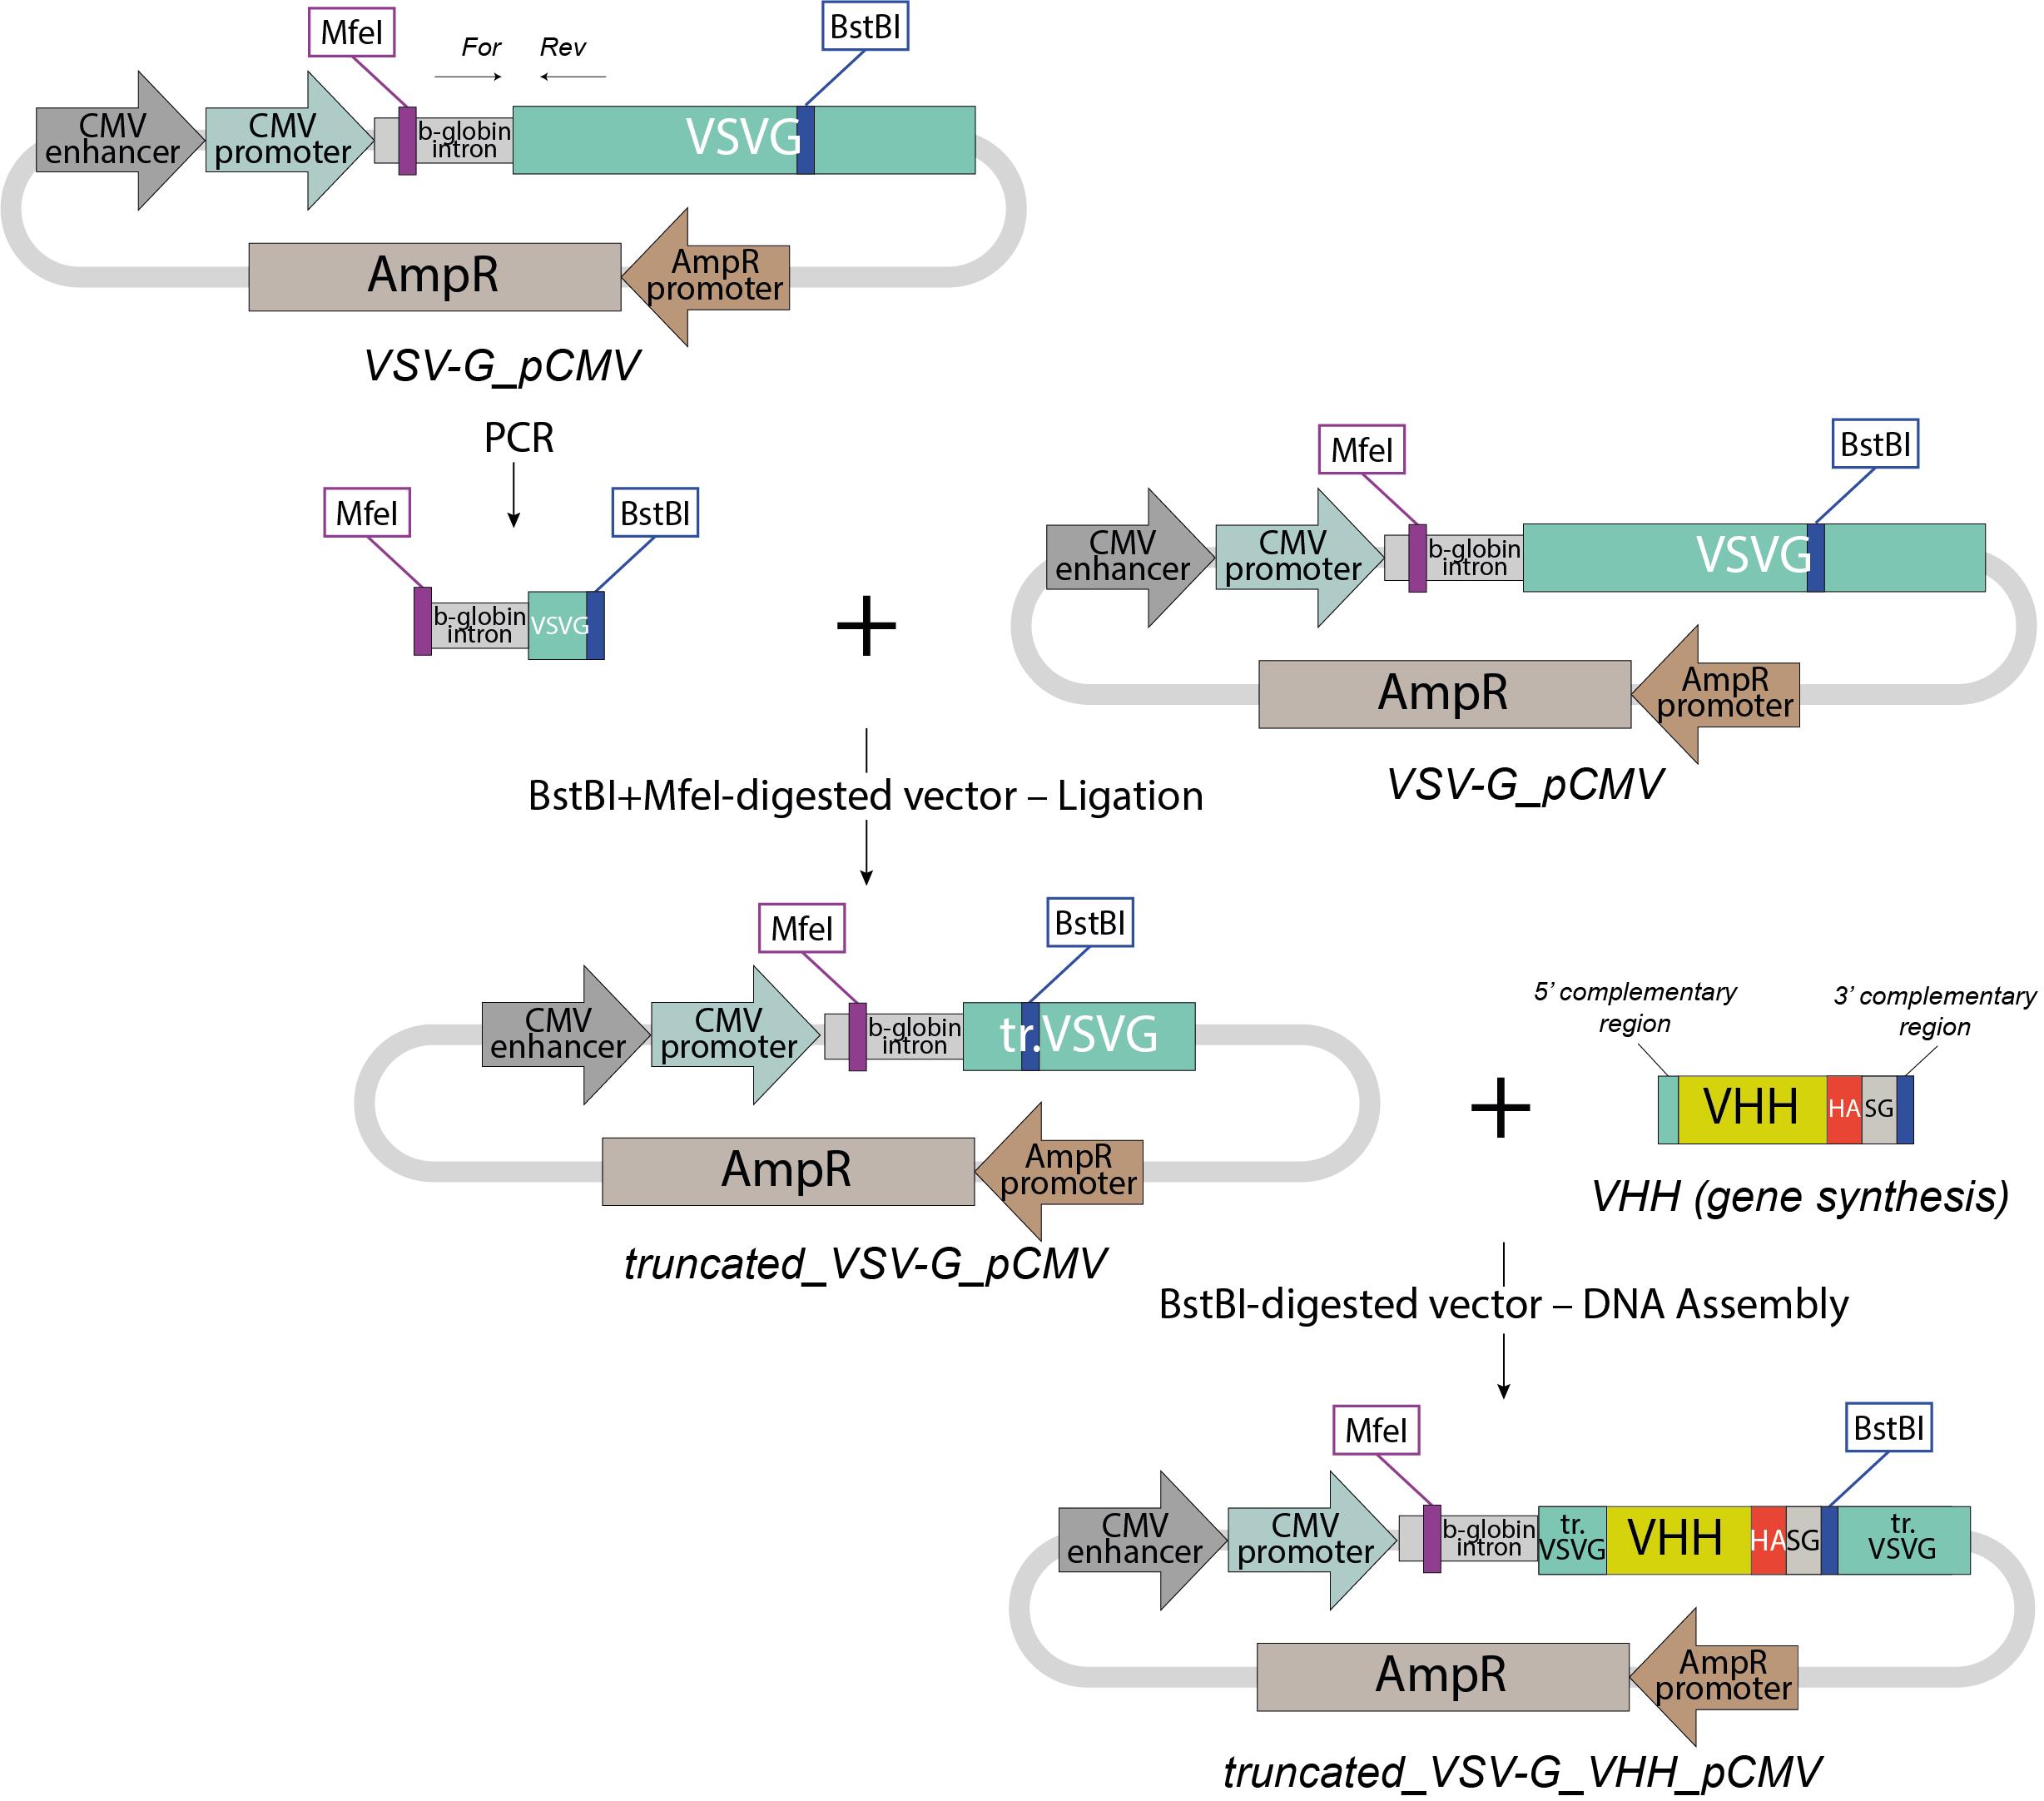
Figure 1. Cloning strategy for truncated_VSV-G_VHH_pCMV EVs packing plasmid
A2. Cloning strategy for Cargo-protein-Jun_pCMV (Figure 2)
1. Digest the pCMV backbone plasmid (https://www.addgene.org/167308/) with HindIII/KpnI.
2. Flank the cargo protein–encoding sequence with HindIII (3′) and KpnI (5′) restriction sites.
3. Digest nucleotide sequence encoding cargo-protein with HindIII/KpnI.
4. Ligate the gene encoding cargo-protein into the linearized backbone.
Notes:
1. During the optimization of EV production, NanoLuc luciferase can serve as a model cargo protein due to its small size (~19 kDa) and high sensitivity for quantification. Any protein <30 kDa can substitute NanoLuc. Proteins larger than 30 kDa may load inefficiently into EPNs and EVs due to steric hindrance, and their loading efficiency requires individual validation. Further studies are needed to systematically explore the loading of larger proteins.
2. For western blot or flow cytometry, incorporate a 3xFLAG/HA/Myc tag into the cargo protein sequence.
3. NanoLuc-Jun_ pCMV plasmid is available through the Addgene plasmid repository (https://www.addgene.org/167308/).
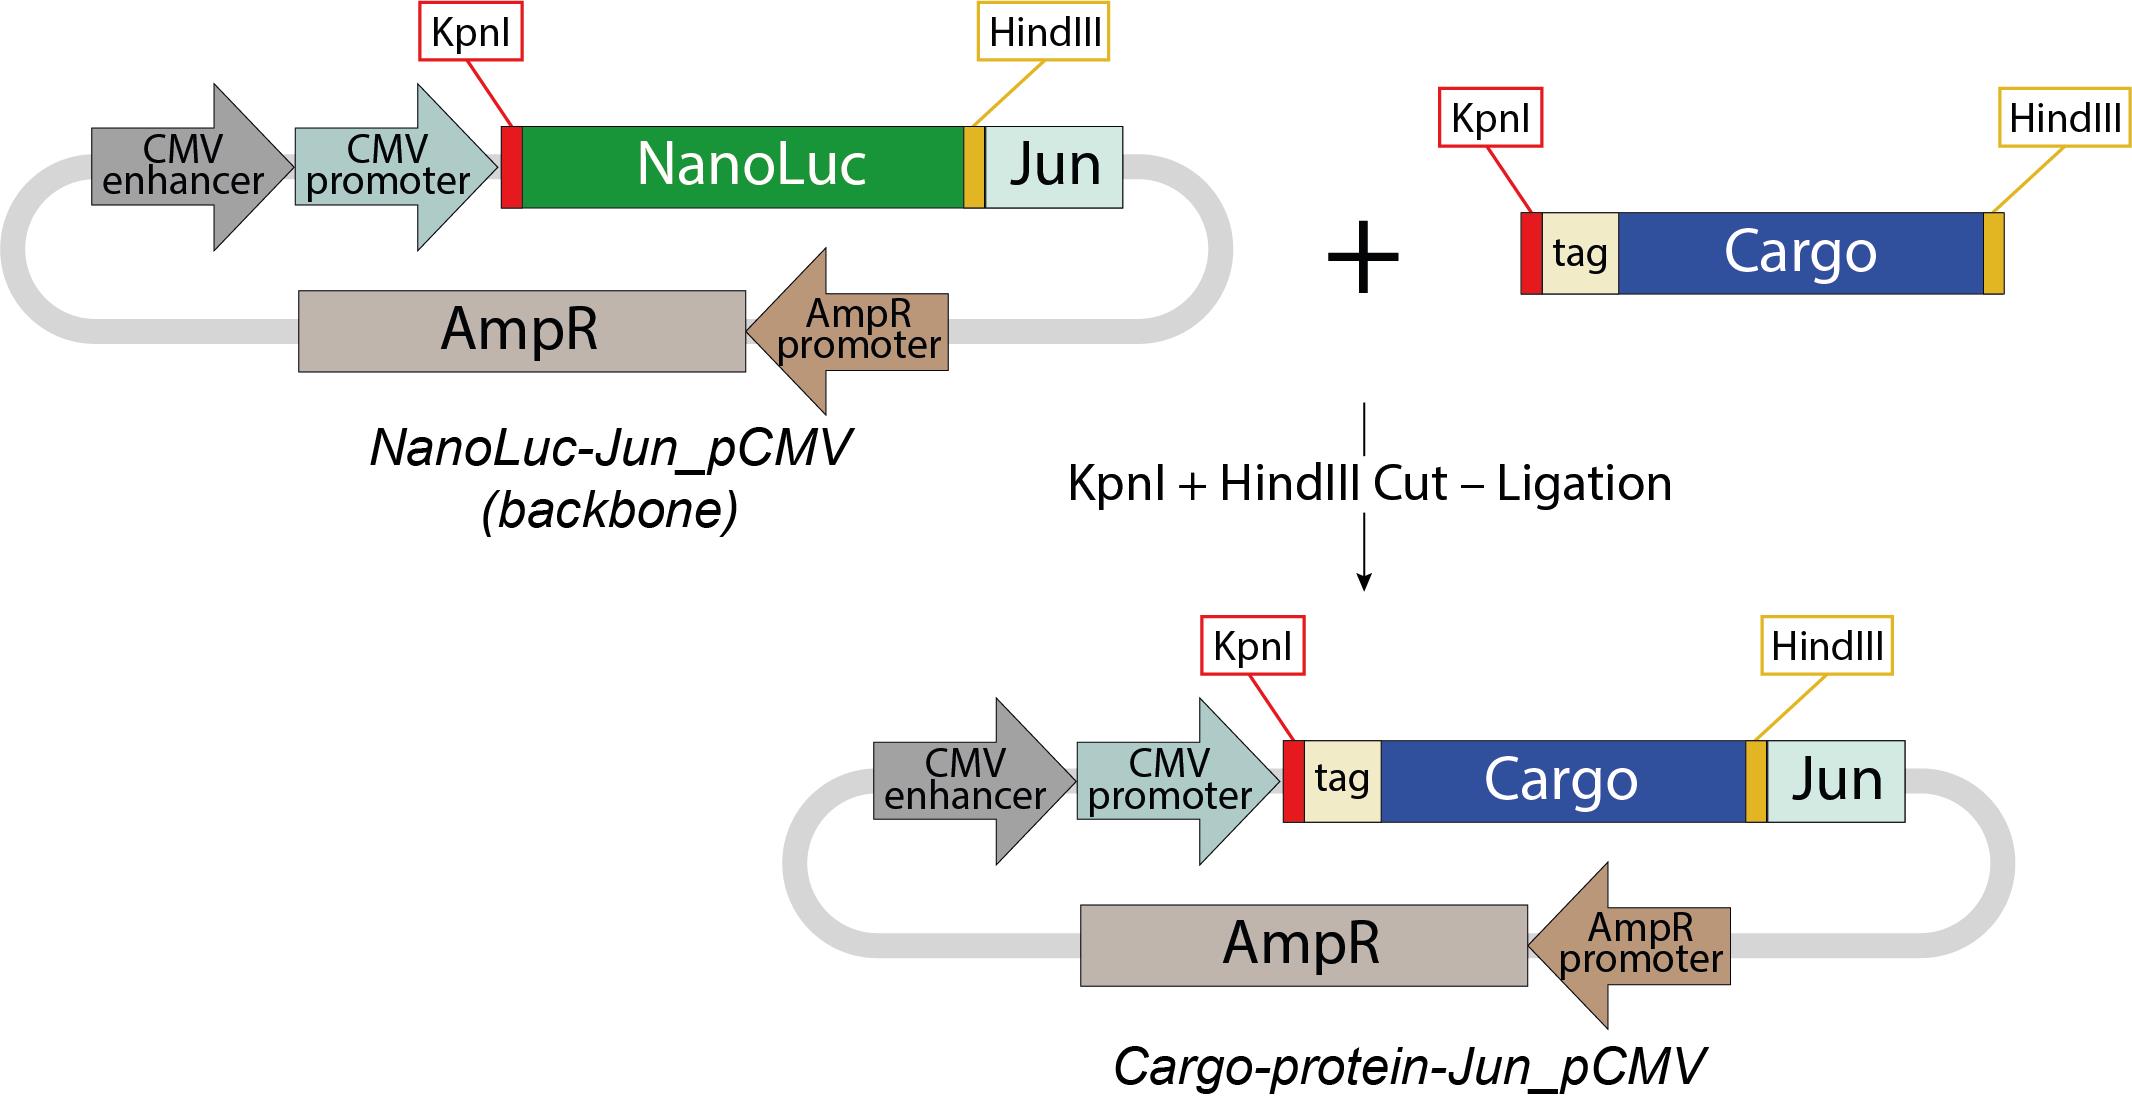
Figure 2. Cloning strategy for Cargo-protein-Jun_pCMV
B. EV production in HEK293T cells
The HEK293T cell line was grown in complete DMEM medium in standard cell culture flasks until 80%–90% confluency and was harvested by trypsinization.
1. Aspirate the medium from the culture and wash the adherent cells with sterile 1× PBS. After washing, add Trypsin-EDTA (0.05%) solution (0.5 mL for T25 flask and 1.5 mL for T75 flask), gently swirl, and incubate at 37 °C for 2 min.
2. Inspect the cells using a microscope. Ensure that at least 90% of cells are detached; incubate the flask longer if necessary.
3. Once cells appear detached, add 2.5 mL of complete DMEM medium and resuspend cells.
4. Inspect the cells using a microscope. If cells are clumped, resuspend and inspect the cells again.
5. Count cells with trypan blue.
6. Seed HEK293T cells at 5 × 10⁵ cells/mL in 15 mL of complete DMEM medium in a T75 flask and incubate overnight at 37 °C with 5% CO2.
7. The next day, aspirate the medium and replace it with 13.5 mL of fresh complete DMEM.
8. Prepare transfection mixes as described in Table 1.
Table 1. Composition of the transfection reagent mixture
| Component | Quantity | Details |
|---|---|---|
| DNA mix (1.5 mL tube) | ||
| EPN-Fos_pCMV | 13.5 μg | Self-assembling nanocages encoded plasmid (https://www.addgene.org/167306/) |
| Cargo-protein-Jun_pCMV | 7.5 μg | Cargo-protein encoded plasmid (e.g., NanoLuc-Jun_pCMV https://www.addgene.org/167308/) |
| Truncated_VSV-G_VHH_pCMV | 1.5 μg | Budding-competent VSV-G encoded plasmid |
| P3000 reagent | 45 μL | Included in Lipofectamine 3000 kit |
| Opti-MEM medium | 750 μL | Serum-free medium for dilution |
| Lipofectamine mix (1.5 mL tube) | ||
| Lipofectamine 3000 | 42 μL | Transfection reagent |
| Opti-MEM medium | 750 μL | Serum-free medium for dilution |
9. Combine the DNA Mix and Lipofectamine Mix in a 1:1 ratio; use the vortex.
10. Incubate for 15 min at room temperature (RT).
11. Add the transfection mixture dropwise to the cells and gently swirl the flask.
12. Incubate at 37 °C with 5% CO2 for 6 h.
13. Aspirate the transfection medium and replace it with complete DMEM (exo-free FBS).
13. Incubate cells for 48 h at 37 °C with 5% CO2 for EVs production.
C. EV isolation
Note: Perform all centrifugations at 4 °C.
Harvest EVs:
1. Carefully pipette the EV-containing medium using a serological pipette, without disturbing the cells.
2. Transfer medium into a 15 mL conical tube.
3. Centrifuge medium at 300× g for 10 min to pellet cells.
4. Transfer the supernatant to a new 15 mL tube in a single, smooth motion.
5. Centrifuge the supernatant at 4,000× g for 15 min to remove cell debris.
6. Transfer the supernatant to a new 15 mL tube in a single, smooth motion.
7. Pass the supernatant through a 0.45 μm PES filter to remove microparticles.
Concentrate and wash EVs:
8. Transfer filtered medium to an Amicon Ultra-15 100 kDa centrifugal filter unit.
9. Centrifuge at 4,000× g for 7–10 min at 10 °C until the volume is reduced to ~1–1.5 mL.
10. Discard the flowthrough.
11. Add 14 mL of 1× PBS (pre-cooled to 4 °C) to the filter unit to dilute the concentrate and wash EVs; resuspend carefully.
12. Centrifuge at 4,000 × g for 7–10 min until the volume is ~1–1.5 mL.
13. Discard the flowthrough.
14. Repeat the wash cycle (add 1× PBS and centrifuge) twice (total of 3 washes).
15. After the final wash, thoroughly resuspend the concentrate within the filter unit to wash away any EVs adhering to the membrane.
16. Centrifuge at 4,000× g for 1–2 min and adjust the final volume to 200–500 μL with PBS for downstream applications.
Note: EVs may adhere to the Amicon filter membrane. To recover adherent EVs, wash the membrane with 100 μL of PBS after sample collection and combine this wash with the collected sample.
D. EV purification
1. Connect the Superose 6 Increase 10/300 GL column and a 0.2–0.5 mL loop to the chromatography system.
2. Wash the column with 1 column volume (CV) of Milli-Q water at 0.3 mL/min, then increase the flow rate to 0.5 mL/min.
3. Pre-equilibrate the column with 2 CV of 1× PBS at a flow rate of 0.5 mL/min.
4. Inject the EV concentrate onto the column using a 0.2–0.5 mL loop or direct injection port.
5. Maintain a flow rate of 0.5 mL/min and a maximum pressure of 1.5 MPa to preserve column integrity.
6. Start collecting 500 μL fractions in low-protein-binding tubes (Eppendorf Protein LoBind), beginning at an elution volume of 5 mL (post-void volume).
7. Continue collection until a 12 mL elution volume.
Note: Track elution profiles using UV absorbance (280 nm) to identify EV peaks (typically eluting between 5.5 and 6.5 mL).
8. If multiple vesicle types require purification, a minimum flush volume of 1.5 CV of PBS must be performed between each run to prevent cross-contamination.
9. After finalizing the run, wash the column with 2 CV of Milli-Q water to remove residual particles, proteins, and contaminants, preserving column performance for subsequent use.
10. Store the column in 20% ethanol (v/v) at 4 °C to prevent bacterial growth.
E. EV characterization
E1. NanoLuc luciferase activity
Note: To obtain numerical characteristics of NanoLuc loading into EVs, utilize recombinant NanoLuc with a known concentration.
1. Thaw the Nano-Glo luciferase assay buffer at RT.
2. Dilute recombinant NanoLuc. Prepare a 5-fold dilution series in PBS 0.1% BSA starting from 150 pg/mL (e.g., 150, 30, 6, 1.2, 0.24, 0.048 pg/mL).
3. Dilute EV samples in PBS 0.1% BSA (typically 1:100–1:1,000) to fit the linear range.
4. Calculate reagent volumes:
Total volume = (# samples + standards + controls) × 15 μL + 10% excess.
Example: 3 EV samples + 6 standards + 1 PBS control = 165 μL (10 × 15 μL + 10%).
5. Mix 1:50 (v/v) Nano-Glo luciferase assay substrate:buffer (e.g., 3.3 μL of substrate + 161.7 μL of buffer for a 165 μL total).
Critical: Prepare fresh for each assay; avoid prolonged light exposure.
6. Add 15 μL of diluted sample to a well of a black 384-well plate.
7. Add 15 μL of Nano-Glo working solution to each well. Mix by pipetting 2–3 times and avoid bubbles.
8. Incubate at RT for 5 min to stabilize the signal.
9. Use a plate reader (e.g., Varioskan LUX) to detect the bioluminescence signal at 460 nm (peak emission wavelength of NanoLuc).
10. Plot calibration curves and calculate the NanoLuc luciferase content in vesicles.
E2. BCA assay
1. Prepare BSA standards: dilute the 2 mg/mL BSA stock to create a standard curve (0, 0.1, 0.2, 0.5, 1.0, 1.5, 2.0 mg/mL) in 1× PBS.
2. Prepare BCA working reagent by mixing reagent A and reagent B (50:1 ratio).
3. Add 25 μL of each standard/sample to triplicate wells.
4. Add 200 μL of BCA working reagent to each well.
5. Cover the plate with the seal and incubate at 37 °C for 30 min.
6. Read absorbance at 562 nm using a plate reader (e.g., Varioskan LUX).
7. Calculate protein concentration.
Note: For improved specificity in EV protein quantification, EV-specific kits such as the CBQCA Plus Protein Quantitation kit (Thermo Fisher Scientific, catalog number: C-6667) are recommended.
E3. Western blot
1. Prepare samples: For EV concentrates, load 20 μg total protein per lane; for SEC eluates, load 22.5 μL (maximum well capacity).
2. Mix samples with Laemmli buffer at 1:4 (v/v). Heat at 95 °C for 5 min.
3. Run SDS-PAGE on a polyacrylamide gel (typically 12%–15%).
4. Transfer proteins onto a 0.45 μm nitrocellulose membrane at 100 V for 1 h in transfer buffer.
5. Incubate the membrane in blocking buffer for 1 h at RT.
6. Incubate the membrane with HRP-conjugated antibodies against EV markers (e.g., anti-CD63, anti-TSG101, anti-ApoB) or epitope tags (e.g., anti-FLAG, anti-HA), according to the manufacturers' protocols.
7. Rinse the membrane 6 times with PBS-T (5–10 min per wash).
8. Apply Clarity Western ECL substrate evenly to the membrane.
8. Image chemiluminescence using a gel documentation system (Figure 3).
Note: It may take up to 10 min of exposition to obtain a specific signal from vesicles.
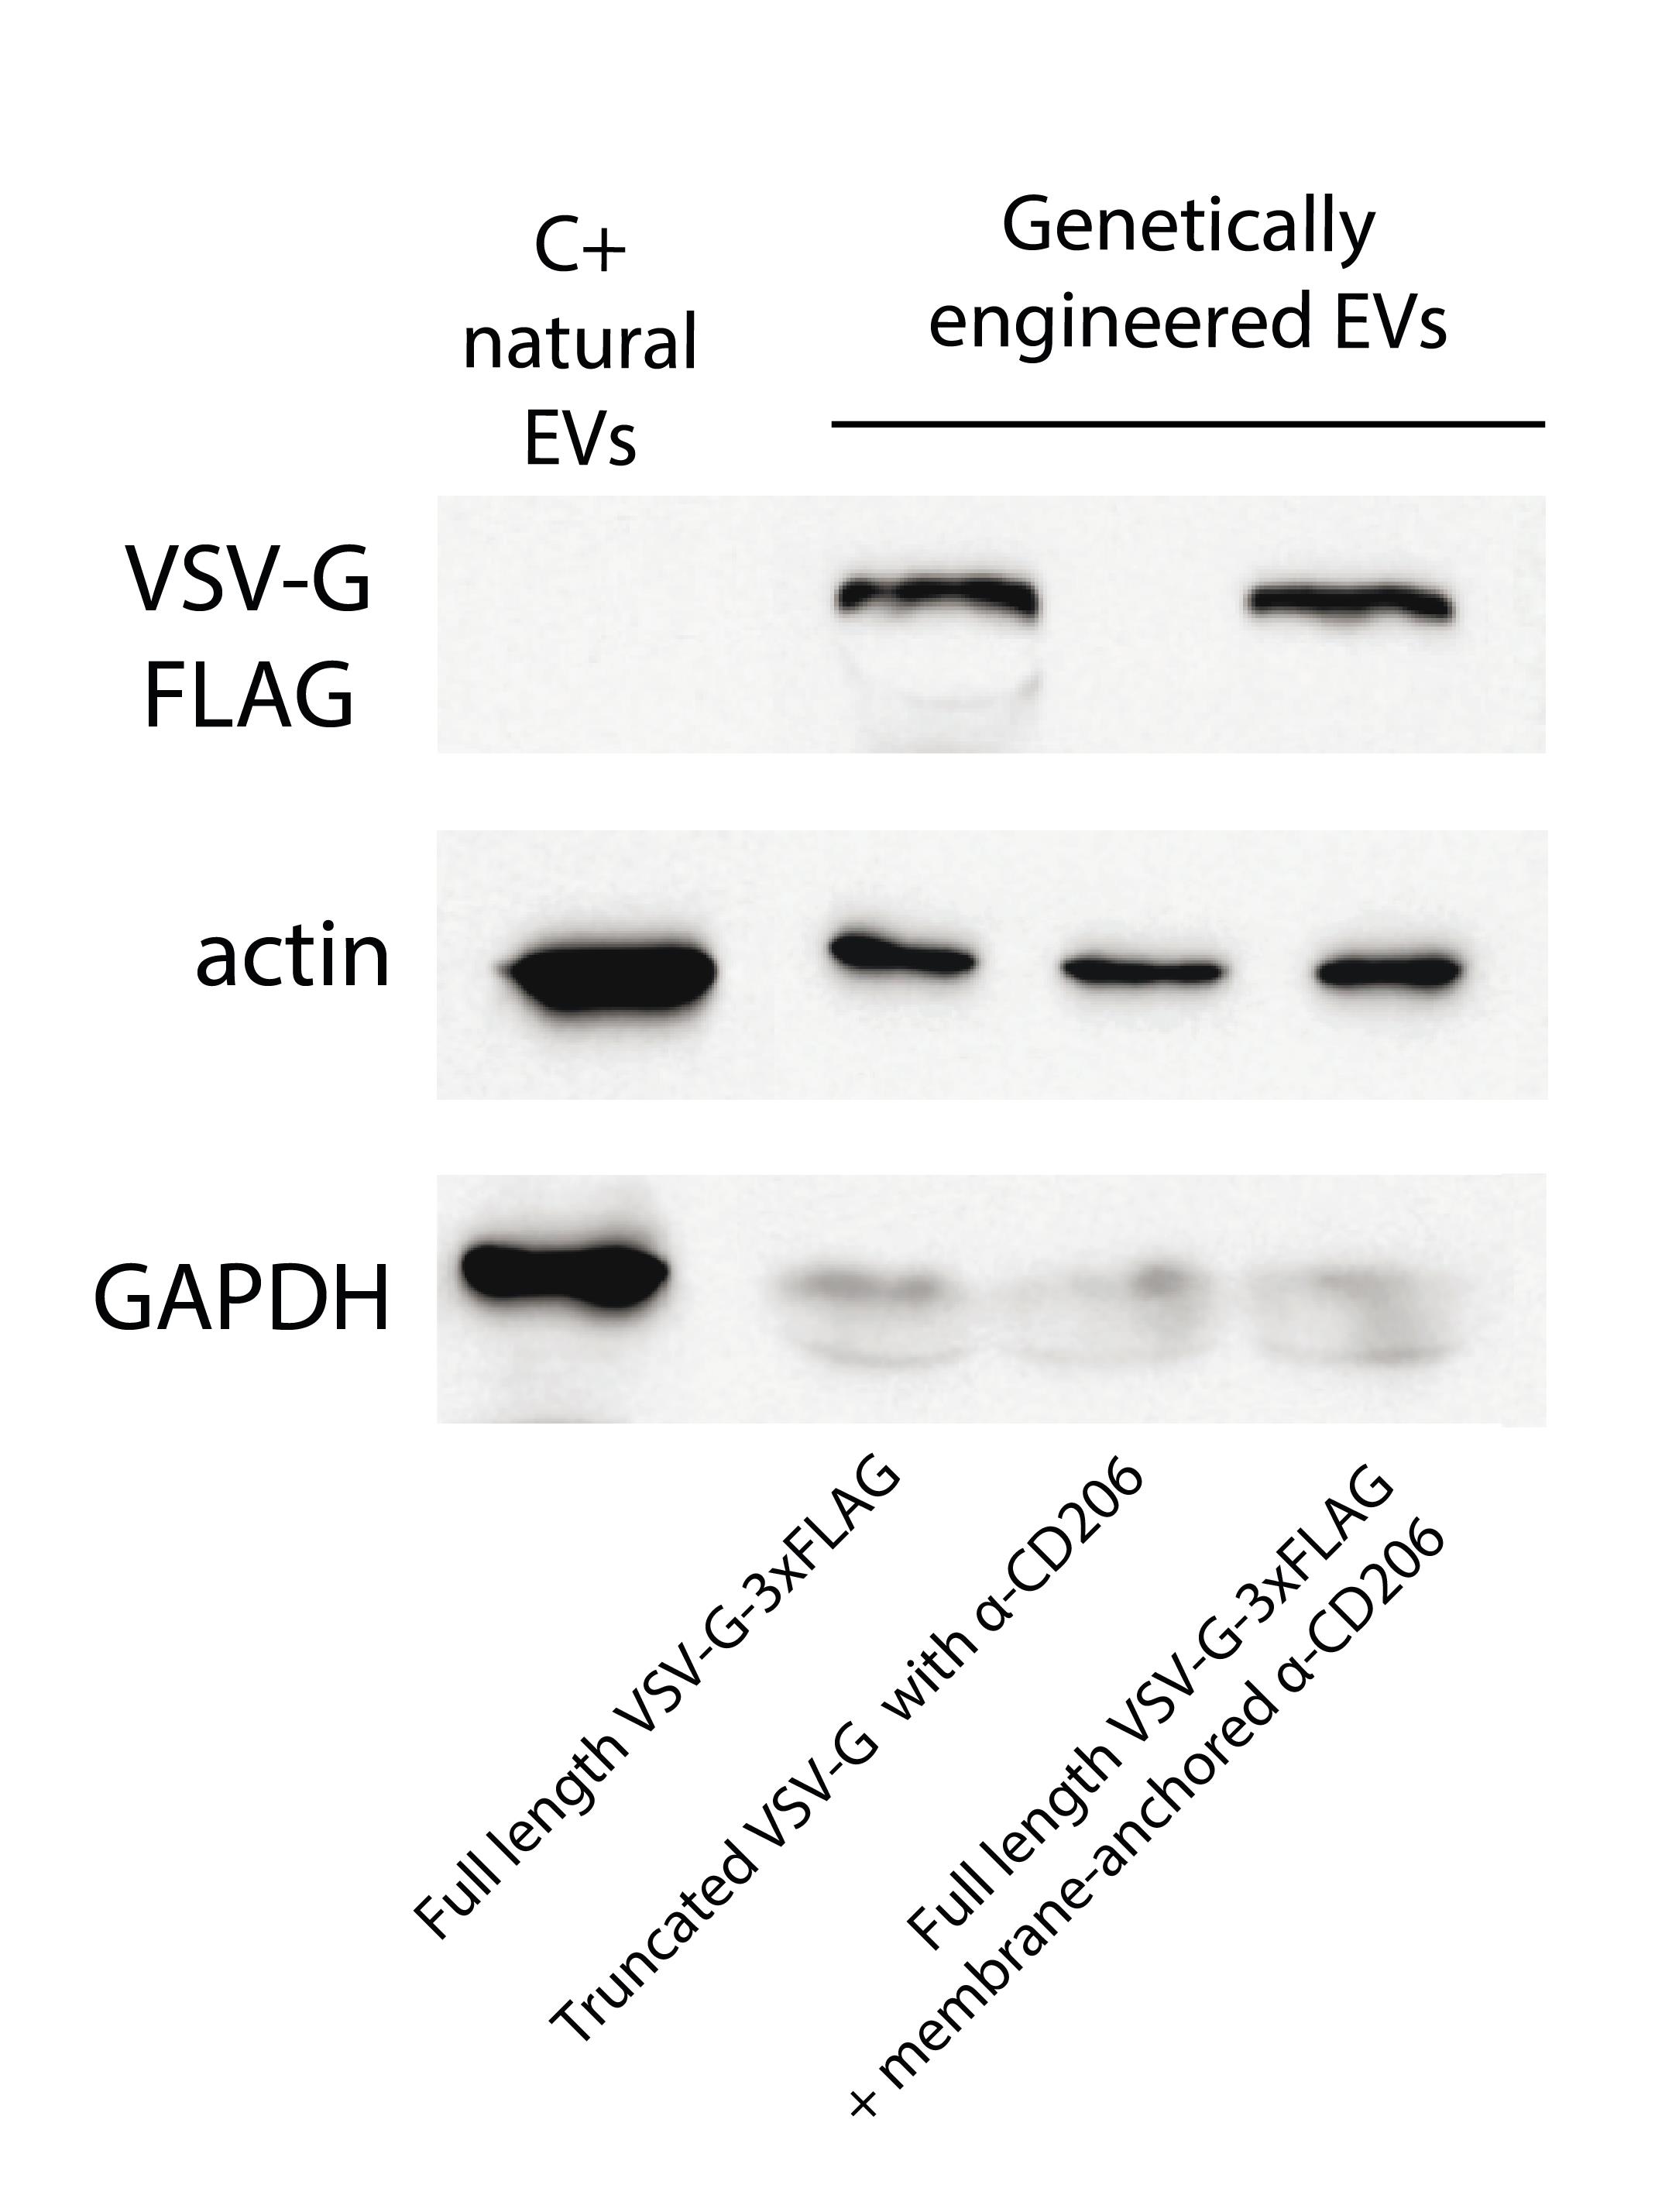
Figure 3. Western blot analysis of VSV-G-FLAG, actin, and GAPDH in extracellular vesicle (EV) samples. The truncated VSV-G lacks the 3xFLAG epitope, in contrast to the full-length VSV-G. The C+ natural EV control was isolated by ultracentrifugation from the culture media of HEK293T cells.
Note: To effectively characterize EVs and confirm the purity of preparations, western blot analysis is strongly advised. The incorporation of an epitope tag (e.g., 3xFLAG in full-length VSV-G) provides a specific handle for EV detection. It is highly recommended to confirm the presence of EV-specific positive markers, such as tetraspanins (CD9, CD63, CD81), ESCRT-related proteins (TSG101, ALIX), or Syntenin-1, HSP70, and Flotillin-1. Additionally, EV preparations should be tested for the absence of negative markers, such as Calnexin or ApoB, to evaluate potential contamination from common sources [17].
E4. Nanoparticle-tracking analysis (NTA) of EV samples
1. Prepare the instrument, the syringe, and particle-free 1× PBS for the measurement as described in section F.
Note: This step may take more than 1 h. If the EV sample is frozen, do not thaw it until step E4.3 to minimize the storage time at positive temperatures. If the EV sample is not frozen, keep it at 4 °C.
2. Set the following camera parameters in Advanced mode: camera shutter: 850, camera gain: 450, lower threshold: 910, higher threshold: 10920.
Note: These parameters are only valid for an NTA instrument with a 405 nm 65 mW laser unit and a high-sensitivity camera of the EMCCD type. For other NTA instrument configurations, setups differ strongly.
3. The EV sample volume should be 70 μL or more.
Note: If less sample volume is available, dilute it with particle-free 1× PBS to a total volume of at least 70 μL. Include the dilution factor in subsequent calculations.
4. Use the first 20 μL aliquot for estimation of proper sample dilution with particle-free 1× PBS to reach the optimal particle concentration of around 1.5 × 10⁸ particles/mL (see section F for details).
5. Use the second 20 μL aliquot to dilute the sample with particle-free 1× PBS using the estimated dilution factor (total volume of diluted sample should be 2 mL) and introduce the diluted sample into the instrument sample chamber to the 1.4 mL syringe plunger position. Connect the temperature probe; set up the microscope stage position and focus of the instrument. Record and save a 60 s long video without processing. Enter the temperature readings when asked.
6. Gently advance the syringe plunger to position 1.2 mL, set up the microscope stage position and focus of the instrument, and record the second video. Repeat the procedure for plunger positions 1.0, 0.8, 0.6, 0.4, and 0.2 mL. Discard all intermediate dilutions, except for the stock sample.
7. Use the third 20 μL aliquot to repeat steps E4.5 and 6.
9. Process all 14 recorded videos with the following parameters in basic mode: detection threshold = 9 (Multi), MinExpectedParticleSize = 30 nm; all other parameters are kept in Automatic mode. In order to average the results over 14 repeated measurements, processing could be made in batch mode.
10. Multiply the resulting average concentration by the dilution factor used (including the preliminary dilution in step E4.3).
11. If any further samples are to be measured, rinse the syringe and the sample chamber twice with particle-free 1× PBS. On the second rinse, check the purity as described in section F. If the syringe passes the purity test, it could be used for measurement of the next sample.
12. After the last sample, service the instrument according to the manufacturer’s recommendations.
E5. Transmission electron microscopy (TEM)
Note: It is recommended to assess EV concentration by NTA prior to TEM analysis. Concentrations lower than 1010 particles/mL are often insufficient to achieve the surface coverage required for manual TEM measurement.
1. Treat carbon-coated TEM grids with glow discharge at 25–30 mA for 45 s to render the surface hydrophilic. Use the grids immediately after treatment.
2. Place a 10 μL drop of the EV sample onto a clean piece of Parafilm. Adsorb the EVs for 2–3 min by floating the grid on top of the drop, with the discharge-treated side toward the solution.
3. Stain with UA (two 10 μL drops, 1–2 min each, blot gently between the steps).
4. Remove the UA solution and air-dry the grid for 10–15 min.
5. Acquire the TEM images at 100–120 kV acceleration voltage and 30,000×–150,000× magnification. The stained EVs typically exhibit cup-shaped morphology (Figure 4).
6. The sizes of individual EVs can be measured using ScanEV [22] or Fiji [23].
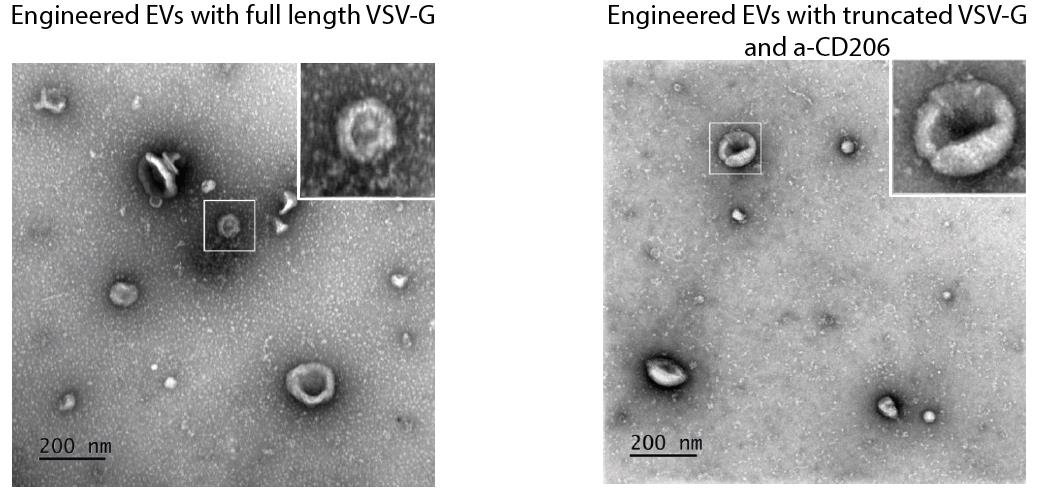
Figure 4. Transmission electron microscopy (TEM) images of extracellular vesicles (EVs) with full-length VSV-G and truncated VSV-G fused with α-CD206 (clone 26.7 [21]). EVs have cup-shaped morphology.
F. (Additional) Prerequisites for nanoparticle tracking analysis (NTA)
An optimal nanoparticle concentration for NTA measurements is of the order of 108 particles/mL, which is below the nanoparticle contamination level in typical laboratory routines. While the original EV sample could be handled as usual, special attention should be paid to the procedures related to finally diluted samples (those introduced into the instrument) to avoid nanoparticle contamination. This section describes some routines that help to avoid different sources of contamination during NTA measurements.
1. Laboratory plastics
None of the laboratory plastics manufacturers specifies their products for nanoparticle contamination. From our experience, nanoparticle contamination for the items listed below was consistently low in every batch tested. Any other brands should be tested with NTA prior to use.
a. Pipette tips from Eppendorf, Corning, and Greiner are nanoparticle-free.
b. 2 mL PP tubes from Eppendorf, SSI, and Axygen are nanoparticle-free.
c. 5 mL PP tubes from Eppendorf are nanoparticle-free.
d. 15- and 50-mL PP tubes are typically more contaminated than small-volume tubes. Eppendorf and Corning are recommended after a double-rinse with fresh Milli-Q water.
e. 2 mL syringes from any brand are typically contaminated to some extent. The contamination could worsen during prolonged storage. Extensive rinsing is required before use.
2. Mixing
Harsh mixing (vortexing, intense shaking) could tear off particles from the tube walls. These procedures should be avoided for Milli-Q water, 1× PBS, and diluted samples. Use gentle pipetting or gentle multiple upside-down turning instead. Fifteen slow turns are enough for 15- and 50-mL tubes, while 25–30 turns are required for fully filled 2 mL tubes.
3. Glass bottle for Milli-Q water
NTA measurements typically require around 200 mL of Milli-Q water free of contaminating nanoparticles for syringe and sample chamber rinse and 10× PBS dilution. It is a good practice to dedicate a separate 250- or 500-mL glass reagent bottle with GL45-type PP cap for NTA to keep it clean and particle-free.
a. Wash the new bottle and its cap thoroughly with laboratory glassware detergent and bottle brush to remove the residuals of production oils and lubricants.
b. Rinse the bottle and the cap with excess tap water to remove the detergent, then rinse with distilled or Milli-Q water. Close the cap and dry outside with a paper towel. Do not touch the inner surfaces of the bottle or the cap from now on.
c. Fill the bottle with Milli-Q water from the apparatus, close the cap, and shake slightly, then empty the bottle. Repeat this final rinse 3–5 times.
d. Fill the bottle with Milli-Q water from the apparatus and avoid harsh shaking from now on. Avoid tilting the filled bottle as the neck is typically the most contaminated part.
Note: If the bottle is dedicated to NTA only, there is no need to wash it every time. Store it filled with Milli-Q water at room temperature in a dark place. On the day of the measurement, empty it, rinse 2–3 times as described in step F3c, and fill with fresh Milli-Q water as described in step F3d. Wash the bottle according to steps F3a–d every 3–4 months or if contamination is suspected.
4. PBS 1×
NTA measurements require particle-free 1× PBS for syringe and instrument sample chamber rinse, and also for EV samples dilution. PBS tablets typically result in particle-contaminated PBS. The most reliable way is to prepare 1× PBS from particle-free Milli-Q water (see above) and Gibco 10× PBS pH 7.4, which is typically particle-free as well. Avoid PBS 10× flask shaking since its arrival and dedicate it to NTA only.
Note: Always prepare 1× PBS from 10× PBS on the day of measurement and only after the Milli-Q water in the bottle has been confirmed to be particle-free. Discard any unused 1× PBS at the end of the day.
5. Pre-measurement protocol
Due to multiple possible sources of nanoparticle contamination, the following procedure is recommended at the beginning of NTA measurement day to ensure that the water, 1× PBS, syringe, and sample chamber of the instrument are free of contaminating nanoparticles.
a. Prepare a glass bottle with fresh Milli-Q water as described above.
b. Take a new self-standing 50 mL PP centrifuge tube (see Laboratory supplies and considerations on laboratory plastic listed in step F1) and rinse it twice with Milli-Q water from the apparatus. Fill it with Milli-Q water. This tube will be used for syringe and instrument sample chamber rinsing.
c. Assemble the laser unit of the NTA instrument, start the NTA software, initialize the camera, and set the following camera setups in Advanced mode: camera shutter: 850, camera gain: 450, lower threshold: 910, higher threshold: around 6000.
Note: These parameters are only valid for the NTA instrument with a 405 nm 65 mW laser unit and a high-sensitivity camera of the EMCCD type. For other NTA instrument configurations, setups differ strongly.
d. Unpack the syringe. Do not touch the vicinity of the Luer port, both on the syringe and on the needle, from now on. Assemble the needle. Slowly fill the syringe with water from the 50 mL PP tube and slowly empty it into the drain. Repeat the rinsing 4–5 times. Slowly fill the syringe with water and take out the needle.
e. Introduce the water slowly into the laser unit to the 1.4 mL syringe plunger position. Set up the microscope stage position and focus of the instrument. Turn off the laser and wait for 5 min. Turn on the laser and visually inspect the presence of nanoparticles in the field of view using the video signal in NTA software. Slowly advance the syringe to plunger positions of 1.2, 1.0, 0.8, 0.6, 0.4 and 0.2 mL, visually checking the presence of nanoparticles in each position. Note that the presence of nanoparticles in a flow during water advancement is unavoidable; the visual check is performed in a stop-flow mode in dedicated syringe plunger positions (the same positions will be used for sample measurement). The presence of less than 1 particle per field of view on average over 7 plunger positions is a criterion for acceptable purity of the water, syringe, and the instrument sample chamber. If a larger number of particles is observed, fill the syringe with water once again and repeat the check.
Note: If repeating rinsing during 1 h does not reduce the amount of contaminating particles, then at least one component is heavily contaminated; either the water, the syringe, or the instrument sample chamber. Additional investigation is required to figure out which one.
f. For one or two final water checks, take the water from the glass bottle instead of the 50 mL tube to ensure it is clean as well.
g. Once the purity of the syringe, the instrument sample chamber, and the water in the bottle is ensured, 1× PBS could be prepared from this clean water and 10× PBS concentrate. Take a new self-standing 50 mL PP centrifuge tube (see Laboratory supplies and considerations on laboratory plastic listed in step F1), rinse it twice with Milli-Q water from the apparatus, and add 3 mL of 10× PBS using a pipette with a sterile pipette tip. Add 27 mL of water from the glass bottle. Do not shake. Instead, very gently rotate the tube upside down 10–15 times to mix the buffer.
h. Check the purity of the prepared 1× PBS the same way as for water earlier. Use the same syringe.
Note: The first portions of 1× PBS may appear to be contaminated. This happens because the ionic strength of the buffer is higher than that of the water, so additional electrostatically attached particles could desorb from the syringe or instrument sample chamber walls. Keep washing until a criterion of less than 1 particle per field of view, averaged over 7 plunger positions, is fulfilled.
i. Once the purity of 1× PBS, the syringe, and the instrument chamber have been confirmed, proceed to sample measurement. Typically, the same syringe could be used for multiple samples. Double flush with 1× PBS with visual purity control in 7 syringe plunger positions, as described above, is enough between samples.
6. Selection of the proper sample dilution
Although the claimed full particle concentration range for NTA is rather broad (from 107 to 109 particles/mL), the method operates best in a narrow range between 1.2 × 10⁸ and 2.5 × 10⁸ particles/mL. A proper sample dilution should be estimated prior to actual measurements. As long as the sample chamber has been carefully rinsed to ensure the absence of desorbing particles, the introduction of concentrated samples that could contaminate the chamber should be avoided. Thus, the selection of proper dilution is performed in the direction from the highest dilution (lowest particle concentration) to lower dilution. Given that 300,000-fold is the highest successful dilution used for EV samples in our experience, a reasonable starting point is 100,000-fold. The volume of each diluted sample for syringe filling should be 2 mL.
1. Dilute the first 20 μL aliquot of stock EV sample with particle-free 1× PBS 100 times in a 2 mL tube (+1,980 μL of 1× PBS) and mix gently by either pipetting or turning the tube upside down 25–30 times, ensuring the air bubble is moving up and down. Perform the next 100× dilution (10,000 in total) the same way, and the next 10× dilution (100,000 in total): 200 μL of the previous dilution and 1,800 μL of 1× PBS. Keep all intermediate dilutions at 4 °C.
2. Introduce the highest dilution into the sample chamber, using the pre-rinsed clean syringe as described before. Set up the microscope stage position and focus of the instrument. Visually inspect the number of particles per field of view in 7 plunger positions. If it is below 2 particles on average, proceed with a 5× lower dilution (higher particle concentration) prepared from kept intermediate dilutions. If the number of particles per field of view is around 10, record 5–6 videos, of 60 s each, with the following camera parameters in advanced mode: camera shutter: 850, camera gain: 450, lower threshold: 910, higher threshold: 10920. Process them with the following parameters in basic mode: detection threshold = 9 (Multi), MinExpectedParticleSize = 30 nm; all other parameters are kept in Automatic mode. In order to average the results over all repeated measurements, processing could be made in batch mode. Calculate the average particle concentration, corrected for the dilution used. Calculate the proper dilution to reach the optimal particle concentration of 1.5 × 10⁸ particles/mL.
3. Discard all recorded videos, measurement results, and intermediate dilutions. The only result of this procedure is the proper dilution factor.
4. Rinse the syringe and the sample chamber once with 1× PBS to check their purity. Proceed with actual sample measurement using the estimated dilution.
G. (Additional) Generation of stimulated antigen-presenting cells (APC) from human peripheral blood mononuclear cells (PBMCs)
Day 1: PBMC isolation
1. Collect 20–30 mL of peripheral blood in EDTA-coated tubes.
Note: We recommend a minimum of 20 mL of peripheral blood to isolate PBMCs, as 10 million PBMCs are needed to start APC stimulation. For better performance, we recommend stimulating 30 million PBMCs. In general, 1–2 million PBMCs are isolated from 1 mL of peripheral blood.
2. Dilute the blood 1:1 with RT PBS (e.g., 20 mL of blood + 20 mL of PBS).
3. Layer diluted blood over 3 mL of RT Ficoll-Paque in a 15 mL tube. Add diluted blood dropwise to prevent mixing with Ficoll-Paque.
4. Centrifuge at 900× g for 45 min at 20 °C (with the brake turned off).
5. Carefully harvest the PBMC layer (the cloudy interface).
6. Transfer PBMCs to a new 50 mL tube, add 30 mL of PBS, and centrifuge at 300× g for 10 min at 20 °C.
7. Remove the supernatant.
8. Resuspend PBMCs in 5 mL of ACK lysis buffer and incubate for 5 min at RT.
9. Add 45 mL of PBS and centrifuge at 300× g for 10 min at 20 °C.
10. Repeat the wash step G9 once.
11. Resuspend PBMCs in 2 mL of prewarmed complete RPMI-1640.
12. Count cells with trypan blue.
13. Dilute cells to 2–3 × 10⁶ cells/mL and transfer them to a T25 flask (10–15 × 106 cells/flask in 5 mL).
14. Incubate at 37 °C, 5% CO2 for 2–4 h to allow monocyte adhesion.
15. Gently aspirate the supernatant (which contains lymphocytes) and wash the adherent monocytes twice with warm PBS.
16. Add fresh complete RPMI-1640 containing 100 ng/mL GM-CSF and 50 ng/mL IL-4.
17. Incubate at 37 °C, 5% CO2 for 6 days.
Days 3 and 5
Note: Stimulated cells may exhibit weak adhesion to the culture flask. During medium replacement, detached cells should be precipitated to reduce possible cell loss.
18. Aspirate 2.5 mL of supernatant from the T25 flask and centrifuge at 300× g for 10 min at 20 °C.
19. Remove the supernatant.
20. Resuspend cells in complete RPMI-1640 containing 100 ng/mL GM-CSF and 50 ng/mL IL-4.
21. Add the resuspended cells in fresh medium to the flask with the remaining cells.
Day 7
22. Inspect the cells using a microscope. Upon successful differentiation, the DCs will become less regular in shape and develop thin, long processes (Figure 5A).
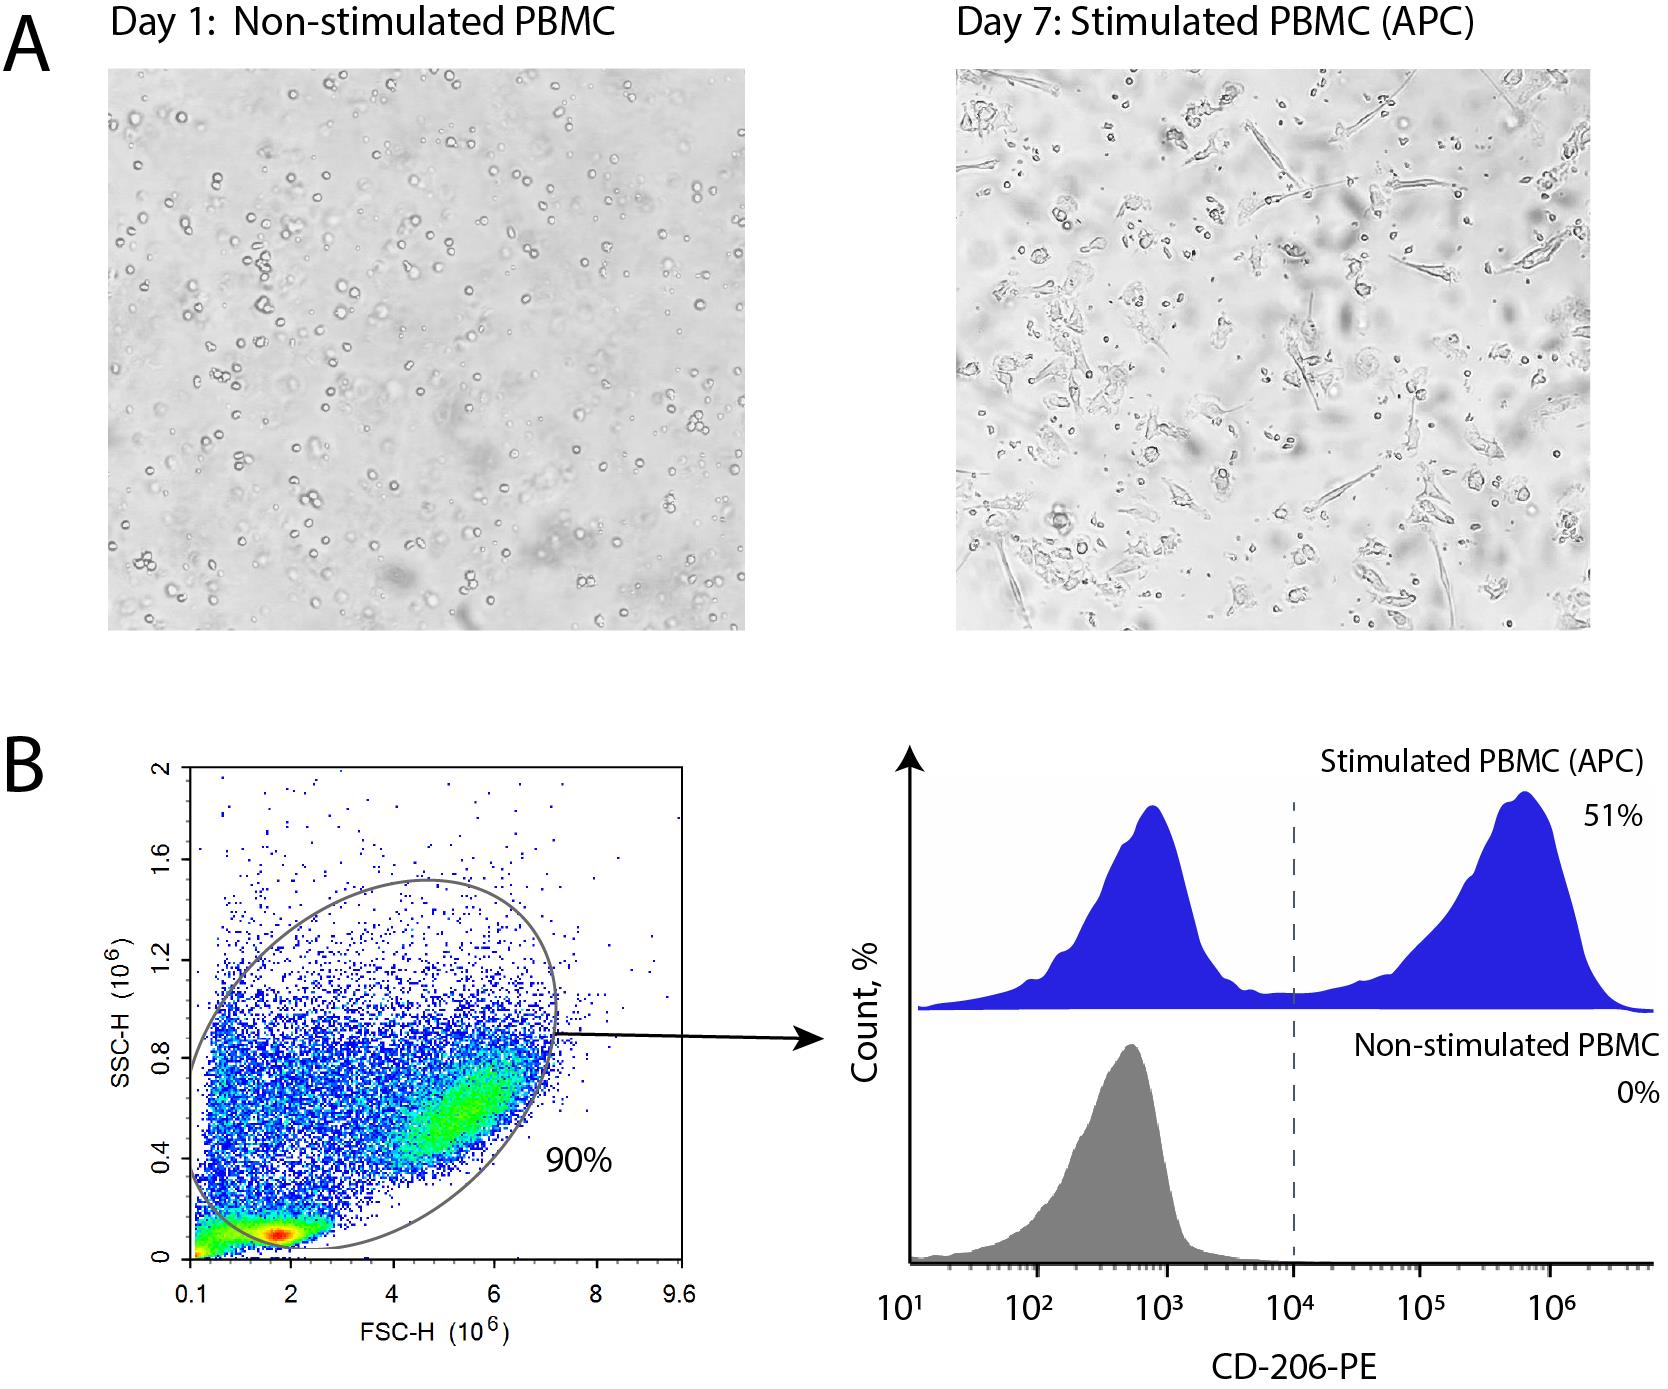
Figure 5. Stimulation of antigen-presenting cells from human peripheral blood mononuclear cells (PBMCs). (A) Representative light microscopy images of adherent monocytes from PBMCs before stimulation and following 7-day stimulation with IL-4 and GM-CSF. (B) Gating strategy and histograms illustrating the flow cytometry analysis of stimulated antigen-presenting cells (APC) stained with a-CD206-PE antibodies. For comparison, fresh non-stimulated PBMCs are shown in grey.
23. Transfer the culture medium from the flask into a sterile 15 mL tube.
24. Wash the cells 2–3 times with complete RPMI-1640, swirling the flask to dislodge debris. Transfer all wash medium to the same 15 mL tube to recover loosely adherent cells.
25. Add 900 mL of complete RPMI-1640 and use a sterile cell scraper to detach firmly adherent cells.
26. Pellet cells from the combined medium/wash solution by centrifugation at 300× g for 10 min.
27. Resuspend cells in 2–3 mL of complete RPMI-1640.
28. Count cells with trypan blue.
Verify differentiation of CD206-positive cells by flow cytometry (Figure 5B)
29. Centrifuge 250,000 cells at 300× g for 10 min.
30. Resuspend the cell pellet in 50 μL of PBS 0.1% BSA with anti-CD206-PE (1:100 dilution) and incubate with the antibody for 30 min at 4 °C.
31. Add 500 μL of PBS 0.1% BSA and centrifuge at 300× g for 5 min to wash the cells.
32. Resuspend the cell pellet in 50 μL of PBS-0.1%. Acquire the data using a flow cytometer (e.g., ACEA NovoCyte 3000). A representative example of the APC subpopulation is provided in Figure 5B.
H. (Additional) Analysis of the efficiency and specificity of the delivery by targeted EVs
To ensure accurate assessment of protein cargo delivery into target cells, thoroughly wash cells after incubation with EVs. Residual EVs or free proteins adhering to the cell membrane via nonspecific interactions (electrostatic/hydrophobic forces) can contribute to background signal, confounding the interpretation of delivery specificity. To minimize adhesion artifacts: (i) use PBS-EDTA (2 mM) during washing to disrupt charge-based interactions, (ii) include BSA in buffers to block nonspecific binding, (iii) perform all washes at 4 °C to reduce active membrane remodeling, and (iv) include Proteinase K washing step.
To analyze the efficiency and specificity of NanoLuc delivery to APC by targeted EVs:
1. Prepare a 5-fold dilution series of freshly isolated EV samples in PBS 0.1% BSA.
2. Prepare a 5-fold dilution series of recombinant NanoLuc in PBS 0.1% BSA.
3. Adjust EV concentrations to equal NanoLuc activity (RLU) across samples.
4. Dilute recombinant NanoLuc and EVs in PBS 0.1% BSA so that they give the same signal in RLU.
5. Add the same volume of EVs or recombinant NanoLuc to 1 × 10⁶ of stimulated APCs in complete RPMI-1640 [e.g., 100 μL of EVs or NanoLuc solution to 0.5 mL of APCs (2 × 10⁶ cells/mL)].
Note: Cell counts and volumes of EVs or NanoLuc solutions can be adjusted based on experimental requirements. However, to maintain cell viability and experimental consistency, we recommend adding EVs or NanoLuc solutions at ≤20% of the total medium volume.
6. Incubate cells at 37 °C, 5% CO2 for 2 h.
Note: Incubation parameters (time, temperature, CO2 levels) can be adjusted to align with experimental goals or cell type requirements.
7. To wash the cells, transfer them to a 1.5 mL tube and fill it with 1× PBS. Centrifuge the cells at 300× g for 10 min and discard the supernatant.
Note: We recommend centrifuging cells using a swinging bucket rotor (rather than fixed-angle rotors) to minimize cell loss. Swinging buckets ensure uniform force distribution during pelleting, reducing the risk of dislodging loosely adherent cells or disrupting fragile pellets.
8. Resuspend cells in 200 μL of PBS + 50 μg/mL Proteinase K.
9. Rotate at 37 °C for 15 min to remove surface-bound EVs.
10. Fill a tube with PBS 0.1% BSA and centrifuge at 300× g for 10 min.
11. Repeat washing with PBS 0.1% BSA twice.
12. Count cells with trypan blue.
13. Centrifuge cells at 300× g for 10 min and resuspend the cell pellet in PBS 0.1% BSA with anti-CD206-PE (1:100 dilution). Use 100 μL of antibody solution for 1 × 10⁶ cells.
14. Incubate with anti-CD206-PE for 30 min at 4 °C.
15. Centrifuge cells at 300× g for 10 min and resuspend in PBS 0.1% BSA. Filter cells through a cell strainer of 40 μm.
16. Sort CD206+ and CD206- populations using a Sony SH800 sorter.
17. Count cells with trypan blue.
18. Resuspend 10,000 sorted cells in 15 μL of PBS 0.1% BSA.
19. Measure luminescence with Nano-Glo Luciferase Assay (see Section E1) (Figure 6).
20. Perform at least 3 replicates per biological sample.
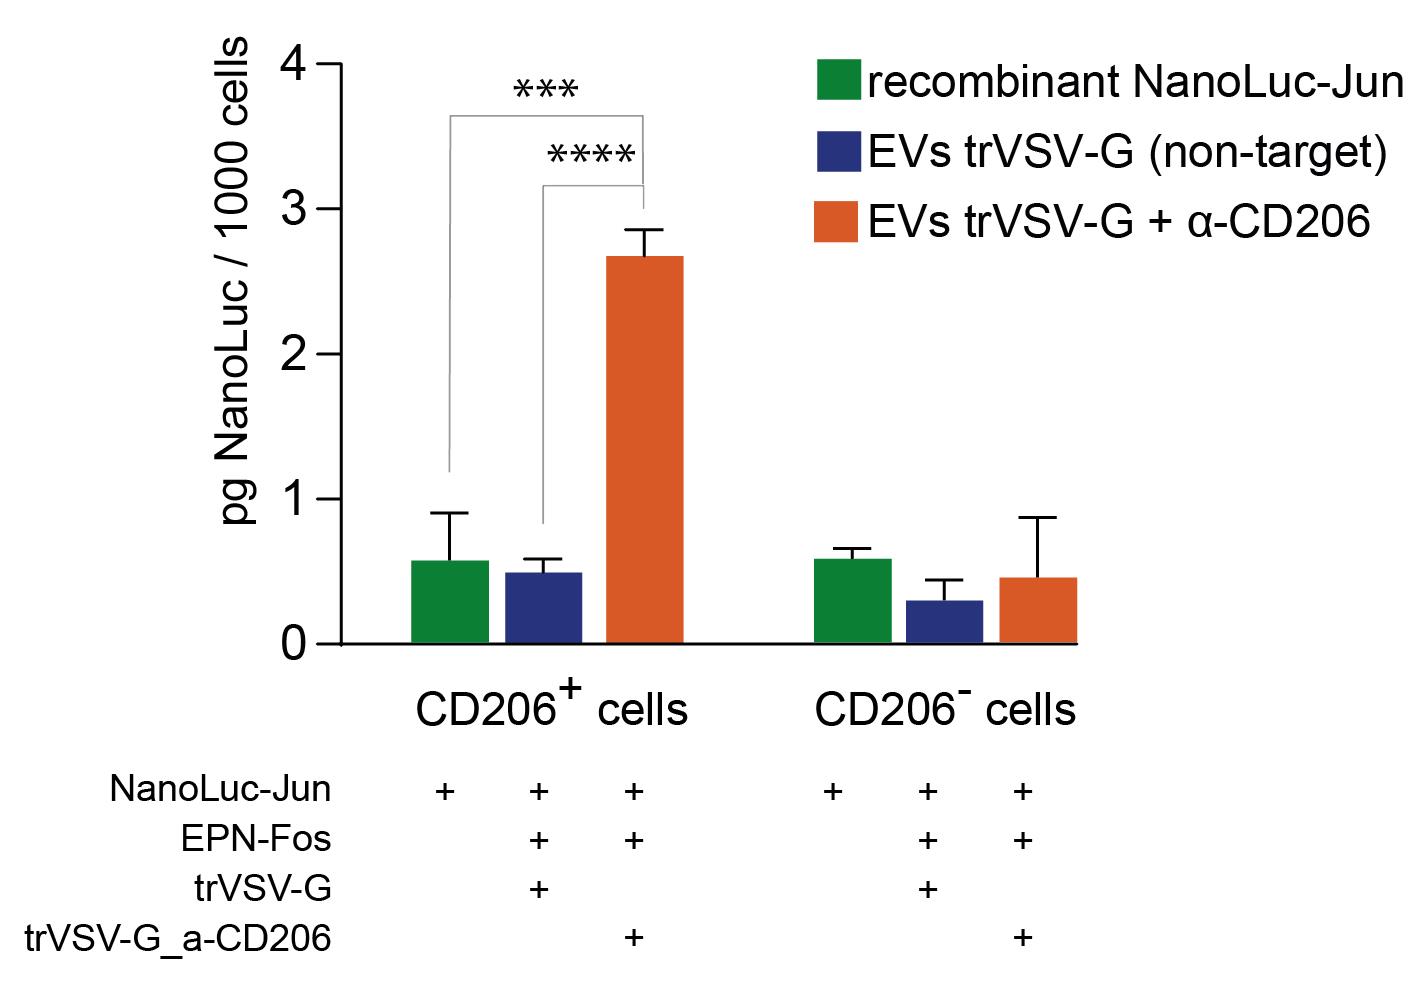
Figure 6. Specificity of engineered extracellular vesicles (EVs) to stimulated antigen-presenting cells (APCs) from peripheral human blood. NanoLuc luciferase activity was measured in sorted CD206-positive and CD206-negative cell subpopulations to assess targeting efficiency. “Recombinant NanoLuc-Jun,” soluble protein control (normalized to EV luciferase signal prior incubation with cells); “trVSV-G,” EVs containing the truncated form of VSV-G; “trVSV-G - α-CD206,” EVs containing a truncated form of VSV-G fused with α-CD206 nanoantibody (clone 26.7 [21]). Data are presented as mean ± SD, n = 4. *** p < 0.001, **** p < 0.0001, two-tailed Student’s t-test.
Validation of protocol
All experiments for EV characterization strictly adhered to the Minimal Information for Studies of Extracellular Vesicles (MISEV) guidelines (latest version), ensuring compliance with standardized reporting criteria for EV identity, purity, and functionality. Specifically, we validated EV populations through (1) quantification of EV-enriched surface markers (CD63, CD81), (2) NTA for size distribution and concentration, and (3) TEM to confirm vesicle morphology.
Reproducibility was rigorously demonstrated by performing all critical steps in biological triplicates, across independent experiments, with inter-assay variability quantified.
This protocol was successfully applied in our peer-reviewed studies:
• Ovchinnikova et al. [19]. Targeted macrophage mannose receptor (CD206)-specific protein delivery via engineered extracellular vesicles (Figures 2, 3, and 4).
• Ovchinnikova et al. [18]. Reprogramming extracellular vesicles for protein therapeutics delivery (Figures 3, 4, and 5).
Acknowledgments
This work was supported by the Russian Science Foundation (project no. 25-74-30002).
The TEM measurements were performed at the User Facilities Center “Electron Microscopy in the Life Sciences” at Lomonosov Moscow State University.
Leyla A. Ovchinnikova: Writing – review & editing, writing – original draft, methodology, formal analysis, conceptualization. Evgeniy G. Evtushenko: Writing – review & editing, methodology. Dmitriy V. Bagrov: Methodology. Anton O. Goncharov: Writing – review & editing. Alexander G. Gabibov: Writing – review & editing, supervision, project administration. Yakov A. Lomakin: Writing – review & editing, writing – original draft, supervision, project administration, conceptualization.
This protocol was used in [18,19].
Competing interests
The authors declare no conflicts of interest.
Ethical considerations
The use of human specimens was reviewed and approved by the independent Ethics Committee of Central Clinical Hospital of the Russian Academy of Sciences in accordance with the ethical principles of the Helsinki Declaration. Informed written consent was obtained from each patient.
References
- Kamerkar, S., LeBleu, V.S., Sugimoto, H., Yang, S., Ruivo, C.F., Melo, S.A., Lee, J.J., Kalluri, R. (2017). Exosomes facilitate therapeutic targeting of oncogenic KRAS in pancreatic cancer. Nature. 546(7659): 498–503. https://doi.org/10.1038/nature22341
- Kumar, M.A., Baba, S.K., Sadida, H.Q., Marzooqi, S.A., Jerobin, J., Altemani, F.H., Algehainy, N., Alanazi, M.A., Abou-Samra, A., Kumar, R., et al. (2024). Extracellular vesicles as tools and targets in therapy for diseases. Signal Transduct Target Ther. 9: 27. https://doi.org/10.1038/s41392-024-01735-1
- Zheng, W., He, R., Liang, X., Roudi, S., Bost, J., Coly, P., van Niel, G., Andaloussi, S.E.L. (2022). Cell-specific targeting of extracellular vesicles through engineering the glycocalyx. J Extracell Vesicles. 11(12): e12290. https://doi.org/10.1002/jev2.12290
- Liu, Q., Li, D., Pan, X., Liang, Y. (2023). Targeted therapy using engineered extracellular vesicles: principles and strategies for membrane modification. J Nanobiotechnology. 21: 334. https://doi.org/10.1186/s12951-023-02081-0
- Liang, X., Gupta, D., Xie, J., Van Wonterghem, E., Van Hoecke, L., Hean, J., Niu, Z., Ghaeidamini, M., Wiklander, O.P.B., Zheng, W., et al. (2025). Engineering of extracellular vesicles for efficient intracellular delivery of multimodal therapeutics including genome editors. Nat Commun. 16: 4028. https://doi.org/10.1038/s41467-025-59377-y
- Hsia, Y., Bale, J.B., Gonen, S., Shi, D., Sheffler, W., Fong, K.K., Nattermann, U., Xu, C., Huang, P.S., Ravichandran, R., et al (2016). Design of a hyperstable 60-subunit protein dodecahedron. [corrected]. Nature. 535: 136–139. https://doi.org/10.1038/nature18010
- Votteler, J., Ogohara, C., Yi, S., Hsia, Y., Nattermann, U., Belnap, D.M., King, N.P., Sundquist, W.I. (2016). Designed proteins induce the formation of nanocage-containing extracellular vesicles. Nature. 540: 292–295. https://doi.org/10.1038/nature20607
- Konoshenko, M.Y., Lekchnov, E.A., Vlassov, A.V., Laktionov, P.P. (2018). Isolation of extracellular vesicles: general methodologies and latest trends. Biomed Res Int. 2018 (1): 8545347. https://doi.org/10.1155/2018/8545347
- Allelein, S., Medina-Perez, P., Lopes, A.L.H., Rau, S., Hause, G., Kölsch, A., Kuhlmeier, D. (2021). Potential and challenges of specifically isolating extracellular vesicles from heterogeneous populations. Sci Rep. 11: 11585. https://doi.org/10.1038/s41598-021-91129-y
- Yang, Y., Wang, Y., Wei, S., Zhou, C., Yu, J., Wang, G., Wang, W., Zhao, L. (2021). Extracellular vesicles isolated by size-exclusion chromatography present suitability for RNomics analysis in plasma. J Transl Med. 19: 104. https://doi.org/10.1186/s12967-021-02775-9
- Gámez-Valero, A., Monguió-Tortajada, M., Carreras-Planella, L., Franquesa, M., Beyer, K., Borràs, F.E. (2016). Size-Exclusion Chromatography-based isolation minimally alters Extracellular Vesicles’ characteristics compared to precipitating agents. Sci Rep. 6: 33641. https://doi.org/10.1038/srep33641
- Momen-Heravi, F. (2017). Isolation of extracellular vesicles by ultracentrifugation. Methods Mol Biol. 1660: 25–32. https://doi.org/10.1007/978-1-4939-7253-1_3
- Noble, J.M., Roberts, L.M., Vidavsky, N., Chiou, A.E., Fischbach, C., Paszek, M.J., Estroff, L.A., Kourkoutis, L.F. (2020). Direct comparison of optical and electron microscopy methods for structural characterization of extracellular vesicles. J Struct Biol. 210(1): 107474. https://doi.org/10.1016/j.jsb.2020.107474
- Chuo, S.T., Chien, J.C., Lai, C.P. (2018). Imaging extracellular vesicles: current and emerging methods. J Biomed Sci. 25: 91. https://doi.org/10.1186/s12929-018-0494-5
- Khan, M.A., Anand, S., Deshmukh, S.K., Singh, S., Singh, A.P. (2022). Determining the size distribution and integrity of extracellular vesicles by dynamic light scattering. Methods Mol Biol. 2413: 165–175. https://doi.org/10.1007/978-1-0716-1896-7_17
- Szatanek, R., Baj-Krzyworzeka, M., Zimoch, J., Lekka, M., Siedlar, M., Baran, J. (2017). The methods of choice for extracellular vesicles (evs) characterization. Int J Mol Sci. 18(6): 1153. https://doi.org/10.3390/ijms18061153
- Welsh, J.A., Goberdhan, D.C.I., O’Driscoll, L., Buzas, E.I., Blenkiron, C., Bussolati, B., Cai, H., Di Vizio, D., Driedonks, T.A.P., Erdbrügger, U., et al. (2024). Minimal information for studies of extracellular vesicles (MISEV2023): From basic to advanced approaches. J Extracell Vesicles. 13(2): e12404. https://doi.org/10.1002/jev2.12404
- Ovchinnikova, L.A., Terekhov, S.S., Ziganshin, R.H., Bagrov, D.V., Filimonova, I.N., Zalevsky, A.O., Lomakin, Y.A. (2021). Reprogramming extracellular vesicles for protein therapeutics delivery. Pharmaceutics. 13(6). https://doi.org/10.3390/pharmaceutics13060768
- Ovchinnikova, L.A., Tanygina, D.Y., Dzhelad, S.S., Evtushenko, E.G., Bagrov, D.V., Gabibov, A.G., Lomakin, Y.A. (2024). Targeted macrophage mannose receptor (CD206)-specific protein delivery via engineered extracellular vesicles. Heliyon. 10(24): e40940. https://doi.org/10.1016/j.heliyon.2024.e40940
- Jeetendra, E., Robison, C.S., Albritton, L.M., Whitt, M.A. (2002). The membrane-proximal domain of vesicular stomatitis virus G protein functions as a membrane fusion potentiator and can induce hemifusion. J Virol. 76: 12300–12311. https://doi.org/10.1128/jvi.76.23.12300-12311.2002
- Blykers, A., Schoonooghe, S., Xavier, C., D'hoe, K., Laoui, D., D'Huyvetter, M., Vaneycken, I.., Cleeren, F., Bormans, G., Heemskerk, J., et al (2015). PET Imaging of Macrophage Mannose Receptor-Expressing Macrophages in Tumor Stroma Using 18F-Radiolabeled Camelid Single-Domain Antibody Fragments. J Nucl Med. 56(8):1265-71. https://doi.org/10.2967/jnumed.115.156828
- Nikishin, I., Dulimov, R., Skryabin, G., Galetsky, S., Tchevkina, E., Bagrov, D. (2021). ScanEV - A neural network-based tool for the automated detection of extracellular vesicles in TEM images. Micron. 145: 103044. https://doi.org/10.1016/j.micron.2021.103044
- Schindelin, J., Arganda-Carreras, I., Frise, E., Kaynig, V., Longair, M., Pietzsch, T., Preibisch, S., Rueden, C., Saalfeld, S., Schmid, B., et al. (2012). Fiji: an open-source platform for biological-image analysis. Nat Methods. 9: 676–682. https://doi.org/10.1038/nmeth.2019
Article Information
Publication history
Received: Aug 13, 2025
Accepted: Sep 26, 2025
Available online: Oct 14, 2025
Published: Nov 5, 2025
Copyright
© 2025 The Author(s); This is an open access article under the CC BY-NC license (https://creativecommons.org/licenses/by-nc/4.0/).
How to cite
Ovchinnikova, L. A., Evtushenko, E. G., Bagrov, D. V., Goncharov, A. O., Gabibov, A. G. and Lomakin, Y. A. (2025). Production of Genetically Engineered Extracellular Vesicles for Targeted Protein Delivery. Bio-protocol 15(21): e5494. DOI: 10.21769/BioProtoc.5494.
Category
Biological Engineering > Biomedical engineering > Drug Delivery
Cell Biology > Organelle isolation > Extracellular vesicle
Do you have any questions about this protocol?
Post your question to gather feedback from the community. We will also invite the authors of this article to respond.