- Protocols

- Articles and Issues
- For Authors
- About
- Become a Reviewer

Examining the Roles of m6A Sites in mRNA Using the Luciferase Gene Fused With Mutated RRACH Motifs
Published: Vol 15, Iss 21, Nov 5, 2025 DOI: 10.21769/BioProtoc.5492 Views: 2279
Reviewed by: Sébastien GillotinAnonymous reviewer(s)
Original research article
The authors used this protocol in:

Apr 2025

Protocol Collections
Comprehensive collections of detailed, peer-reviewed protocols focusing on specific topics


Abstract
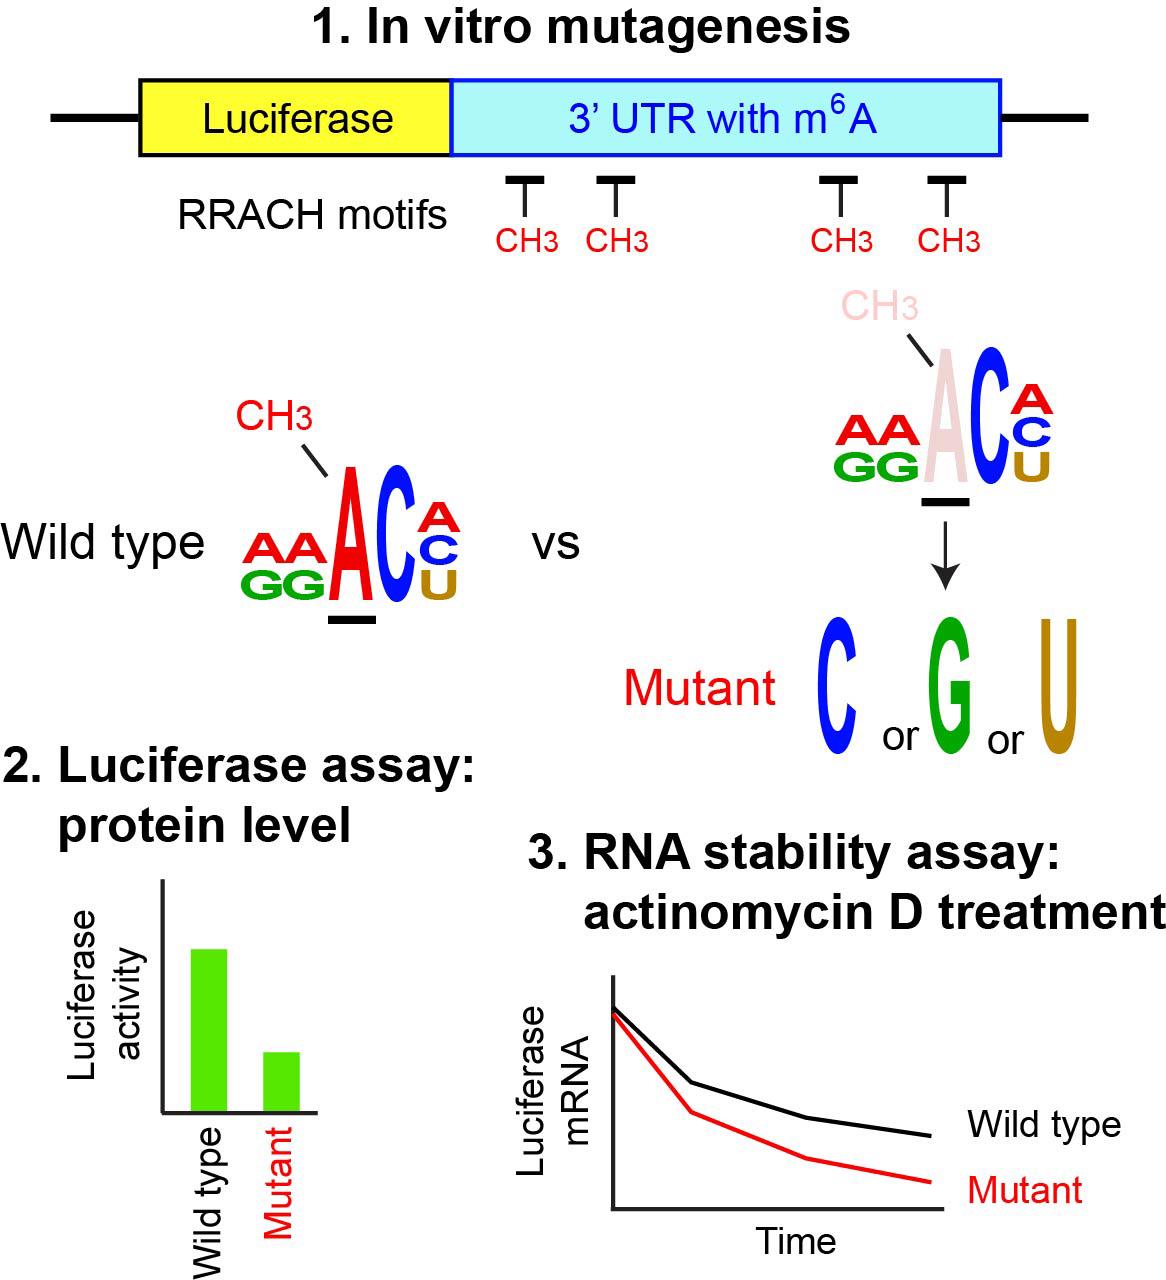
N6-methyladenosine (m6A) is the most abundant internal modification in mRNA and is regulated primarily by the balance between the METTL3 methylase complex and two demethylases, FTO (fat mass and obesity-associated protein) and ALKBH5 (α-ketoglutarate-dependent dioxygenase alkB homolog). Reflecting this prevalence, m6A participates in virtually every step of RNA metabolism, influencing a wide range of physiological and pathological processes. The first step in studying m6A is genome-wide mapping, typically performed by m6A-seq, which sequences RNA fragments immunoprecipitated with an m6A-specific antibody. This is followed by identification of RRACH motifs (R = A or G; H = A, C, or U) within these sequences, with m6A being located at the third nucleotide. The second step involves mutating the putative m6A sites to establish a causal link between the modification and downstream biological effects. Since the mapping step has been covered in several detailed protocols, this article focuses on the second step—mutagenesis of RRACH motifs and subsequent functional analysis of the mutations by ectopic expression. The 3′ untranslated region (UTR) of the mouse Runx2 gene is used as an example. The mutant and wild-type sequences are inserted into a luciferase reporter vector and transfected into 293FT cells to evaluate how loss of m6A affects luciferase protein levels. The same reporter plasmids are also used in an RNA stability assay with a transcription inhibitor. Although site-specific demethylation of endogenous mRNA would be preferable, it remains technically challenging despite many attempts. Thus, ectopic expression of the mutated target gene remains a widely used and practical alternative.
Key features
• This protocol assumes that the m6A-seq data and a list of putative target genes modified by m6A are already available.
• Highly specialized techniques or equipment are not required.
• The luciferase-based assessment in this protocol is widely used in the m6A field as a standard approach.
Keywords: Luciferase reporterGraphical overview
Background
m6A is the most abundant internal modification in mRNA and long non-coding RNA, among more than 150 known types of post-transcriptional RNA modifications [1–3]. m6A was first reported in 1974 [4,5], but the field remained relatively inactive until two key discoveries. First, in 2011, FTO (fat mass and obesity-associated protein) was identified as the first m6A demethylase, demonstrating the reversibility of this modification [6]. Interestingly, the m6A methylase METTL3 had been identified earlier, in 1994 [7]. Second, in 2012, two groups independently reported genome-wide mapping approaches, MeRIP-seq and m6A-seq, using an m6A-specific antibody in combination with next-generation sequencing [8,9]. Identification of additional relevant proteins soon established the principles governing m6A regulation and function. The core m6A methylase complex contains at least seven subunits, including METTL3 (catalytic subunit) and METTL14 (structural support essential for the METTL3 activity). m6A is typically found at the consensus RRACH sequence, often near stop codons and within 3′ UTR of mRNAs. The m6A level is dynamically regulated by the METTL3 complex (“writer”) and two demethylases (“erasers”), FTO and ALKBH5, during development and in response to environmental changes. m6A is recognized by “reader” proteins, such as the YTH domain family (YTHDC1–2, YTHDF1–3) and insulin-like growth factor 2-binding proteins (IGF2BPs), which influence RNA stability, splicing, nuclear transport, localization, translation, and RNA–protein interactions. Reflecting this versatility, m6A participates in diverse cellular processes, developmental events, and disease pathogenesis.
The following workflow represents a standard approach for studying the role of m6A in a specific mRNA within a given biological context. First, Mettl3 or Mettl14 is depleted by knockout (KO) or knockdown (KD) in cells or animals to remove m6A genome-wide, and the resulting phenotypes are described. Second, the genomic distribution of m6A is mapped with m6A-seq, which includes RNA-seq as the input. Third, mRNAs dysregulated at both the RNA and m6A levels following KO or KD are identified. Fourth, putative causal genes are determined by combining this list with literature evidence. The final and most critical step is proving a causal link between loss of m6A and the observed phenotype; however, this has been challenging. Since KO and KD effects may reflect the combined disruption of many genes, identifying a small subset sufficient to explain the phenotype requires site-specific demethylation of m6A. This, in turn, demands prior mapping at the single-nucleotide resolution, which m6A-seq cannot provide due to its use of RNA fragments up to ~200 bases. Although single-nucleotide mapping and site-specific demethylation techniques have been reported, the field is still developing (see references in [10]). A more widely used alternative, described here, is to transfect a luciferase reporter plasmid containing the putative m6A target sequence, with and without RRACH motif mutations, and measure luciferase activity as a surrogate for protein levels. The same reporter can also be used to examine how m6A affects RNA stability. While this ectopic expression approach is less direct than endogenous site-specific demethylation, it remains a practical and validated method, as demonstrated by several published examples listed at the end of this article. This protocol focuses on the final step, starting from the mutations of the adenine in the third nucleotide of each RRACH motif, assuming that m6A mapping data are already available. The RRACH motifs in the Runx2 gene are used as examples. The mRNA and protein of Runx2 are downregulated in the mouse limb bud cells of Mettl14 conditional KO (cKO) mice at embryonic day 12.5, accompanied by reduced m6A in the 3′ UTR [11]. For details on m6A-seq, readers are referred to comprehensive published protocols [12–14].
Materials and reagents
Biological materials
1. 293FT cells (Thermo Fisher Scientific, catalog number: R70007)
2. 293T/17 cells (ATCC, catalog number: CRL-11268)
Reagents
1. pGL3 control vector (Promega, catalog number: E1741, discontinued) or pGL4.13 vector (Promega, catalog number: E6881, replacement)
2. Renilla luciferase vector (pcDNA3.1dsRLuc) (Addgene, catalog number: 68053)
3. Gibson Assembly Master Mix (New England Biolabs, catalog number: E2611L)
4. Dulbecco’s modified Eagle medium (DMEM) (Corning, catalog number: 10-013-CM)
5. Opti-MEM (Thermo Fisher Scientific, catalog number: 31985070)
6. Fetal bovine serum (FBS) (Hyclone, catalog number: SH30071.03)
7. MEM non-essential amino acid, 10 mM (100×) (Thermo Fisher Scientific, catalog number: 11140050)
8. Geneticin (Thermo Fisher Scientific, catalog number: 10131035)
9. Lipofectamine 2000 transfection reagent (Thermo Fisher Scientific, catalog number: 11668027)
10. Actinomycin D (Sigma-Aldrich, catalog number: A1410)
11. Dimethyl sulfoxide (Thermo Fisher Scientific, catalog number: J66650.AK)
12. F-Luc forward primer, 5′-CGGAAAGACGATGACGGAAA-3′ (Thermo Fisher Scientific)
13. F-Luc reverse primer, 5′-CGGTACTTCGTCCACAAACA-3′ (Thermo Fisher Scientific)
14. Mouse 18S rRNA forward primer, 5′-AGTCCCTGCCCTTTGTACACA-3′ (Thermo Fisher Scientific)
15. Mouse 18S rRNA reverse primer, 5′-CGATCCGAGGGCCTCACTA-3′ (Thermo Fisher Scientific)
16. Dual-Luciferase Reporter Assay System (Promega, catalog number: E1910)
17. Click-iT RNA AlexaFluor 594 Imaging kit (Thermo Fisher Scientific, catalog number: C10330)
Solutions
1. Culture medium for 293FT cells (see Recipes)
Recipes
1. Culture medium for 293FT cells
| Component | Volume | Final concentration |
|---|---|---|
| DMEM | 440 mL | 88% |
| FBS | 50 mL | 10% |
| 10 mM (100×) MEM non-essential amino acid | 5 mL | 1× |
| 50 mg/mL geneticin | 5 mL | 500 μg/mL |
| Total | 500 mL | n/a |
Laboratory supplies
1. 24-well plates (Thermo Fischer Scientific, catalog number: 142485)
2. 96-well plates (Thermo Fischer Scientific, catalog number: 161093)
Equipment
1. Spectrophotometer (DeNovix, model: DS-11 FX+)
2. Luminometer (Beckman Coulter, model: LD 400)
Software and datasets
1. Integrative Genomics Viewer (IGV) (https://igv.org/)
2. Mouse genome assembly GRCm38/mm10 (https://www.ncbi.nlm.nih.gov/datasets/genome/GCF_000001635.20/)
3. NEBuilder Assembly Tool, version 2.10.8 (https://nebuilder.neb.com/#!/)
4. GraphPad Prism 10.1.0 (GraphPad)
Procedure
A. Preparation of DNA fragments containing wild-type and mutant RRACH motifs
1. Determine the shortest 3′ UTR fragment that includes all RRACH motifs within the m6A peak region based on the m6A-seq data (Figure 1A). Figure 1B illustrates a 240-base fragment containing all four RRACH motifs in this region of the 3′ UTR.
Notes:
1. Only about 5% of RRACH motifs carry m6A modifications [10]; however, modify all motifs, either individually or in various combinations, to avoid missing potentially important ones.
2. Include ≥15 bases on both 5′ and 3′ ends, counting from the first and last RRACH motifs, respectively, because these regions are used to design Gibson assembly primers that are common to wild-type (WT) and mutant (Mut) plasmids.
2. Replace the adenine in the third nucleotide position of each RRACH motif with cytosine, guanine, or thymine, as shown in Figure 1B.
Notes:
1. The choice of nucleotide replacement in the 5′ and 3′ UTR appears largely random in the literature.
2. If RRACH motifs in the coding region are mutated, preserve the amino acid identity.
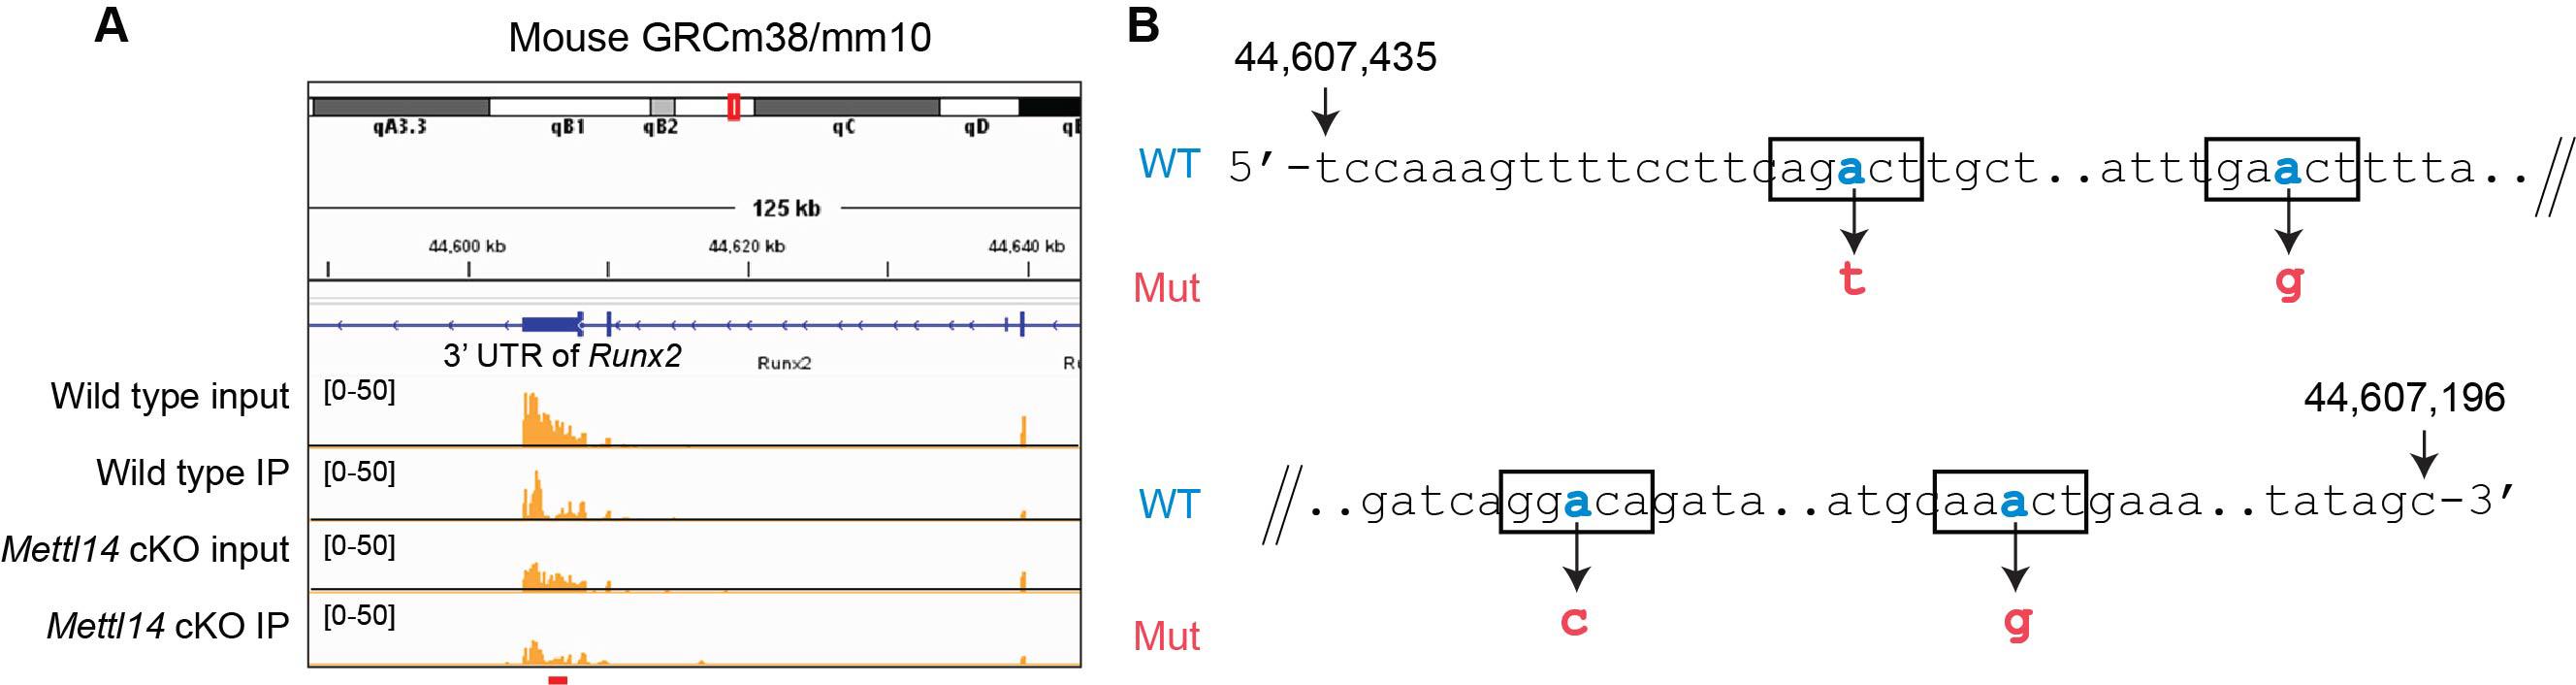
Figure 1. Design of mutations in the 3′ untranslated region (UTR) of the mouse Runx2 gene. (A) Mapping of m6A peaks with the Integrative Genomics Viewer (IGV). Also shown is a comparison of input (total mRNA with RNA-seq) and immunoprecipitated (IP) mRNA from wild-type and Mettl14 cKO cells. To identify genuine m6A peaks, we normalized the IP peaks of each cell type against their respective input peaks. Peaks reduced in cKO cells relative to wild type were identified as genuine m6A peaks (see red bar at the bottom of panel A). Representative rows from three biological replicates are shown. (B) The four RRACH motifs within the red bar region are highlighted using rectangles. Adenine (blue) in each motif was replaced with cytosine, guanine, or thymine in the mutant sequence (red). The numbers at the 5′ and 3′ ends correspond to nucleotide positions in the GRCm38/mm10 mouse genome assembly.
3. The following protocol inserts the mutated 3′ UTR after the F-Luc gene as an example. Design PCR primers to insert the DNA fragment into the luciferase pGL3 Control vector via Gibson assembly.
a. Open the NEBuilder Assembly Tool, version 2.10.8 (https://nebuilder.neb.com).
b. Copy and paste the sequences of the pGL3 Control vector and the DNA fragment designed above (hereafter referred to as the insert).
Note: The discontinued pGL3 control vector is used in this protocol because data were prepared with the vector; however, pGL4.13, which has slightly different sequences, can be used in the same way.
c. Locate the XbaI site, which lies between the stop codon of the F-Luc gene and the SV40 late poly(A) signal (Figure 2A).
Note: If target RRACH motifs are in 5′ UTR, insert the mutated sequence immediately upstream of the F-Luc gene. If the motifs are in the coding region, create an in-frame fusion gene with F-Luc by inserting the mutated sequence at the 3′ end of the F-Luc gene.
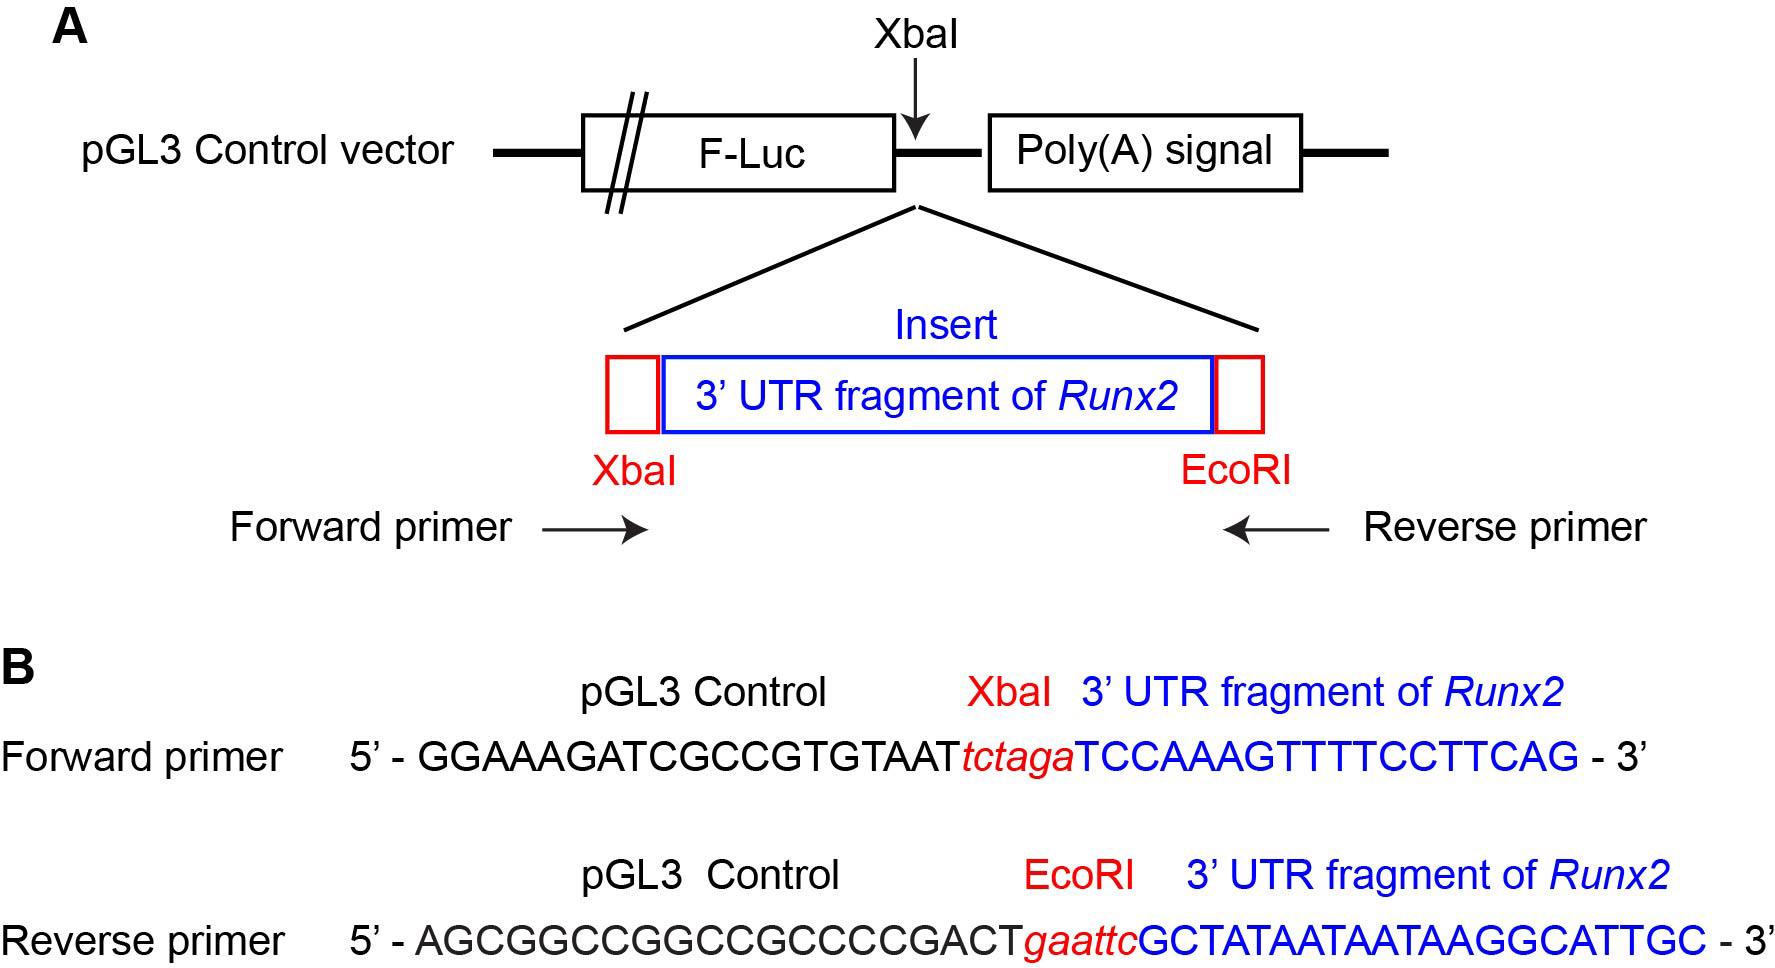
Figure 2. Gibson assembly of a pGL3 control vector containing both the wild-type and mutant 3′ untranslated region (UTR) of Runx2. (A) Structure of the insertion site for the Runx2 3′ UTR in the pGL3 control vector. (B) Primer sequences used in Gibson assembly, as designed by the NEBuilder Assembly Tool.
d. Add different restriction enzyme sites to the forward and reverse primers between the sequences of the pGL3 control vector and the insert.
Note: Figure 2B shows the XbaI and EcoRI sites used in our recent work, as these became single-cut sites in the final product.
e. Use NEBuilder Assembly Tool to determine the annealing temperature for each primer.
4. Synthesize the WT and Mut inserts.
a. Generate the insert DNA fragments by reverse transcription-PCR (RT-PCR) from mouse mRNA, followed by PCR-based mutagenesis. For sequences containing multiple RRACH motifs, opt for chemical synthesis, which is faster and more cost-effective.
b. We used the GeneArt Custom Gene Synthesis service at Thermo Fisher Scientific (https://www.thermofisher.com/us/en/home/life-science/cloning/gene-synthesis/geneart-gene-synthesis.html). Order the product as a double-stranded DNA fragment rather than a plasmid, and in the smallest quantity available, as only a small amount is needed.
c. Resuspend the DNA fragments in nuclease-free water and store at -20 °C.
Note: We dissolved Runx2-3′ UTR (240 bp) at 10 ng/μL nuclease-free water.
5. Amplify the inserts with PCR and insert into the pGL3 control vector with Gibson assembly following the instructions of the manufacturer.
Notes:
1. Although the manufacturer’s recommended reaction volume is 20 μL for Gibson assembly, we make only 10 μL to save reagents without any problems.
2. Gibson assembly master mix, which contains enzymes, freezes at -20 °C during storage. We have not experienced a major decrease in activity after four or five cycles of freeze and thaw; however, we make small aliquots of the master mix to prevent excessive freeze and thaw.
3. The assembled plasmids are stable during storage at -20 °C.
6. Follow standard procedures for transformation of E. coli, miniprep, sequencing, and midiprep to prepare plasmid DNA for transfection. The assembly products with the WT and Mut inserts are referred to as pGL3-Runx2-WT and pGL3-Runx2-Mut, respectively.
B. Luciferase assay with 293FT cells
1. Culture cells in the culture medium for 293FT cells (see Recipes) with 5% CO2 at 37 °C.
Note: The 293FT cell line is one of several variants derived from the 293 cell line (also called HEK293), which originates from human embryonic kidney cells and exhibits high transfection efficiency. 293T/17 is another commonly used derivative for transfection. For more information on 293 cell variants, see https://www.thermofisher.com/order/catalog/product/R70007/faqs.
2. Transfect 293FT cells with the pGL3 vector and a Renilla vector as follows: Prepare three transfection groups: WT (pGL3-Runx2-WT), Mut (pGL3-Runx2-Mut), and background (no transfection). Perform each with a replicate number of five for a total of 10 transfections. Co-transfect a Renilla plasmid to normalize transfection efficiency.
a. Day 1: Seed 293FT cells without geneticin into 15 wells of a 96-well plate at 4 × 10⁴ cells/100 μL per well.
b. Day 2: Cells reach ~70% confluence.
Note: Although 70%–80% confluence is generally recommended for optimal transfection, 40%–100% confluent cultures can also be used with 293FT cells due to their high efficiency.
i. Table 1 shows the volume of each component per well and for the core mix, which contains a 5.5-fold volume to account for pipetting loss. Mix each component in the order described below.
Table 1. Components for transfection
| Component | Volume/well | Core mix for pGL3-Runx2-WT | Core mix for pGL3-Runx2-Mut |
|---|---|---|---|
| Lipofectamine 2000 reagent | 0.2 μL | 1.1 μL | 1.1 μL |
| Opti-MEM | 11.8 μL | 64.9 μL | 64.9 μL |
| pGL3-Runx2-WT (40 ng/μL) | 1 μL | 5.5 μL | 0 μL |
| pGL3-Runx2-Mut (40 ng/μL) | 1 μL | 0 μL | 5.5 μL |
| Renilla luciferase vector (40 ng/μL) | 1 μL | 5.5 μL | 5.5 μL |
ii. Mix 1.1 μL of Lipofectamine 2000 Reagent with 64.9 μL of Opti-MEM medium. Prepare two tubes of this mix.
iii. Incubate at room temperature (~25 °C) for 5 min.
iv. Add 220 ng of the designated pGL3 vector and 220 ng of Renilla luciferase vector to the diluted Lipofectamine 2000. Incubate at room temperature for 20 min.
v. Add 14 μL of the mix to each well and incubate for 24 h. Add 14 μL of Opti-MEM to the background well.
Caution: 293FT cells weakly attach to the bottom of the well. Gently add the mix or medium dropwise.
Note: The culture medium does not need to be replaced before transfection.
c. Day 3: Lyse the cells and measure F-Luc and Renilla luciferase (R-Luc) activities with the Dual-Luciferase Reporter Assay System and a luminometer. For all assays, follow the manufacturer’s instructions.
C. Assay to study mRNA stability affected by m6A
In this assay, transfected cells (prepared as described above) are treated with actinomycin D to inhibit transcription. Most mRNA species, including F-Luc, decrease over time. This phenomenon is thought to depend on their stability. The temporal profile of the F-Luc mRNA level is quantified by quantitative RT-PCR (qRT-PCR).
1. Day 1: Seed 293FT cells without geneticin into six wells in a 24-well plate at 1.2 × 10⁵ cells/300 μL/well.
2. Day 2: Cells reach ~70% confluence. Transfect pGL3-Runx2-WT or pGL3-Runx2-Mut as described above with the following amounts per well. Transfect three wells each for the plasmid (n = 3). Renilla vector is not necessary.
Lipofectamine 2000 reagent 0.8 μL
Opti-MEM 47.2 μL
pGL3-Runx2-WT or -Mut 320 ng
Note: These volumes correspond to 4-fold the amount for a 96-well plate, reflecting the size of a well.
3. Day 3: 24 h after transfection, subculture the cells into four wells in a 96-well plate at 4 × 10⁴ cells/100 μL per well.
Note: The four wells correspond to the four time points (0, 2, 4, and 6 h) of harvest. This “bulk transfection” prevents well-to-well variations in the transfection efficiency.
4. Day 4:
a. Add actinomycin D into the culture medium at 5 μg/mL at 0 h and incubate the cells. Harvest the cells in the well without actinomycin D as the 0 h sample.
Notes:
1. Dissolve actinomycin D at 5 mg/mL in dimethyl sulfoxide (DMSO) (1,000×). Dimethyl sulfoxide does not affect the stability of the F-Luc RNA at this concentration.
2. DMSO freezes on ice. Leave actinomycin D at room temperature once thawed to avoid repeated freeze and thaw.
b. Harvest the cells at 2, 4, and 6 h.
5. Day 4 or later: Extract RNA, synthesize cDNA, and perform qPCR with standard procedures.
Notes:
1. 18S rRNA is used as the endogenous reference gene because it is highly abundant and stably embedded in ribosomes. The stability of F-Luc and R-Luc is similar. Some commonly used reference genes for qPCR, such as glyceraldehyde–3–phosphate dehydrogenase (Gapdh) and β-actin (Actb), are not appropriate because they also undergo degradation.
2. Repeat qPCR in technical triplicates.
Data analysis
1. Luciferase assay
In the data sample shown in Figure 3, the F-Luc activity of Runx2-Mut was ≤50% of the WT level, which is similar to the decrease in the endogenous RUNX2 protein in Mettl14 cKO cells [11].
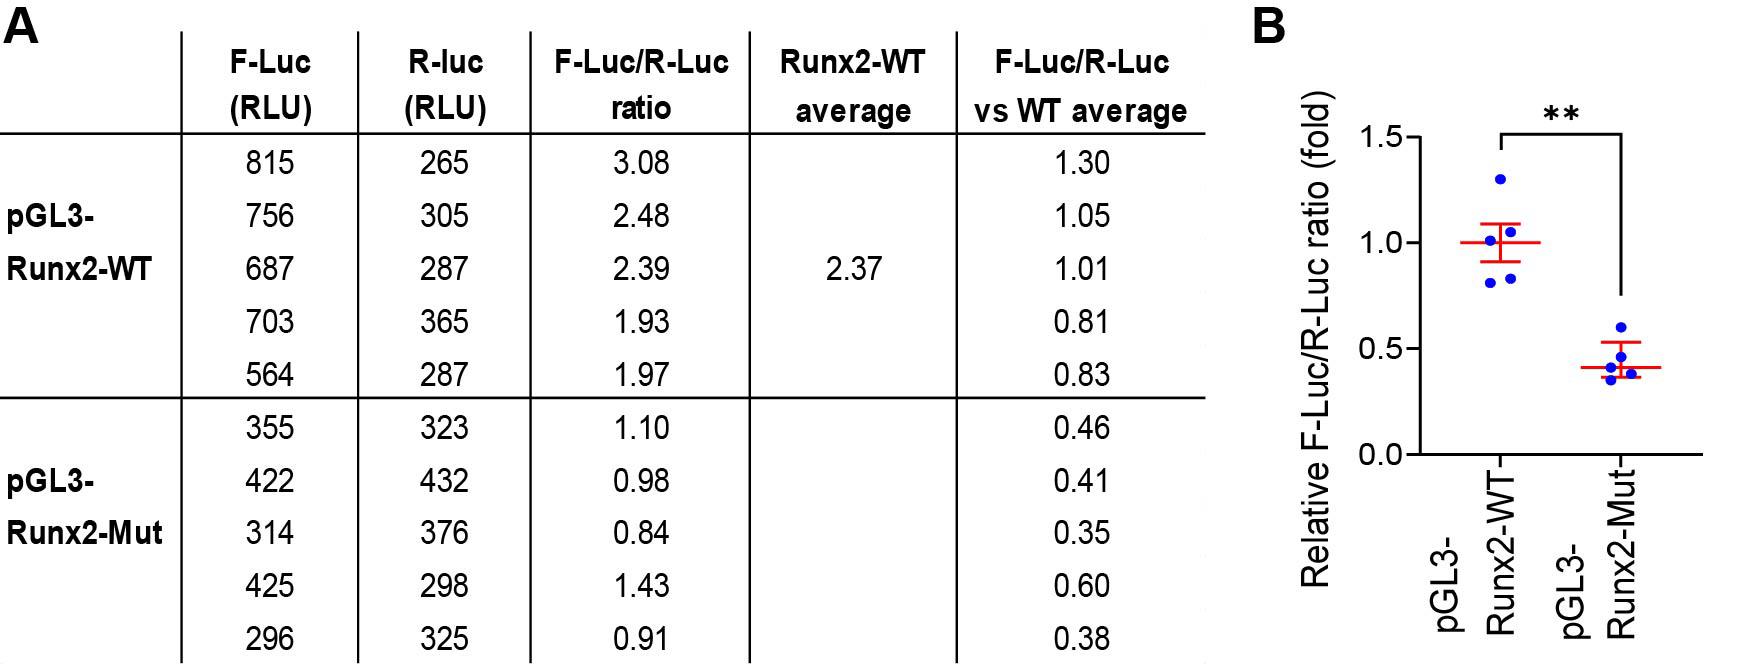
Figure 3. Relative ratios of F-Luc and R-Luc activities. (A) Calculation of the relative F-Luc/R-Luc activity ratios. Columns 2 and 3 show the relative light unit (RLU) of the luciferase assay with a replicate number of five. The average RLU of the background wells (3 RLU and 2 RLU for F-Luc and R-Luc, respectively) has already been subtracted. Column 4 shows the F-Luc/R-Luc ratio of each row. Column 5 shows the average value of wild-type (WT) F-Luc/R-Luc ratio. Column 6 shows the relative F-Luc/R-Luc ratios in comparison to the average WT ratio, which is defined as 1.0. (B) Relative F-Luc/R-Luc ratios are plotted along with average ± SEM with GraphPad Prism. ** p < 0.01 with unpaired two-sided t-test.
2. mRNA stability assay
a. Calculate the fraction of residual RNA at each time point with the value at 0 h defined as 100% as follows. Table S1 shows a step-by-step example of how to calculate these numbers based on the Ct (threshold cycle) of qPCR.
Step 1. Calculate the average Ct of technical triplicates for all samples.
Step 2. Subtract the Ct of 18S rRNA from the Ct of F-Luc to calculate ΔCt as follows:
ΔCt = Ct (F-Luc of pGL3-Runx2-WT or pGL3-Runx2-Mut) – Ct (18S rRNA)
Step 3. Normalize ΔCt at each time point against ΔCt at 0 h as follows:
ΔΔCt = ΔCt (2, 4 or 6 h) – ΔCt (0 h)
Step 4. Convert ΔΔCt into fold expression (0 h = 100%) as follows:
Fold expression (%) = 2-ΔΔCt × 100
Step 5. Calculate the average and SEM of the fold expression based on the biological triplicates.
Step 6. Apply unpaired two-sided t-test at each time pint to determine whether there is a statistically significant difference between pGL3-Runx2-WT and pGL3-Runx2-Mut.
Step 7. Plot the average and SEM in a graph with GraphPad Prism.
Figure 4 shows an example of the result. Mutations in the RRACH motifs decreased the stability of the F-Luc mRNA at 4 and 6 h upon inhibition of transcription.
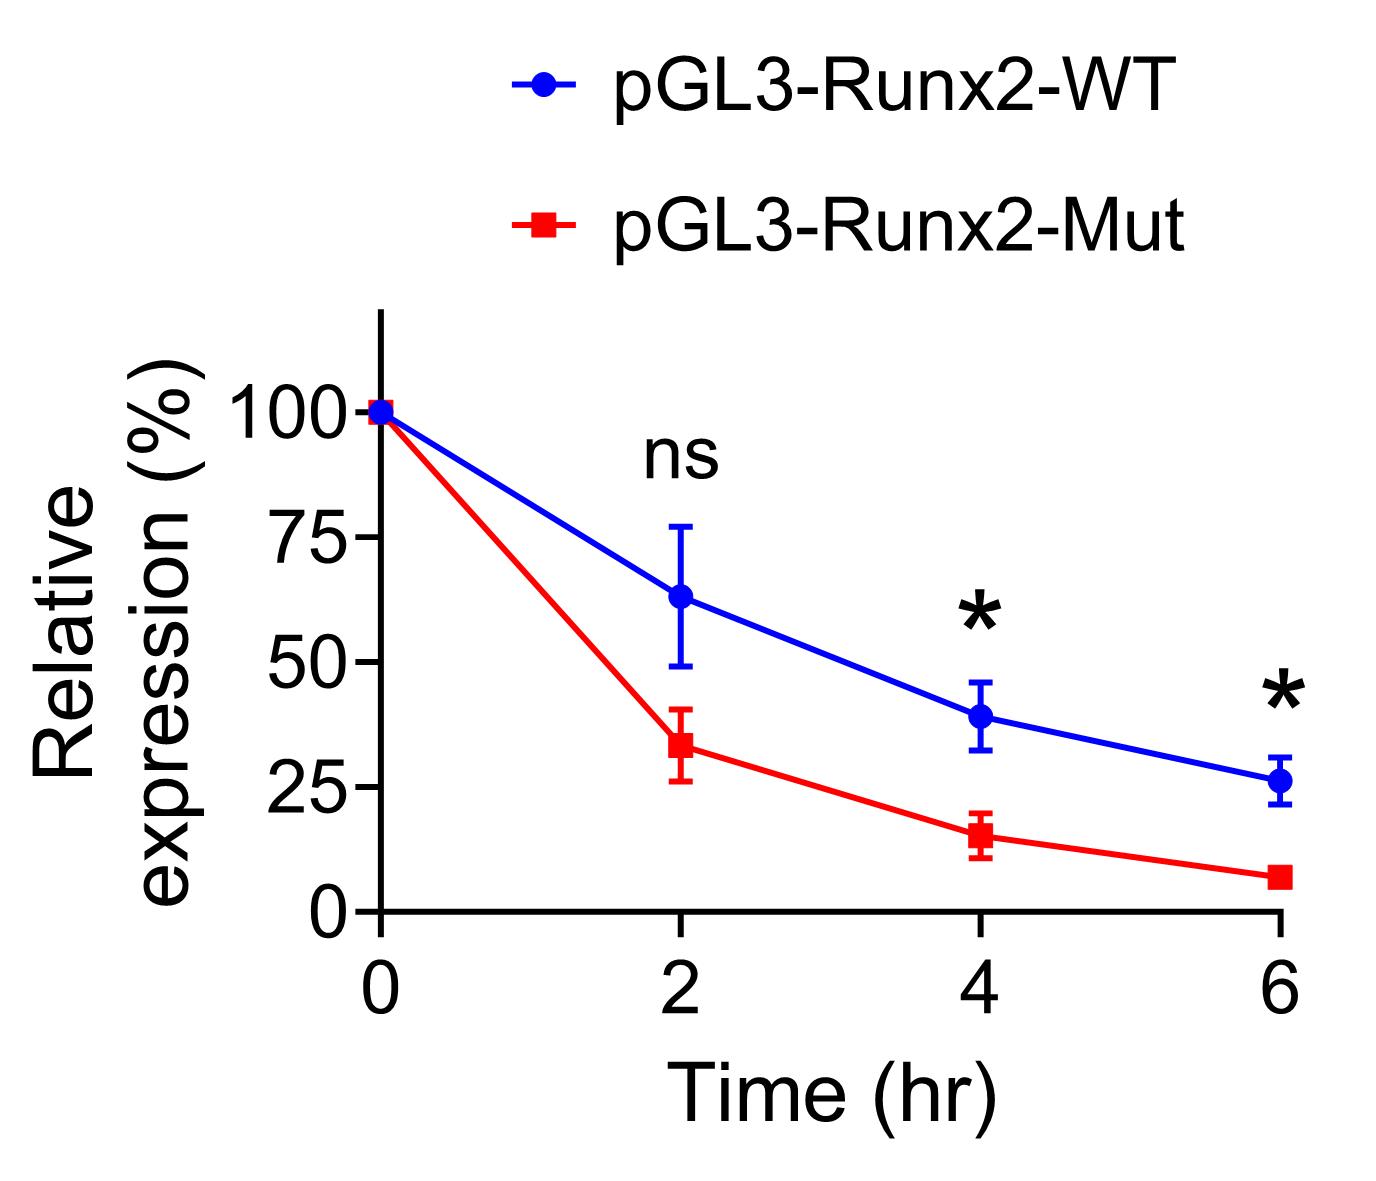
Figure 4. Relative expression levels of F-Luc-Runx2-WT and F-Luc-Runx2-Mut. The values at 0 h were defined as 100% each. *p < 0.05; ns, not significant with unpaired two-sided t-test (n = 3). Average ± SEM is shown at each time point.
Validation of protocol
1. Data were validated by repeating the experiments multiple times, as described in the Data analysis section above.
2. This protocol has been applied and validated in the following research article:
Katoku-Kikyo et al. [11]. METTL14 regulates chondrogenesis through the GDF5–RUNX–extracellular matrix gene axis during limb development, Nature Communications (Figure 8d–f and Supplementary Figure 9). https://doi.org/10.1038/s41467-025-59346-5
3. Several studies have used the luciferase assay to compare wild-type and mutant constructs at m6A sites (Table 2).
Table 2. Examples of the luciferase assay with mutated RRACH motifs
| Number of mutated RRACH motifs | Figures | Reference |
|---|---|---|
| 1 in 3′ UTR | Figure 6j and k | [15] |
| 1 in 5′ UTR and 3 in 3 UTR | Figure 4a–j | [16] |
| 3 in an exon | Figure 5b and c; and Supp Figure 4a | [17] |
| 3 in 3′ UTR | Figure 8g and h | [18] |
| 1 in 3′ UTR | Figure 4l | [19] |
4. No publications were found that tested RNA stability by comparing WT and Mut constructs at m6A sites. However, similar RNA stability assays have been performed on endogenous genes in WT vs. Mettl3 KO cells (Table 3).
Note: In such cases, m6A sites are demethylated genome-wide, which may also affect the machinery regulating RNA stability.
Table 3. Examples of the mRNA stability assay with Mettl3 KO cells
| Genes of interest | Figures | Reference |
|---|---|---|
| Hsp70 | Figure 6c | [20] |
| Ddit4 | Figure 3I | [21] |
| Tcl7 | Figure 6l and m | [15] |
| Mycn | Figure 6b | [22] |
5. Mutations of the RRACH motifs can cause unintended modifications in mRNA, causing false-positive or false-negative results. For example, mutations may modify the 3D structure of mRNA and proteins (for the coding region) and interactions with the ribosome and other proteins. This potential problem has been addressed by studying additional effects of depletion [16–18] or overexpression of Mettl3 [15,19]. However, up- or downregulation of Mettl3 affects m6A genome-wide, as mentioned above, causing indirect effects as well. Another option is to mutate the minimum number of RRACH motifs within the m6A peaks after screening several motifs to decrease the risk of structural changes.
General notes and troubleshooting
General notes
1. If an m6A site lies outside the RRACH motif, it will be completely missed by the current mutation protocol.
2. Only about 5% of RRACH motifs undergo m6A modification as mentioned above, meaning most motifs are free of m6A. This creates a risk of false-positive results in luciferase-based assays. It is therefore important to combine this method with other functional assays to draw conclusions about the role of m6A in putative target genes.
3. Most published studies have examined m6A in the 3′ UTR, including those listed in Table 2; however, the same approach can be applied to m6A sites in the 5′ UTR and coding region.
Troubleshooting
Problem 1: Low reproducibility of the luminescence intensity.
Possible causes:
1) Pipetting error due to the handling of small volumes of the reagents during transfection.
2) Too many bubbles in the wells, affecting the reading of the luminescence.
Solutions:
1) Make a larger volume of the core mix and increase the number of replicates.
2) Centrifuge the plate to remove bubbles.
Problem 2: Cells show morphological changes or die during the treatment with actinomycin D in Section C.
Possible cause: Actinomycin D is inherently toxic.
Solution: Titrate the dose of actinomycin D while verifying the inhibition of transcription with a Click-iT RNA Alexa Fluor imaging kit or other methods.
Problem 3: The mutations do not affect F-Luc activity or the stability of the mRNA.
Possible cause: m6A plays other roles.
Solution: Test how the mutations affect splicing, nuclear export, and subcellular localization of the target mRNA.
Problem 4: 293FT cells transfected with the mutant die or do not proliferate well.
Possible causes:
1) This could be a genuine effect due to the loss of m6A.
2) The mutations disrupted the structure or function of the mRNA independently of m6A.
Solution: Cause 2) could be partially addressed by minimizing the mutation sites. Cause 1) would be solved by the exclusion of cause 2).
Supplementary information
The following supporting information can be downloaded here:
1. Table S1. An example of the step-by-step analysis of the qPCR data in the RNA stability assay.
Acknowledgments
Specific contributions of each author are as follows: Conceptualization, N.K.; Investigation, N.K-K. and N.K.; Writing—Original Draft, N.K.; Writing—Review & Editing, N.K-K. and N.K.; Funding acquisition, N.K.; Supervision, N.K. N.K. was supported by the NIH (R01GM137603) and Regenerative Medicine Minnesota (RMM 072523 DS 002).
This protocol was used in [11].
Competing interests
The author declares no conflicts of interest.
References
- Boulias, K. and Greer, E. L. (2023). Biological roles of adenine methylation in RNA. Nat Rev Genet. 24(3): 143–160. https://doi.org/10.1038/s41576-022-00534-0
- He, P. C. and He, C. (2021). m6A RNA methylation: from mechanisms to therapeutic potential. EMBO J. 40(3): e2020105977. https://doi.org/10.15252/embj.2020105977
- Sendinc, E. and Shi, Y. (2023). RNA m6A methylation across the transcriptome. Mol Cell. 83(3): 428–441. https://doi.org/10.1016/j.molcel.2023.01.006
- Perry, R. and Kelley, D. (1974). Existence of methylated messenger RNA in mouse L cells. Cell. 1(1): 37–42. https://doi.org/10.1016/0092-8674(74)90153-6
- Desrosiers, R., Friderici, K. and Rottman, F. (1974). Identification of Methylated Nucleosides in Messenger RNA from Novikoff Hepatoma Cells. Proc Natl Acad Sci USA. 71(10): 3971–3975. https://doi.org/10.1073/pnas.71.10.3971
- Jia, G., Fu, Y., Zhao, X., Dai, Q., Zheng, G., Yang, Y., Yi, C., Lindahl, T., Pan, T., Yang, Y. G., et al. (2011). N6-Methyladenosine in nuclear RNA is a major substrate of the obesity-associated FTO. Nat Chem Biol. 7(12): 885–887. https://doi.org/10.1038/nchembio.687
- Bokar, J., Rath-Shambaugh, M., Ludwiczak, R., Narayan, P. and Rottman, F. (1994). Characterization and partial purification of mRNA N6-adenosine methyltransferase from HeLa cell nuclei. Internal mRNA methylation requires a multisubunit complex. J Biol Chem. 269(26): 17697–17704. https://doi.org/10.1016/s0021-9258(17)32497-3
- Dominissini, D., Moshitch-Moshkovitz, S., Schwartz, S., Salmon-Divon, M., Ungar, L., Osenberg, S., Cesarkas, K., Jacob-Hirsch, J., Amariglio, N., Kupiec, M., et al. (2012). Topology of the human and mouse m6A RNA methylomes revealed by m6A-seq. Nature. 485(7397): 201–206. https://doi.org/10.1038/nature11112
- Meyer, K. D., Saletore, Y., Zumbo, P., Elemento, O., Mason, C. E. and Jaffrey, S. R. (2012). Comprehensive Analysis of mRNA Methylation Reveals Enrichment in 3′ UTRs and near Stop Codons. Cell. 149(7): 1635–1646. https://doi.org/10.1016/j.cell.2012.05.003
- Ge, R., Ye, C., Peng, Y., Dai, Q., Zhao, Y., Liu, S., Wang, P., Hu, L. and He, C. (2022). m6A-SAC-seq for quantitative whole transcriptome m6A profiling. Nat Protoc. 18(2): 626–657. https://doi.org/10.1038/s41596-022-00765-9
- Katoku-Kikyo, N., Kawakami, H., Cantor, M., Kawakami, Y. and Kikyo, N. (2025). METTL14 regulates chondrogenesis through the GDF5–RUNX–extracellular matrix gene axis during limb development. Nat Commun. 16(1): 4072. https://doi.org/10.1038/s41467-025-59346-5
- Hsu, P. J. and He, C. (2018). Identifying the m6A Methylome by Affinity Purification and Sequencing. Methods Mol Biol. 1649: 49–57. https://doi.org/10.1007/978-1-4939-7213-5_3
- Dominissini, D., Moshitch-Moshkovitz, S., Salmon-Divon, M., Amariglio, N. and Rechavi, G. (2013). Transcriptome-wide mapping of N6-methyladenosine by m6A-seq based on immunocapturing and massively parallel sequencing. Nat Protoc. 8(1): 176–189. https://doi.org/10.1038/nprot.2012.148
- Shi, Y., Wu, Z., Zhang, W., Qu, J., Ci, W. and Liu, G. H. (2023). An experimental workflow for identifying RNA m6A alterations in cellular senescence by methylated RNA immunoprecipitation sequencing. J Biol Methods. 10: e99010004. https://doi.org/10.14440/jbm.2023.403
- Yao, Y., Yang, Y., Guo, W., Xu, L., You, M., Zhang, Y. C., Sun, Z., Cui, X., Yu, G., Qi, Z., et al. (2021). METTL3-dependent m6A modification programs T follicular helper cell differentiation. Nat Commun. 12(1): 2578. https://doi.org/10.1038/s41467-021-21594-6
- Li, Z., Peng, Y., Li, J., Chen, Z., Chen, F., Tu, J., Lin, S. and Wang, H. (2020). N6-methyladenosine regulates glycolysis of cancer cells through PDK4. Nat Commun. 11(1): e1038/s41467–020–16306–5. https://doi.org/10.1038/s41467-020-16306-5
- Li, G., Ma, L., He, S., Luo, R., Wang, B., Zhang, W., Song, Y., Liao, Z., Ke, W., Xiang, Q., et al. (2022). WTAP-mediated m6A modification of lncRNA NORAD promotes intervertebral disc degeneration. Nat Commun. 13(1): 1469. https://doi.org/10.1038/s41467-022-28990-6
- Leoni, C., Bataclan, M., Ito-Kureha, T., Heissmeyer, V. and Monticelli, S. (2023). The mRNA methyltransferase Mettl3 modulates cytokine mRNA stability and limits functional responses in mast cells. Nat Commun. 14(1): 3862. https://doi.org/10.1038/s41467-023-39614-y
- Han, X., Liu, L., Huang, S., Xiao, W., Gao, Y., Zhou, W., Zhang, C., Zheng, H., Yang, L., Xie, X., et al. (2023). RNA m6A methylation modulates airway inflammation in allergic asthma via PTX3-dependent macrophage homeostasis. Nat Commun. 14(1): 7328. https://doi.org/10.1038/s41467-023-43219-w
- Knuckles, P., Carl, S. H., Musheev, M., Niehrs, C., Wenger, A. and Bühler, M. (2017). RNA fate determination through cotranscriptional adenosine methylation and microprocessor binding. Nat Struct Mol Biol. 24(7): 561–569. https://doi.org/10.1038/nsmb.3419
- Qin, Y., Li, B., Arumugam, S., Lu, Q., Mankash, S. M., Li, J., Sun, B., Li, J., Flavell, R. A., Li, H. B., et al. (2021). m6A mRNA methylation-directed myeloid cell activation controls progression of NAFLD and obesity. Cell Rep. 37(6): 109968. https://doi.org/10.1016/j.celrep.2021.109968
- Collignon, E., Cho, B., Furlan, G., Fothergill-Robinson, J., Martin, S. B., McClymont, S. A., Ross, R. L., Limbach, P. A. and Ramalho-Santos, M. (2023). m6A RNA methylation orchestrates transcriptional dormancy during paused pluripotency. Nat Cell Biol. 25(9): 1279–1289. https://doi.org/10.1038/s41556-023-01212-x
Article Information
Publication history
Received: Aug 14, 2025
Accepted: Sep 26, 2025
Available online: Oct 14, 2025
Published: Nov 5, 2025
Copyright
© 2025 The Author(s); This is an open access article under the CC BY-NC license (https://creativecommons.org/licenses/by-nc/4.0/).
How to cite
Katoku-Kikyo, N. and Kikyo, N. (2025). Examining the Roles of m6A Sites in mRNA Using the Luciferase Gene Fused With Mutated RRACH Motifs. Bio-protocol 15(21): e5492. DOI: 10.21769/BioProtoc.5492.
Category
Molecular Biology > RNA > RNA Modification
Developmental Biology > Morphogenesis > Organogenesis
Do you have any questions about this protocol?
Post your question to gather feedback from the community. We will also invite the authors of this article to respond.