- Protocols

- Articles and Issues
- For Authors
- About
- Become a Reviewer

SunTag-Based Single-Molecule Translation Imaging in Caenorhabditis elegans
Published: Vol 15, Iss 20, Oct 20, 2025 DOI: 10.21769/BioProtoc.5486 Views: 2694
Reviewed by: Munenori IshibashiAnonymous reviewer(s)
Original research article
The authors used this protocol in:

May 2025
Advertisement


Protocol Collections
Comprehensive collections of detailed, peer-reviewed protocols focusing on specific topics


Related protocols
Abstract
Translation is a key step in decoding the genetic information stored in DNA. Regulation of translation is an important step in gene expression control and is essential for healthy organismal development and behavior. Despite the importance of translation regulation, its impact and dynamics remain only partially understood. One reason is the lack of methods that enable the real-time visualization of translation in the context of multicellular organisms. To overcome this critical gap, microscopy-based methods that allow visualization of translation on single mRNAs in living cells and animals have been developed. A powerful approach is the SunTag system, which enables real-time imaging of nascent peptide synthesis with high spatial and temporal resolution. This protocol describes the implementation and use of the SunTag translation imaging system in the small round worm Caenorhabditis elegans. The protocol provides details on how to design, carry out, and interpret experiments to image translation dynamics of an mRNA of interest in a cell type of choice of living C. elegans. The ability to image translation live enables better understanding of translation and reveals the mechanisms underlying the dynamics of cell type–specific and subcellular localization of translation in development.
Key features
• Describes how to visualize translation of single mRNA molecules in living C. elegans.
• Can be used to visualize translation in space and time in C. elegans larvae and embryos.
Keywords: mRNA translationGraphical overview
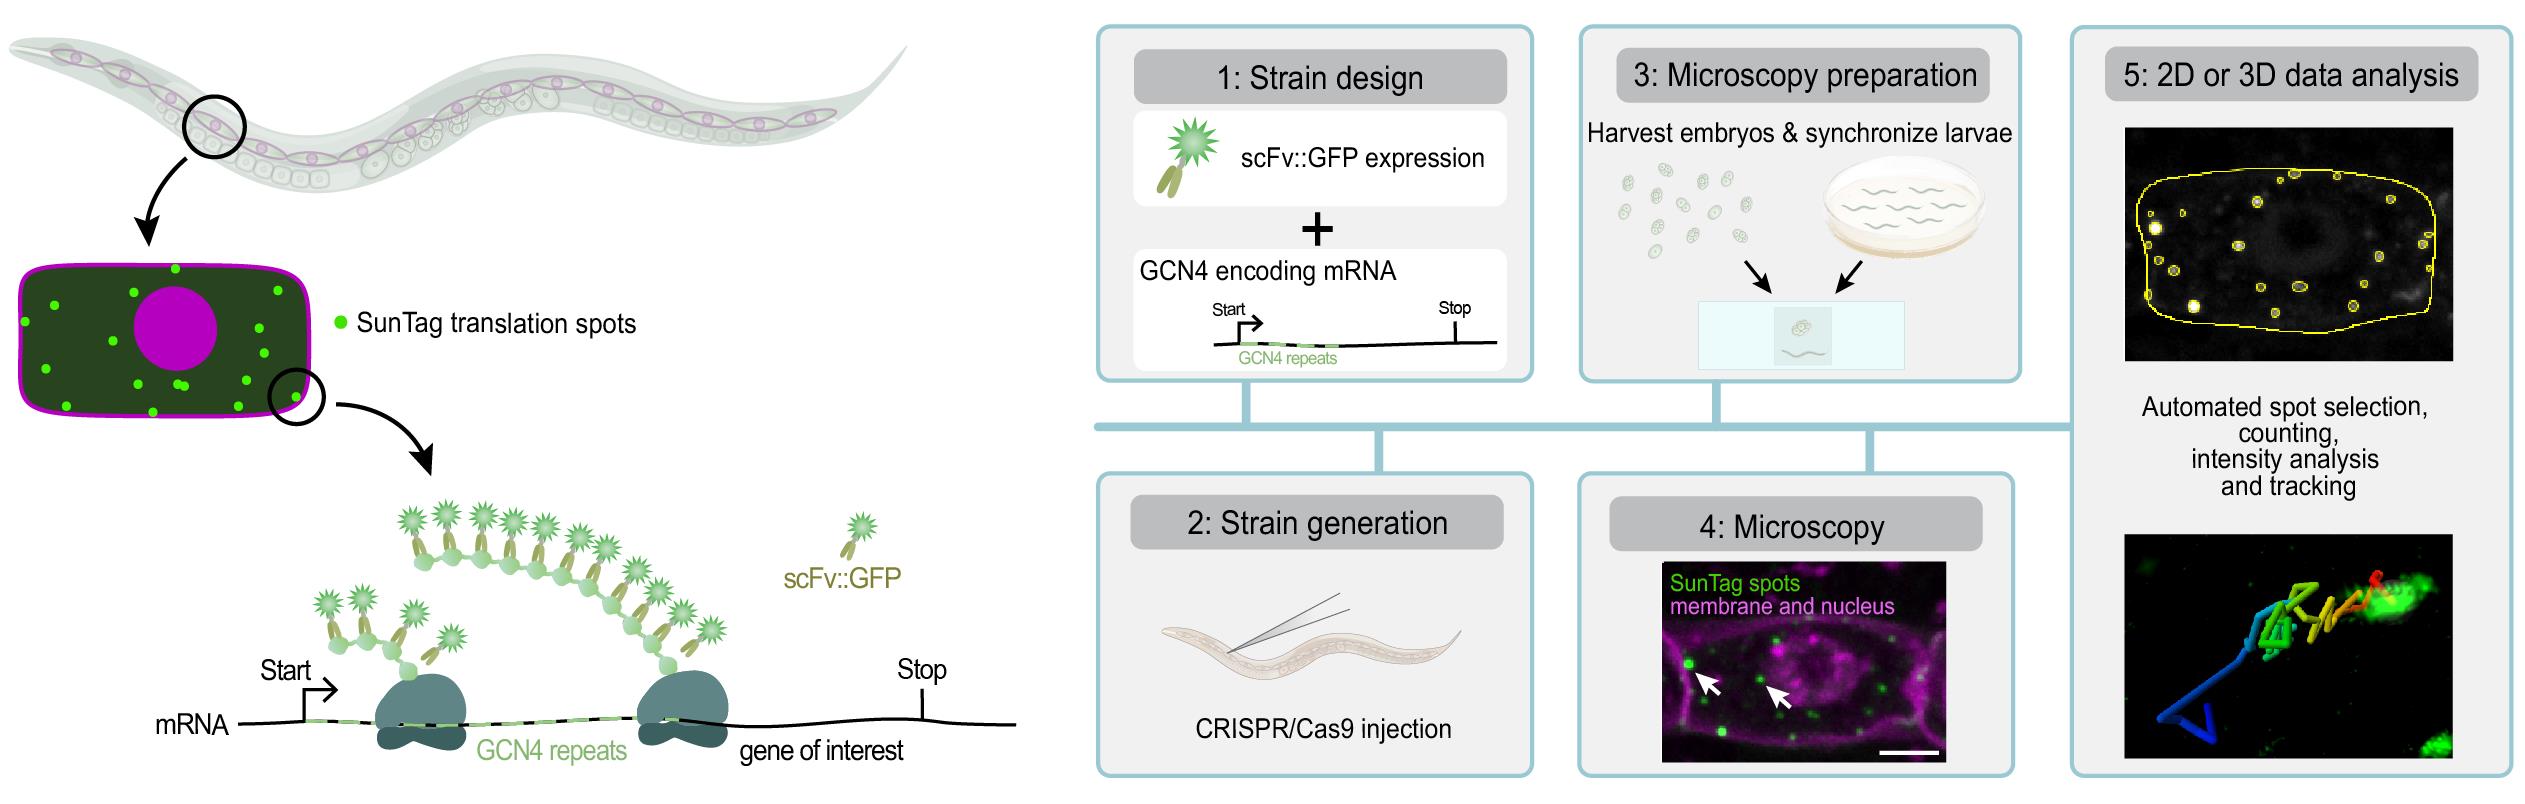
Visualizing translation in C. elegans using the SunTag system. The SunTag system enables real-time imaging of translation in specific cells during C. elegans development, from embryos to larvae. To visualize translation, a gene of interest is fused to an array of SunTag (GCN4) peptides. The GCN4 peptides emerge first from the ribosome and are bound by the co-expressed, GFP-labeled SunTag antibody (scFv::GFP), resulting in a bright fluorescent spot at the site of translation and thus allowing real-time observation of protein synthesis. This protocol provides step-by-step instructions for designing and generating strains, preparing animals for microscopy, performing live translation imaging, and analyzing data in 2D or 3D.
Background
Translation of mRNAs into proteins is a key step in gene expression, and its regulation is essential for cellular functioning. Translation is fast, reversible, and allows for post-transcriptional control of gene expression, especially when transcription is silenced. For example, during early embryogenesis, translation regulation of maternally provided mRNAs directs lineage specification and embryonic development [1]. In addition, translation regulation enables localized protein synthesis, for example, in highly polarized cells such as neurons [2]. Due to its vital role in tissue homeostasis [3], defects in either translation efficiency or fidelity affect healthy aging [4] and underlie many human diseases, including neurological disorders and cancer [5,6].
In recent years, different methods have provided many new and important insights into the regulation of translation, yet many questions remain. For instance, although translational heterogeneity between individual mRNAs is increasingly recognized [7], it is still unclear how widespread this heterogeneity is, under what conditions it occurs, and how it is regulated in space and time—particularly in multicellular organisms. Addressing these questions requires tools that reveal when and where specific mRNAs are translated. A major limitation of many current methods is their dependence on population-level measurements and the requirement for fixation or lysis, capturing only static snapshots and average translation efficiencies of thousands of mRNAs. For example, ribosome profiling [8,9] is a powerful sequencing-based method to assess global translation, but lacks spatial and temporal resolution. Newer methods, such as RIBOmap [10], partially address this by mapping the location of translated mRNAs in tissues, but offer limited insight into translation efficiencies of individual mRNAs or in changes over time. To overcome these limitations, live-imaging of translation has been developed, using the SunTag system [11–16], which enables real-time analysis of the location, timing, and efficiency of translation of specific mRNAs in living cells and animals. Here, we describe how to use the SunTag system in C. elegans.
The SunTag system relies on two components: 1) an mRNA of interest encoding an array of SunTag peptides (GCN4s), and 2) an anti-GCN4 SunTag antibody labeled with superfolder GFP (scFv::GFP). During mRNA translation, the GCN4 peptides are synthesized and rapidly bound by the co-expressed scFv::GFP antibody (Figure 1A). As multiple ribosomes simultaneously translate the mRNA and each ribosome produces multiple GCN4 repeats, the scFv::GFP accumulates at the site of translation, which appears as a bright fluorescent spot under the microscope (Figure 1 and Video 1). The intensity of each spot is determined by the number of ribosomes that translate the mRNA. Together, the number of translation spots and the intensity of the spots provide a quantitative measure of translation efficiency. Moreover, tracking individual SunTag spots over time yields detailed insight into the spatial and temporal dynamics of translation.
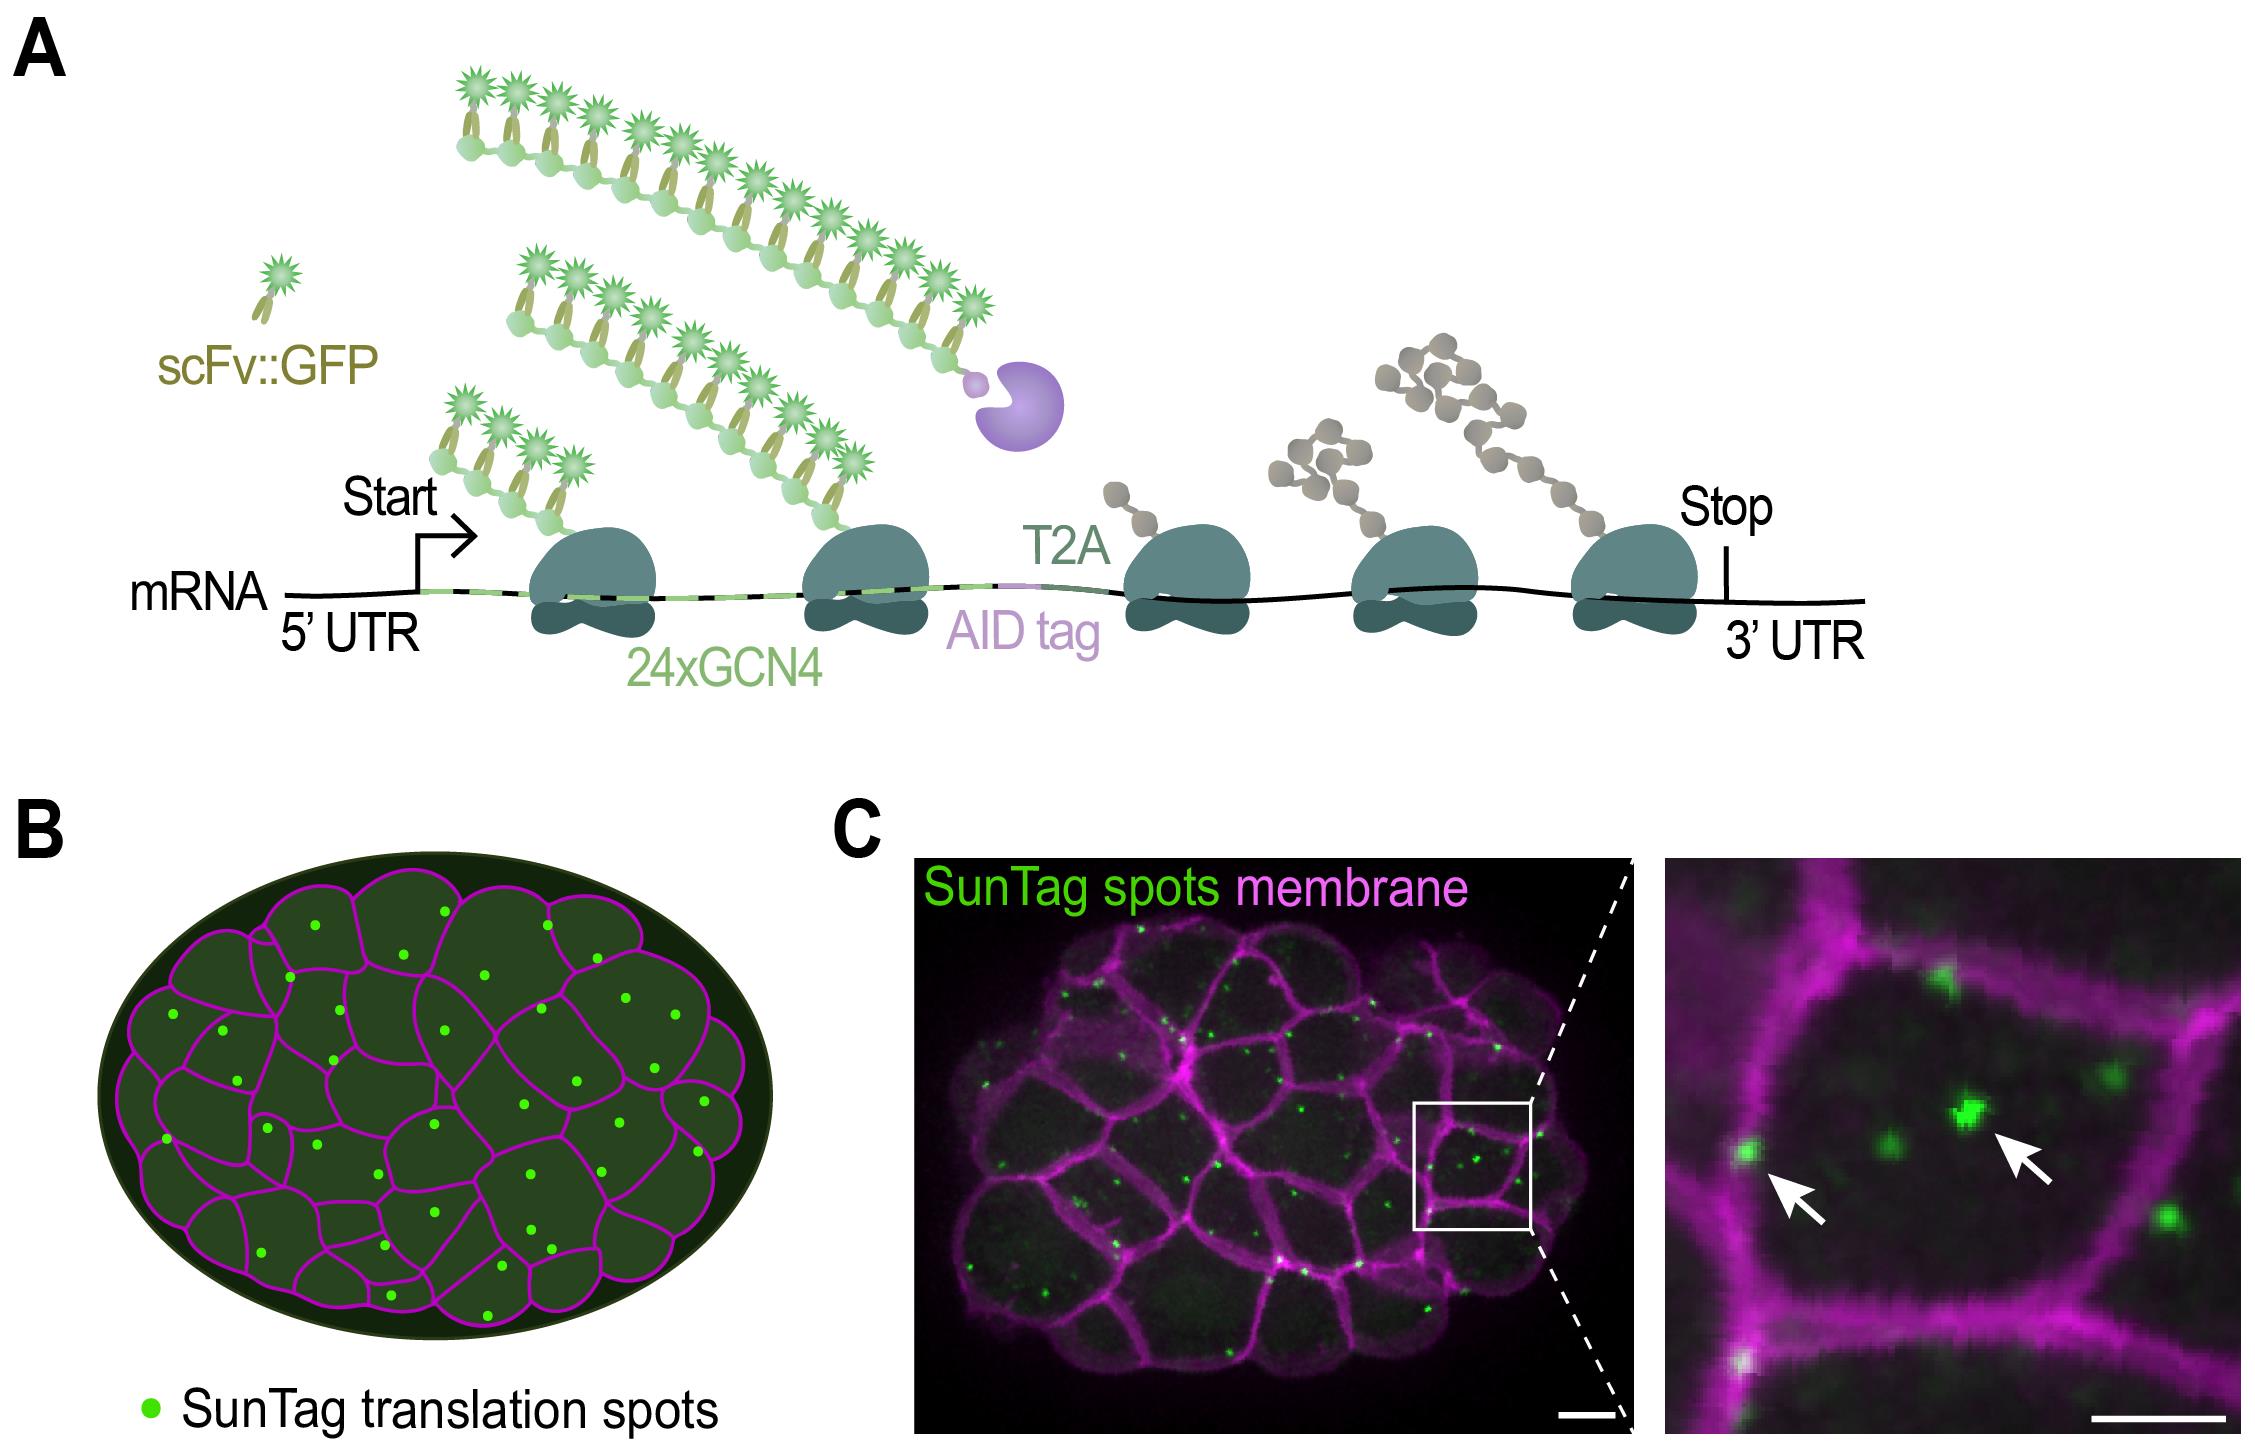
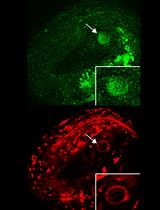
Figure 1. Imaging translation of single mRNA molecules. (A) Schematic representation of the fluorescent labeling of nascent polypeptides using the SunTag system. When the mRNA is translated, scFv::GFP antibodies will bind to the SunTag peptides that emerge from the ribosome, resulting in a bright fluorescent spot at the site of translation and thus allowing real-time observation of protein synthesis. (B) Schematic representation of an embryo with membranes in magenta and translation spots in green. (C) Representative image of an embryo expressing scFv::GFP and the translational reporter (eft-3p::24xGCN4::T2A::BFP::h2b::tbb-2 3’UTR). Translation is shown in green, membranes in magenta. A zoomed-in view of the white-boxed area is shown to the right. Scale bars, 5 μm (left panel) or 2.5 μm (right panel).

Materials and reagents
Biological materials
1. OP50 Escherichia coli (OP50) (C. elegans Genetic Center)
2. eft-3p::Cas9 plasmid (50 ng/μL) (Addgene, #46168)
3. Single-guide RNA (sgRNA) plasmid (50 ng/μL) (IDT)
4. pRF4 [rol-6(su1006)] (40 ng/μL) [22]
5. Repair template plasmid (50 ng/μL) (Addgene, # depends on specific aim)
6. Co-injection marker plasmid (2.5 ng/μL) (Addgene, # depends on specific aim)
7. pcDNA4TO-24xGCN4_v4-kif18b-24xPP7 (Addgene, #74928) [12]
8. Useful strains for SunTag imaging (see Tables 1 and S1 and Figure 2)
Table 1. Available SunTag strains
| Strain name | Genotype See Table S1 for a description of how the strains were generated, including the sequence of the constructs, and Figure 2 for a graphical representation of the strains |
| SUR10 | cxTi10816(rubSi7[eft-3p::24xGCN4::t2a::tagbfp::h2b::tbb-2 3’UTR) IV; ttTi5605(rubSi6[eft-3p::scfv(glo)::gfp(smu-1 introns)::tbb-2 3’UTR II |
| SUR54 | cxTi10816(rubSi8[eft-3p::24xGCN4::AID::t2a::tagbfp::h2b::tbb-2 3’UTR *rubSi7]) IV; ttTi5605(rubSi6[eft-3p::scfv(glo)::gfp(smu-1 introns)::tbb-2 3’UTR;]) II; ltIs44[pie-1p::mCherry::PH(PLC1delta1) + unc-119(+)]; wrdSi23[eft-3p::TIR1::F2A::mTagBFP2::AID*::NLS::tbb-2 3'UTR] (I:-5.32) |
| SUR72 | ttTi5605(rubSi6[eft-3p::scfv(glo)::gfp(smu-1 introns)::tbb-2 3’UTR;]) II |
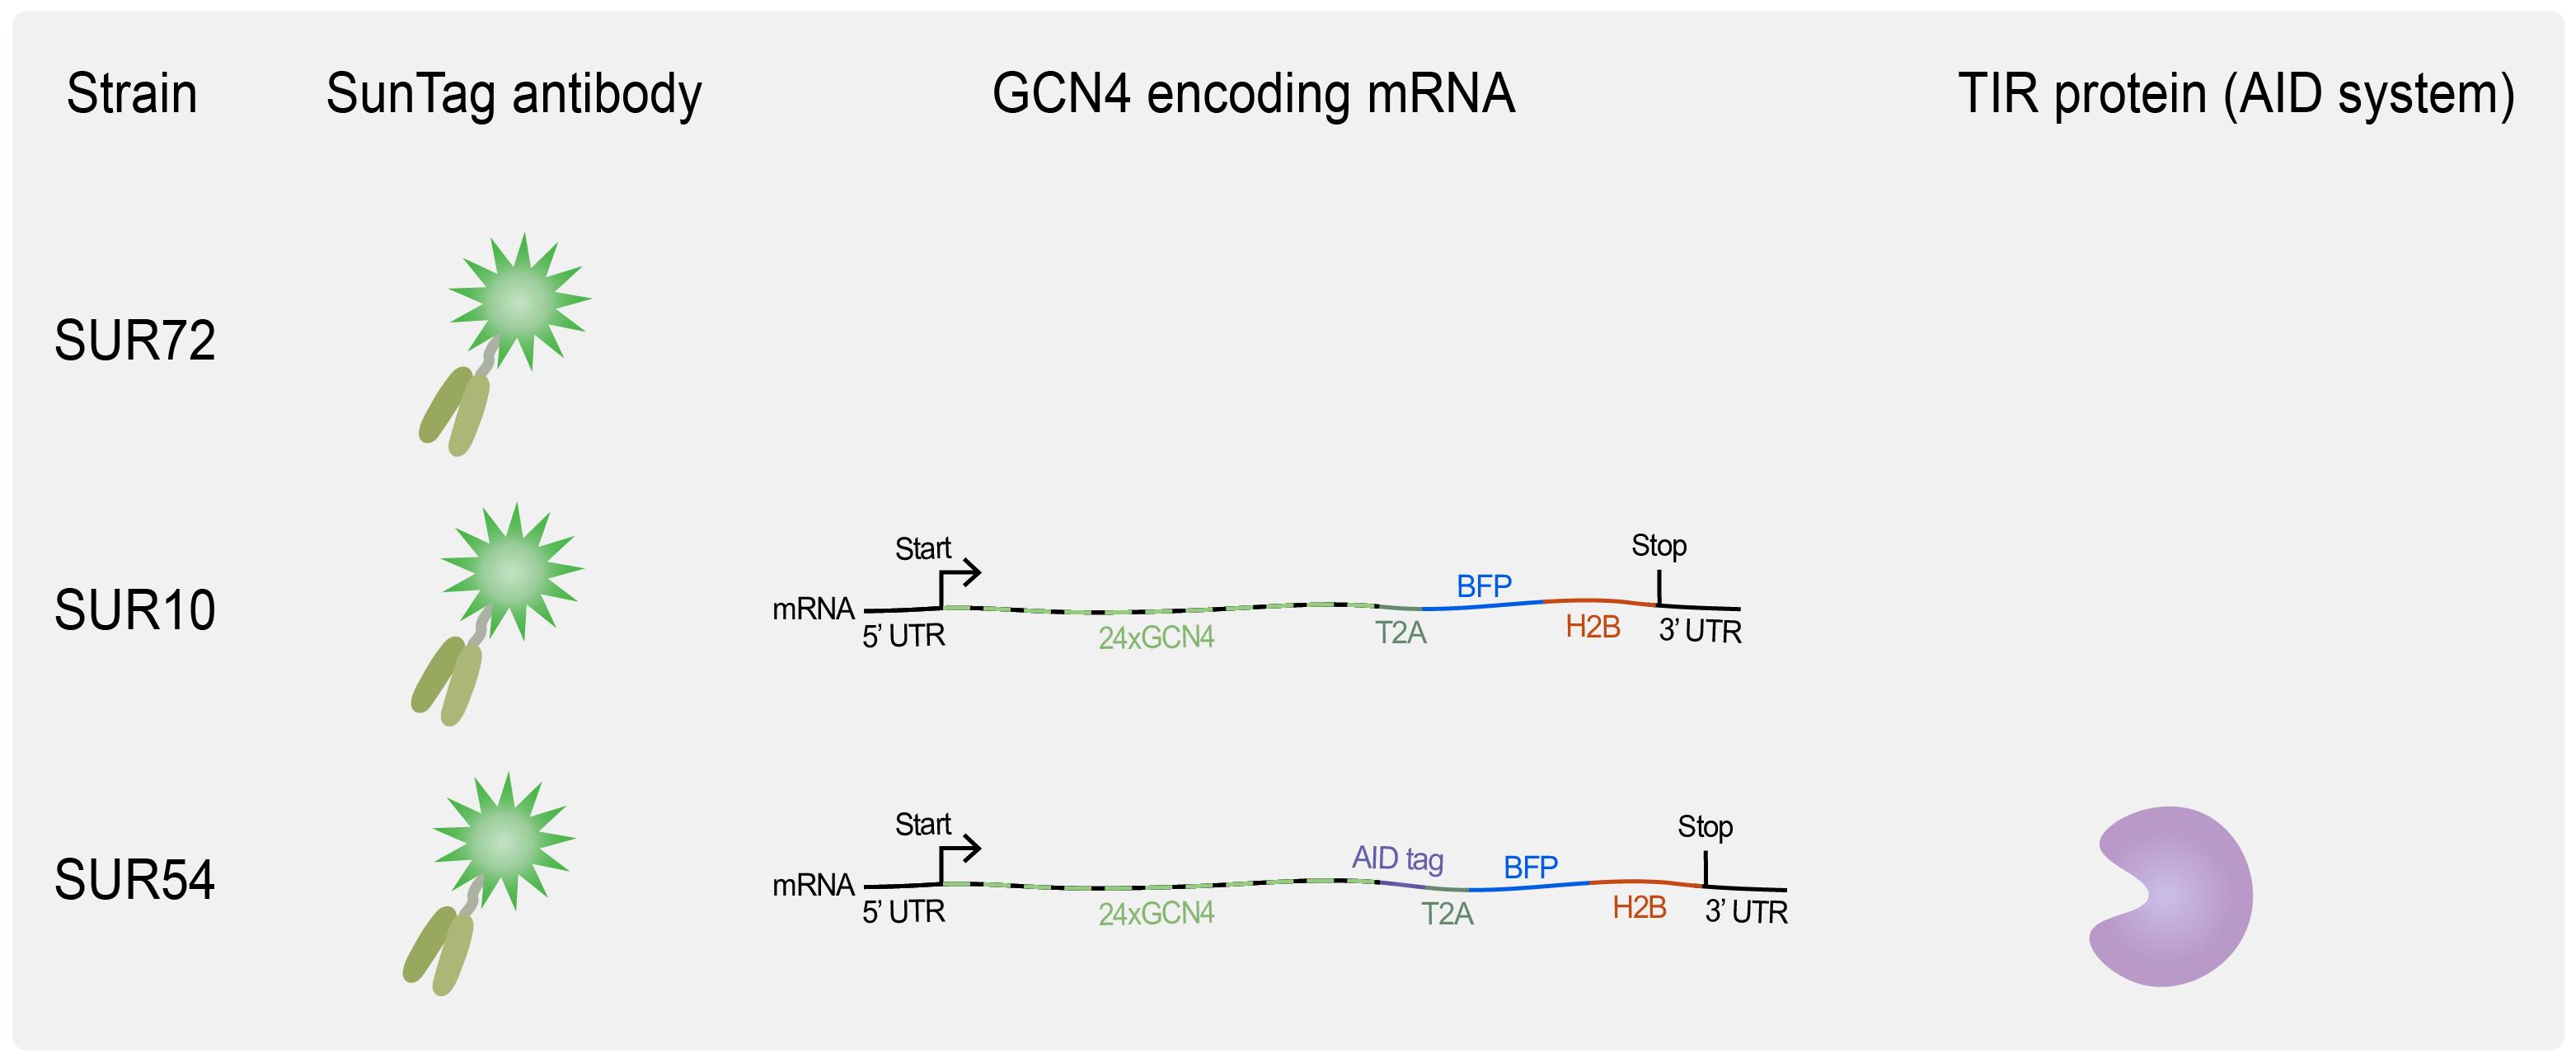
Figure 2. Overview of available C. elegans strains for translation imaging. SUR72 expresses the SunTag antibody scFv::GFP, SUR10 combines scFv::GFP expression with the expression of a general translation reporter, and SUR54 adds the auxin-mediated degradation system, which requires TIR1 expression (see Biological materials 8 for genotypes).
9. Useful plasmids (see Tables 2 and S2)
Table 2. Useful plasmids for implementing the SunTag system
| Plasmid | Description of the most important sequences present in the plasmid. Please note that the full sequence is provided in Table S2 | Addgene ID |
| pSRG_11 | SunTag antibody | #245121 |
| pSRG_12 | SunTag reporter without AID system | #245120 |
| pSRG_100 | 3xGCN4 | #246457 |
| pSRG_101 | KasI::24xGCN4::T2A::AvrII | #246458 |
| pJJS_001 | mIAA7::GFP::Linker | #188324 |
Reagents
1. Cas9 protein (0.25 μg/μL) (IDT, catalog number: 1081058)
2. TracRNA (0.1 μg/μL) (IDT, catalog number: 1073190)
3. Locus-specific crRNA can be ordered from IDT, sequence dependent on the gene of interest (56 ng/μL) (IDT)
4. Primers containing 5′ SP9 modifications can be ordered from IDT, sequence dependent on the gene of interest (IDT)
5. ssODN can be ordered from IDT, sequence dependent on the gene of interest (0.11 μg/μL) (IDT), see [23] for how to design
6. NucleoSpin Gel and PCR Clean-up kit (Macherey-Nagel, catalog number: 740609.250)
7. 1 mM auxin (IAA) (Alfa Aesar, CAS number: 87-51-4)
8. 10 mM Tetramisole hydrochloride solution (Sigma, CAS number: 5086-74-8)
9. Q5® High-Fidelity PCR Kit (New England Biolabs, catalog number: E0555)
10. UltraPure agarose (Invitrogen, catalog number: 16500500)
11. NaCl (Merck, CAS number: 7647-14-5)
12. Na2HPO4·2H2O (Merck, CAS number: 10028-24-7)
13. KH2PO4 (Merck, CAS number: 7778-77-0)
14. NaOH pellets (Merck, CAS number: 1310-73-2)
15. Agar powder (Boom, CAS number: 9002-18-0)
16. BactoTM peptone (Gibco, catalog number: 211677)
17. K2HPO4 (Carl Roth, CAS number: 7758-11-4)
18. MgSO4·7H2O (Sigma, CAS number: 10034-99-8)
19. CaCl2·2H2O (Sigma, CAS number: 10035-04-8)
20. Cholesterol (Sigma, CAS number: 57-88-5)
21. Ethanol (Merck, CAS number: 64-17-5)
22. TWEEN® 20 (Sigma-Aldrich, CAS number: 9005-64-5)
23. Commercial thin bleach (<5% NaOCl) (C.I.V. Superunie B.A., catalog number: 8710624315320)
24. Useful PCR primers, see Table 3
Table 3. Useful primers for genotyping SunTag strains
| Purpose | Primer sequence | Target sequence |
| Genotype SunTag antibody1 | (F) CTGATTGACCCGATGAAATACGGATG | tti5605 MosSci site, Chr II, flanking SunTag antibody |
| (R) CTCACTCGTTTAGGCTATTCCCC | tti5605 MosSci site, Chr II, flanking SunTag antibody | |
| Genotype SunTag reporter2 | (F) GGAAGTCGGAGTACAAATTCG | cxTi10816 MosSci site, Chr IV, flanking SunTag reporter |
| (R) CGAACCATTCTTCCTGGC | cxTi10816 MosSci site, Chr IV, flanking SunTag reporter | |
| Genotype SunTag antibody or reporter3 | (F) AGTTGACAATAAAAGACCAAAGGTGC | eft-3promoter, within SunTag antibody locus and within SunTag reporter locus |
| Genotype TIR1 | (F) TGTCGACCGCTAGTGTAGCTTAC | Genomic Homology L ttTi4348, Chr I |
| (R) CGTCTCTCCACGATTTACACACTATTTG | Genomic Homology R ttTi4348, Chr 1 | |
| (R) CTGGCCGTCGTTTTACAGGA | let-858 UTR | |
| Amplify 24xGCN4::T2A from pSRG_12 for CRISPR/Cas-9 | (F) [N]30CATGGGCGCCATCATACACGCGGCCGCAATCAT | 5′ end of 24xGCN4::T2A |
| (R) [N]30TGGTCCTGGGTTCTCCTCGACGTC | 3′ end of 24xGCN4::T2A | |
| Amplify 3xGCN4 from pSRG_100 for CRISPR/Cas KI | (F) [N]30ATGGAGGAATTATTGAGCAAGAACTACCAC | 5′ end of 3xGCN4::linker |
| (R) [N]30AGAGCCGGATCCCTTCTTGAGAC | 3′ end of 3xGCN4::linker | |
| Amplify AID from Addgene # 188324 for CRISPR/Cas KI | (F) [N]30GGATTCTCCGAGACCGTCGA | 5′ end of miniIAA7 |
| (R) [N]30GGAGGAGGTCTTTTGTTGGGTC | 3′ end of miniIAA7 |
2Combine with 3 for genotyping the SunTag reporter
Solutions
1. Nematode growth medium (NGM) (see Recipes)
2. NGM with 1 mM auxin (NGM + IAA) (see Recipes)
3. M9 buffer (see Recipes)
4. Bleach solution (see Recipes)
5. KPO4 buffer, pH 6 (see Recipes)
6. PCR reaction master mix (see Recipes)
Recipes
1. Nematode growth medium (NGM)
| Reagent | Final concentration | Quantity or volume for 1 L |
| NaCl | 50 mM | 3 g |
| BactoTM peptone | 2.5 g/L | 2.5 g |
| Agar powder | 17 g/L | 17 g |
| Deionized H2O | n/a | 975 mL |
| Autoclave (20 min, 121 °C), cool until 55 °C, and add the following | ||
| 5 mg/mL cholesterol, diluted in 100% ethanol | 0.005 g/L | 1 mL |
| 1 M CaCl2 solution | 1 mM | 1 mL |
| 1 M MgSO4 solution | 1 mM | 1 mL |
| 1 M KPO4 buffer, pH 6 (see Recipe 5) | 25 mM | 25 mL |
2. NGM with 1 mM Auxin (NGM + IAA)
Prepare in the same way as NGM (see Recipe 1). After the autoclaving step, also include 1 mL of 1 M IAA (diluted in 100% ethanol).
| Reagent | Final concentration | Quantity or volume for 1 L |
|---|---|---|
| 1 M IAA (indole-3-acetic acid), diluted in 100% ethanol | 1 mM | 1 mL |
Critical: Always prepare the 1 M IAA solution fresh before adding it to the medium. IAA precipitates fast.
Critical: Protect IAA from light.
3. M9 buffer
| Reagent | Final concentration | Quantity or volume for 1 L |
| KH2PO4 | 22 mM | 3 g |
| Na2HPO4·2H2O | 42 mM | 7.48 g (6 g anhydrous) |
| NaCl | 85.5 mM | 5 g |
| Deionized H2O | n/a | to 1 L |
| Autoclave (20 min, 121 °C), cool until 55 °C, and add the following | ||
| 1 M MgSO4 solution | 1 mM | 1 mL |
4. Bleach solution
| Reagent | Final concentration | Volume for bleaching one 15 mL tube of hermaphrodites |
|---|---|---|
| Commercial thin bleach (<5% NaOCl) | <1.6% | 1.6 mL |
| 10 M NaOH | 251 mM | 125 μL |
| Deionized H2O | n/a | 3.26 mL |
| Total | n/a | 4.985 mL |
5. KPO4 buffer, pH 6
| Reagent | Final concentration | Quantity or volume for 1 L |
|---|---|---|
| KH2PO4 | 0.8 M | 108.3 g |
| K2HPO4 | 0.2 M | 35.6 g |
| Deionized H2O | n/a | to 1 L |
6. PCR reaction master mix
| Reagent | Final concentration | Volume for 50 μL reaction |
|---|---|---|
| 5× Q5 reaction buffer | 1× | 10 μL |
| 10 mM dNTPs | 200 μM | 1 μL |
| 10 μM forward primer | 0.5 μM | 2.5 μL |
| 10 μM reverse primer | 0.5 μM | 2.5 μL |
| Template DNA | 0.5–500 ng | variable |
| Q5 High-Fidelity DNA polymerase | 0.02 U/μL | 0.5 μL |
| 5× Q5 high GC enhancer | 1× | 10 μL |
| Nuclease-free water | to 50 μL |
Laboratory supplies
1. Tubes, 15 mL, uncoated (Sarstedt, catalog number: 62.554.502)
2. Worm pick, custom-made from 99.95% platinum wire (ø 0.3 mm, 1.55 g/m) attached to a glass Pasteur pipette
3. Pipette tips [Greiner, Sapphire, catalog number: 771352 (10 μL), 775352 (200 μL), or 777352 (100 μL)]
4. 5 mL serological pipettes (Sarstedt, catalog number: 86.1253.001)
5. 10 mL serological pipettes (Sarstedt, catalog number: 86.1254.001)
6. Petri dishes 60 × 15 mm (Corning, catalog number: BP53-06)
7. Culture dish, tissue culture treated, 60 mm for larvae synchronization (Cellstar®, catalog number: 628160)
8. 1.5 mL Eppendorf tubes (Eppendorf, catalog number: 0030108442)
9. Needles (for splaying worms) 26 gauge (other gauge needles work as well) (Terumo, catalog number: AN*2613R1)
10. Nitrile gloves (for gel clean-up and getting older embryos) (Avantor, catalog number: 112-2372)
11. Microscope slides (Avantor, catalog number: 631-1552)
12. Borosilicate glass coverslips, thickness No. 1 (Carl Roth, catalog number: H875.2)
13. Lead-free steam indicator tape (3MTM ComplyTM, model: 1322-12MM)
14. Thin wall glass capillaries (WPI, catalog number: TW100F-6)
15. Microloader 100 mm pipette tips 0.5–20 μL (Calibre Scientific, catalog number: 5242956003)
16. 20 μm Nylon net filters (Millipore, catalog number: NY2004700)
17. Plastic funnel (Corning, catalog number: 610P-30)
Equipment
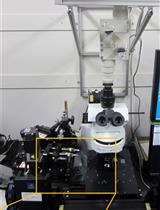
1. Spinning disk confocal microscope [Nikon, model: Nikon Eclipse Ti2-E (motorized) with perfect focus]
2. 100× oil immersion objective (Nikon, model: Nikon CFI Plan Apo λ 100×/1.45 0.13 mm WD OIL 71)
3. Detector (Teledyne Vision Solutions, model: 01-PRIME-BSI-R-M-16-C)
4. Eppendorf Centrifuge 5810 R (Eppendorf, catalog number: 5811000015)
5. Dissection stereomicroscope (Leica, catalog number: 10450814)
6. Pipettes (Eppendorf, catalog number: 2231001169)
7. RF3000 Pipette Controller (Heathrow Scientific HS3000, catalog number: Z767670)
8. Incubator (VDW Cool Systems, model: CI 625 W PRO PID)
9. Injection microscope (Zeiss, model: Axio Observer.A1)
10. Microinjector (Eppendorf, model: FemtoJet 4x)
11. Micromanipulator (Eppendorf, model: TransferMan 4r)
12. Needle puller (pre-made injection needles can also be used) (Sutter Instrument Co., catalog number: P-2000)
13. Thermo ScientificTM OwlTM EasyCastTM B1A Mini Gel Electrophoresis System (Thermo Scientific, catalog number: B1A-BP)
Software and datasets
1. ImageJ (NIH, https://imagej.net/ij/download.html) or "FIJI Is Just ImageJ" FIJI (NIH, http://fiji.sc/Fiji)
2. ComDet v.0.5.5. All data and code have been deposited to GitHub: https://github.com/ekatrukha/ComDet/tree/0.5.5 (access date, 05/13/2022) [23]
3. Imaris File Converter (Bitplane, Belfast, UK, v. 10.0.1, December 2022)
4. Imaris software (Bitplane, Belfast, UK, v. 10.0.1, December 2022), including Essentials and Tracking packages
5. Microsoft Excel (Microsoft, Redmon, WA, Office 365, December 2022)
Procedure
Notes:
1. Experiments are performed at 20 °C.
2. It is essential that both components of the SunTag system are simultaneously expressed in animals: 1) a SunTag antibody fragment (scFv) labeled with GFP (scFv::GFP) that binds GCN4 epitopes with high affinity, and 2) an mRNA encoding GCN4 repeats. Both components can be adjusted to meet experimental needs (see below). Section A describes scFv::GFP expression. Section B describes the use and design of the GCN4 containing mRNAs.
3. There are multiple strains available that express the SunTag components and can be used for translation imaging. See Figure 2 for a graphical representation of the strains and Biological Materials 8 for the genotypes. Below, we describe when currently available strains can be used and when creating customized strains is advantageous for studying translation (see Sections A and B).
4. Expression of scFv::GFP in the presence of an mRNA encoding GCN4 repeats gives rise to three distinct types of GFP signal in the cell (Figure 3A, C):
a. Translation sites, visible as bright GFP clusters. As multiple ribosomes simultaneously translate a single mRNA and each ribosome produces a nascent peptide chain that can be bound by multiple antibodies, this leads to the recruitment of numerous antibodies per translating mRNA ribosomes, resulting in a bright GFP spot.
b. Mature proteins, usually visible as weaker or moderate GFP signals. Since each fully synthesized GCN4-tagged protein carries only a single SunTag array, the signal is weaker than translation sites, but stronger than single, unbound scFv::GFP molecules. Usually, mature proteins only become detectable when proteins cluster at specific sites in the cell or when a high number of repeats is used.
c. Unbound scFv::GFP, visible as a diffuse GFP background, representing freely available scFv::GFP molecules not bound to SunTag peptides (Figure 3A, C) [24,25].
5. Background noise from mature GCN4-bound protein can be prevented by combining the SunTag imaging with the AID system [24–26] (Figure 3B, D; Section B; and General note 2d). This requires (1) the fusion of an AID degron tag to the GCN4 peptides, (2) expression of the TIR protein, and (3) auxin availability in the cell of interest.
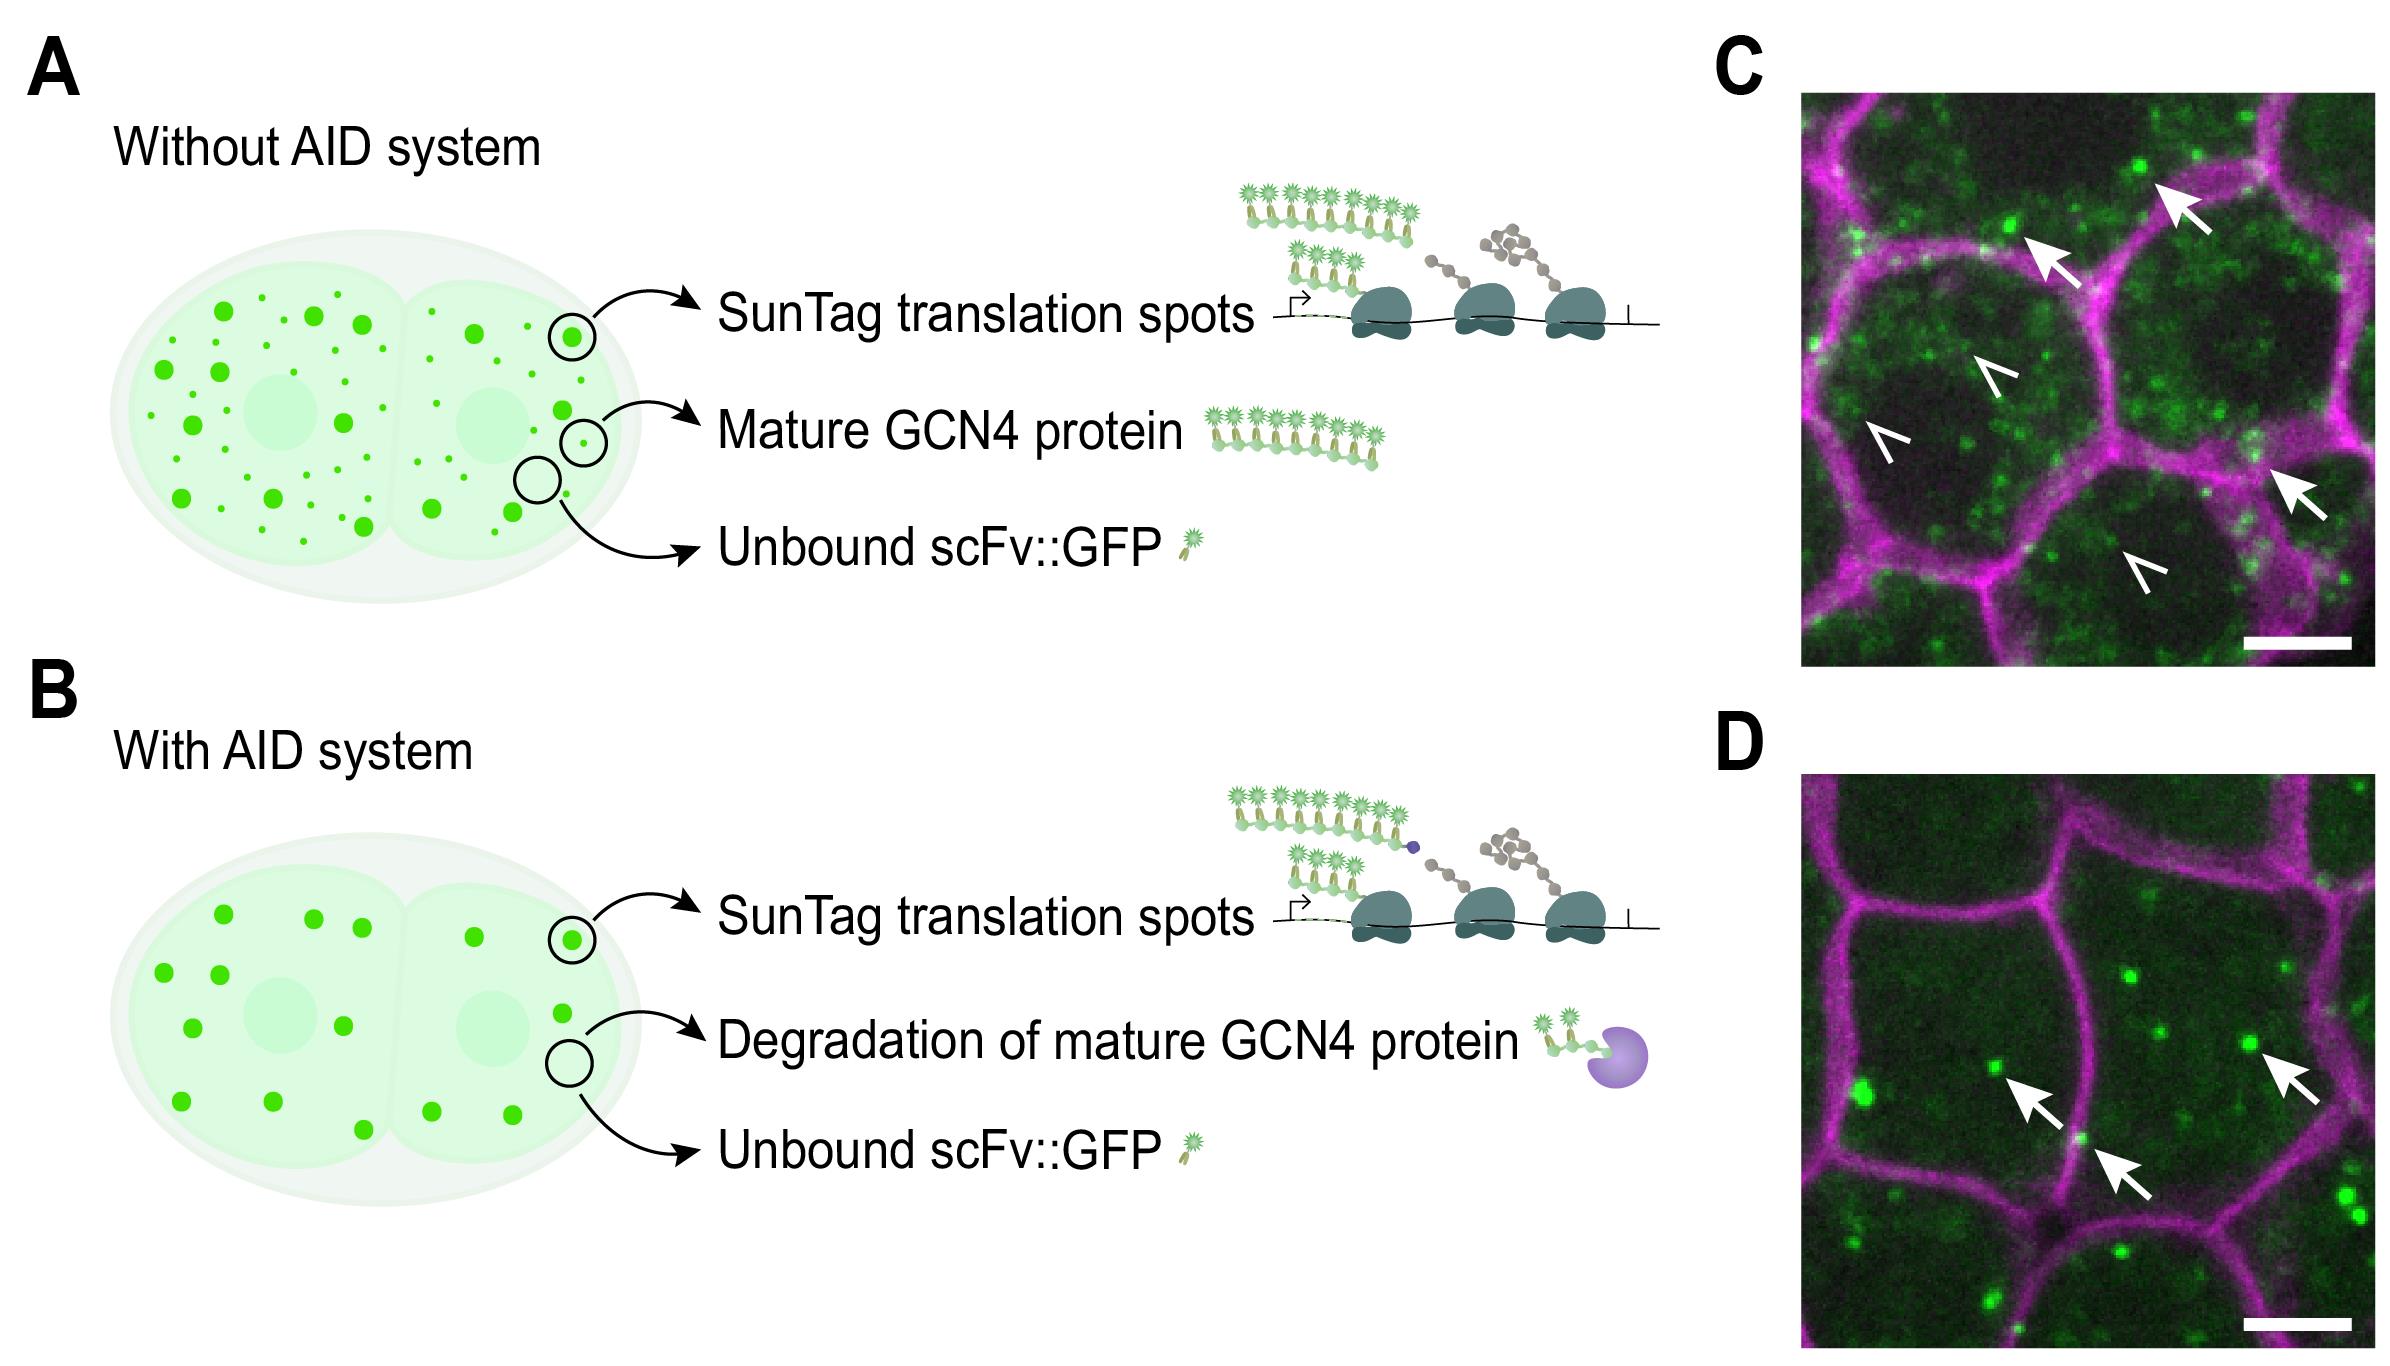
Figure 3. Three different types of scFv::GFP signal and the effect of using the AID system. Expression of scFv::GFP in the presence of an mRNA encoding GCN4 repeats gives rise to three types of GFP signal: (1) bright clusters at active translation sites, formed by multiple ribosomes translating multiple GCN4 repeats, thereby recruiting many scFv::GFP molecules; (2) weaker or moderate signals from mature GCN4-tagged proteins carrying a single SunTag array, typically visible when proteins cluster or when many repeats are used; and (3) diffuse background from unbound scFv::GFP. Combining the SunTag system with the AID system allows for degradation of the mature GCN4 proteins. (A) Schematic showing the three different types of signals. (B) Schematic depicting the GFP signal from translation spots and diffuse scFv::GFP. No GFP signal from mature protein is visible due to degradation by the AID system. (C, D) Representative image of an embryo expressing scFv::GFP and the translation reporter without AID (eft-3p::24xGCN4::T2A::BFP::h2b::tbb-2 3’UTR) (C) or with AID (eft-3p::24xGCN4::AID::T2A::BFP::h2b::tbb-2 3’UTR) (D). Arrows indicate translation sites; open triangles indicate mature protein. Scale bars: 2.5 μm.
A. Expressing the scFv::GFP antibody
For effective SunTag imaging, scFv::GFP expression levels need to be in balance with the amount of SunTag peptides. Optimal antibody levels depend on the expression and translation efficiency of the gene of interest: highly expressed or efficiently translated mRNAs require higher antibody levels than lowly expressed mRNAs (see General note 1 and Figure 4).
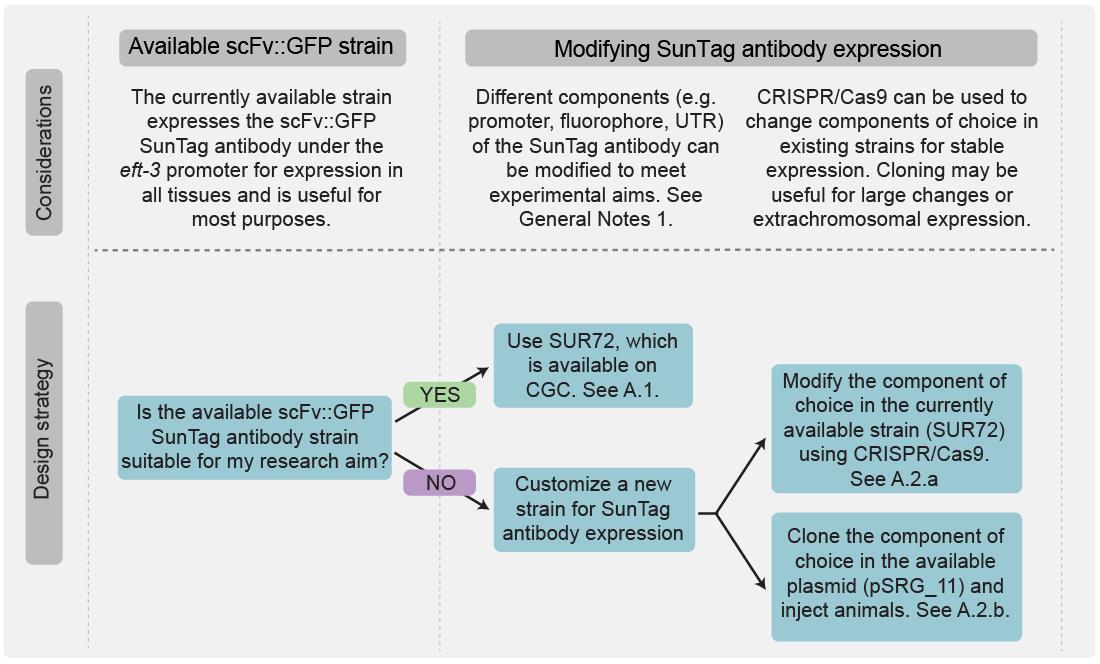
Figure 4. Flowchart outlining when to use existing strains expressing scFv::GFP or when to modify scFv::GFP expression. If the standard eft-3p::scFv::GFP::tbb-2 3′UTR construct is suitable for the research aim, available strains can be used directly. If not, different components can be replaced either via CRISPR/Cas9-mediated editing in existing strains or by cloning into plasmids for injection.
There are generally two options to express scFv::GFP:
1. Use an existing strain (SUR72, available on CGC). In this strain, the scFv::GFP is expressed under the ubiquitous eft-3 promoter in all cells. This strain is a good starting point for most translation imaging experiments.
2. Customize scFv::GFP expression. Modify the promoter, UTR, fluorophore, or subcellular localization to suit experimental requirements (see General note 1a, b, and Figure 4). Two strategies are possible:
a. Replace the promoter, UTR, or fluorophore in the existing strain using CRISPR/Cas-9-based strategies. A detailed step-by-step protocol describing how to perform CRISPR/Cas-9-based replacements has been published by the Mello lab [27] and is therefore not included here. Other fluorophores have not been tested in this system and may interfere with scFv function.
b. Clone a promoter, UTR, or fluorophore into plasmid pSRG_11 between cloning sites AgeI and MluI. Integrate into the genome at MosSite ttTi5605. Other fluorophores have not been tested in this system and may interfere with scFv function.
B. Expressing the mRNA encoding GCN4 repeats
The research question determines which strain and tagging strategy to use. For general studies of translation mechanisms, use existing strains (SUR10 and SUR54; see Figure 2 and Biological materials 8) that contain a general translation reporter (Figure 5A, B). To study the translation of a specific gene, tag the gene with GCN4 repeats. Consider the insertion site of the repeats, the number of repeats, and whether to include additional elements such as T2A or AID-tag (see Figure 5C–E, Figure 6, and General note 2).
1. For translation imaging of the translation reporter (Figure 5A, B), two options are possible (Figure 6):
a. Use existing reporter strain (SUR10 without the AID system, or SUR54 with the AID system). These strains can be used to visualize translation in all somatic tissues. Germline silencing of the reporter construct precludes translation studies in early embryos prior to the 20–40 cell stage.
b. Adapt the reporter to the specific research questions. Modify regulatory sequences within the reporter, such as replacing the 5′ UTR or 3′ UTR, or insert RNA-binding protein sequences or miRNA binding sites to test their effect on translation. Two strategies can be used:
i. Modify the existing reporter sequence in the current strains using a CRISPR/Cas9-based genome editing approach. A detailed step-by-step protocol describing how to perform CRISPR/Cas-9-based replacements has been published by the Mello lab and is therefore not included here [27].
ii. Clone regulatory sequences into plasmid pSRG_12 (Addgene #245120, sequence in Table S2) and integrate the plasmid into the genome using CRISPR/Cas-9 or related strategies [27,28]
Note: Integrating a new reporter may be more challenging because of gene length and the repetitive nature of the GCN4 sequence.
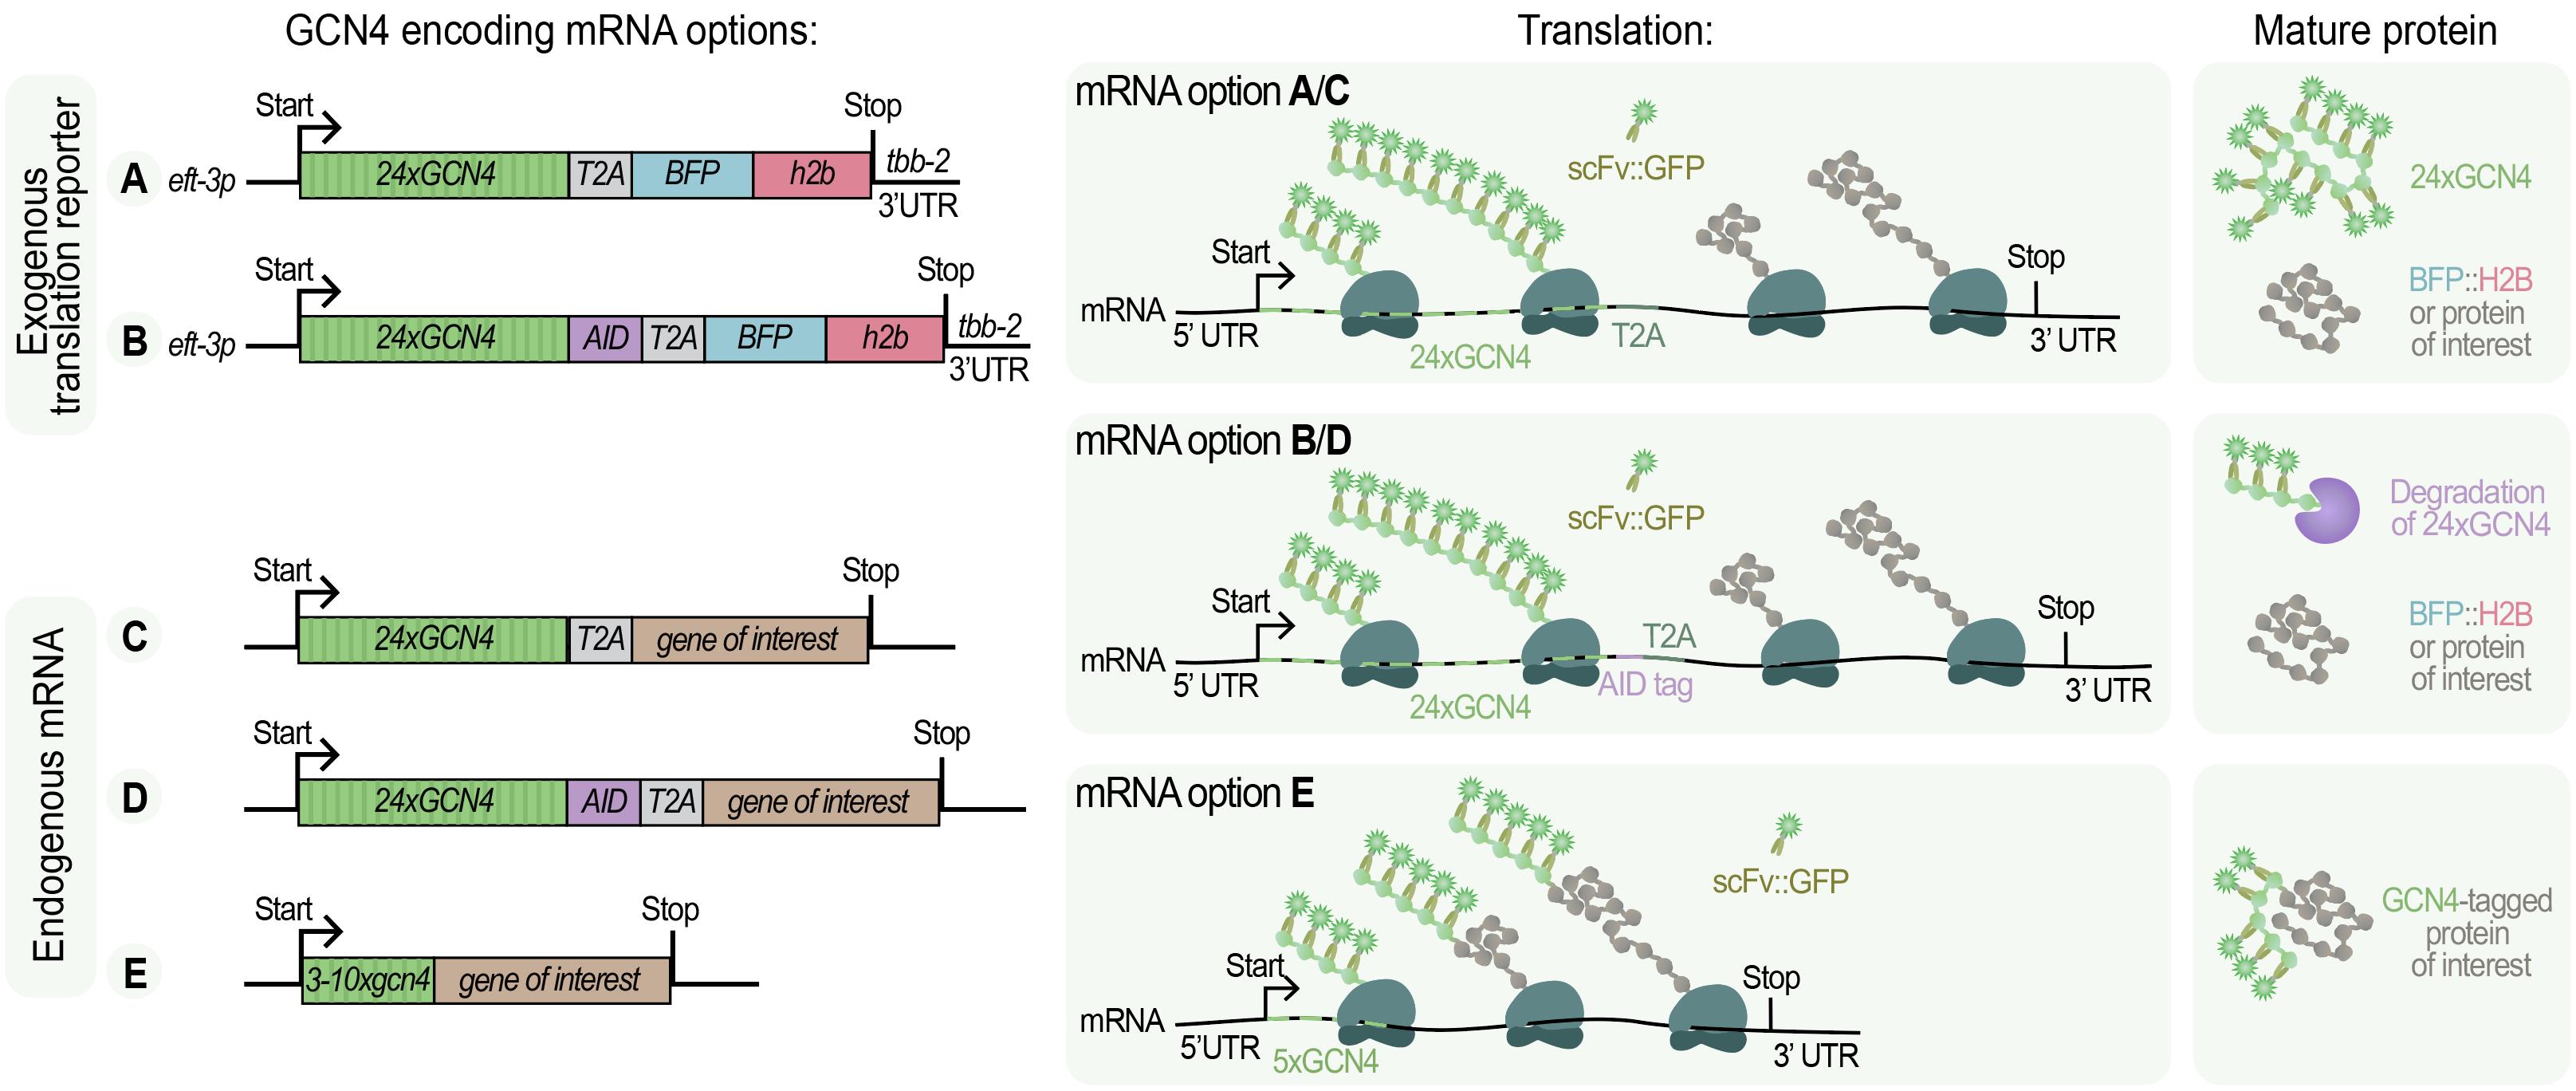
Figure 5. Design options for SunTag-based translation in C. elegans. The left panels show a schematic overview of constructs and tagged genes, the middle panels are a graphical illustration of how translation results in scFv::GFP recruitment, and the right panels indicate the resulting mature proteins. (mRNAs A–B) Exogenous translation reporters contain 24xGCN4 repeats, a T2A site, and BFP::H2B, with or without an AID tag, enabling visualization of translation from an artificial reporter transcript. (mRNAs C–E) Endogenous mRNA tagging strategies involve the insertion of GCN4 repeats into the gene of interest. These can be combined with T2A (C), AID (D), or used without additional elements (E). In each case, scFv::GFP binds to nascent SunTag peptides, producing a bright fluorescent spot at the site of translation. The tagging strategy determines which specific mature proteins are produced.
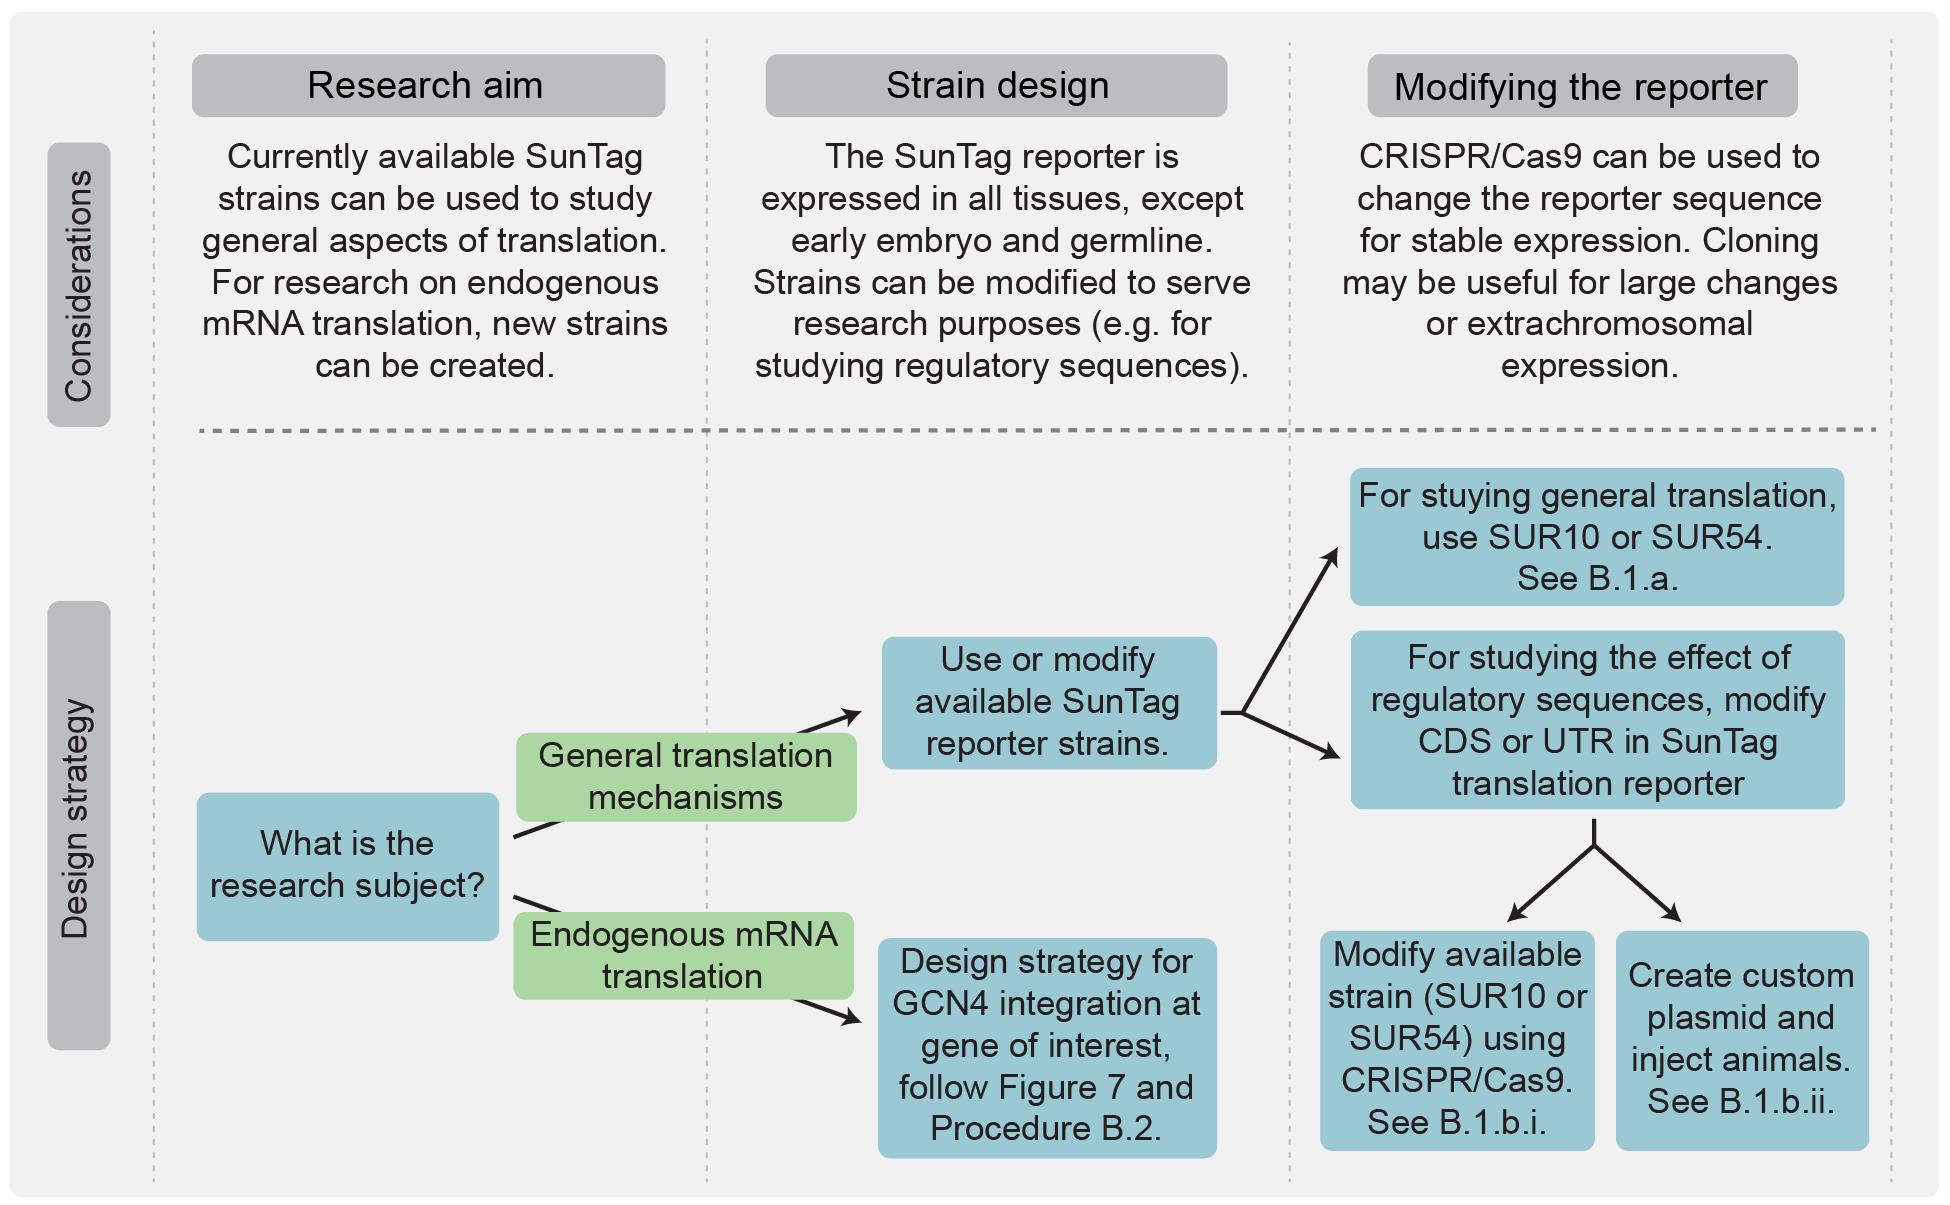
Figure 6. Flowchart for selecting between available SunTag reporter strains and tagging endogenous genes. For studying general aspects of translation, strains SUR10 and SUR54 can be directly used or modified using CRISPR/Cas9 (e.g., altering regulatory sequences). For investigating the translation of a specific endogenous mRNA, GCN4 repeats must be integrated into the gene of interest. See also Figure 7 for design strategies for endogenous genes.
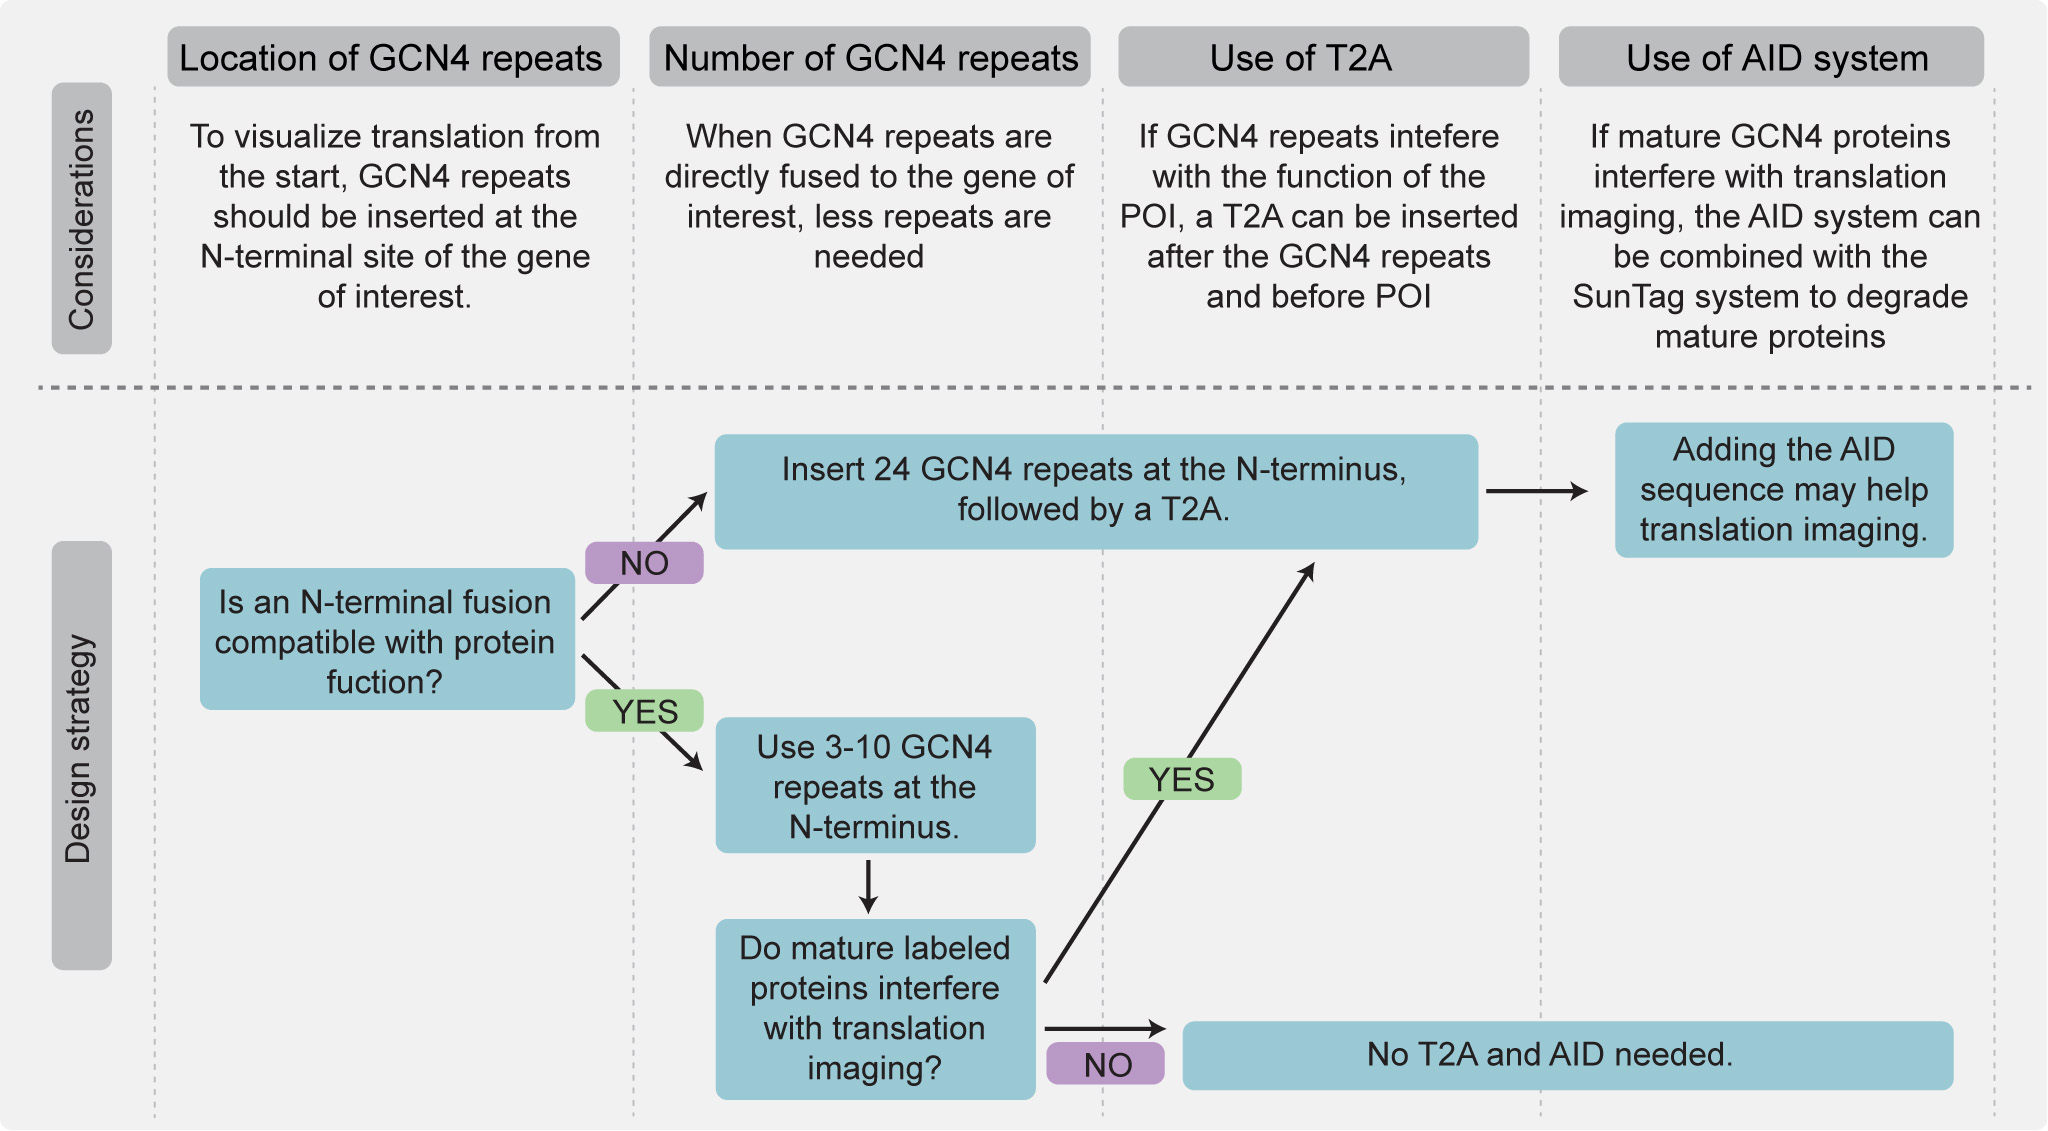
Figure 7. Flowchart outlining strategies for tagging a gene of interest with GCN4 repeats. General guidelines are shown for selecting the insertion site, number of repeats, and potential use of T2A and AID sequences. See Procedure B.2. If an N-terminal fusion is not compatible with protein function, 24 GCN4 repeats should be inserted at the N-terminus, followed by a T2A sequence. An additional AID degron may improve imaging quality by increasing the signal-to-noise ratio. If an N-terminal fusion is compatible, 3–10 GCN4 repeats can be inserted directly at the N-terminus without T2A or AID.
2. For translation imaging of endogenous genes, tag the gene of interest with GCN4 repeats (see Figure 5C–E and Figure 7).
a. Select the insertion site, repeat number, and whether to include additional elements such as T2A or AID. The optimal strategy depends on protein localization, abundance, and compatibility with N-terminal tagging (Figure 7) as well as the length and translation efficiency of the mRNA (Figure 8).
Notes:
1. Integration of 24xGCN4 arrays is challenging and often leads to germline silencing. Shorter arrays (3–10xGCN4) integrate more efficiently and reduce silencing risk.
2. Standard CRISPR/Cas9 genome editing protocols can be followed [27]. Because GCN4 arrays are repetitive, amplification and integration may be difficult. A detailed step-by-step approach is described below.
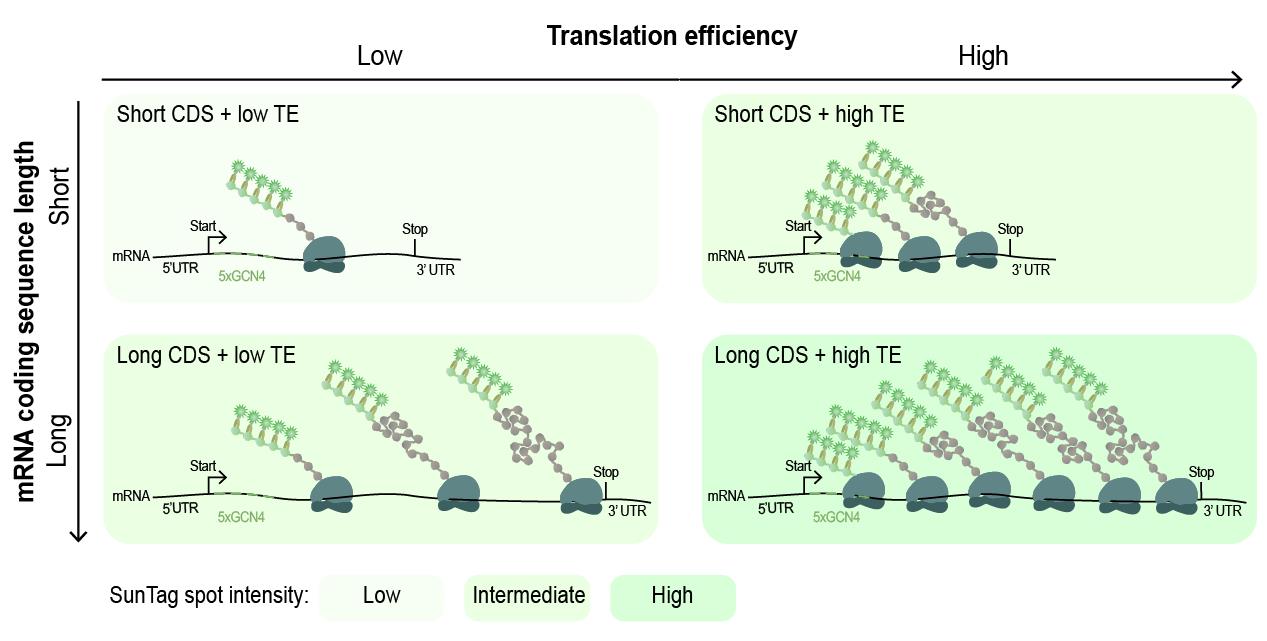
Figure 8. Relationship between mRNA length, translation efficiency, and SunTag spot intensity. Schematic illustration of how coding sequence (CDS) length and translation efficiency (TE) together determine the intensity of SunTag translation spots. Short CDSs with low TE generate dim spots, while short CDSs with high TE result in intermediately bright spots due to increased ribosome density. Long CDSs with low TE produce intermediately bright spot intensities as multiple ribosomes can still occupy the transcript despite low initiation rates. Long CDSs with high TE yield the brightest spots, reflecting both high ribosome density and extended CDS length.
b. Generate PCR fragments for genomic integration of GCN4 repeats. Use these fragments as the repair template for CRISPR/Cas9.
i. Select the appropriate template:
1) For 24xGCN4::T2A, use plasmid pSRG_12 (Addgene #245120) or plasmid pSRG101 (Addgene #246458). For 3xGCN4, use plasmid pSRG_100 (Addgene #246457). If PCR amplification of the GCN4 repeats is difficult, clone the GCN4 repeats into a vector with the desired homology arms to enable primer binding outside the repeats. Alternatively, use G-blocks containing homology arms and GCN4 repeats (see Biological materials 9 for plasmid ID).
2) For 24xGCN4::AID::T2A, no plasmid template is available. Use worm lysate from strain SUR54. Alternatively, first integrate 24xGCN4::T2A, then insert the AID degron (see Biological materials 9 for template plasmid ID).
ii. Design PCR primers to amplify the desired number of GCN4 repeats from the selected template as described in [27] (Figure 9). Ensure high specificity in primer design to minimize nonspecific binding to repeat sequences and use primers with an overhang of ~30 bp for homologous recombination for CRISPR/Cas9 approaches [27].
iii. PCR amplify the GCN4 repeats from a template plasmid using the Q5® High-Fidelity PCR Kit and 5′ Spacer 9 modified oligos (see Recipe 6 and [27]).
Note: Different polymerases may be used. The addition of a GC enhancer can improve PCR yield. Using 5′ Spacer 9 modified oligos may improve homologous recombination in CRISPR/Cas9 methods.
iv. Purify PCR fragments using gel electrophoresis.
Note: A possible problem may be multiple bands being observed due to the binding of the primer to multiple GCN4 repeats.
Solutions: 1) Use primers that bind outside of GCN4 sequences, and 2) run the gels longer to separate fragments of interest for purification (see Figure 9).
v. Purify the desired fragments using a gel-purification kit.
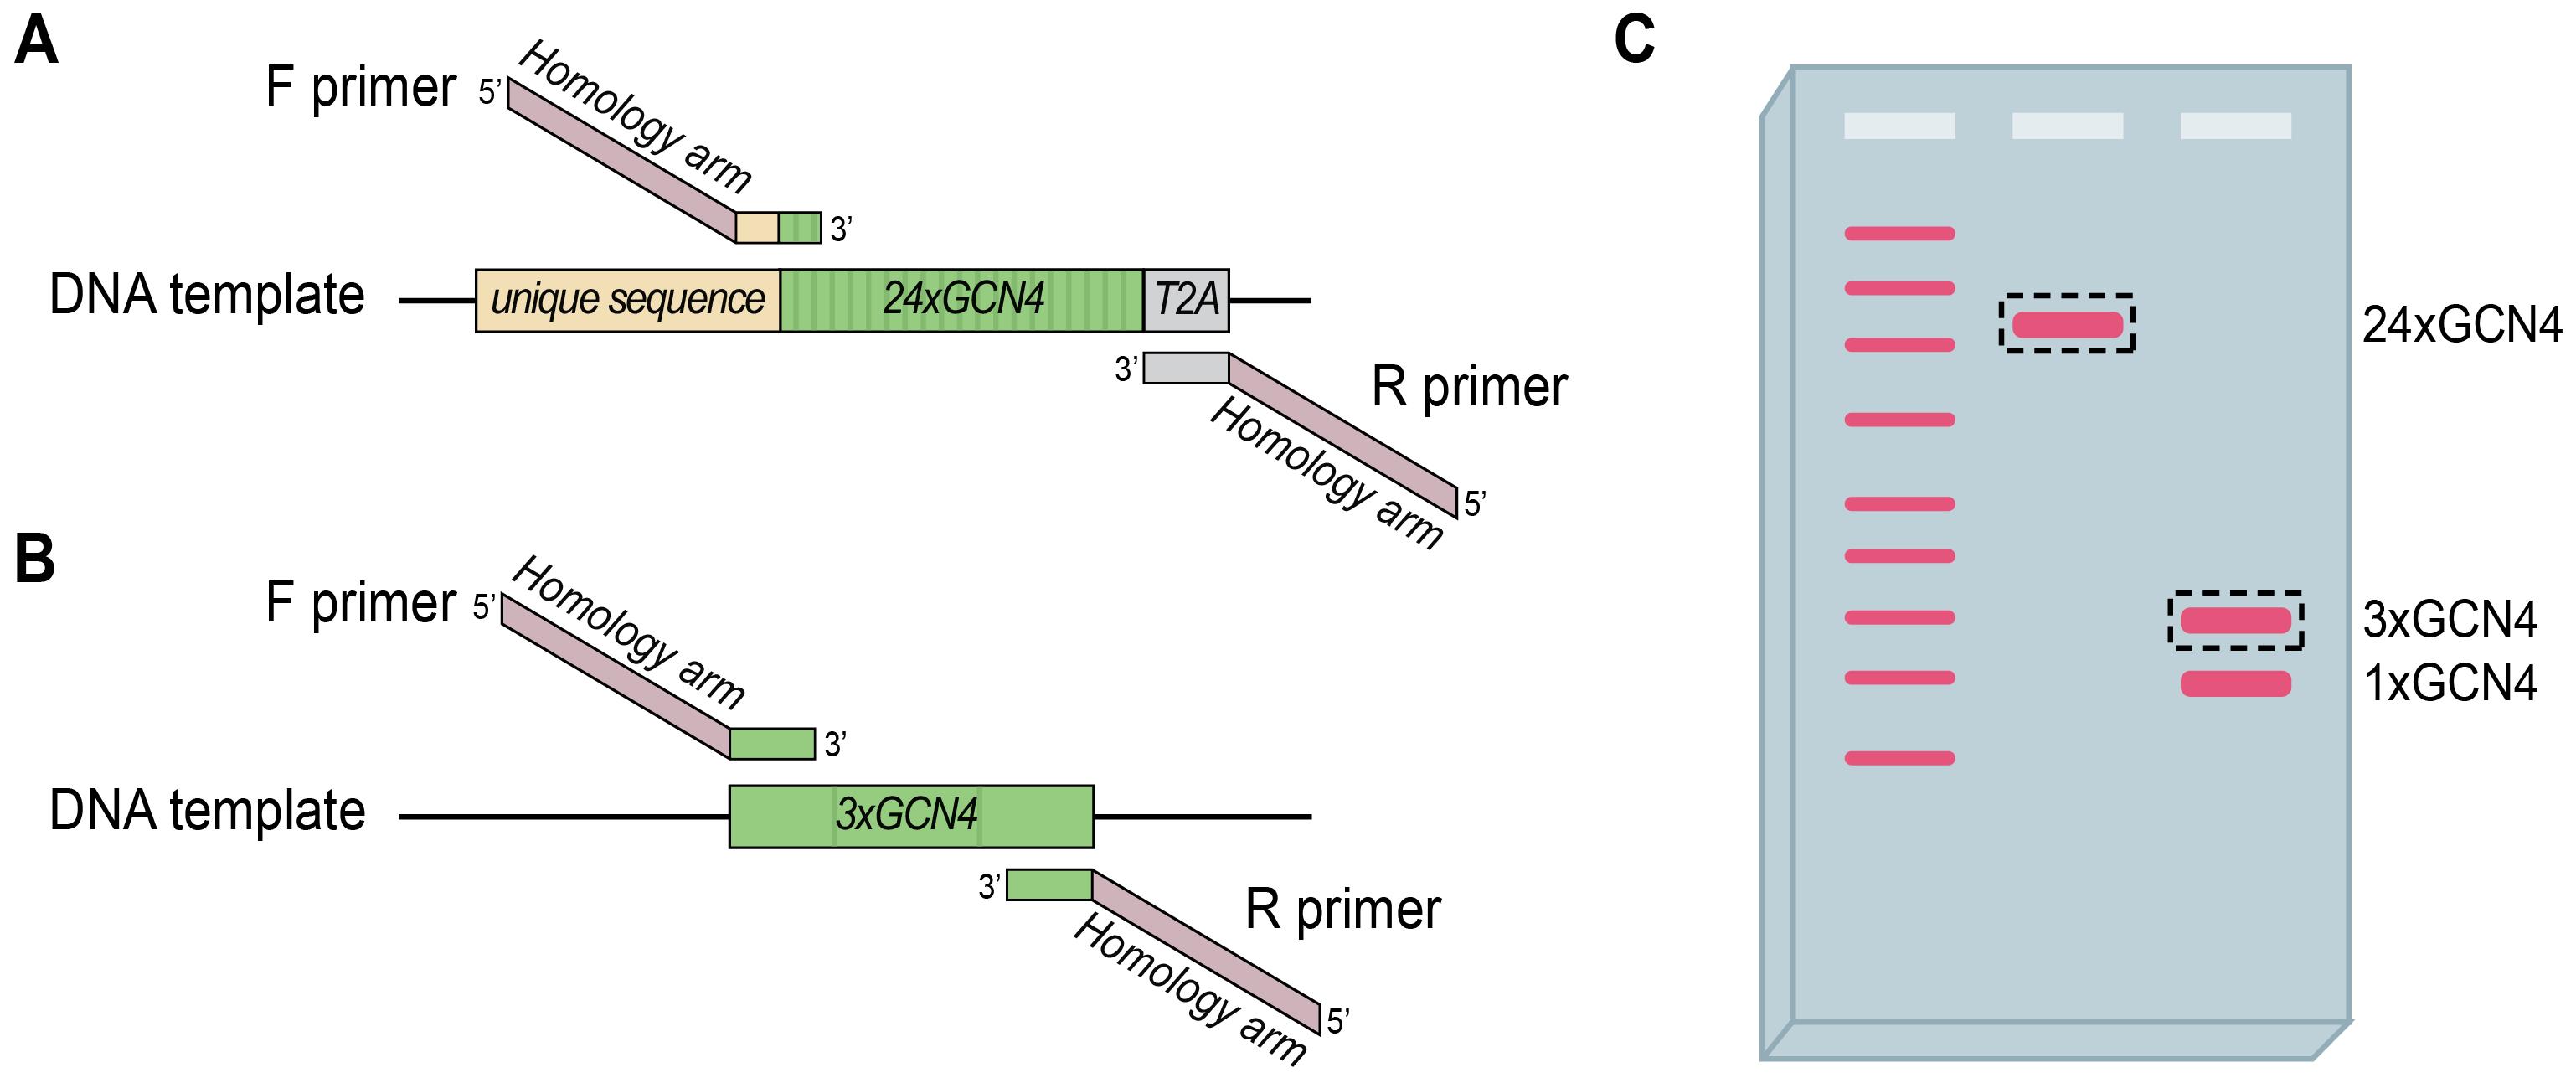
Figure 9. Amplification and purification of GCN4 repeats. (A–B) Schematic of PCR amplification of 24xGCN4 with a T2A sequence (A) or shorter 3xGCN4 fragments (B) using primers with homology arms. (C) Example gel showing separation of a ladder (left bands) and PCR products from design strategies in A (middle band) and B (right bands). Using primers against unique sequences usually results in one desired GCN4 band. Using primers against GCN4 sequences may bind multiple GCN4 bands, but size separation allows for excision of the right fragment for purification. Dotted rectangles indicate fragments for purification.
c. Integrate GCN4 repeats using a CRISPR/Cas9-based genome editing approach [27].
d. Genotype worms, select positive worms, and select progeny that is homozygous for the GCN4 integration.
Note: Due to the repetitive nature of the GCN4 array, recombination may occur, resulting in fewer GCN4 repeats. Carefully analyze the sequence and follow up on multiple strains.
C. Preparing samples for imaging of translation
C1. Preparing embryos for imaging of translation (see Figure 10)
1. Grow animals on NGM (see Recipe 1) agar plates seeded with OP50 E. coli according to standard culture conditions [29]. For auxin-induced degradation (AID) experiments [24], culture animals expressing the AID-degron and the TIR1 protein for ~20 h on NGM agar plates provided with 1 mM auxin (see Recipe 2) and seeded with OP50 E. coli.
Note: Auxin does not penetrate the egg shell, but is transferred to eggs maternally. Different AID strategies using egg shell–permeable auxin may improve imaging of late-stage embryos [30].
2. Prepare imaging slides by placing a drop of molten (freshly made) 5% agarose on the slide between two spacer slides lined with tape to increase thickness. Flatten the drop by pushing down another microscopy slide perpendicularly (covering the agarose drop and spacer slides) and let the agarose solidify to form a thin agarose pad (Figure 10A).
3. Place the embryos on a coverslip.
a. For early embryos: Add 4 μL of M9 (see Recipe 3) on a coverslip, pick hermaphrodites using a worm pick, and transfer to the solution. Splay hermaphrodite worms open using a 26 G needle.
Note: Needles of 22–27 G have also been used and work well. Other sizes can be used as well if sharp and thin enough (Figure 10B).
b. For late embryos: Pipette ~1 mL of M9 to a plate containing many eggs to wash off larvae and adults. Remove all M9-containing larvae and adults. Add ~1 mL of M9 to the plates, scrub off embryos with a gloved finger, and collect in a 15 mL conical tube. Wash eggs using ~10 mL of M9. Spin down at 2,000× g for 1 min to pellet embryos while keeping most bacteria in suspension. Remove most of the M9 using a 10 mL pipette and the last ~900 μL using a 1 mL pipette by pipetting slowly to prevent movement of the eggs. There should be ~50–100 μL of M9 containing eggs remaining in the tube. Resuspend eggs by pipetting up and down and transfer 4 μL of M9 and eggs to a coverslip (Figure 10C).
Note: The desired final volume of M9 containing eggs in the Eppendorf tube depends on the number of eggs that are present in the solution. Remove more M9 using a 200 μL pipette if the concentration of eggs is too low, or add M9 if the concentration is too high.
4. Place the coverslip on top of the agarose-padded microscopy slide.
Note: To facilitate finding eggs (of the desired developmental stage) under the spinning disk microscope, use a waterproof marker to mark embryos by placing an ink dot next to the embryo while looking under a stereomicroscope.
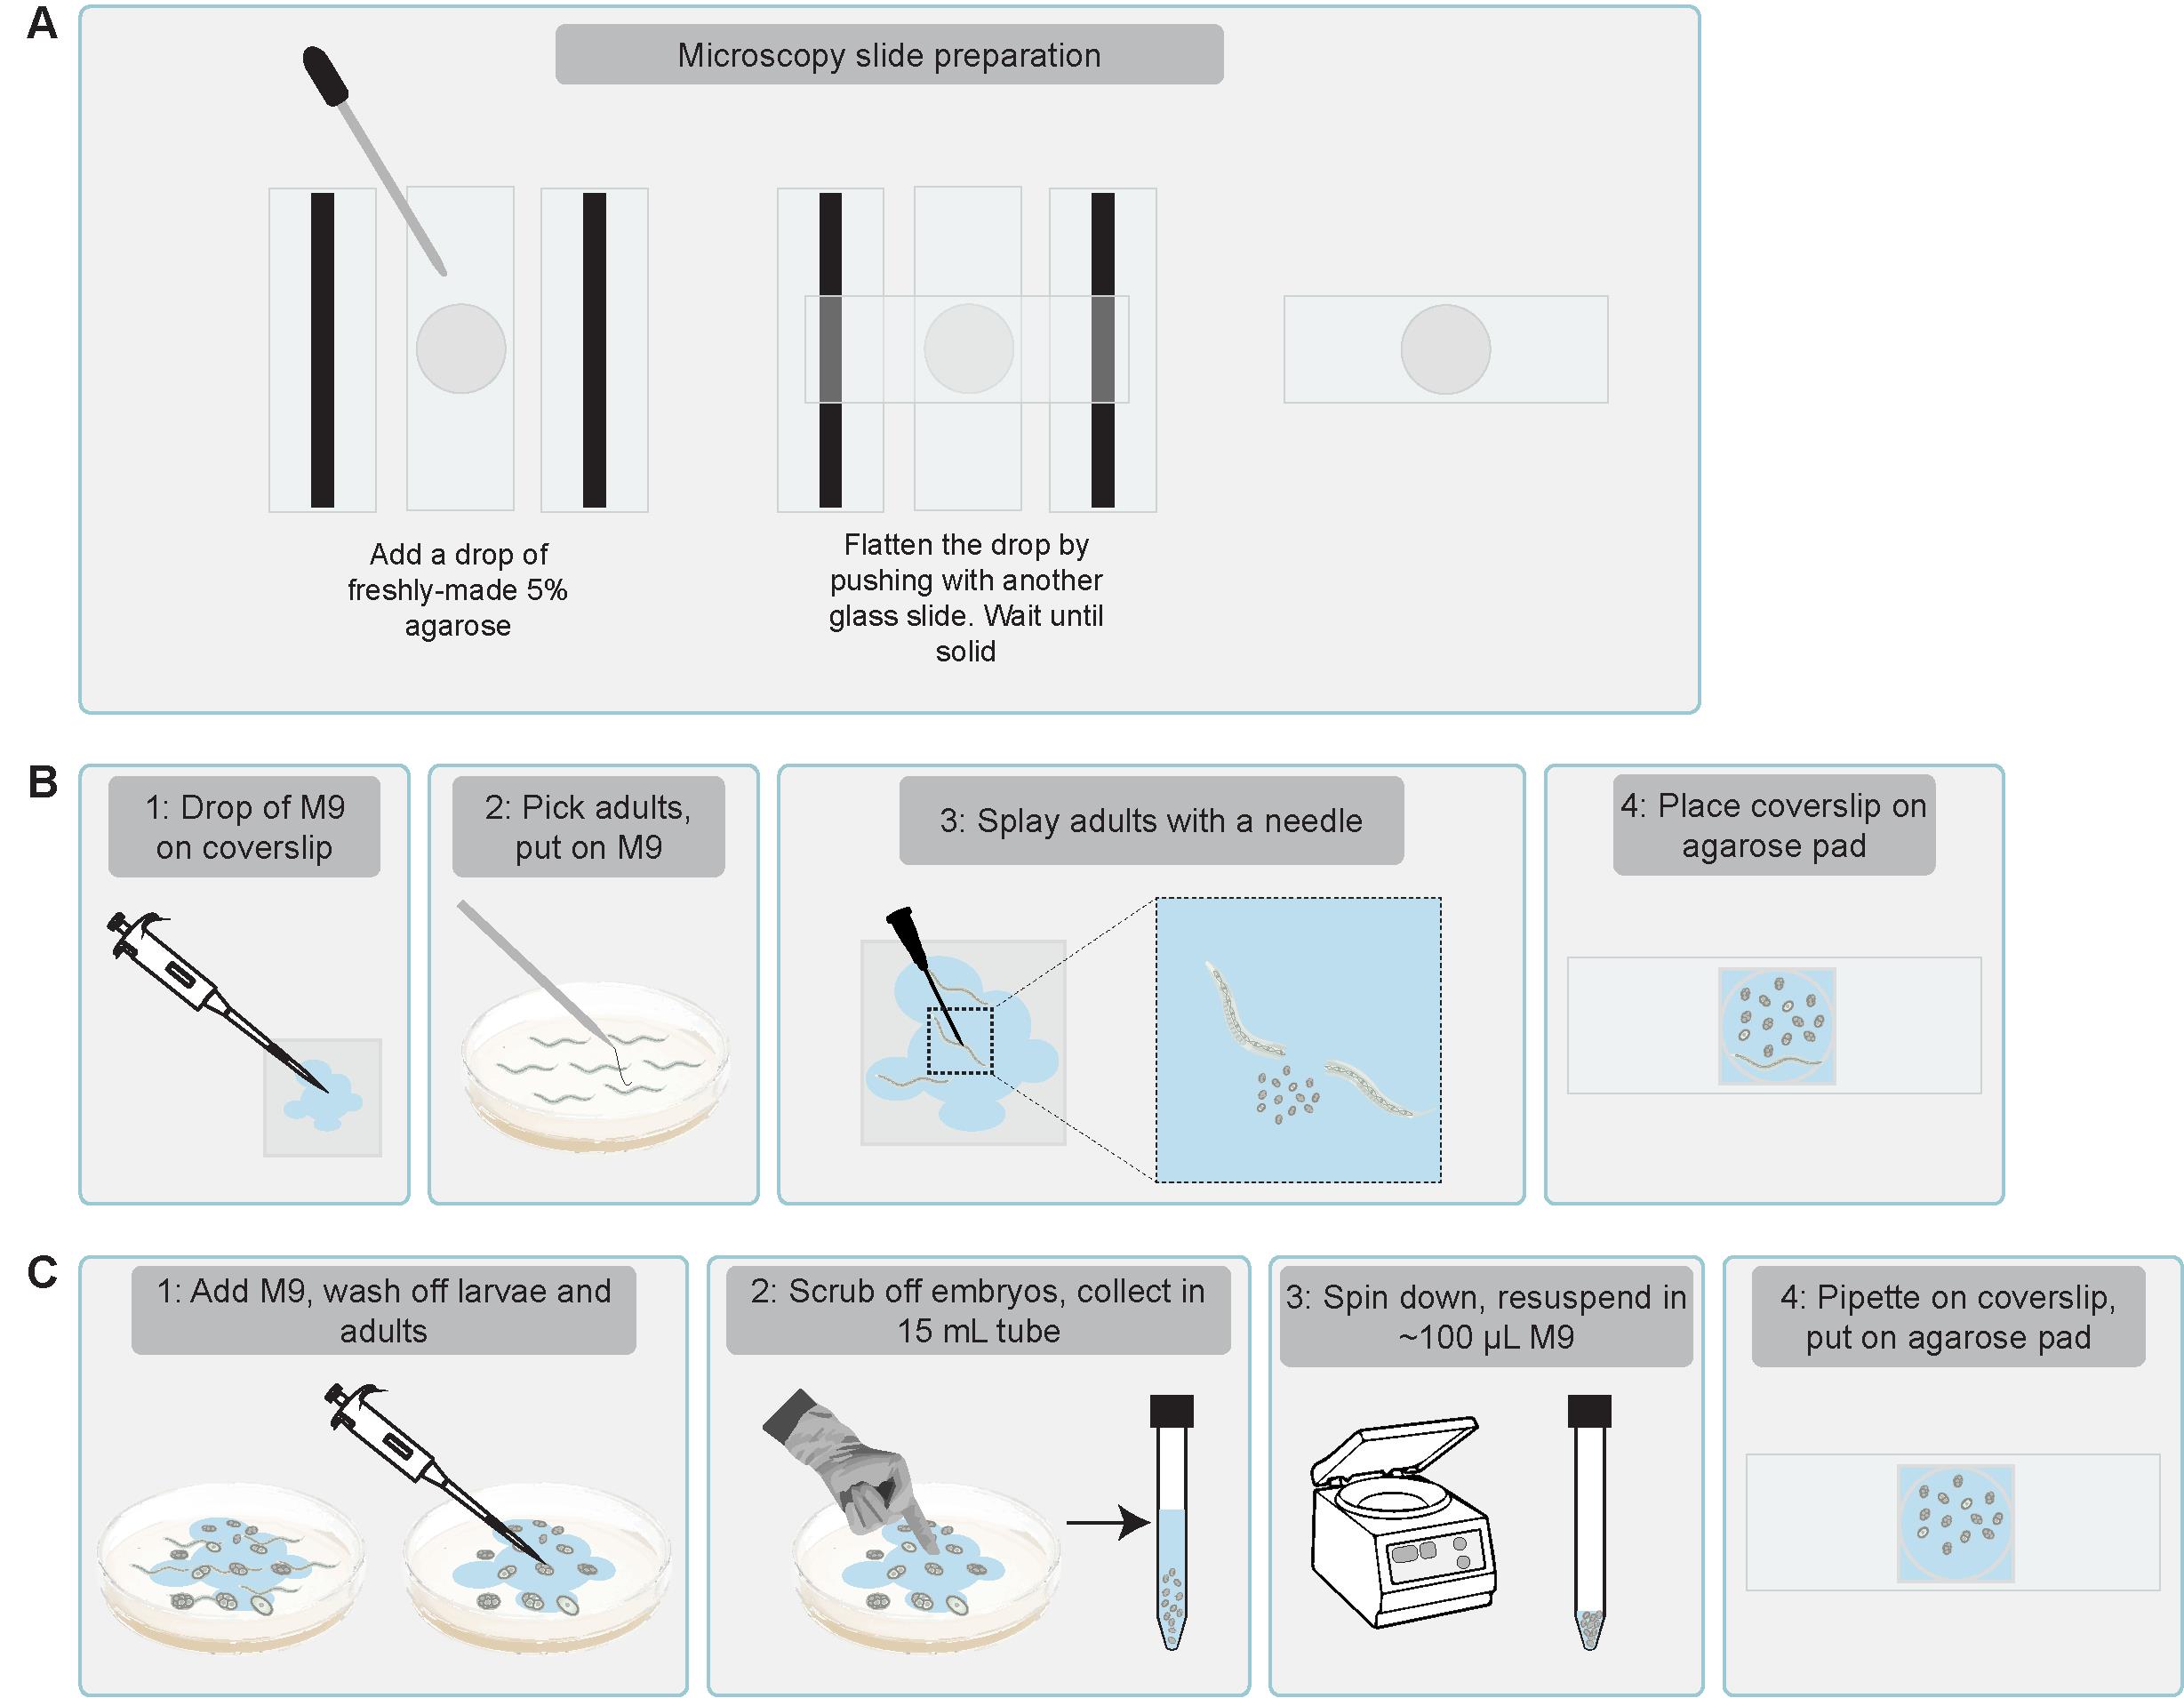
Figure 10. Schematic illustration of how to prepare embryos for translation imaging. (A) Preparation of imaging slides. (B) Dissect gravid adults in a drop of M9 and place an agarose pad on top to image early embryos. (C) Collect embryos directly from the plate using a gloved hand and transfer onto the coverslip with a pipette to image late embryos.
C2. Preparing larvae for imaging of translation (see also Figure 11)
Note: Step 1 may be skipped if larvae do not require synchronization. Step 2 may be skipped if the AID system is not used (see General note 2d).
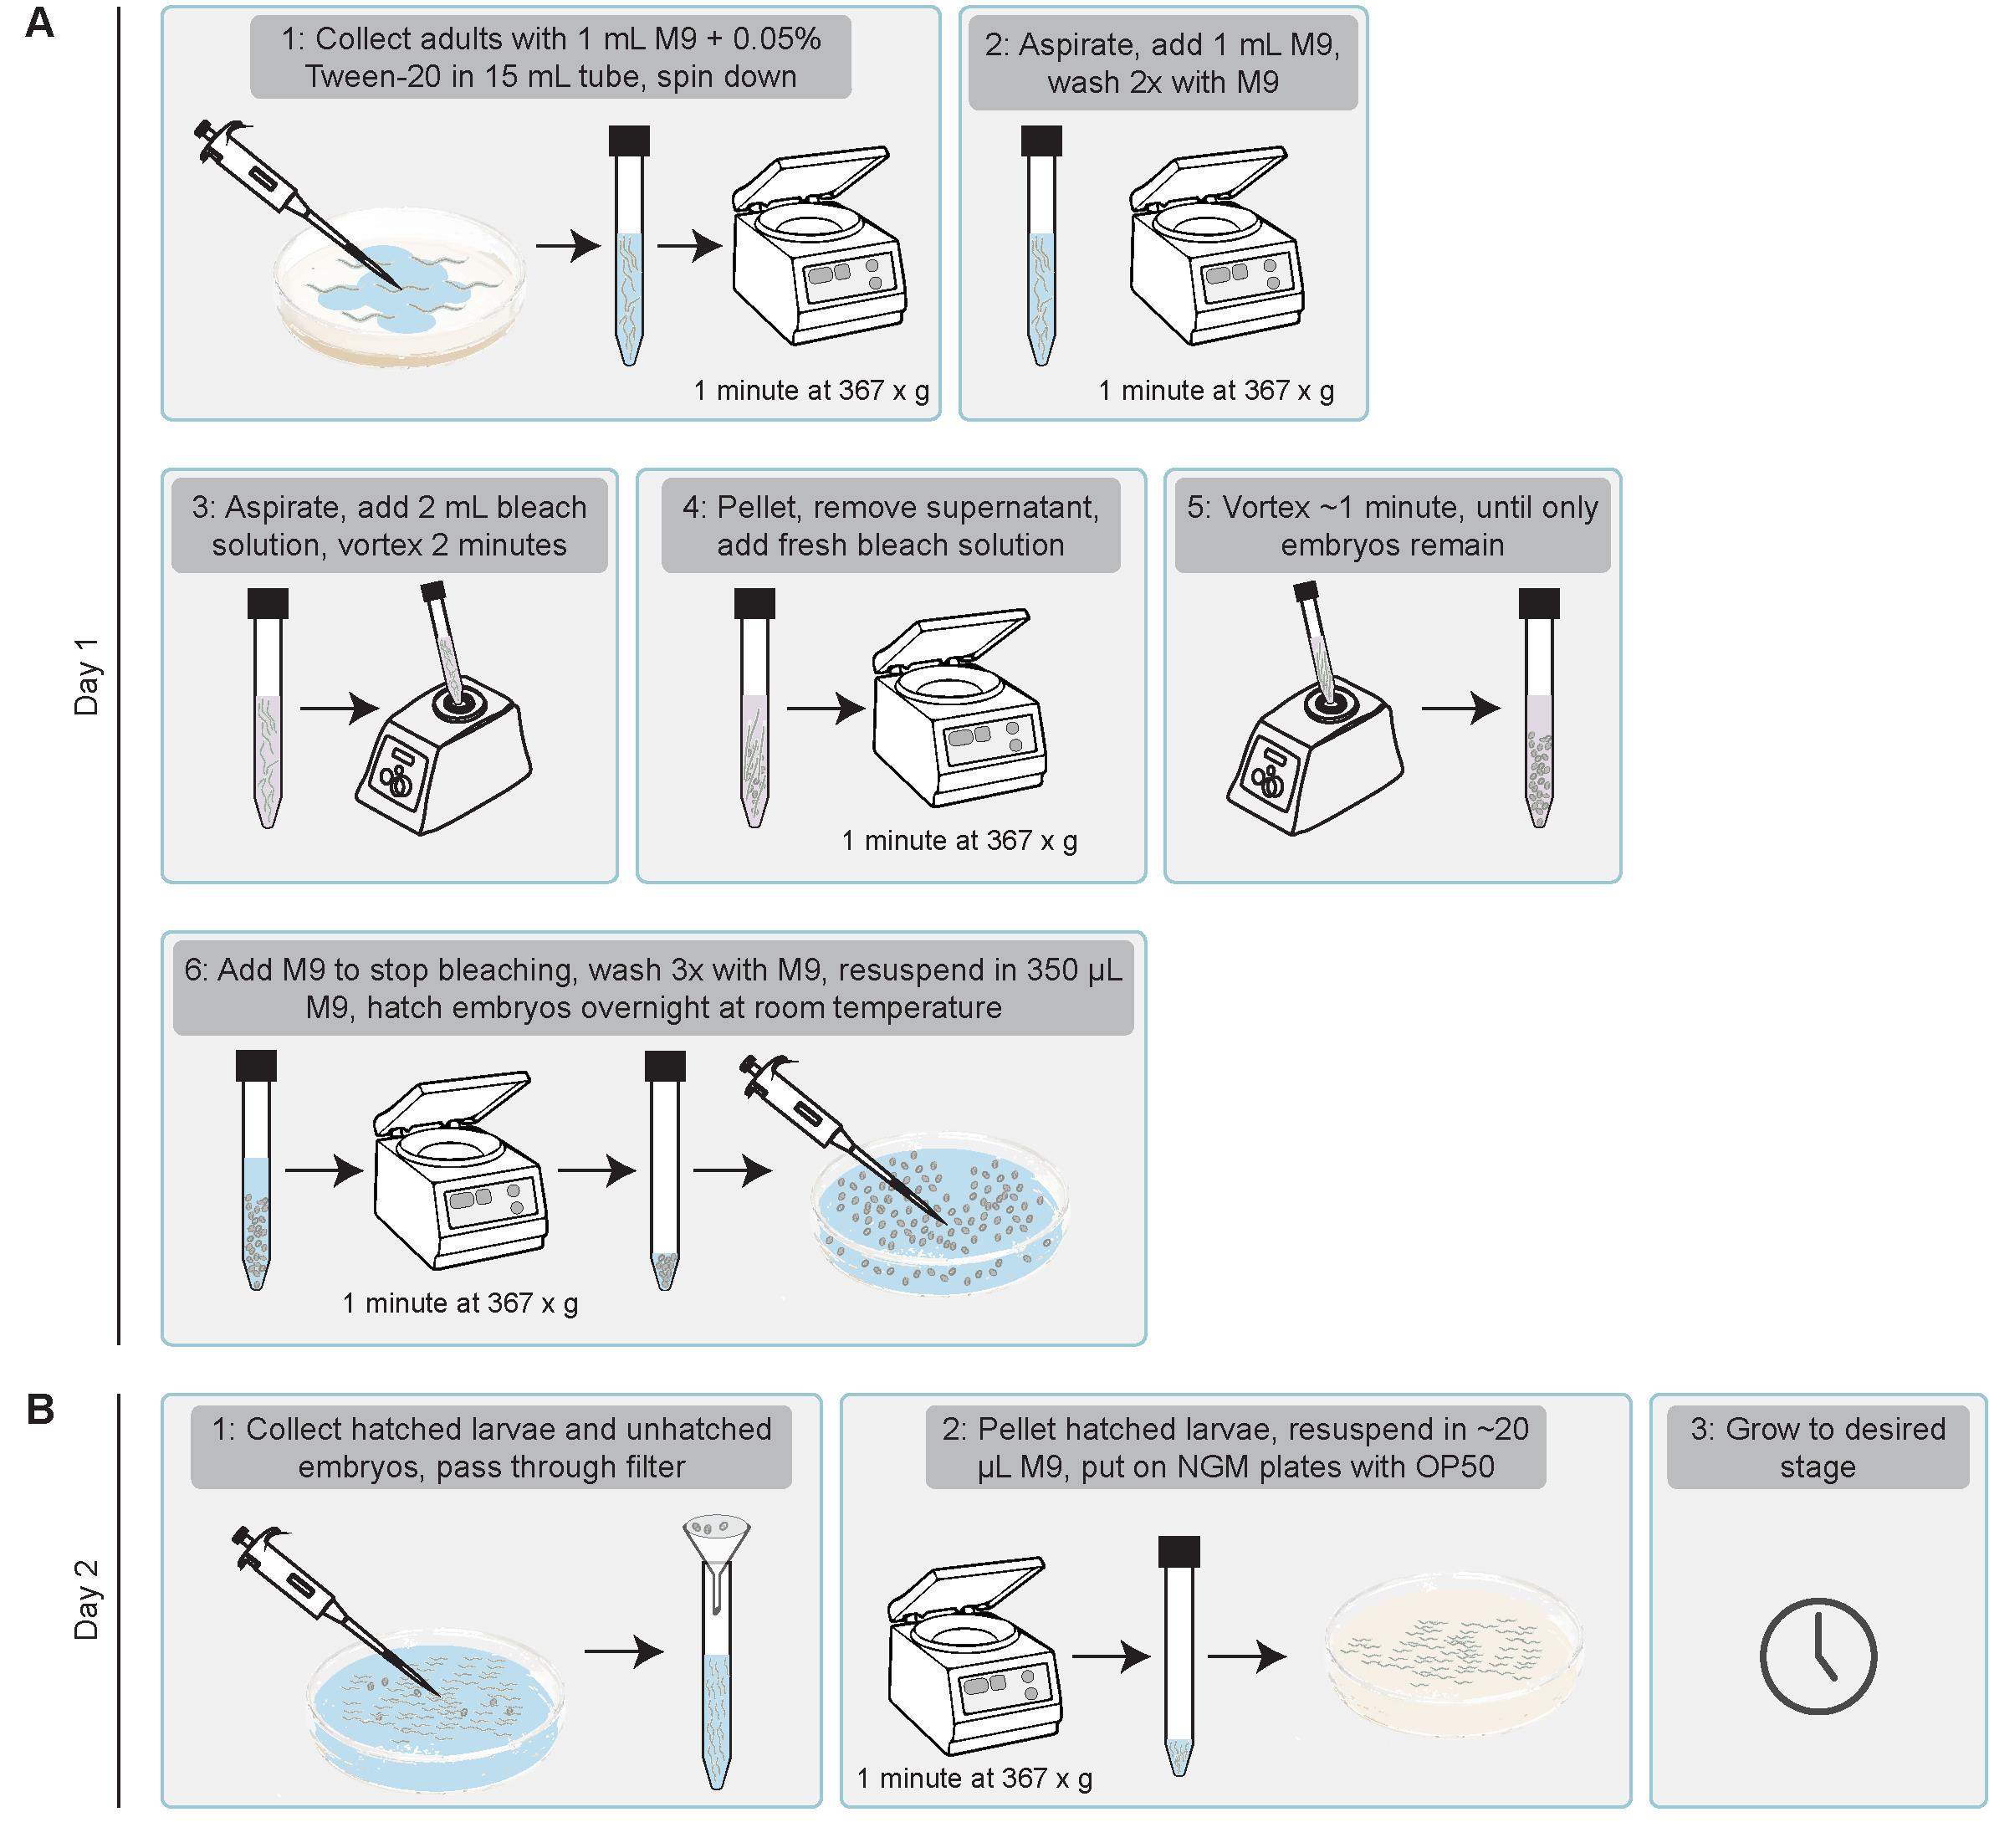
Figure 11. Schematic illustration of how to stage larvae for translation imaging. (A) On day 1, bleach gravid adults and allow embryos to hatch overnight in the absence of food. (B) On day 2, collect synchronized L1 larvae and transfer them onto food. Grow the animals until the appropriate larval stage for imaging.
1. Synchronization of C. elegans larvae by bleaching [31,32]: Bleaching gravid adults allows for the isolation of embryos by selectively degrading the adult worms. When these embryos are incubated overnight in M9 buffer without food, the hatched larvae arrest at the L1 stage, resulting in a synchronized population (Figure 11A).
a. To obtain high numbers of synchronized larvae, use 6–8 NGM plates with a high density of gravid hermaphrodites.
b. Add 1 mL of M9 + 0.05% Tween-20 onto each plate, pipette up and down to aspirate as many animals as possible, and transfer the suspension to a 15 mL conical tube.
Note: Adding Tween-20 prevents worms from sticking to the plastic pipette tips.
c. Centrifuge the worms at 367× g for 1 min, aspirate the supernatant, and add 1 mL of M9 buffer (without Tween-20). Centrifuge again and repeat the wash once more.
Note: All following centrifugation steps are performed at 367× g for 1 min.
d. Prepare fresh bleach solution (see Recipe 4).
Critical: Always prepare a fresh bleach solution, as bleach becomes less potent over time.
e. Bleach the animals by adding 2 mL of bleach solution to the worm pellet. Vortex for a maximum of 2 min. Monitor animals under the stereomicroscope. After 2 min of bleaching, the gravid hermaphrodites should appear straightened and immobile and start to degrade, with embryos being released in the solution. Centrifuge the tube, aspirate the bleach solution, and add 2 mL of bleach solution for a second round of bleaching. Vortex for up to 1 min or until only embryos remain and no adult worms are visible. Stop the bleaching process by adding 8 mL of M9 buffer, centrifuge, and aspirate the supernatant.
Note: If a considerable number of undegraded adults is still visible, you can perform a quick third round of bleaching before stopping the process. A third round of bleaching should only take 45 s to 1 min to avoid negative effects on embryo viability. Prolonged bleach exposure reduces hatching efficiency. See also [32] for a detailed protocol.
f. Wash embryos 3 times by adding 1 mL of M9 buffer, centrifuge, and aspirate the supernatant.
g. After the last wash, aspirate the supernatant and resuspend the embryos in 350 μL of M9 buffer. Transfer embryos to a cell culture dish (60 × 15 mm) and add 2 mL of M9 buffer to fully cover the surface. Leave at room temperature for at least 16 h (overnight) to allow embryos to hatch and arrest at the L1 stage.
h. Remove unhatched embryos from the population to start with a fully synchronized population. Embryos can be removed by passing the suspension through a 20 μm Nylon net filter into a 15 mL tube. Centrifuge and aspirate the supernatant. Resuspend the L1 larvae in 20 μL of M9 buffer and pipette them dropwise on the bacterial lawn of an NGM plate seeded with OP50. Grow until worms reach the appropriate developmental stage (Figure 11B).
2. Preparation of larvae for live imaging of translation using auxin-induced degradation: If your experiments include auxin-induced degradation (AID) [24], transfer synchronized or unsynchronized larvae to NGM plates containing 1 mM IAA and seeded with OP50 E. coli, approximately 5 h prior to imaging. If imaging larvae younger than 5 h, place them directly on IAA after hatching (step C2.1 h).
Notes:
1. IAA can cause stress on larvae, which can interfere with translation. We have observed consistent results without major effects on translation with 5 h of auxin treatment; however, shorter incubation times may work as well.
2. IAA is light-sensitive; minimize light exposure during handling of IAA plates.
3. Preparation of microscopy slides: as described in C1.2 and Figure 10A.
4. Mounting worms for live imaging of translation:
a. Add a droplet (4 μL) of 10 mM Tetramisole solution on the agarose pad to paralyze the animals.
b. Use a worm pick to place the desired number of worms into the Tetramisole droplet.
c. Place a coverslip (18 × 18 mm or 20 × 20 mm) on top of the agarose pad.
D. Imaging of translation using microscopy
Note: Different microscopes may be used for imaging of translation spots. This protocol describes the use of a spinning disk confocal microscope. Spinning disc microscopy offers higher resolution and less bleaching compared to widefield imaging approaches. In addition, it allows for faster imaging compared to point-scan confocals. Light sheet microscopes may cause less bleaching but require more extensive image processing.
1. Turn on the microscope and secure the slide properly.
2. Select the appropriate microscope objective. For both embryos and larvae, a 100× NA 1.45 oil-immersion objective visualizes translation spots with high resolution and good sensitivity.
Note: Other objectives may be used, but lower magnification or NA may result in limited detection of translation spots. For some strains, translation spots have been observed using 60× oil objectives and 100× water objectives.
3. Bring samples into the correct focal plane to image translation spots.
Note: Spot intensity depends on the strain (GCN4 copy number, CDS length, translation efficiency) and imaging depth (see Figure 8).
4. Set imaging parameters:
Note: Imaging settings depend on the gene of interest and microscope setup.
a. Set laser power and exposure time. Use an exposure time of ≤100 ms.
Note: Exposure time settings of ≤200 ms may be used if no Z-stack images are required. For Z-stack images, using 200 ms exposure time settings may show movement of translation spots over the X/Y/X-axis.
b. Set Z-stack. Use Z-axis intervals of ≤0.4 μm for embryos and ≤0.25 μm for larvae.
Notes:
1. Make sure that the translation spots are visible over multiple Z-planes, as this allows for detection of all translation spots and more reliable measurements of translation spot intensity.
2. For counting the number of translation spots or bulk analysis, 0.4 μm is usually sufficient to observe translation spots in embryos while maintaining fast imaging speeds to prevent detection of movements of translation spots per time point. Smaller intervals (e.g., 0.25 μm) may be used for analysis of spot intensities of individual spots or if the translation efficiency is very low, resulting in dimmer spots.
c. Set settings for multiple channels according to the research aim. For most purposes, image one channel over the whole z-axis before switching to the next channel. To study the overlap between translation spots with other structures, image multiple channels per Z-stack.
Note: Movement of the translation spots may be observed if multiple channels are imaged per Z-stack due to a longer delay in imaging of the scFv::GFP over each Z image.
d. For time-lapse imaging, use time-lapse intervals of ≤7.5 s.
Notes:
1. Shorter time-lapse intervals improve tracking but increase bleaching of the scFv::GFP.
2. Balance laser power and exposure time over imaging duration.
3. For long-term tracking of individual translation spots, the SunTag system may be combined with the PP7/PCP tethering system to stabilize mRNAs [21].
4. For long-term tracking of translation spots, other microscopes (e.g., light sheet imaging) may allow for better visualization over longer periods of time.
5. We have successfully imaged 24xGCN4::T2A encoding mRNAs at 5-s intervals for 5 min without problems. We observed some photobleaching, but spots remained very visible. We have not tested the limits of time-lapse imaging and do not know when translation spots become fully photobleached, as this also depends on the mRNA of interest.
E. Validate translation spots and confirm that GFP-positive spots are active translation sites
Note: Proper validation is essential to ensure that bright GFP signals indeed correspond to active translation events. Below, we describe several complementary approaches that users can apply.
1. Test sensitivity to translation inhibition. Subject embryos or adults to a short heat-shock (33 °C for 30 min in prewarmed M9). SunTag translation spots should disappear.
Note: In our hands, the heat-shock was more effective in embryos than in adults.
2. Test colocalization between SunTag spots and mRNA, as translation spots should overlap with mRNA encoding GCN4 repeats. Colocalization between SunTag spots and mRNA can be visualized using a combination of smiFISH and immunostaining of scFv::GFP [21].
3. Compare the location of SunTag translation spots with the location of the mature protein. If SunTag signals overlap with mature protein products, they might reflect protein labeling rather than active translation. However, localized translation at the site of protein function is also possible. To visualize overlap between mature protein and translation spots, protein expression in a strain containing 3-8xGCN4::POI could be compared to a strain expressing POI::3-8xGCN4, as the POI::3-8xGCN4 strain would label the mature protein, but no translation.
4. Use a control strain lacking GCN4 mRNA. Compare the experimental strain to a strain with the same scFv::GFP expression, but without the GCN4-encoding mRNA under similar conditions, as no spots should occur in the strain without the GCN4-encoding mRNA.
5. Inspect for background signal or aggregates. The scFv::GFP antibody shows some affinity for apical and junctional structures in epithelial cells (e.g., intestine and seam cells) (Figure 12A, B). GCN4 peptides can localize near DNA during mitosis, labeling the metaphase plate (Figure 12C). Mature GCN4 proteins may form aggregates. These background patterns are distinct from dynamic, punctate translation spots (see Video 1), and users should be aware of them (Figure 12D).
Notes:
1. In our hands, a false signal was more often caused by clustering or aggregation of the GCN4 proteins than the antibody (see Figure 12D), and often prevented by combining the SunTag system with the AID system.
2. While drug-based inhibition would be a powerful control, small molecules generally cannot penetrate the eggshell or cuticle in C. elegans.
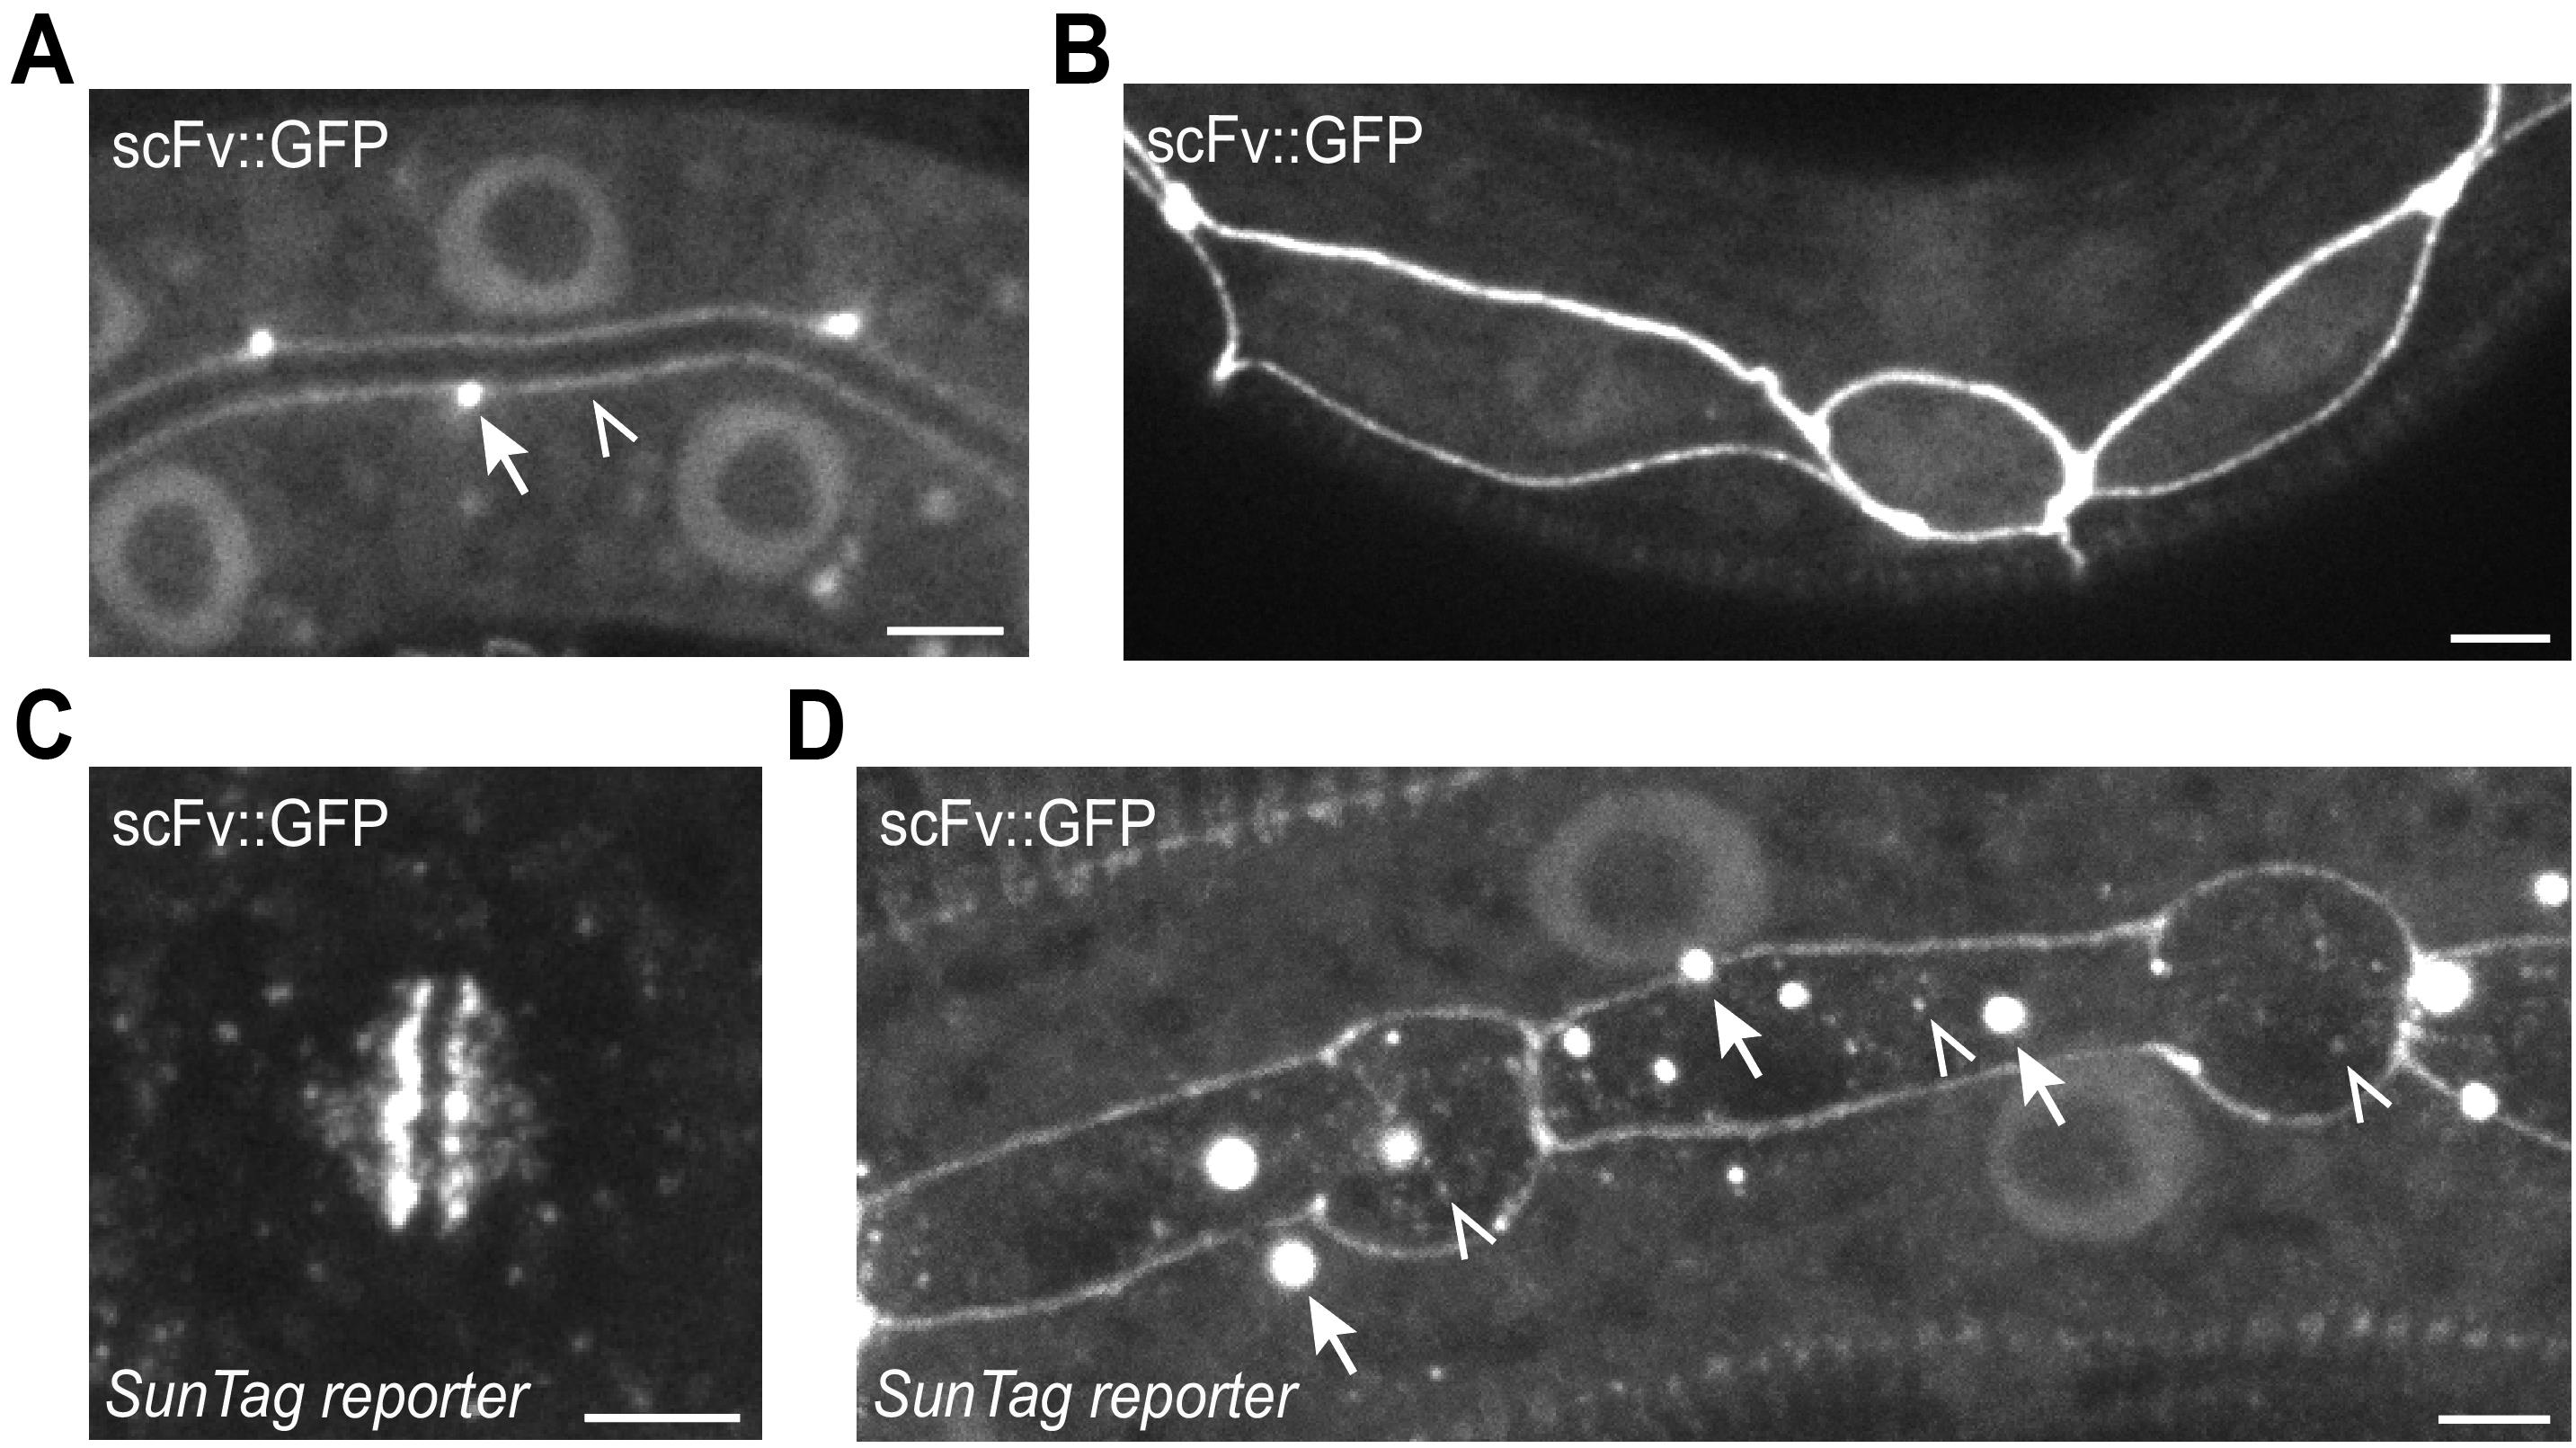
Figure 12. Examples of background signals in the SunTag system. (A, B) The scFv::GFP antibody shows weak affinity for apical and junctional structures in epithelial cells, such as intestine and seam cells. Arrows indicate junctions, open triangles indicate the apical membrane. (C) GCN4 peptides can localize near DNA during mitosis, labeling the metaphase plate. (D) Mature GCN4 proteins may form aggregates. Aggregates are indicated with arrows, and translation spots are indicated with open triangles. Scale bars, 2.5 μm.
F. Adaptations to the protocol for labeling of endogenous proteins
Notes:
1. Next to translation imaging, the SunTag system can be used to visualize the expression and localization of endogenous proteins of interest. This is similar to conventional fluorophore tagging but offers several advantages. Due to the small size of the SunTag epitope (only 19 amino acids), inserting the tag is simpler and more efficient compared to conventional fluorophores. Moreover, multiple SunTag peptides can easily be fused to genes of interest, amplifying fluorescent signals. Fluorescence amplification can be of great benefit for single-molecule imaging or visualization of lowly expressed proteins. In addition, the SunTag system can label proteins that are affected by protein fusions, as the GCN4 is much smaller than conventional fluorophores. Finally, the SunTag system can be used to visualize short-lived proteins that are not visible using conventional fluorophores due to maturation times, as the mature scFv::GFP antibodies immediately visualize proteins that are fused to the SunTag peptides.
2. The suitability of SunTag-based labeling for visualizing a protein of interest depends on both mRNA and protein characteristics. Cytoplasmic proteins may be more difficult to detect with few GCN4 repeats, due to background fluorescence from unbound scFv::GFP. In contrast, proteins with distinct subcellular localization, such as membrane-associated proteins, are usually well visible using SunTag. Finally, if the mRNA coding sequence is long or highly translated, translation spots may still be visible, potentially hindering analysis of protein expression.
1. Expressing the GCN4-labeled protein of interest.
a. Design the GCN4 tagging strategy. For abundant proteins, 1xGCN4 may be sufficient. Adding more GCN4 repeats can increase fluorescent brightness.
Critical: Do not place a T2A sequence between the GCN4 and the protein of interest, as this would prevent protein fusion and disrupt imaging of protein localization. An AID degron can optionally be included for conditional protein degradation, but is not required for visualization.
b. Integration of the GCN4 sequence into the gene of interest using CRISPR/Cas9-based genome editing. Use a ssODN as a repair template, containing one or multiple GCN4 and ~30 bp homology arms flanking the insertion site [27].
Note: ssODNs typically result in higher knock-in efficiency than PCR products.
c. Worm injection and screening: Inject worms and genotype the offspring to identify and select for successful knock-ins.
2. Imaging setup and settings. Similar imaging parameters as in translation imaging experiments can be used. Settings can be optimized depending on the expression levels and localization of the protein of interest. In contrast to the translation imaging, exposure times can be longer than 200 ms, and time-lapse intervals can extend beyond 7.5 ms.
Data analysis
Notes:
1. Using the translation imaging method described here, the GFP intensity of translation sites can be used to determine quantitative features of translation. Although determining absolute ribosome numbers per mRNA is challenging, comparing the number of spots and relative intensities between conditions, as well as the location of the spots within the cells, is informative when analyzing translation dynamics.
2. In order to analyze the images obtained by microscopy, different image analysis software packages can be used, including MATLAB, Python, Imaris, Arivis, and ImageJ/FIJI. The choice of software often depends on previous experience and personal preference. For unique or complex questions, MATLAB and Python offer flexibility. However, for many simple types of analysis, existing, freely available, and user-friendly FIJI plugins can be used. FIJI tools can be used to count the number of translation spots per cell and compare translation spot intensities. One particularly useful plugin for analyzing translation spots is ComDet (Software and dataset 2), developed by Eugene Katrukha. This plugin counts the number of translation spots in a cell over time and determines the fluorescence intensity of individual spots. Imaris software is available upon a paid license and is useful for analysis in 3D and for tracking translation spots over time. Imaris can also be used for studying colocalization between translation spots and cellular structures (not described in this protocol).
3. Data analysis A describes how to make a 2D image from a z-stack, for relatively fast analysis of the translation spot number and intensity in a region of interest using ComDet. In B, we describe how to analyze this data in Excel. In C, we describe a more thorough analysis in 3D for translation spot number, intensity, and tracking over time and in a region of interest using Imaris.
A. Analysis of the number and intensity of translation spots using FIJI (see Figure 13)
Notes:
1. ImageJ may also be used, but FIJI offers more options and easy Bio-formats Import options.
2. Using Z-stack images is advised to capture all translation spots within the area of interest. For analysis of translation spot intensity, imaging depth may be limited, as this impacts the brightness of the SunTag spots. This protocol does not correct for loss of fluorescence due to imaging depth.
1. Download and install the ComDet plugin [23].
2. Import the image of interest. Drag the TIFF file into FIJI. The Bio-Formats Import Options window should appear. Select View stack with: Hyperstack to open the image as a Z-stack.
3. Select the region of interest (ROI) by making a z-projection and drawing a selection.
Note: Selected areas should be of similar size between images for reliable analysis.
a. For embryos:
i. Make a Z-projection of the area of interest: Image > Stacks > Z Project…. Use Projection type: Max Intensity.
Note: To compare translation spots between embryos, a Z-area of 2 μm is usually sufficient. Compare similar tissues and imaging depths to make comparisons between strains more reliable. Save the Z-stack range to be able to reproduce data exactly (e.g., in file name).
ii. Select the embryo as ROI using the Polygon selections tool to limit analysis to the embryo and to reduce noise from the background. Duplicate selection to limit further analysis to the selected ROI.
Note: Add ROIs to the ROI manager and save ROI data to guarantee reproducibility.
b. For specific cell types of interest in larvae:
Note: This part describes measuring translation spot number and intensity per cell in the specific cell types of interest. To facilitate segmentation of individual cells, a fluorescent membrane marker (e.g., mCherry::PH) under the control of a cell type–specific promoter (e.g., wrt-2 for seam cells) can be used.
i. Make a Z-projection of the area of interest: Image > Stacks > Z Project….Use Projection type: Max Intensity.
ii. Create ROIs for individual cells using the Polygon selection tool to draw the outline of individual cells, using the membrane marker signal as a guide. Add ROIs of individual cells to the ROI manager and save them (Figure 13A).
iii. For each ROI: Make a Z-projection (Max Intensity) of the full volume of the cell (Figure 13B).
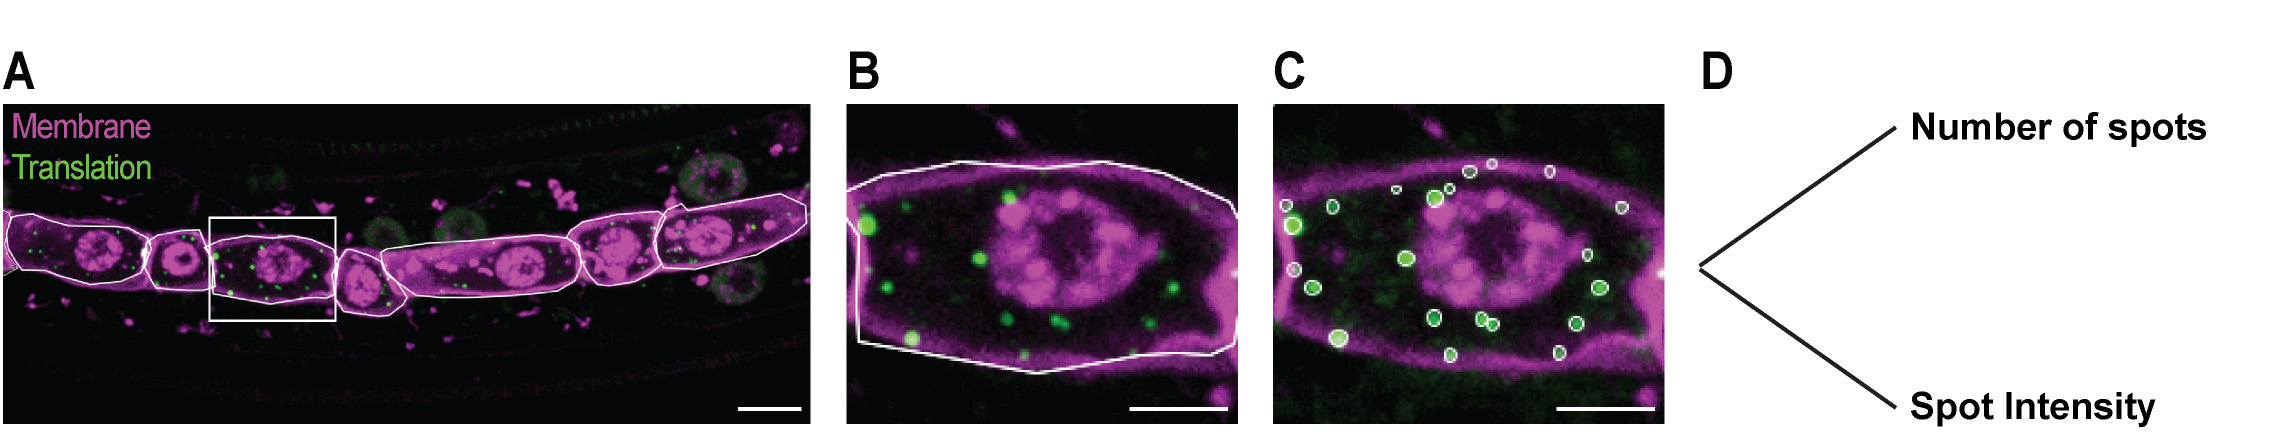
Figure 13. Example of detection and intensity measurement of translation spots in individual cells of C. elegans larvae. (A) Example of ROIs for individual seam cells (white lines) drawn with the Polygon Selection tool on a maximum intensity projection and using a membrane marker (magenta) as a guide. Translation spots in green. (B) Maximum intensity projection of the seam cell shown in the inset in (A). (C) Detection of translation spots by ComDet. Individual ROIs (white ovals) are created by the plugin. (D) Data output includes spot number and intensity measurements. Scale bars: 5 μm (A) and 2.5 μm (B, C).
4. For multichannel images, split the channels into separate channels: Image > Color > Split Channels.Note: This is not required for the analysis, but results in faster analysis of the translation spots. Do not split channels if you want to compare spots over multiple channels and show overlap between spots.
5. Select translation spots and measure number and intensity by running the ComDet plugin: Plugins > ComDet v.0.5.5 > Detect particles.
a. Adjust Detection parameters in the pop-up window.
i. Segmentation of larger particles is advised, as due to the Z-projection, some spots may be in proximity to each other or overlap.
ii. The Approximate particle size and Intensity threshold (in SD) should be adjusted per gene of interest, as translation efficiency influences the brightness of the spots.
iii. ROI shape: Ovals work well for translation spots.
iv. Add to ROI Manager: All detections, so that results can be saved and re-analyzed later if preferred.
v. Use Preview detection to adjust the parameters to the data (Figure 13C).
Notes:
1. Manually checking identified spots is an important step, as ComDet often misidentifies bright membrane regions as translation spots. It may also include spots outside the cells of interest, leading to overestimation of the number of spots.
2. If colocalization between spots from different channels is preferred, run ComDet on a multichannel image, select Calculate colocalization? and set the Max distance between colocalized spots. Parameters can be set for each channel in subsequent appearing windows.
b. Run ComDet. Data output containing spot number and intensity measurements will appear (Figure 13D).
i. Use the Summary table to compare the Number_of_Particles as an estimation for the number of translated mRNAs.
ii. Use the Results table to compare the IntegratedInt as a measurement for the efficiency of translation per mRNA. Note that IntegratedInt is not absolute intensities but relative values.
iii. Save all results together in a folder to facilitate analysis. Save other data in different folders.
c. Add ROIs from ComDet output to the ROI manager and save ROI data to guarantee reproducibility.
B. Analysis of FIJI data in Excel
Note: Different programs can be used to analyze ComDet output. Here, we provide an overview of how to import data into Excel and how to retrieve measurements of all translation spots per analyzed image.
1. Import the Results data in Excel: Data > Get Data > From File > From Folder. Select the folder of your data and choose the option Combine & Transform Data. A new window will appear. Use Tab for Delimiter.
2. Check if the data is imported correctly and recognized as a decimal number.
a. The Power Query Editor will appear. Recover original values by removing the Changed Type in APPLIED STEPS.
b. If commas are used for decimal numbers in Excel: Select the column with the values of interest and use Replace Values to find the points and replace those with commas.
c. Change Data type from Text to Decimal Number.
3. Analyze the data. Using this approach, the number and intensity of translation spots can easily be calculated. Other measurements, such as minimum, median, or maximum intensities, are also possible.
Note: This step can be skipped if only raw data values are desired.
a. If one measurement per image is desired, select Basic, and use Source.Name to group. Choose the Operation of your choice (e.g., Average) and select the IntegratedInt values as Column as input for grouping the data per image.
b. If more than one measurement per image is desired, select Advanced and use Source.Name to group. Choose the Operation of your choice (e.g., Average) and select the IntegratedInt values as Column as input for grouping the data per image. Add aggregation for additional measurements.
4. Retrieve the date into the Excel sheet by pressing Close & Load in the Power Query Editor.
C. Tracking of individual translation spots over time and in 3D using Imaris (see Video 2)
Note: Use Z-stack images that cover the whole embryo or region of interest.
1. Convert files for use in Imaris.
a. For multichannel images, save merged files as TIF using ImageJ or FIJI software.
b. Convert the TIF file to an Imaris Image File using Imaris File converter software.
2. Open the Imaris Image File in the Arena of Imaris software.
3. Set pixel size and Z distance in Edit > Image Properties. Set time point intervals in All Equidistant… > Time Interval.
4. Find translation spots and corresponding tracks over time using 3D View > Spots.
a. Set Algorithm settings. Select the options:
i. Segment only a Region of Interest.
Note: Optional and only required if specific regions or time points are preferred for analysis. If whole images are analyzed, this option can be used in combination with the selection of “Process entire Image finally” for faster processing of bigger datasets.
ii. Track spots over time.
iii. Note: Selecting Classify Spots is optional to group translation spots or tracks over time based on specific characteristics. The option Object-Object Statistics may be selected if the smallest distance between spots and other objects needs to be measured. Selecting these options will add steps to the described pipeline.
b. Click on Next: Region of Interest. Add ROI and provide minimum and maximum X, Y, Z, and Time dimensions. The ROI will appear in the image (see Figure 14A).
Note: This step is optional and only appears if selected in the previous step.
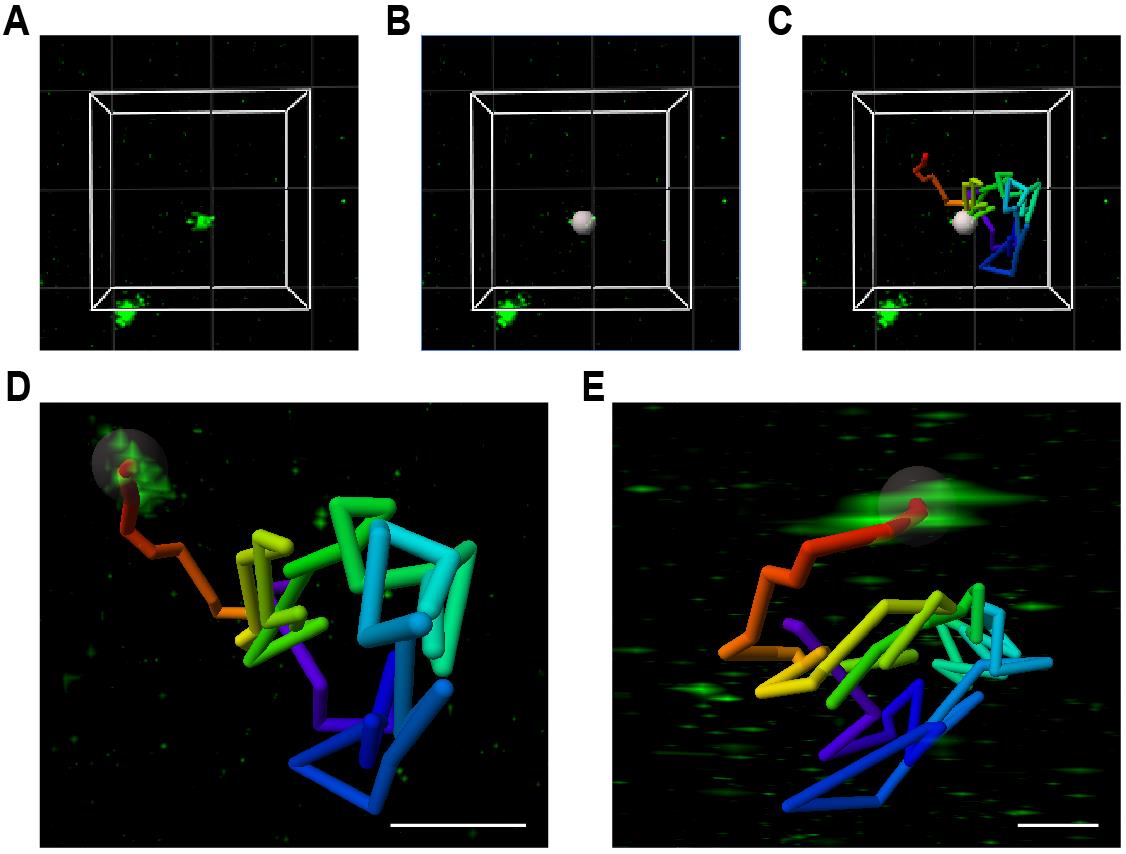
Figure 14. Spot finder and tracking in Imaris software. (A) Example of a ROI (white box outlines) with one SunTag translation spot in the middle of the ROI and one SunTag translation spot outside of the ROI (both in green). (B) Recognition of the SunTag signal as Spot (gray sphere) by Imaris. (C) The Spot (gray sphere) and its Track (colored line), representing the movement of the SunTag translation spot over time. The Spot is depicted at time point t = 180 s out of 300 s in total. (D, E) Top-view (D) and side-view (E) of the Track (colored line) of a SunTag translation spot, with the translation spot (in green) at t = 0. Scale bars: 1 μm.
c. Click on Next: Source channel adjustments (see Figure 14B).
i. Select the channel that contains the SunTag translation spots in Source Channel.
ii. Define the size of the SunTag translation spots in Estimated XY Diameter. A cube with the given dimensions will appear around the cursor in the image; SunTag translation spots should fit well in the cube.
Note: An estimated XY diameter of 0.4 μm worked well in our hands. The value may differ between experiments and depends on the number of GCN4s, imaging settings, and translation efficiency.
iii. Select Background Subtraction.
d. Click on Next: Edit spots. This is optional if specific Spot objects need to be manually added or removed.
e. Click on Next: Tracking (see Figure 14C).
i. Select the Tracking Algorithm; Brownian Motion worked well in our hands for tracking translation spots over time.
ii. Adjust the maximum distance that is expected for the translation spots to travel between time points under Max Distance in Parameters.
Note: The Max Distance depends on the speed of the movement of the translation spots. Smaller or larger Max Distance values may be selected if translation spots move more slowly or faster, respectively. Using too large Max Distance values increases the risk of switching between different translation spots within one track. More stringent settings may be applied if many translation spots are present. In our hands, a Max Distance of 2.25 μm worked well for translation spots with a mean movement of 0.36 μm between time points and an average maximum movement of 1.57 μm between time points.
iii. Adjust the maximum number of consecutive time points within a track that a Spot object (i.e., translation spot) is not observed under Max Gap Size in Parameters.
Note: In our hands, a Max Gap Size of 1 worked well. Including bigger gap sizes increases the risk of switching between different Spot objects (i.e., translation spots) within one track.
f. Click on Next: Filter tracks.
Optional: Add Filters, choose Filter Type, and adjust settings to improve tracking results.
Note: Due to problems with translation spots moving in and out of frame, using Track Duration worked well for selecting qualitative tracks in our hands.
g. Click on Finish: execute all creation steps and terminate the wizard. The Spot objects (i.e., translation spots) and corresponding Tracks (i.e., translation spot movement over time) are now created and can be analyzed. All Spot objects and Tracks should be visible in the image.
5. Visually check if the raw signal from translation spots correlates with the calculated Spots and Tracks output by Imaris. In addition, use the tab Edit Tracks to check if tracking gaps are present (only if Max Gap Size was set at ≥1) or to edit Tracks manually.
6. Analyze translation spots and their movement: Use the tab Statistics > Detailed to study characteristics of the Spot objects and Tracks (e.g., average intensity or speed of the translation spots). Data can be exported as an Excel file for further analysis.
7. Optional: Manually edit, label, group, or filter Spot objects (i.e., translation spots) using the tabs Edit, Edit Labels, Edit Events, or Filter.
8. Optional: Change the visual representation of the Spots objects and Tracks using the tabs Settings and Color (see Figure 14D, E).
9. Optional: Save Spot settings to apply analysis to other images using the tab Rebuild.
Validation of protocol
This protocol (or parts of it) has been used and validated in the following research article(s):
• Van der Salm et al. [21]. Measuring and manipulating localized translation of erm-1 in the C. elegans embryo. Development (Figures 1 and 2).
• See also Section F in this manuscript.
To validate whether the scFv::GFP SunTag antibody can bind the GCN4 epitopes in C. elegans, single or multiple GCN4 epitopes were fused to endogenous proteins (PAR-3, NPP-9, and ERM-1), demonstrating efficient recruitment of the scFv::GFP antibody and proper subcellular localization (Figure 15A–F) [21]. Quantification of ERM-1 membrane enrichment showed comparable results between ERM-1::SunTag and ERM-1::GFP strains (n = 11 embryos, two-tailed unpaired Student’s t-test with Welch’s correction, ns), confirming that the SunTag antibody efficiently binds GCN4 epitopes without interfering with function (Figure 15G) [21]. To test whether the SunTag system can be used to visualize translation in C. elegans, we combined expression of the scFv::GFP antibody with expression of the exogenous translation reporter (SUR10 or SUR54) (Figures 1C, 2, 3, 5, and 15H, upper panel) [21]. In contrast to expression of solely the scFv::GFP, combined expression yielded bright translation spots in embryos and larvae across tissues (Figures 1C, 3C-D and 15H, upper panel) [21]. Validation of translation spots was carried out by testing two assumptions: (1) spots should disappear upon translation inhibition, and (2) spots should colocalize with mRNA. Upon inhibition of translation by a short heat-shock, a rapid and significant reduction in translation spots was observed (Figure 15H, I) (n = 5–12 embryos per condition; Kruskal–Wallis test with Dunn’s multiple comparisons; **P ≤ 0.01, ***P ≤ 0.001), confirming that the bright spots reflect ongoing translation [21]. Using combined smiFISH and immunofluorescence, ~60% of bright GFP spots colocalized with reporter mRNAs (Figure 15J, K) (n = 39 embryos, two-tailed unpaired Student’s t-test with Welch’s correction, ****P ≤ 0.0001), supporting their identity as active translation sites [21]. In live imaging, addition of 72xPP7 hairpins to the reporter and co-expression of PCP::mCherry::PH enabled simultaneous visualization of mRNAs and translation (Figure 15L, M) [21]. Translation spots frequently overlapped with mRNA, and tracking revealed the release of individual mature SunTag proteins from active translation sites (Figure 15N and Video 3) [21]. Together, these results validate that the SunTag system in C. elegans can reliably label proteins and visualize active translation of single mRNAs in real time.
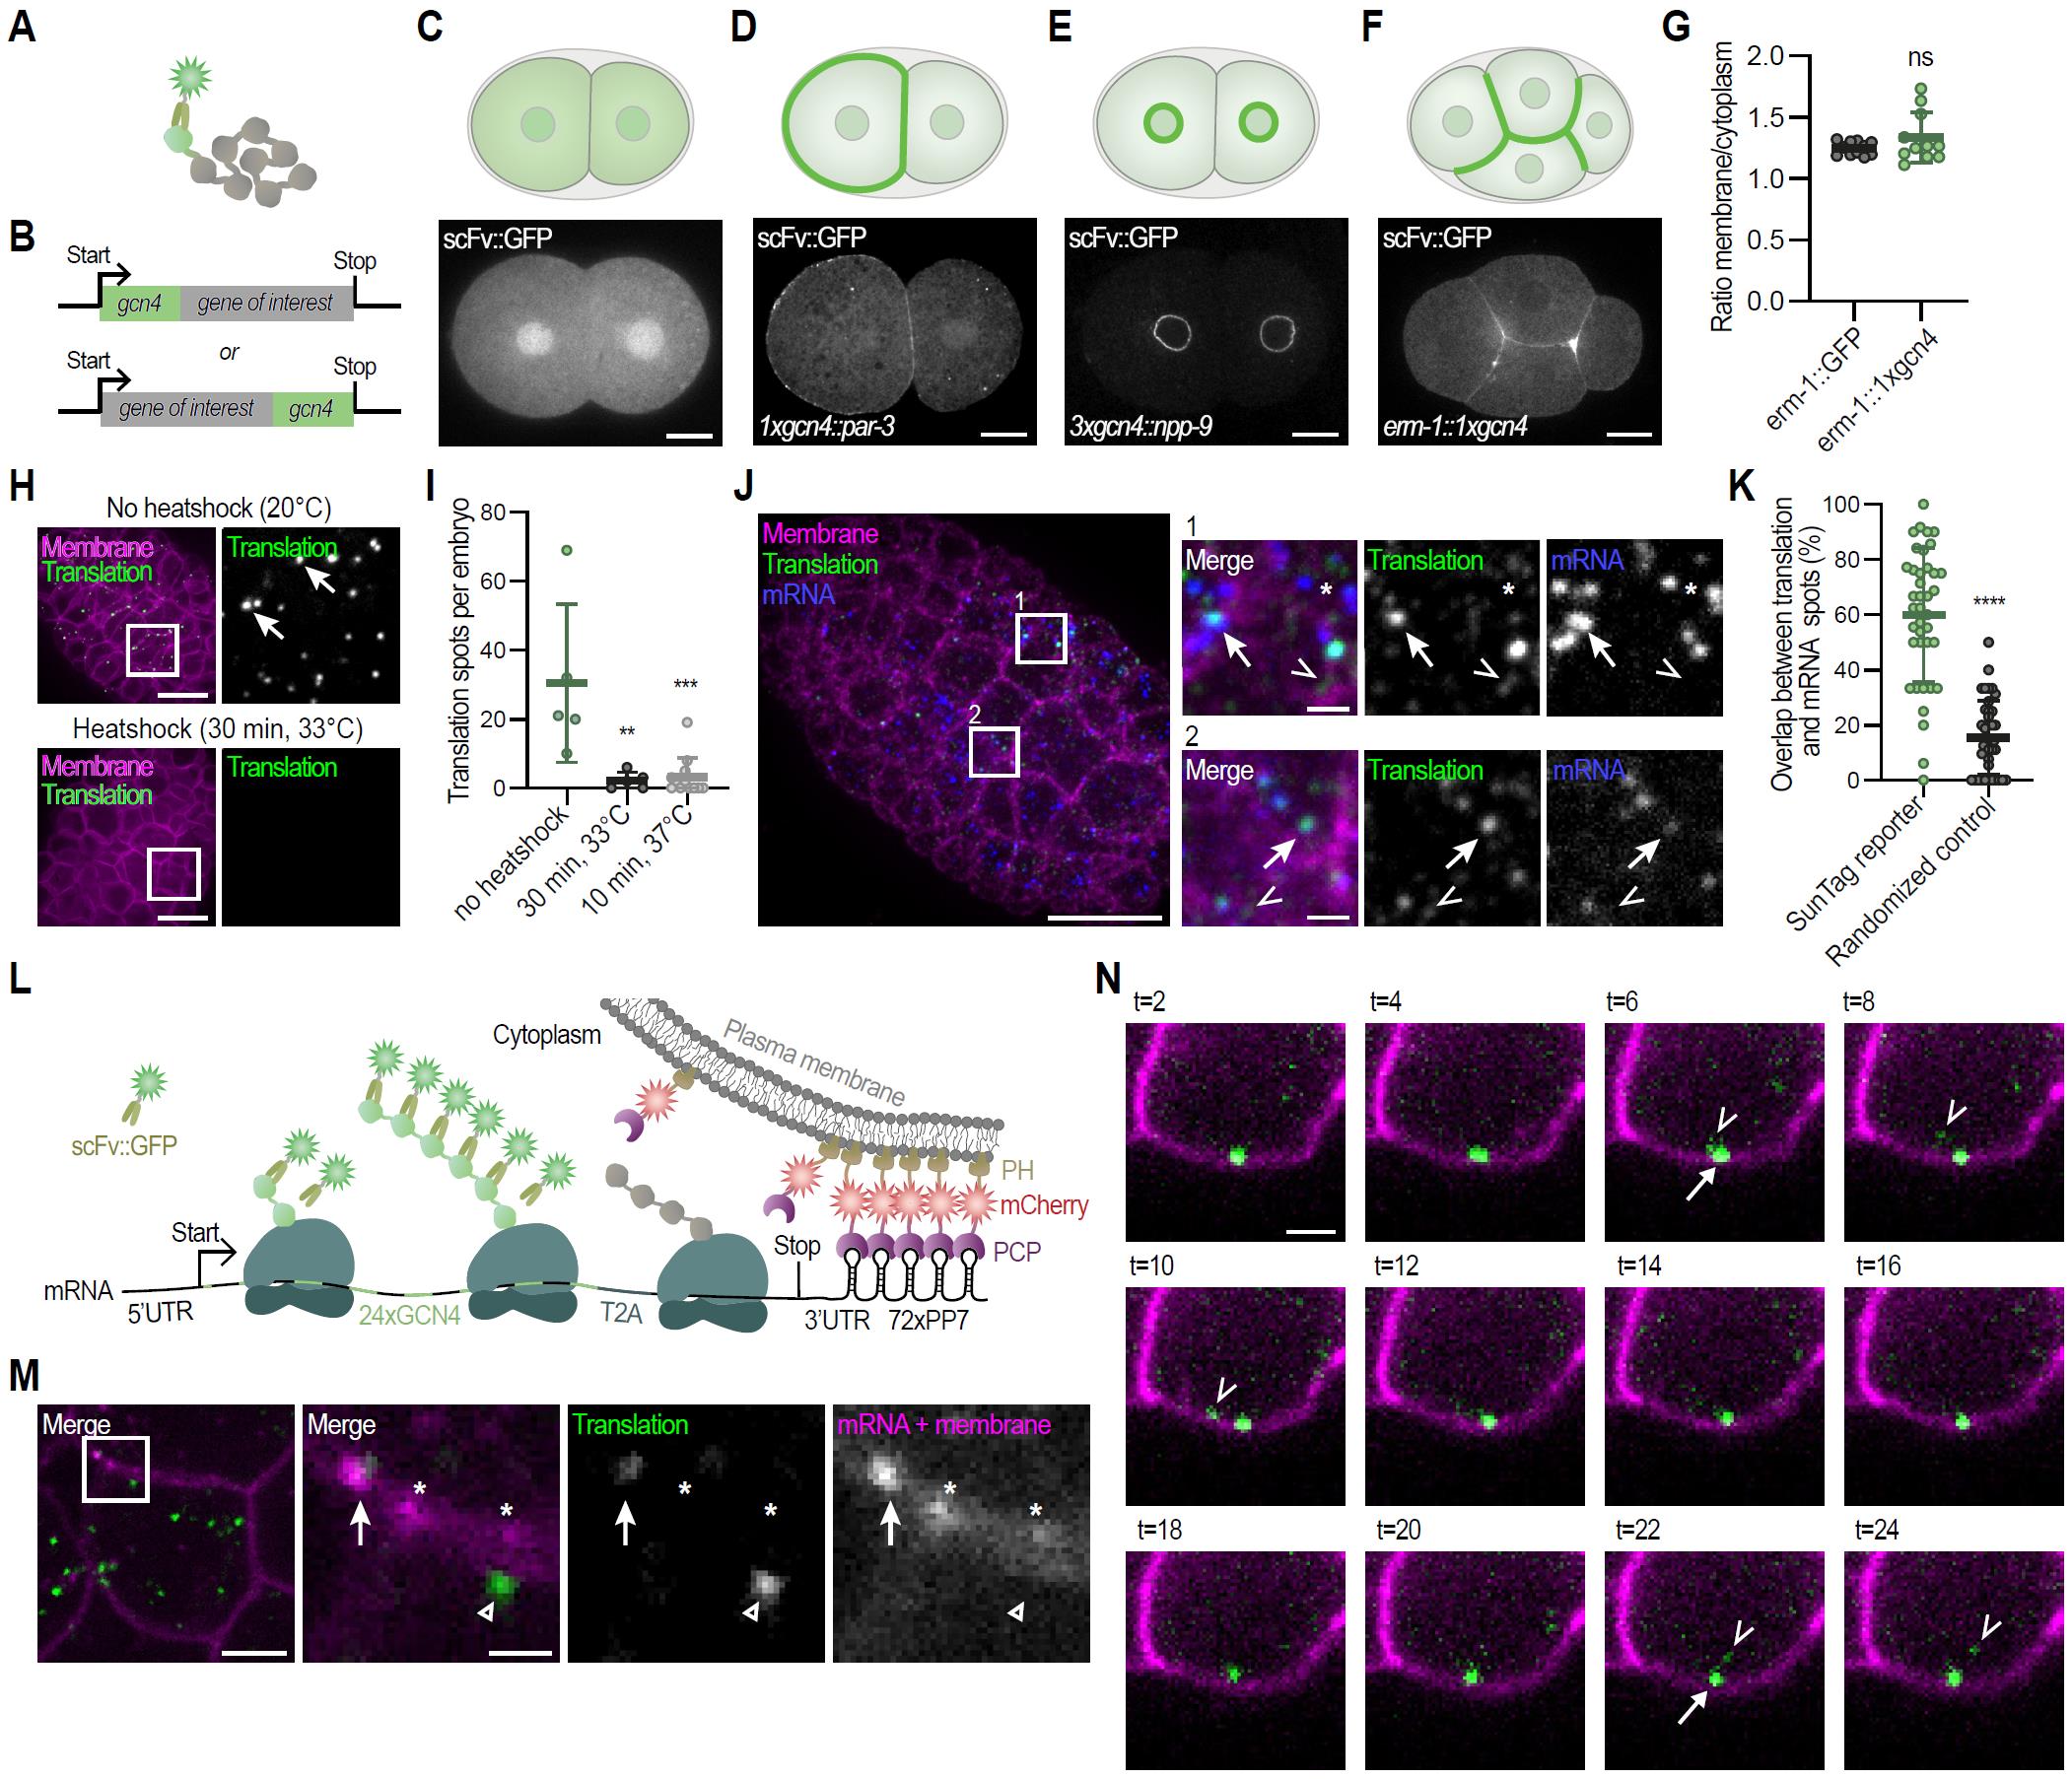
Figure 15. Validation of the SunTag translation imaging system in C. elegans. (A, B) Schematic overview of the SunTag-based protein labeling strategy. (C) Schematic overview and representative image of a 2-cell stage C. elegans embryo expressing the SunTag antibody (scFv::GFP). (D) Schematic and representative image of PAR-3 expression using the SunTag system. (E) Schematic and representative image of NPP-9 expression using the SunTag system. (F) Schematic and representative image of ERM-1 expression using the SunTag system and (G) quantification of membrane over cytoplasmic ratio of ERM-1 levels using either conventional GFP labeling of ERM-1 or the SunTag system. Each dot represents a single embryo (n = 11, 11). Test of significance: Unpaired Student’s T-test with Welch’s correction, with significance set at p ≤ 0.05. ns = not significant. (H–N) Translation validation. (H) Representative images of an embryo expressing the SunTag antibody (scFv::GFP), the translation imaging reporter (eft-3p::24xGCN4::AID::T2A::BFP::h2b::tbb-2 3’UTR), and the membrane marker (pie-1::mCherry::PH), subject to normal culturing conditions (upper panel) or heat-shock (bottom panel). Insets shown to the right; arrows indicate active translation sites. Scale bar: 10 μm. (I) Quantification of the number of translation spots in 30- to 60-cell embryos in non-treated and heat-shocked animals. Each dot represents one embryo (n = 5, 5, 12), bars display the mean ± SD. Kruskal–Wallis followed by a Dunn’s post-hoc test was used to assess statistical significance against the “no heat-shock” condition; **p ≤ 0.01 and ***p ≤ 0.001. (J) Representative image of a fixed embryo expressing the SunTag antibody (scFv::GFP), a translation imaging reporter (eft-3p::24xGCN4::AID::T2A::BFP::H2B:20xPP7:tbb-2 3’UTR), and a membrane marker (pie-1p::PCP::mCherry::PH). Reporter mRNAs (blue), membranes (magenta), and translation spots (green) were detected using a combination of smiFISH and IF. Insets shown to the right. Arrows in insets indicate translation spots overlapping with mRNA. Open triangles indicate (mature) GCN4 proteins (weak green signal), not overlapping with mRNAs. Asterisks indicate non-translated mRNA. Scale bar: 10 μm (large panel) and 1 μm (small panels). (K) Quantification of the number of bright green spots (presumable translation spots) that overlap with mRNA spots. Each spot represents one embryo (n = 39, 39), bars indicate the mean ± SD. Test of significance: Unpaired Student’s T-test with Welch’s correction; ****p ≤ 0.0001. (L) Schematic overview of the SunTag translation imaging system in combination with mRNA labeling and membrane tethering using the PP7 system. (M) Representative image of a part of a live embryo, extrachromosomally expressing the reporter as shown in (L), indicating overlap between translation spots (green) and mRNAs (magenta). Arrow in insets indicates a translation spot that overlaps with mRNA, the open arrowhead indicates a translation spot not overlapping with mRNA, and asterisks indicate non-translated mRNAs. Scale bar: 2.5 μm (entire cells) and 0.75 μm (zoom-in). (N) Time-lapse imaging of the release of mature protein from a translation spot over a 24 min period. Depicted is a cell in an embryo expressing the SunTag antibody (scFv::GFP; depicted in green), a translation imaging reporter (eft-3p::24xGCN4::AID::T2A::BFP::h2b::20xPP7::tbb-2 3’UTR), the membrane marker (mCherry::PH; depicted in magenta), and the PCP protein (PCP::mCherry::PH; also depicted in magenta). Scale bar: 1 μm. Depicted data and figures have been reused or adapted from Van der Salm et al. [21].
General notes and troubleshooting
General notes
1. Considerations when expressing the SunTag antibody (scFv::GFP): For effective SunTag imaging, scFv::GFP expression levels need to be sufficiently high to bind all SunTag peptides. This includes both the mature SunTag-tagged proteins and the newly synthesized nascent SunTag polypeptides emerging from ribosomes. If scFv::GFP levels are too low, most scFv will bind to mature SunTag proteins, and the newly synthesized, nascent SunTag peptides will not be (completely) fluorescently labeled. On the other hand, if scFv::GFP levels are too high, unbound scFv::GFP will give a strong background fluorescence that may mask translation sites. Optimal antibody levels depend on mRNA expression levels and translation efficiency of the gene of interest; highly expressed or efficiently translated mRNAs require higher antibody levels compared to lowly expressed mRNAs.
To fine-tune scFv::GFP expression, consider modifying the promoter, UTR, fluorophore, or subcellular localization:
a. Promoter: Modifying the promoter can change the expression levels and tissue specificity of the SunTag antibody. This is especially important for visualizing translation of lowly or highly expressed mRNAs, or when background fluorescence from other tissues may interfere with signal interpretation in the cells of interest. In the currently available strain (Table 1, Figure 2), the scFv::GFP antibody is expressed under the eft-3 promoter, resulting in expression in both somatic and germline cells. While expression is slightly lower in the germline, this strain is generally a good starting point for most experiments. For cell type–specific studies, a cell type–specific promoter may be advantageous, as this helps to reduce background from unrelated tissues.
b. Fluorophore: So far, in all systems published, the SunTag antibody has been fused to GFP, which aids solubility and prevents aggregation. However, depending on experimental needs, using a brighter or more stable fluorophore may improve visualization over time.
Note: The scFv::GFP antibody shows some affinity for apical and junctional structures in epithelial cells (e.g., intestine and seam cells) (Figure 12A, B). However, binding to GCN4 peptides is stronger and causes re-localization of the antibody from the membrane to translation sites. In some cases, the expression of the antibody at the membrane may interfere with detecting translation events in close proximity to the membrane.
2. Design the mRNA of interest for studying translation. It is important to define your biological question and determine how tagging your gene of interest will address this. Start by deciding where to insert the GCN4 repeats, how many repeats to include, and whether to combine the knock-in with elements such as a T2A sequence or AID-tag. While specific optimization is required for each gene, the following general recommendations may help guide the design (see also Figure 7):
a. Where to insert the GCN4 repeats. The optimal position for inserting GCN4 repeats is at the 5′ end of the mRNA, directly after the start codon. This allows the GCN4 peptides to emerge first from the ribosome, generating a detectable translation signal immediately as translation begins. However, this N-terminal tagging strategy is only suitable if it does not interfere with the function of the protein of interest. If N-terminal fusion disrupts protein function, this can be bypassed by inserting a T2A sequence between the GCN4 repeats and the coding sequence. This allows ribosomes to produce the GCN4 peptides and the target protein as separate products, allowing for translation imaging without interfering with protein function (see below about T2A). Theoretically, integration of GCN4 repeats at the 3′ end of the coding region is also possible, but requires more GCN4 repeats and visualizes translation with a delay.
b. The number of GCN4 repeats. In general, the more repeats are included, the brighter the translation spots. Direct fusions between GCN4 repeats and the protein of interest yield brighter signals compared to situations where a T2A separates the GCN4s from the target gene. Thus, fewer GCN4 repeats are required when fused to the protein of interest. Larger repeat arrays may interfere with gene expression or protein function, and in C. elegans, this can trigger germline silencing (Figure 5).
i. 24xGCN4 repeats. In many systems, 24xGCN4 repeats have been used as a standard number to visualize translation [12,13,15–17]. 24xGCN4 repeats have also been proven effective in C. elegans for visualizing translation spots of both reporter and endogenous mRNAs, even when followed by a T2A. However, in C. elegans, insertions of 24xGCN4 led to germline silencing, making it unsuitable for studying translation in the germline or early embryo [21]. Finally, integrating 24xGCN4 repeats can be challenging.
ii. 3–10x GCN4 repeats. Using a lower number of repeats reduces the risk of silencing and is more suitable for germline expression. The smaller size and reduced repetitiveness typically also make genome integrations more efficient. The optimal number of repeats depends on both the length of the CDS and translation efficiency. Shorter transcripts require more GCN4 repeats, as fewer ribosomes can translate the mRNA simultaneously, resulting in fewer scFv::GFP-bound GCN4 peptides at the mRNA-ribosome complex. Similarly, less efficiently translated mRNAs may also benefit from more repeats to produce a detectable signal (Figure 8). When making direct fusions between GCN4 repeats and the protein of interest, two key factors should be considered: 1) Low-repeat fusions only work if the protein can tolerate N-terminal tagging, and 2) direct fusions lead to labeling of the mature protein, which can interfere with visualization of translation sites. For mature proteins that localize to the nucleus, this is not a problem, but for proteins that localize to the cytoplasm, it is important to ensure that mature proteins can be distinguished from translation spots.
Notes:
1. GCN4 peptides show some affinity to structures near the DNA of dividing cells, resulting in labeling of the metaphase plate in dividing cells (Figure 12C).
2. We have observed clear translation spots in early embryos with as few as 3xGCN4 repeats on a highly translated mRNA with a CDS length of ~1,500 bp.
c. Including a T2A sequence: Including a T2A site between the GCN4 repeats and the gene of interest is a good solution when N-terminal fusions disrupt protein function. This allows ribosomes to produce the GCN4 peptide and the target protein as separate products, allowing for translation imaging without interfering with protein function. When combined with the AID system, this also allows for degradation of the mature GCN4 protein without interfering with the expression of the protein of interest.
Note: The T2A sequence leaves 1 amino acid at the N-terminus of the protein of interest, typically a proline.
d. Auxin-inducible degradation (AID) of GCN4 peptides: The AID system can be used to degrade mature GCN4 peptides after translation [24]. This improves imaging and visibility of translation by 1) preventing fluorescently labeled GCN4 peptides from accumulating and interfering with translation signals and 2) increasing scFv::GFP availability for labeling active translation sites (see Figures 3 and 7). The AID system requires three components: 1) the AID-degron fused to the protein that should be degraded, 2) availability of auxin, and 3) a TIR protein that recognizes the AID-degron in complex with auxin for targeted degradation by the proteosome.
Notes:
1. The AID sequence must be inserted after the GCN4 peptides and before the T2A site, as only mature GCN4 peptides should be degraded.
2. The AID system should be used in combination with T2A. Without a T2A site, the entire protein, including the protein of interest, will be degraded.
3. Delivering auxin effectively to the animals depends on the developmental stage. For early embryos, auxin can be introduced indirectly by placing L4-stage animals on auxin-containing NGM plates one day before imaging. For late-stage embryos, auxin penetration is more difficult due to the eggshell. In these cases, consider using modified, membrane-permeable auxin analogs that can permeate the eggshell [30]. Larvae can be exposed directly by placing them on auxin-containing NGM plates. Because auxin can induce stress and affect translation, exposure should be limited to no more than 5 h.
4. Using the AID system requires expression of the TIR protein in the cell type of interest. Multiple strains expressing TIR proteins under different promoters exist and can be ordered from the CGC [33]. The TIR used in the reporter strain SUR54 is under the expression of the eft-3 promoter. Useful oligos for genotyping are listed in Reagent 11.
Troubleshooting
Problem 1: No translation spots can be observed when imaging.
Biological causes:
Possible cause: Too few GCN4 repeats are used. Translation spots may be too dim if the repeat number is insufficient, especially for short and/or lowly translated mRNAs.
Solution:
a. Increase the number of GCN4 repeats.
b. For N-terminal fusions without T2A, consider transcript length and translation efficiency when deciding on repeat number.
c. Use a cell type–specific promoter to reduce scFv::GFP signal noise from non-relevant tissues.
Possible cause: High translation efficiency of the target gene, but low scFv::GFP levels, causing incomplete labeling of translation sites, often characterized by replenishment of the scFv::GFP signal from the nucleus.
Solution:
a. Use a stronger promoter to increase scFv::GFP expression.
b. Combine the SunTag system with the AID system for degradation of mature GCN4, and increased availability of the unbound scFv::GFP.
Possible cause: Low translation efficiency combined with high background signal from unbound scFv::GFP may reduce the signal-to-noise, making spots undetectable.
Solution:
a. Increase GCN4 repeat number to enhance translation signals.
b. Use a weaker or tissue-specific promoter to reduce background from unbound scFv::GFP.
Possible cause: GCN4 repeats are germline-silenced, leading to the absence of target mRNAs in germline and early embryonic tissues.
Solution:
a. Reduce the number of integrated GCN4 peptides.
b. Remove piRNA sequences from the integrated sequence.
c. Use germline-optimized DNA sequences for GCN4 repeats.
d. Use PATC-rich introns between GCN4 peptides.
Note: We observed that gene expression was no longer silenced when we combined the reduction of the copy number and the removal of piRNA sites and optimized the sequence for germline expression. The effect of each individual measure or PATC-rich introns has not yet been tested, but previous research [34] suggests that they may also help.
Technical causes:
Possible cause: Exposure time is too long. Translation spots can be very dynamic and require fast imaging to be observed.
Solution: Reduce exposure time (to ≤200 ms).
Problem 2: Bright, GFP-positive aggregates are formed, potentially interfering with translation imaging.
Note: Check the appearance and dynamics of translation spots. Most translation complexes move throughout the cytoplasm during translation. Although the size of the spot may differ depending on the number of integrated GCN4 repeats and translation efficiency, very large, immobile, bright spots may indicate aggregates rather than translation sites (Figure 12D).
Possible cause: GCN4 repeats are directly fused to the protein of interest and interfere with its folding or function, leading to aggregation.
Solution: Insert a T2A sequence between the GCN4 repeats and the protein of interest. This allows the GCN4 and the protein of interest to be translated as separate proteins, preventing GCN4 peptides from interfering with protein function.
Possible cause: Mature GCN4 peptides have an inherent tendency to aggregate, especially when not fused to other proteins.
Solution:
a. Use the AID system to degrade mature GCN4 peptides, reducing aggregate formation and improving translation clarity.
b. Mature GCN4 peptides have affinity for structures near the DNA of dividing cells, which may appear as aggregates (Figure 12C). Visualize translation spots in cells that are not dividing.
Possible cause: Cellular stress can cause aggregation of scFv.
Solution:
a. Perform experiments under standard culturing conditions and handle animals with care when preparing microscopy slides.
b. With increased experience and consistent handling, animals typically appear healthier during imaging.
c. Avoid imaging over long periods of time (longer than ~2 h), as keeping animals under the microscope for such durations may interfere with normal development and may cause stress.
Note: Embryos from translation reporters have been imaged for ~30 min without problems.
Problem 3: scFv::GFP signal appears in proximity to DNA structures during cell division.
Possible cause: Mature GCN4 peptides have some affinity to (proteins in proximity of) DNA structures and accumulate in the cells after translation.
Solution: Combine the SunTag system with the AID system (e.g., use 24xGCN4::AID::T2A::POI).
Problem 4: The GCN4 repeats did not amplify, so no repair template can be made.
Possible cause: The PCR protocol is not optimal for amplifying the GCN4 repeats.
Solution:
a. Use different primers (see also Reagents 11).
b. Use a different PCR protocol (for example: gradient PCR, longer elongation time).
Possible cause: The PCR primers do not work.
Solution:
a. For small integrations (e.g., 3xGCN4), a G-block can be ordered containing the recombination arms and 3xGCN4. Use PCR primers complementary to the recombination arms for amplification of the repair template.
b. Use molecular cloning to make a plasmid that contains the recombination arms and GCN4 repeats. After producing the plasmid, use PCR primers complementary to the recombination arms to amplify the repair template.
Note: No PCR amplification of the GCN4 is required for molecular cloning, as the 24xGCN4::T2A can be isolated from plasmid pSRG_101 (Addgene #246458) (Tables 2 and S2) using restriction enzymes KasI and AvrII. Gibson assembly (NEB E2611) cloning strategies [35] have been very efficient to make the plasmid for the repair template, as multiple fragments can easily be inserted into the backbone. However, incidentally, we observed recombination of the GCN4 repeats during Gibson assembly if the GCN4 repeats were in close proximity to the overhangs. This may be prevented by using conventional cloning strategies using restriction enzymes and T4 ligase ligation approaches in flanking regions.
Supplementary information
The following supporting information can be downloaded here:
1. Table S1. Sequences used for the generation of SunTag translation reporter strains.
2. Table S2. Sequences of useful SunTag plasmids.
Acknowledgments
We thank Ruijtenberg lab members for their input during the development of the SunTag translation imaging protocol. Author contributions: Conceptualization: E.S., S.K., and S.R.; Investigation, E.S. and S.R.; Writing—Original Draft: E.S., S.K., and S.R.; Writing—Review & Editing, E.S., S.K., and S.R.; Supervision, S.R. We thank S. van den Heuvel for support with funding. This work was supported by the Nederlandse Organisatie voor Wetenschappelijk Onderzoek (NWO) (OCENW.GROOT.2019.017). Open Access funding provided by Utrecht University. Deposited in PMC for immediate release. This work utilized resources from Utrecht University. We also thank WormBase and the Biology Imaging Center Faculty of Sciences of the Department of Biology at Utrecht University. Some strains were provided by the Caenorhabditis Genetics Center, which is funded by the US National Institutes of Health (NIH) Office of Research Infrastructure Programs (P40 OD010440). This protocol is based on the method described in van der Salm et al. [21].
Competing interests
The authors declare no competing or financial interest.
References
- Zhang, C., Wang, M., Li, Y. and Zhang, Y. (2022). Profiling and functional characterization of maternal mRNA translation during mouse maternal-to-zygotic transition. Sci Adv. 8(5): eabj3967. https://doi.org/10.1126/sciadv.abj3967
- Das, S., Vera, M., Gandin, V., Singer, R. H. and Tutucci, E. (2021). Intracellular mRNA transport and localized translation. Nat Rev Mol Cell Biol. 22(7): 483–504. https://doi.org/10.1038/s41580-021-00356-8
- Buszczak, M., Signer, R. A. and Morrison, S. J. (2014). Cellular differences in protein synthesis regulate tissue homeostasis. Cell. 159(2): 242–251. https://doi.org/10.1016/j.cell.2014.09.016
- Shcherbakov, D., Nigri, M., Akbergenov, R., Brilkova, M., Mantovani, M., Petit, P. I., Grimm, A., Karol, A. A., Teo, Y., Sanchon, A. C., et al. (2022). Premature aging in mice with error-prone protein synthesis. Sci Adv. 8(9): eabl9051. https://doi.org/10.1126/sciadv.abl9051
- Ishimura, R., Nagy, G., Dotu, I., Zhou, H., Yang, X. L., Schimmel, P., Senju, S., Nishimura, Y., Chuang, J. H. and Ackerman, S. L. (2014). RNA function. Ribosome stalling induced by mutation of a CNS-specific tRNA causes neurodegeneration. Science. 345(6195): 455–459. https://doi.org/10.1126/science.1249749
- Barna, M., Pusic, A., Zollo, O., Costa, M., Kondrashov, N., Rego, E., Rao, P. H. and Ruggero, D. (2008). Suppression of Myc oncogenic activity by ribosomal protein haploinsufficiency. Nature. 456(7224): 971–975. https://doi.org/10.1038/nature07449
- Sonneveld, S., Verhagen, B. M. P. and Tanenbaum, M. E. (2020). Heterogeneity in mRNA Translation. Trends Cell Biol. 30(8): 606–618. https://doi.org/10.1016/j.tcb.2020.04.008
- VanInsberghe, M., van den Berg, J., Andersson-Rolf, A., Clevers, H. and van Oudenaarden, A. (2021). Single-cell Ribo-seq reveals cell cycle-dependent translational pausing. Nature. 597(7877): 561–565. https://doi.org/10.1038/s41586-021-03887-4
- Ingolia, N. T., Ghaemmaghami, S., Newman, J. R. and Weissman, J. S. (2009). Genome-wide analysis in vivo of translation with nucleotide resolution using ribosome profiling. Science. 324(5924): 218–223. https://doi.org/10.1126/science.1168978
- Zeng, H., Huang, J., Ren, J., Wang, C. K., Tang, Z., Zhou, H., Zhou, Y., Shi, H., Aditham, A., Sui, X., et al. (2023). Spatially resolved single-cell translatomics at molecular resolution. Science. 380(6652): eadd3067. https://doi.org/10.1126/science.add3067
- Tanenbaum, M. E., Gilbert, L. A., Qi, L. S., Weissman, J. S. and Vale, R. D. (2014). A protein-tagging system for signal amplification in gene expression and fluorescence imaging. Cell. 159(3): 635–646. https://doi.org/10.1016/j.cell.2014.09.039
- Yan, X., Hoek, T. A., Vale, R. D. and Tanenbaum, M. E. (2016). Dynamics of Translation of Single mRNA Molecules In Vivo. Cell. 165(4): 976–989. https://doi.org/10.1016/j.cell.2016.04.034
- Wang, C., Han, B., Zhou, R. and Zhuang, X. (2016). Real-Time Imaging of Translation on Single mRNA Transcripts in Live Cells. Cell. 165(4): 990–1001. https://doi.org/10.1016/j.cell.2016.04.040
- Morisaki, T., Lyon, K., DeLuca, K. F., DeLuca, J. G., English, B. P., Zhang, Z., Lavis, L. D., Grimm, J. B., Viswanathan, S., Looger, L. L., et al. (2016). Real-time quantification of single RNA translation dynamics in living cells. Science. 352(6292): 1425–1429. https://doi.org/10.1126/science.aaf0899
- Wu, B., Eliscovich, C., Yoon, Y. J. and Singer, R. H. (2016). Translation dynamics of single mRNAs in live cells and neurons. Science. 352(6292): 1430–1435. https://doi.org/10.1126/science.aaf1084
- Pichon, X., Bastide, A., Safieddine, A., Chouaib, R., Samacoits, A., Basyuk, E., Peter, M., Mueller, F. and Bertrand, E. (2016). Visualization of single endogenous polysomes reveals the dynamics of translation in live human cells. J Cell Biol. 214(6): 769–781. https://doi.org/10.1083/jcb.201605024
- Vinter, D. J., Hoppe, C., Minchington, T. G., Sutcliffe, C. and Ashe, H. L. (2021). Dynamics of hunchback translation in real-time and at single-mRNA resolution in the Drosophila embryo. Development. 148(18). https://doi.org/10.1242/dev.196121
- Dufourt, J., Bellec, M., Trullo, A., Dejean, M., De Rossi, S., Favard, C. and Lagha, M. (2021). Imaging translation dynamics in live embryos reveals spatial heterogeneities. Science. 372(6544): 840–844. https://doi.org/10.1126/science.abc3483
- Khuperkar, D., Hoek, T. A., Sonneveld, S., Verhagen, B. M. P., Boersma, S. and Tanenbaum, M. E. (2020). Quantification of mRNA translation in live cells using single-molecule imaging. Nat Protoc. 15(4): 1371–1398. https://doi.org/10.1038/s41596-019-0284-x
- Vinter, D. J., Hoppe, C. and Ashe, H. L. (2021). Live and fixed imaging of translation sites at single mRNA resolution in the Drosophila embryo. STAR Protoc. 2(3): 100812. https://doi.org/10.1016/j.xpro.2021.100812
- van der Salm, E., Koelewijn, E., Schroeder, M., van der Maas, E., Jarosinska, O., Eeken, M. and Ruijtenberg, S. (2025). Measuring and manipulating localized translation of erm-1 in the C. elegans embryo. Development. 152(10). https://doi.org/10.1242/dev.204435
- Wang, P., Cao, Z., Wang, Q., Ma, X., Wang, N., Chen, L., Zhao, Y. and Miao, L. (2023). Protocol for CRISPR-Cas9-mediated genome editing to study spermatogenesis in Caenorhabditis elegans. STAR Protoc. 4(4): 102720. https://doi.org/10.1016/j.xpro.2023.102720
- Katrukha, E. (2020). ComDet plugin for ImageJ, v0.5.5, https://zenodo.org/records/6546038
- Sepers, J. J., Verstappen, N. H. M., Vo, A. A., Ragle, J. M., Ruijtenberg, S., Ward, J. D. and Boxem, M. (2022). The mIAA7 degron improves auxin-mediated degradation in Caenorhabditis elegans. G3 (Bethesda). 12(10). https://doi.org/10.1093/g3journal/jkac222
- Zhang, L., Ward, J. D., Cheng, Z. and Dernburg, A. F. (2015). The auxin-inducible degradation (AID) system enables versatile conditional protein depletion in C. elegans. Development. 142(24): 4374–4384. https://doi.org/10.1242/dev.129635
- Nishimura, K., Fukagawa, T., Takisawa, H., Kakimoto, T. and Kanemaki, M. (2009). An auxin-based degron system for the rapid depletion of proteins in nonplant cells. Nat Methods. 6(12): 917–922. https://doi.org/10.1038/nmeth.1401
- Ghanta, K. S., Ishidate, T. and Mello, C. C. (2021). Microinjection for precision genome editing in Caenorhabditis elegans. STAR Protoc. 2(3): 100748. https://doi.org/10.1016/j.xpro.2021.100748
- Friedland, A. E., Tzur, Y. B., Esvelt, K. M., Colaiacovo, M. P., Church, G. M. and Calarco, J. A. (2013). Heritable genome editing in C. elegans via a CRISPR-Cas9 system. Nat Methods. 10(8): 741–743. https://doi.org/10.1038/nmeth.2532
- Brenner, S. (1974). The genetics of Caenorhabditis elegans. Genetics. 77(1): 71–94. https://doi.org/10.1093/genetics/77.1.71
- Negishi, T., Asakawa, M., Kanemaki, M. and Sawa, H. (2019). Modified auxin improves the auxin-inducible degradation (AID) system for laid C. elegans embryos. MicroPubl Biol. 2019. https://doi.org/10.17912/micropub.biology.000190
- Stiernagle, T. (2006). Maintenance of C. elegans. WormBook: The online review of C elegans biology [Internet].
- Porta-de-la-Riva, M., Fontrodona, L., Villanueva, A. and Ceron, J. (2012). Basic Caenorhabditis elegans methods: synchronization and observation. J Vis Exp. (64): e4019. https://doi.org/10.3791/4019
- Ashley, G. E., Duong, T., Levenson, M. T., Martinez, M. A. Q., Johnson, L. C., Hibshman, J. D., Saeger, H. N., Palmisano, N. J., Doonan, R., Martinez-Mendez, R., et al. (2021). An expanded auxin-inducible degron toolkit for Caenorhabditis elegans. Genetics. 217(3). https://doi.org/10.1093/genetics/iyab006
- Aljohani, M. D., El Mouridi, S., Priyadarshini, M., Vargas-Velazquez, A. M. and Frokjaer-Jensen, C. (2020). Engineering rules that minimize germline silencing of transgenes in simple extrachromosomal arrays in C. elegans. Nat Commun. 11(1): 6300. https://doi.org/10.1038/s41467-020-19898-0
- Gibson, D. G., Young, L., Chuang, R. Y., Venter, J. C., Hutchison, C. A., 3rd and Smith, H. O. (2009). Enzymatic assembly of DNA molecules up to several hundred kilobases. Nat Methods. 6(5): 343–345. https://doi.org/10.1038/nmeth.1318
Article Information
Publication history
Received: Jul 22, 2025
Accepted: Sep 16, 2025
Available online: Oct 13, 2025
Published: Oct 20, 2025
Copyright
© 2025 The Author(s); This is an open access article under the CC BY-NC license (https://creativecommons.org/licenses/by-nc/4.0/).
How to cite
van der Salm, E., Kontogiannis, S. and Ruijtenberg, S. (2025). SunTag-Based Single-Molecule Translation Imaging in Caenorhabditis elegans. Bio-protocol 15(20): e5486. DOI: 10.21769/BioProtoc.5486.
Category
Molecular Biology > RNA > mRNA translation
Cell Biology > Cell imaging > Live-cell imaging
Developmental Biology
Do you have any questions about this protocol?
Post your question to gather feedback from the community. We will also invite the authors of this article to respond.