- Protocols

- Articles and Issues
- For Authors
- About
- Become a Reviewer

Image-Based Profiling in Live Cells Using Live Cell Painting
Published: Vol 15, Iss 19, Oct 5, 2025 DOI: 10.21769/BioProtoc.5464 Views: 1807
Reviewed by: Keisuke TabataAnonymous reviewer(s)
Original research article
The authors used this protocol in:
Jul 2025

Protocol Collections
Comprehensive collections of detailed, peer-reviewed protocols focusing on specific topics


Related protocols
Abstract
High-content analysis (HCA) is a powerful image-based approach for phenotypic profiling and drug discovery, enabling the extraction of multiparametric data from individual cells. Traditional HCA protocols often rely on fixed-cell imaging, with assays like cell painting widely adopted as standard. While these methods provide rich morphological information, the integration of live-cell imaging expands analytical capabilities by enabling the study of dynamic biological processes and real-time cellular responses. This protocol presents a simple, cost-effective, and scalable method for live-cell HCA using acridine orange (AO), a metachromatic fluorescent dye that highlights cellular organization by staining nucleic acids and acidic compartments. The assay provides visualization of distinct subcellular structures, including nuclei and cytoplasmic organelles, using a two-channel fluorescence readout. Compatible with high-throughput microscopy and computational analysis, the method supports diverse applications such as phenotypic screening, cytotoxicity assessment, and morphological profiling. By preserving cell viability and enabling dynamic, real-time measurements, this live-cell imaging approach complements existing fixed-cell assays and offers a versatile platform for uncovering complex cellular phenotypes.
Key features
• Builds upon Garcia-Fossa et al. [1], providing an accessible workflow for image-based profiling in live cells.
• Enables phenotypic profiling and dose–response analysis of diverse perturbants, including small molecules, oligonucleotides, and nanoparticles.
• Provides a live-cell framework to detect subtle, sublethal phenotypic changes, overcoming fixation assay limitations in toxicology and drug discovery.
• Includes a streamlined analysis pipeline supporting efficient and reproducible interpretation of image-based data.
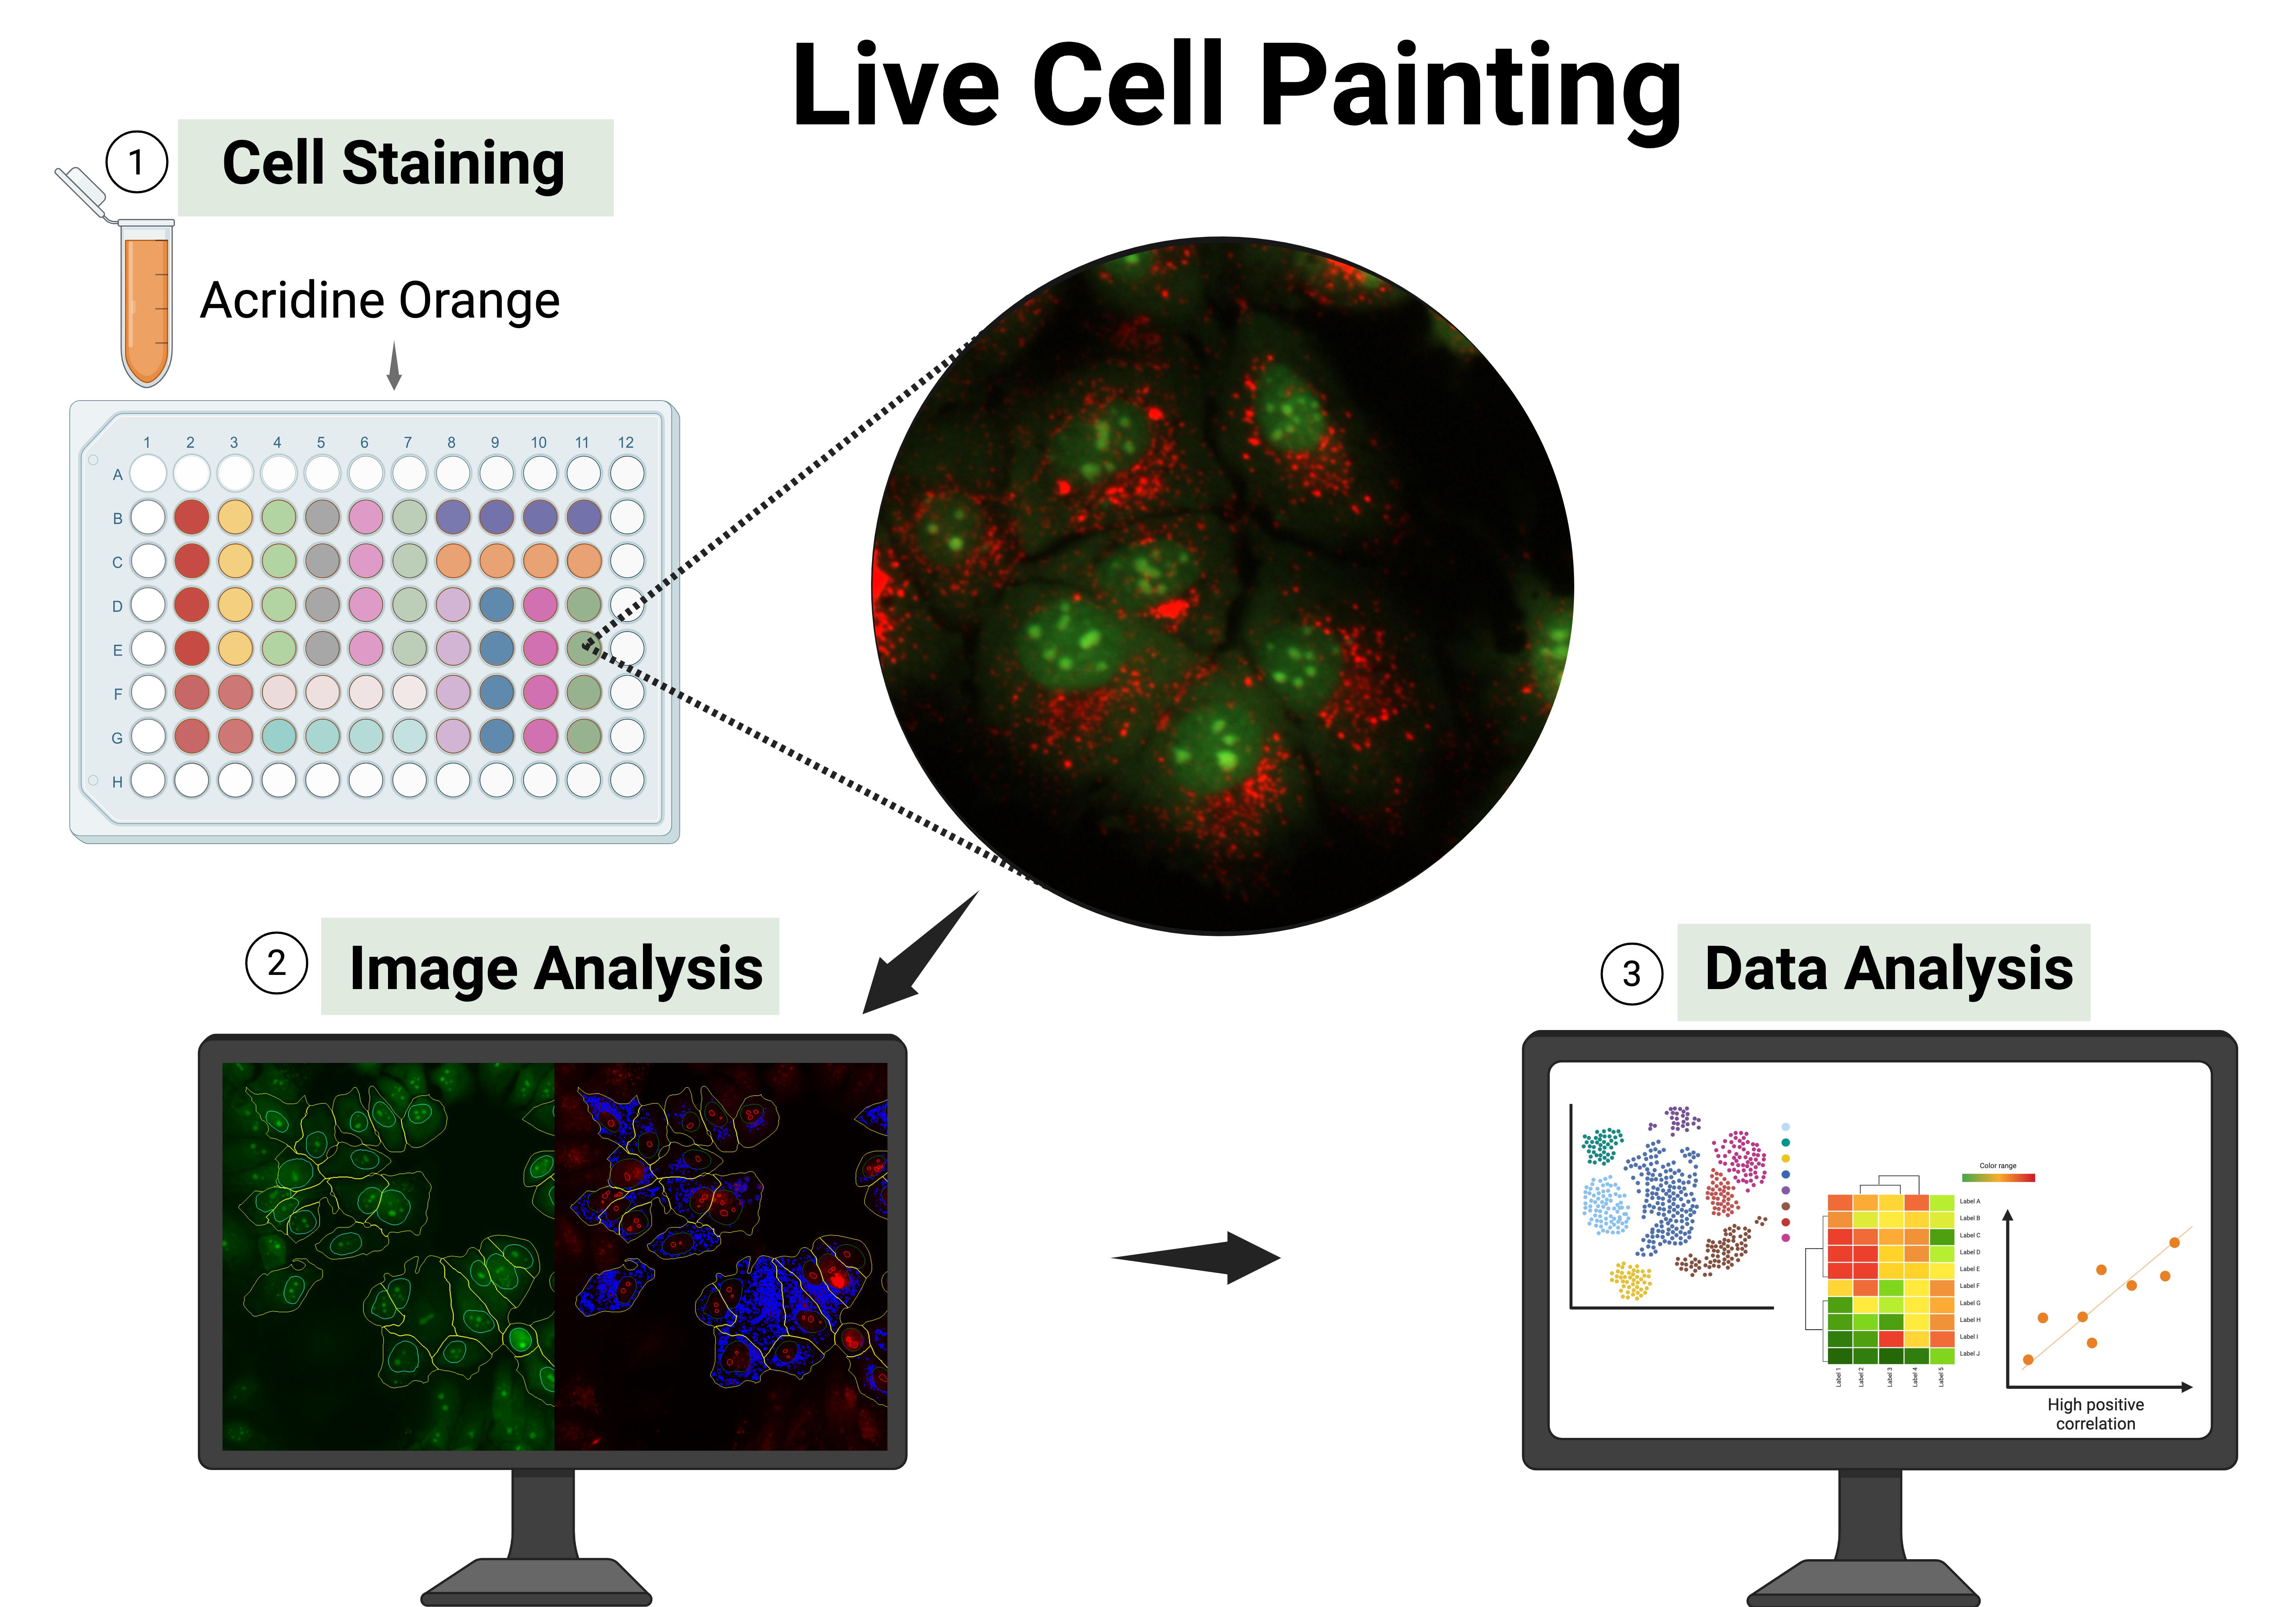
Keywords: Acridine orange stainingGraphical overview
Background
Over the past decades, high-content analysis (HCA) has transformed multiple areas, including basic cell biology, stem cell research, toxicology, developmental biology, and drug discovery, extending even to complex three-dimensional (3D) models [2,3]. This transformation has been driven by advances in automated fluorescence microscopy, the development of versatile fluorescent probes, and rapid progress in computational methods such as image segmentation, feature extraction, and machine learning [4–6]. Together, these tools have created a powerful framework for cellular profiling, enabling the detection of subtle and multifactorial biological responses to perturbations, including small molecules, oligonucleotides, and nanoparticles, that remain inaccessible to conventional techniques [7,8].
A central strategy in HCA relies on fluorescence microscopy, using genetically encoded fluorescent proteins, immunoreagents, fluorescent dyes, or small-molecule probes. These assays typically follow one of two conceptual approaches. The first is a target-based strategy, in which a specific and anticipated biological response is monitored—for example, cellular assays focused on G protein–coupled receptors (GPCRs), ion channels, transporters, DNA damage, or reactive oxygen species (ROS) production [9]. The second approach is unbiased or agnostic to specific biological targets, instead relying on comprehensive staining of cellular architecture. The most prominent technique in this category is cell painting, which labels eight major subcellular structures and has played a key role in advancing the field over the past decade [10]. Most HCA workflows rely on fixed-cell samples, which offer several practical advantages such as ease of handling, compatibility with batch processing, and signal stability. However, fixation can introduce artifacts and eliminates the possibility of capturing live-cell dynamics [11,12]. Additionally, many existing protocols are complex and costly, limiting their accessibility and widespread adoption. Live-cell imaging, in contrast, enables the observation of dynamic biological processes in real time, including the tracking of cellular or subcellular structures, acquisition of kinetic data, analysis of reversible events, and circumvention of fixation-related limitations.
In this protocol, we present live cell painting (LCP), a versatile, cost-effective, and information-rich assay that is simple to implement. This method was established and validated in different cell lines, including Huh-7, MCF-7, PNT1A, and PC3, and can be applied to other cell lines with appropriate concentration adjustments [1]. The method leverages acridine orange (AO), a metachromatic fluorescent dye capable of labeling multiple cellular components in live cells, including nucleic acids and acidic intracellular vesicles (e.g., lysosomes, endosomes, and autophagosolysosomes, among others) (Figures 1 and 2). This dual-channel dye enables multiparametric imaging of various cellular structures, such as nuclei and nucleoli, cytoplasmic organization, cell shape, cell count, and vesicle distribution. The rich morphological and spatial information obtained from AO staining can be applied across a wide range of high-content applications, including phenotypic screening and profiling, target-based screening with morphological readouts, mechanism of action (MoA) elucidation, phenotype recovery assays, toxicity and safety profiling, functional genomics screens (e.g., RNAi or CRISPR), and assays tailored to specific cellular processes. Furthermore, this approach offers a powerful means to generate biologically grounded hypotheses from image-based data. However, like any method, LCP has certain limitations. As with most HCA approaches, it requires access to a fluorescence microscope and imaging-compatible multi-well plates, which may not be readily available in all laboratory settings. Additionally, AO is prone to photobleaching, and its concentration must be carefully optimized for each cell line to avoid cytotoxicity or nonspecific staining. While LCP offers rich morphological insights, complementary assays may still be necessary for a full understanding of cellular function and physiology. Despite these considerations, LCP remains a powerful, cost-effective, and accessible tool for live-cell imaging and high-content morphological profiling.
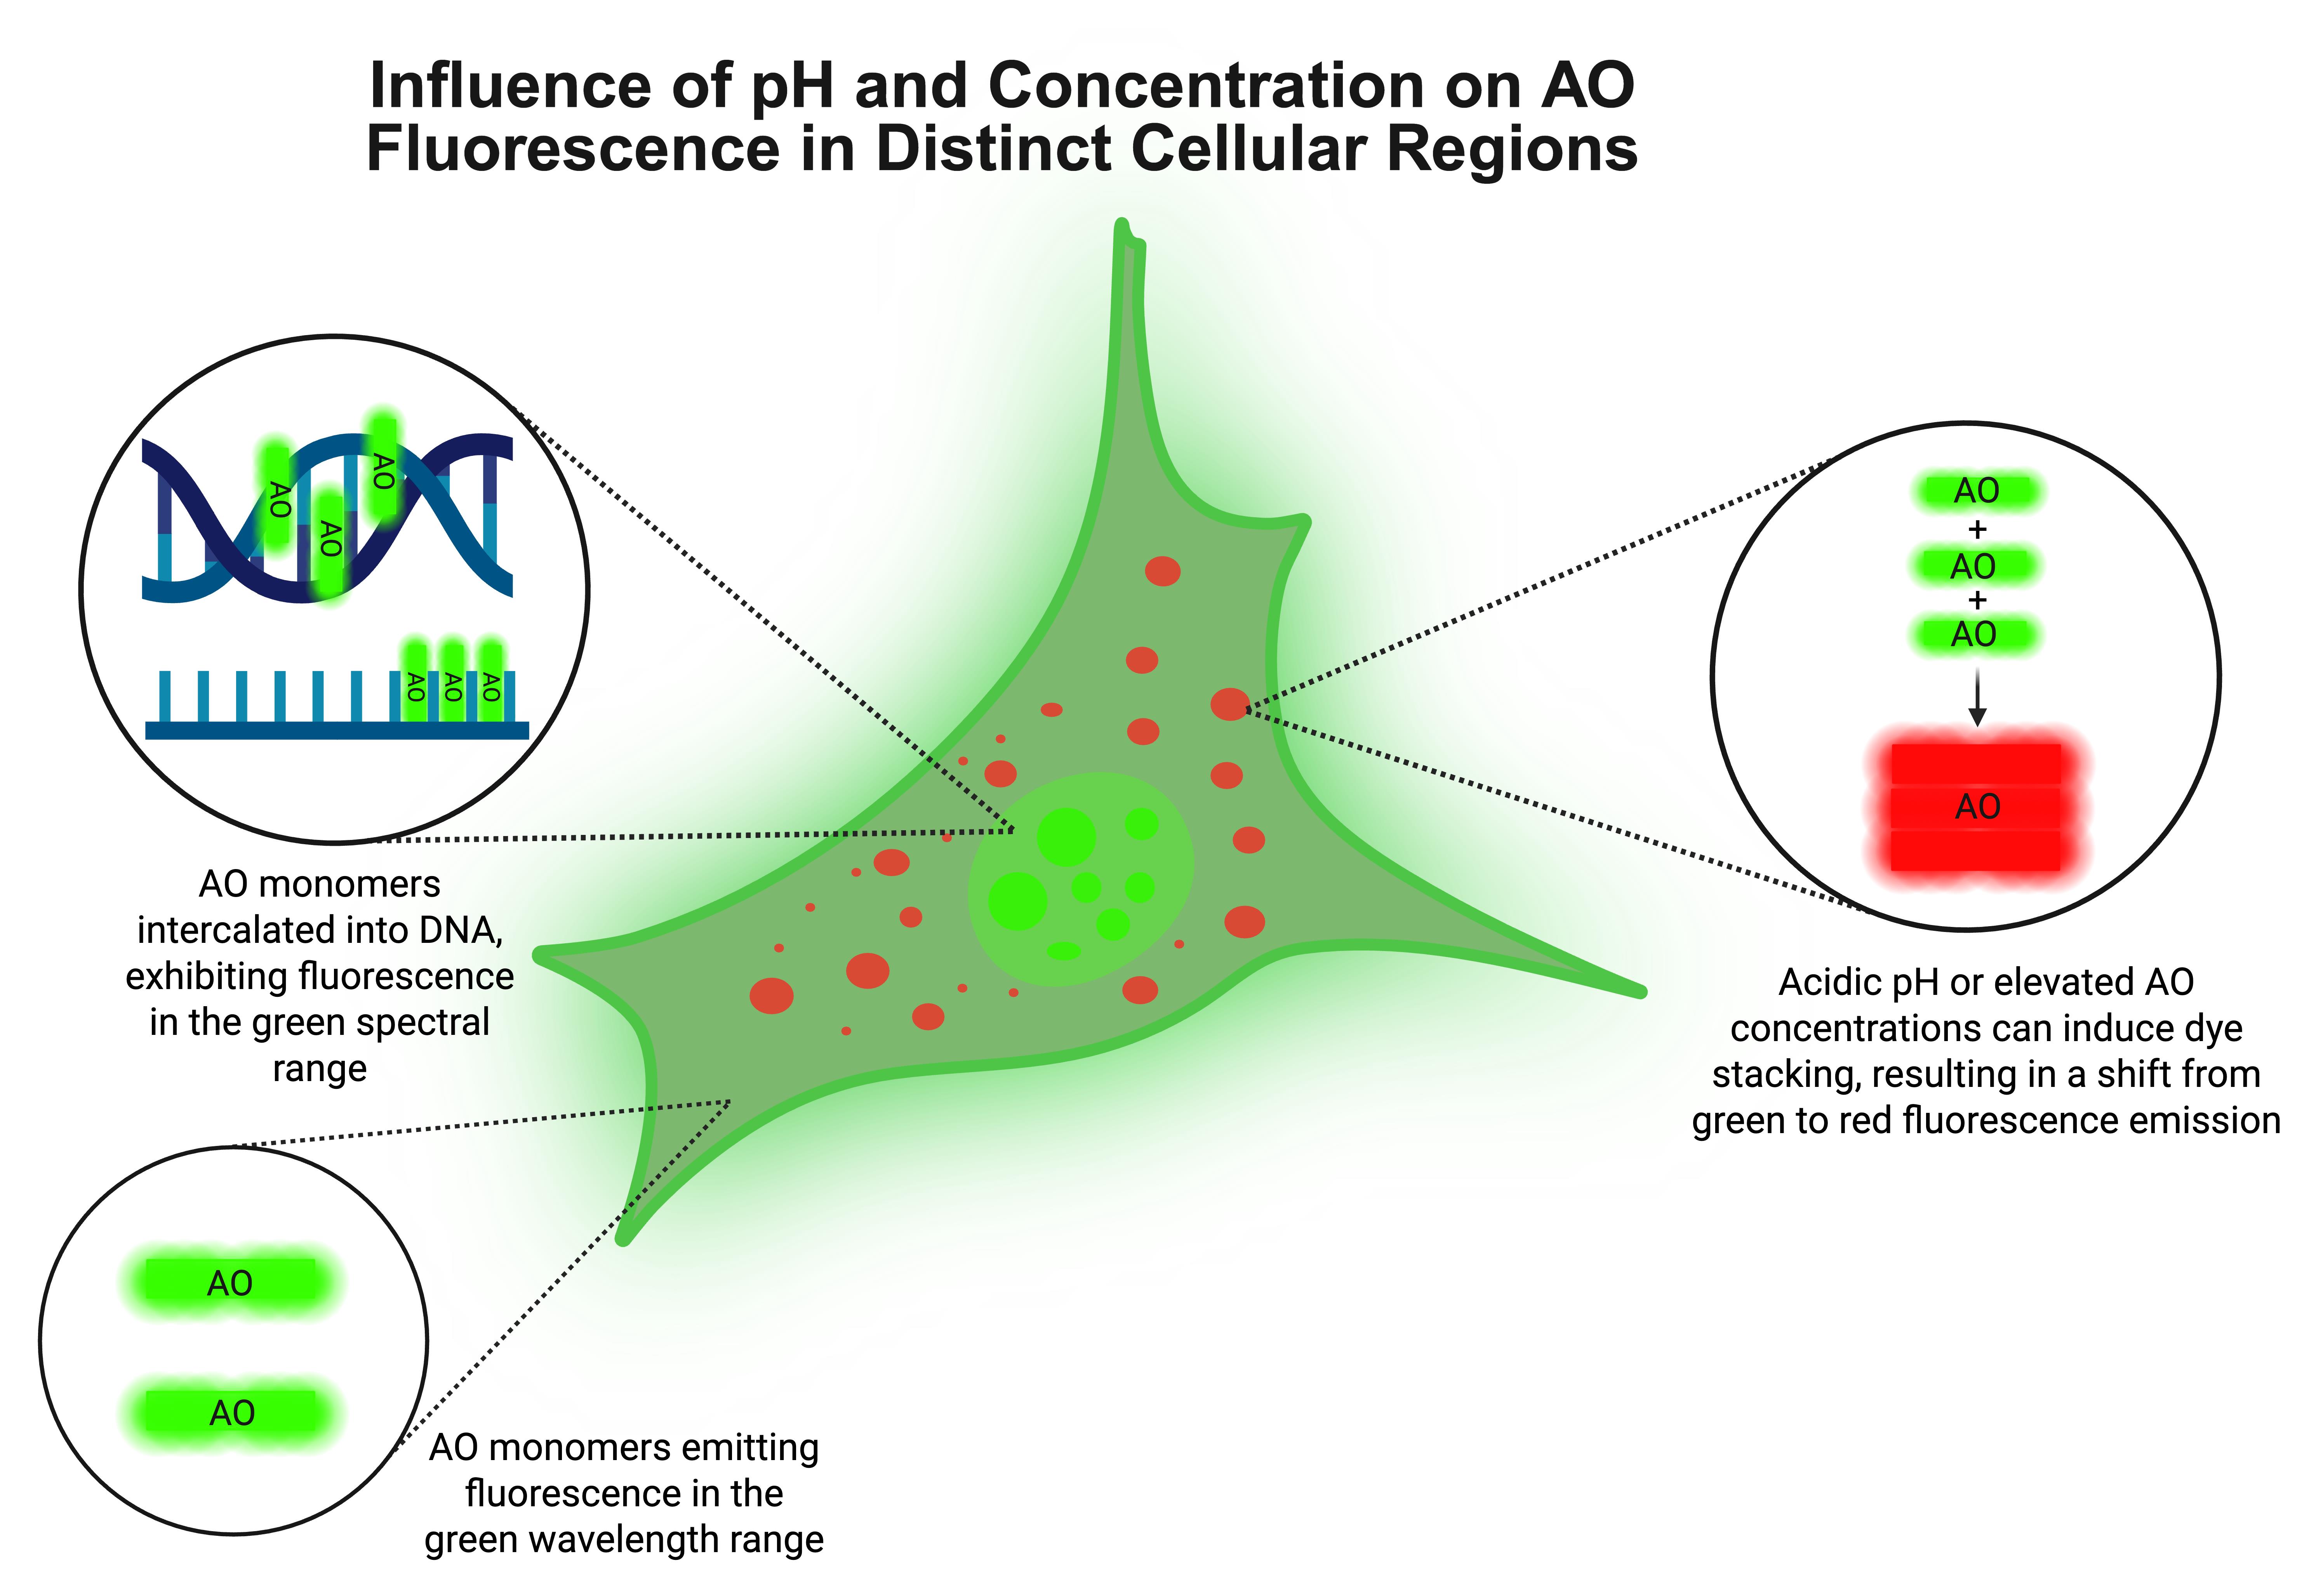
Figure 1. Influence of pH and acridine orange (AO) concentration on its fluorescence behavior in distinct cellular compartments. AO binds nucleic acids by intercalating as monomers into double-stranded DNA and associating electrostatically with single-stranded RNA, both of which result in green fluorescence emission. In acidic compartments, such as lysosomes, or under conditions of high AO concentration, the dye tends to self-aggregate into stacked complexes, shifting its emission from green to red. This dual fluorescence property enables AO to function as a sensitive probe for intracellular localization of nucleic acids, organelle pH, and dye concentration in live-cell imaging.
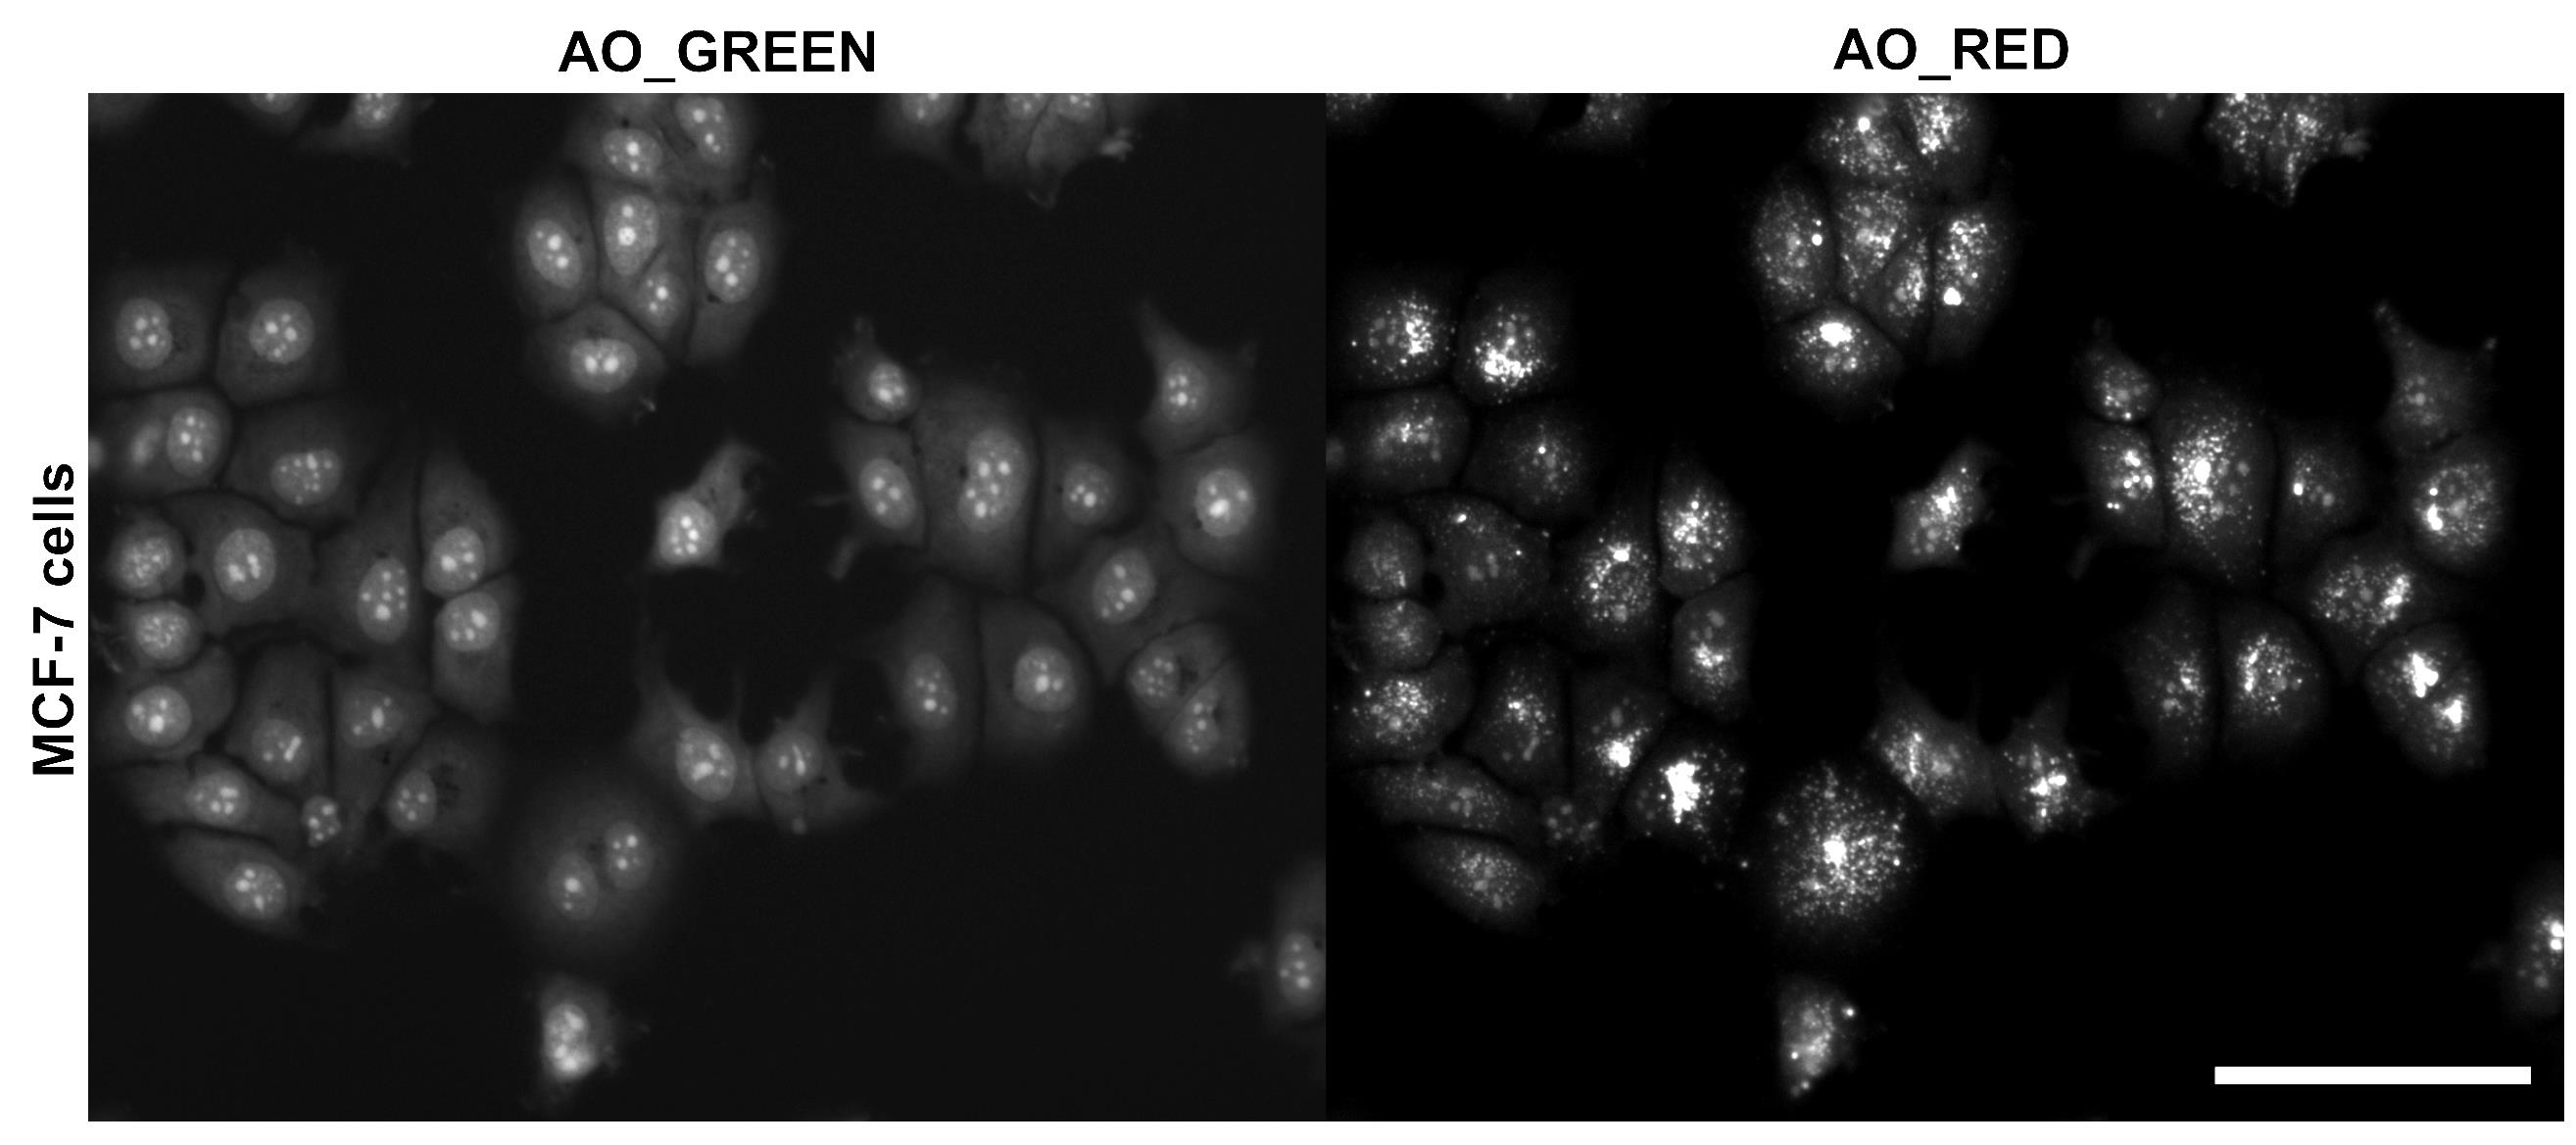
Figure 2. Fluorescence image of MCF-7 cells stained with 10 μM acridine orange (AO), acquired using a 20× objective. The green channel (GFP) highlights nuclei, nucleoli, and cytoplasm, while the red channel (PI) selectively labels acidic vesicular compartments (e.g., lysosomes, endosomes, and autophagolysosomes, among others). Brightness and contrast were adjusted to enhance visualization. The merged image displays the combined spatial distribution of both signals. Scale bar = 100 μm.
Materials and reagents
Biological materials
1. MCF-7 cells (ATCC®, HTB-22TM), stored in liquid nitrogen; under 20 passages and mycoplasma-free
Reagents
1. RPMI-1640 medium (Invitrogen, catalog number: 31800-022)
2. Fetal bovine serum (FBS) (Gibco, catalog number: 12657-029)
3. Penicillin–streptomycin solution (PenStrep or equivalent supplier, catalog number: 15140122)
4. Trypsin–EDTA solution (0.1%) (Sigma-Aldrich or equivalent supplier, catalog number: T4799)
5. Phosphate-buffered saline (PBS) (pH 7.4) (Sigma-Aldrich or equivalent supplier, catalog number: D1283)
6. Trypan blue 0.4% (Invitrogen, catalog number: T10282)
7. Acridine orange (AO) (Sigma-Aldrich or equivalent supplier; catalog number: A1301)
8. FluoroBriteTM DMEM (Gibco, Thermo Fisher Scientific, catalog number: A18967-01)
9. Optional: Hoechst 33342 nuclear stain (Invitrogen, catalog number: H1399)
Equipment
1. Pipettes
2. Flow Hood Class II Type A1 biological safety cabinet (Pachane, model PA-420)
3. Water-Jacketed CO2 incubator (Shel Lab, model: SCO5W)
4. 96-well black polystyrene microplate with μClear® flat bottom (Greiner Bio-One, catalog number: 655090)
5. Fluorescence microscope equipped for live-cell imaging: CytationTM 5 Hybrid Multi-Detection Reader (BioTek Instruments, Inc., Winooski, VT, USA), integrated with a temperature- and CO2-controlled incubation chamber. The system is configured with a 20× Olympus objective plan fluorite with a numerical aperture (NA) of 0.45 and equipped with GFP (EX 469/35 nm, EM 525/39 nm, dichroic mirror 497 nm, LED 465 nm), PI (EX 531/40 nm, EM 647/57 nm, dichroic mirror 605 nm, LED 523 nm), and DAPI (EX 377/50 nm, EM 447/60 nm, dichroic mirror 409 nm, LED 365 nm) filter sets for fluorescence acquisition.
6. Workstation used for image analysis and data processing: Intel® CoreTM i7-14700KF processor (Raptor Lake, 20 cores/28 threads, 10 nm), NVIDIA® GeForce RTXTM 4070 Ti GPU (12 GB GDDR6X), 32 MB L3 cache, and 1920 × 1080 LG Full HD monitor.
Software and datasets
1. Image processing, quality control, and feature extraction were performed using CellProfiler (version 4.2.5, Broad Institute) and CellProfiler Analyst (version 3.0.4, Broad Institute). Additionally, CellPose (version 2.2.3), an open-source deep learning-based segmentation tool, was used for refined segmentation when needed.
2. Data analysis platform: Python (version 3.12.3), using machine learning libraries (e.g., scikit-learn, pandas, pycytominer).
3. All data and code have been deposited to GitHub: https://github.com/broadinstitute/scripts_notebooks_fossa (access date 06/30/2025)
Procedure
A. Cell culture and preparation
1. Culture MCF-7 cells (ATCC®, HTB-22TM) in RPMI 1640 medium supplemented with 10% FBS and 1% penicillin–streptomycin (PenStrep) at 37 °C, 5% CO2, and 83% humidity until approximately 80% confluency is reached.
2. Detach cells using 0.1% trypsin at 37 °C until cells are fully detached.
3. Stain cells with 0.4% trypan blue and count viable cells using a hemocytometer or automated counter.
4. Seed 8 × 10² viable cells per well in a 96-well black μClear® plate. To prevent edge effects, such as medium evaporation, do not plate cells in the peripheral wells; instead, fill these wells with sterile water or PBS. To minimize batch effects, vary the plate layout across experimental replicates by dispensing cells in a randomized, non-sequential pattern, rather than following consistent row- or column-based arrangements.
5. Rest the plate inside a laminar flow hood for 20 min to allow cells to settle and adhere evenly across the well surface, reducing the likelihood of peripheral well-edge adherence artifacts.
6. Incubate the plate for 24 h in a humidified incubator at 37 °C, 5% CO2, and 95% humidity.
B. Staining with acridine orange
1. Prepare a 1 mM stock solution of AO in distilled water. Store at -20 °C. This reagent is stable for a few weeks when kept under these conditions.
2. Dilute the stock in non-supplemented RPMI 1640 medium to obtain a 10 μM working solution. This concentration has been optimized for MCF-7 cells and may require adjustment for other cell lines depending on their dye uptake and sensitivity (see General note 1).
3. Carefully aspirate the culture medium from each well and add 100 μL of the 10 μM AO working solution.
4. Incubate the plate for 10 min at 37 °C in a 5% CO2 incubator.
5. Remove the AO solution and replace it with 100 μL of FluoroBriteTM DMEM medium.
6. Optional: Some cell lines may present challenges for nuclear segmentation; therefore, co-staining with Hoechst 33342 (1 μg/mL, 20 min at 37 °C) is recommended. This is particularly useful for cell types with complex morphologies that hinder whole-cell segmentation, such as those forming dense clusters or islands (e.g., HepG2), extending long projections (e.g., SH-SY5Y, Walker), or exhibiting weak nuclear labeling in the AO green channel. Additionally, certain perturbations may alter AO staining patterns, reducing signal intensity or consistency. Hoechst provides a bright and specific nuclear signal that, when combined with the broad compartment labeling of AO in the green channel (e.g., cytoplasm, nucleoli), enables the construction of stacked images suitable for training segmentation models (e.g., in CellPose). In this strategy, the Hoechst signal serves as a positional anchor to support accurate delineation of cell boundaries based on the AO-green channel. Hoechst can be added directly during the medium replacement step with FluoroBrite, following AO incubation.
7. Proceed immediately to imaging.
C. Live imaging
1. Place the plate on a fluorescence microscope equipped for live-cell imaging (e.g., CytationTM 5 Hybrid Multi-Detection Reader) with environmental control to maintain 37 °C and 5% CO2. If the microscope does not support CO2 regulation, an alternative is to supplement the FluoroBrite medium with HEPES buffer to stabilize pH during imaging. This condition must be optimized in advance to ensure that cells maintain viability and normal morphology throughout the imaging period.
2. Configure acquisition settings as follows:
• Objective: 20×
• Channels:
GFP: excitation/emission = 469/525 nm
PI: excitation/emission = 531/647 nm
DAPI (optional): excitation/emission = 377/447 nm
• Acquire at least 9 fields of view per well.
• Perform autofocus using the GFP channel and apply the same focal plane for PI acquisition. For cells co-stained with Hoechst, it is recommended to perform autofocus on the DAPI channel instead, as it often yields faster and more reliable focusing. Once focus is established on the DAPI channel, apply the same settings to both GFP and PI channels to ensure consistent image alignment.
D. Image analysis
1. Perform initial image quality control using CellProfiler and CellProfiler Analyst. It is important to be familiar with the morphology of the cells being studied and to ensure that their morphology remains normal when stained with AO. It is also crucial to avoid saturated and out-of-focus images and over-confluent cells (Figure 3).
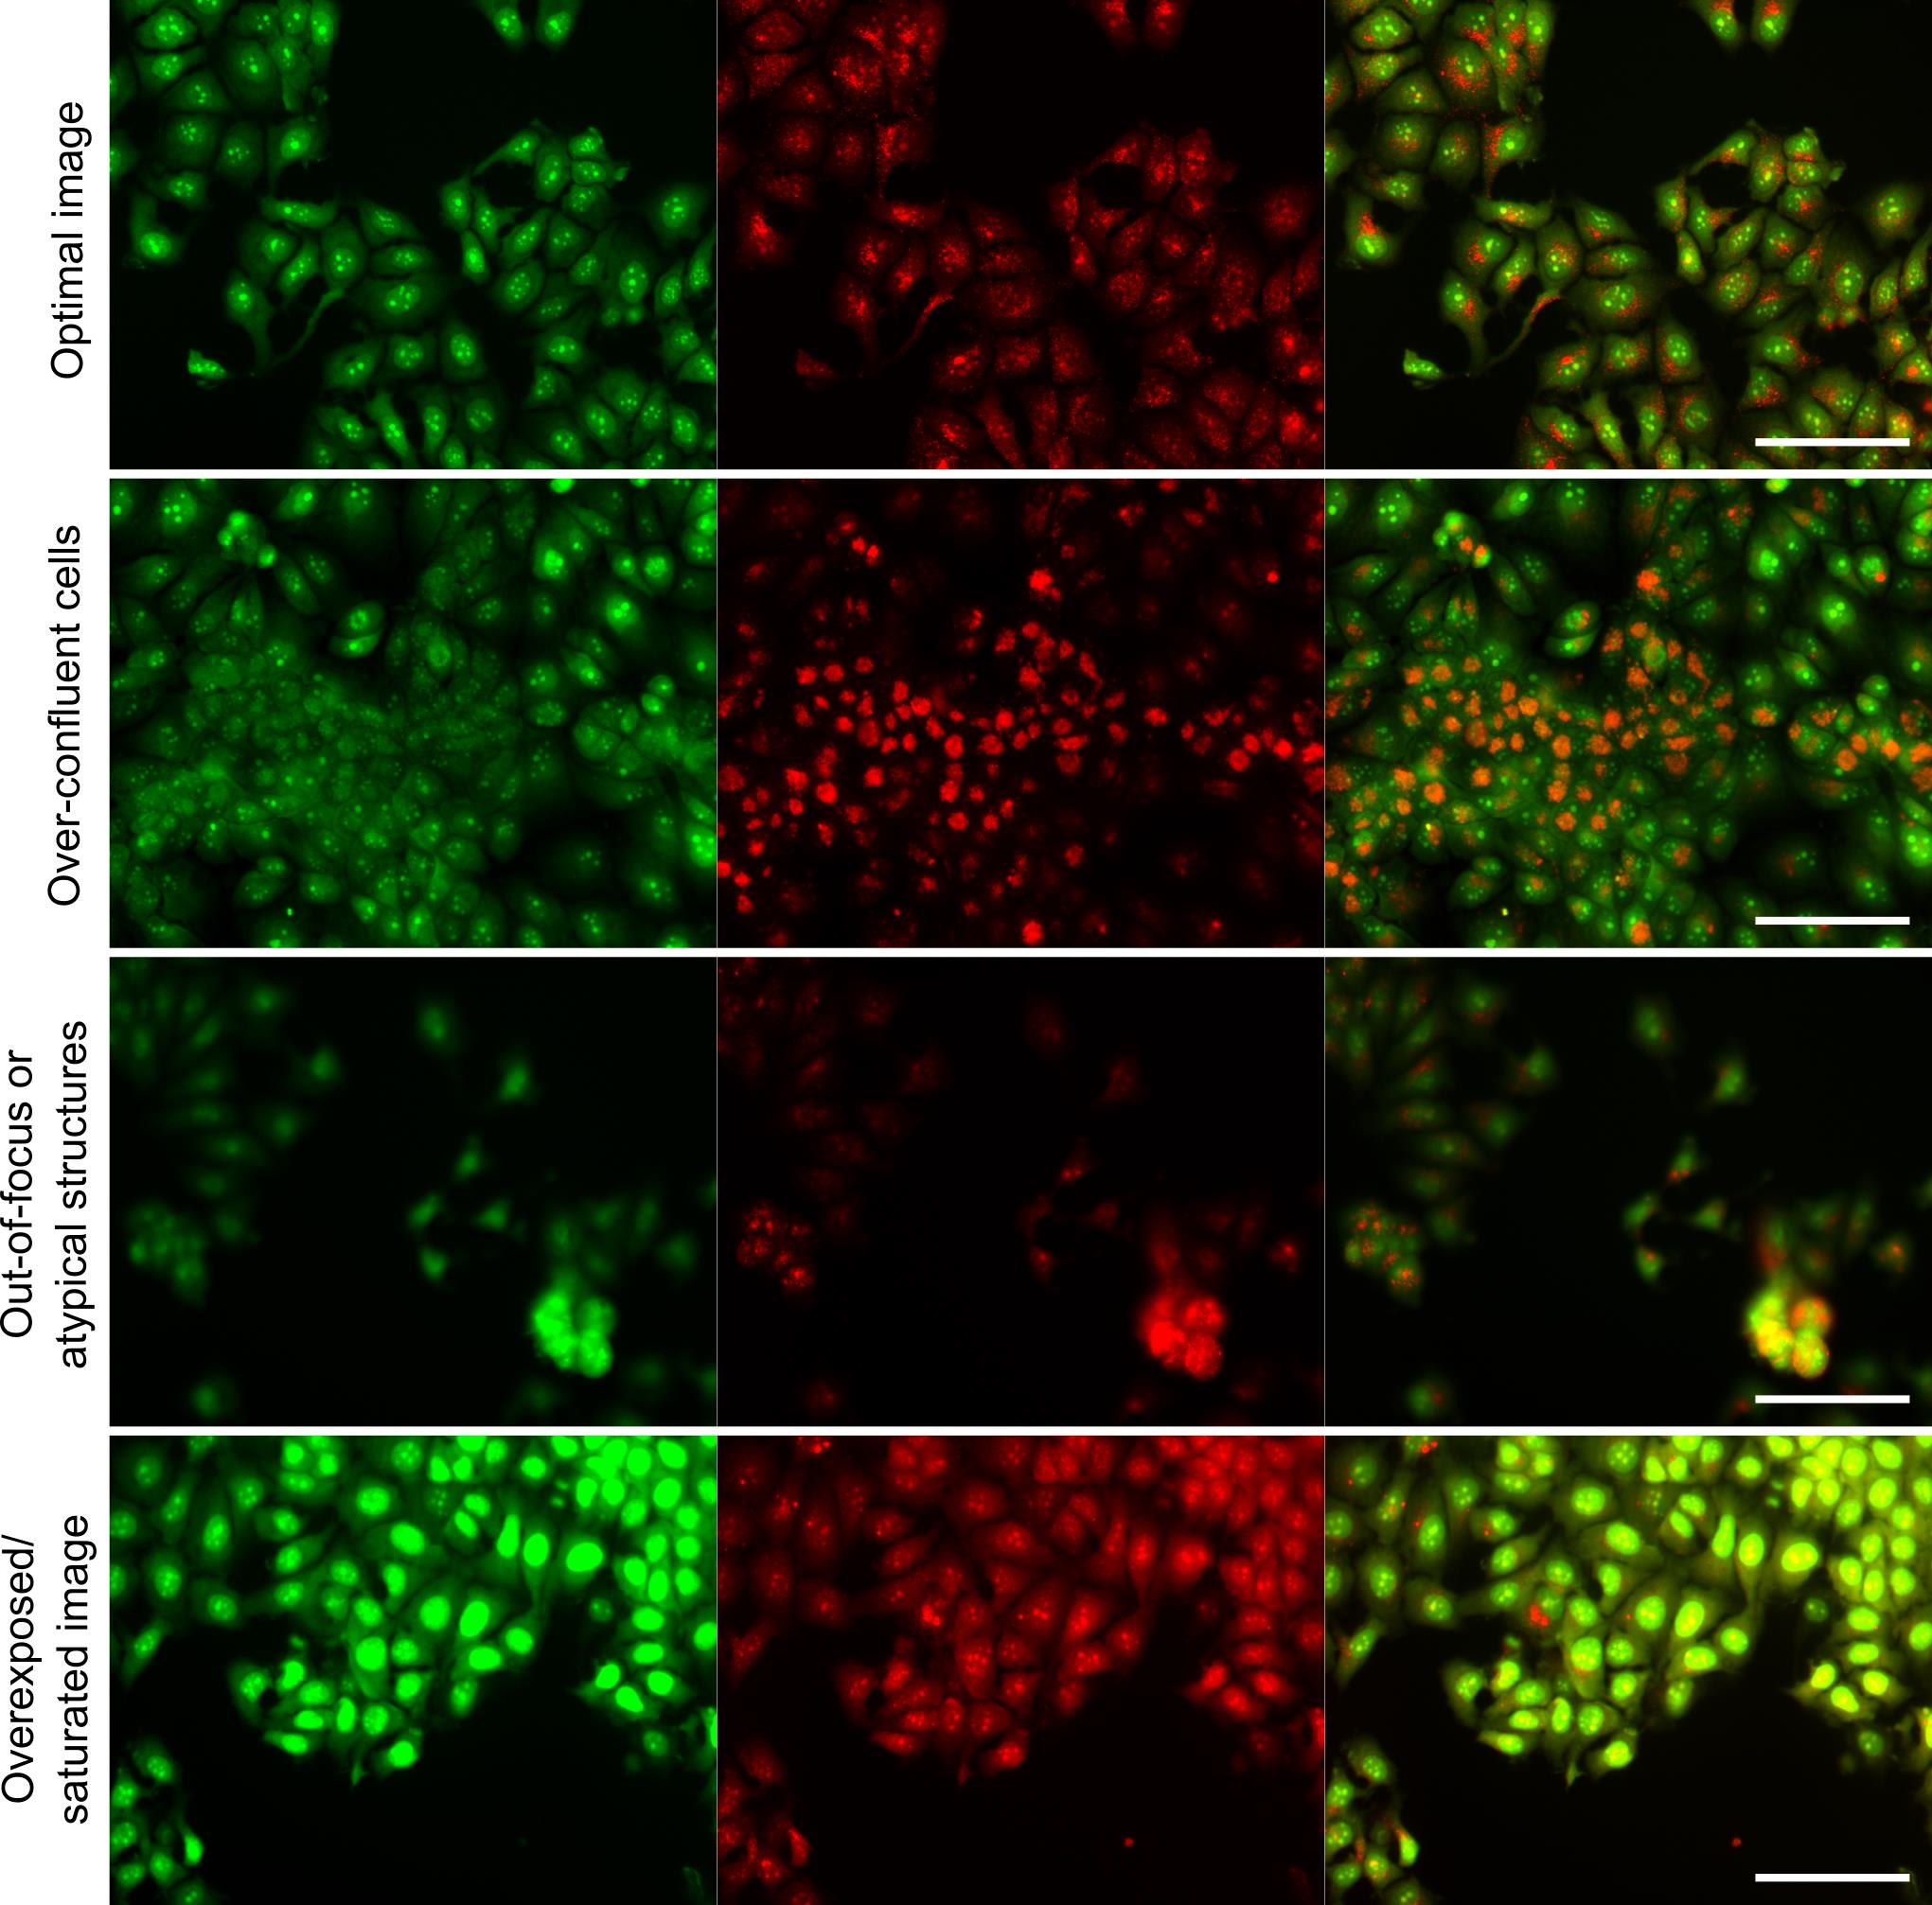
Figure 3. Representative images illustrating quality control. (A) Optimal image. (B–D) Examples of images that should be excluded from analysis: over-confluent cells (B), out-of-focus or atypical structures (C), and overexposed/saturated images (D). Image intensities were adjusted for visualization purposes only and were not altered for analysis. Scale bar = 100 μm.
2. Create a CellProfiler pipeline including the following modules:
a. Select one representative image from each experiment to create the training and test sets for segmentation.
b. For cells stained only with AO:
i. Train a CellPose model of cells stained with AO (GFP channel) to detect nuclei using the CellPose GUI [13].
ii. Use the RunCellpose plugin in CellProfiler [14] to segment nuclei in all images with the trained model.
iii. Segment the cell boundaries using the AO-GFP channel via the propagation method in CellProfiler, which defines boundaries based on proximity and intensity gradients.
c. For cells co-stained with Hoechst 33342:
i. Perform nuclear segmentation using the DAPI channel (Hoechst-stained nuclei). A pre-trained CellPose model available in the RunCellpose module in CellProfiler can be used.
ii. In Fiji software, create a stack combining the DAPI image (nuclei) with the corresponding AO-GFP image (cytoplasm).
iii. Use this stack to train a custom CellPose model in the CellPose GUI, using the DAPI channel as a positional anchor and segmenting the GFP channel.
iv. Use the RunCellpose plugin in CellProfiler to segment cells in all images (AO in GFP channel) with the trained model.
d. Create a segmentation pipeline in CellProfiler v4.2.5 to identify nuclei, cytoplasm, whole cell, nucleoli, and vesicles (Figure 4).
e. Validate segmentation visually using overlays (Figure 5).
f. Run all image segmentation on CellProfiler.
g. Extract features including:
i. Area and shape (e.g., perimeter, HuMoment)
ii. Intensity (e.g., mean, integrated, per object, and channel)
iii. Texture (e.g., Haralick features)
iv. Radial distribution across concentric cell rings for AO-GFP and AO-Red channels.
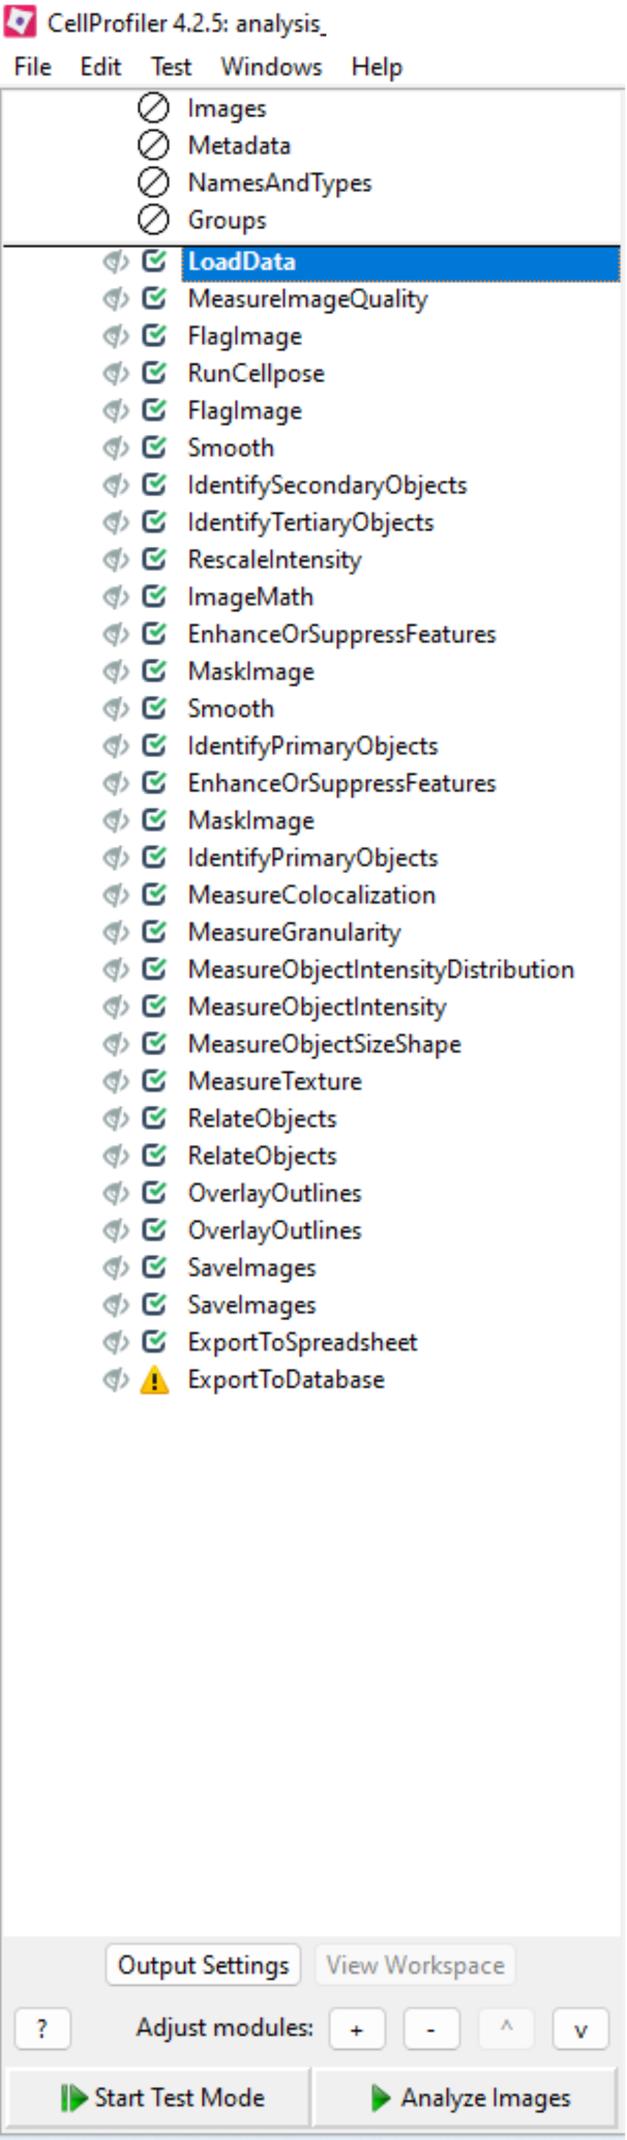
Figure 4. Example of a CellProfiler pipeline used for feature extraction, illustrating key analysis modules applied to segment and quantify cellular structures
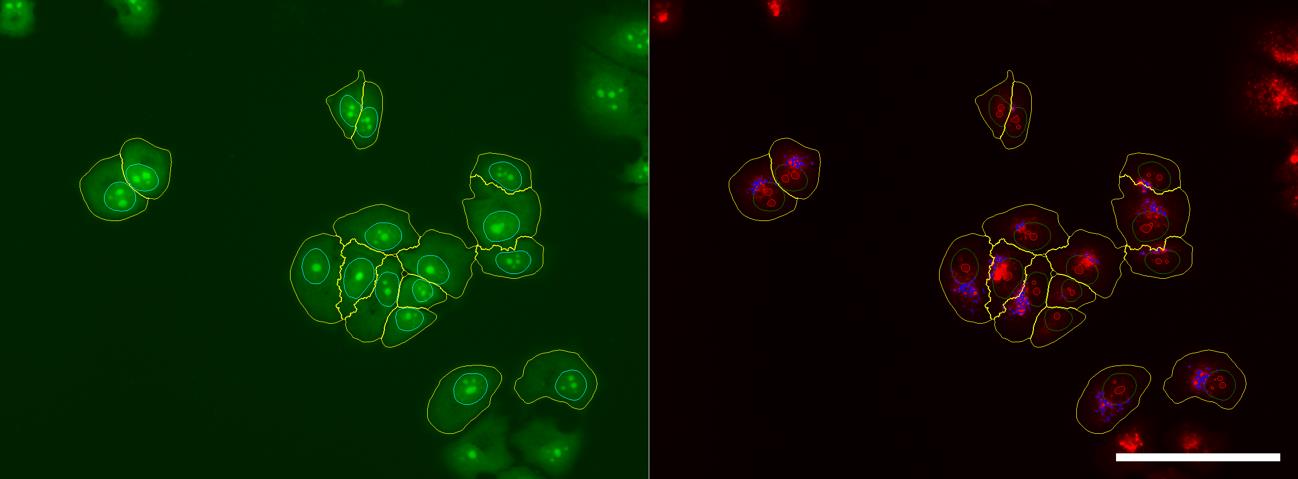
Figure 5. Outlines of fluorescence image of MCF-7 cells stained with acridine orange (AO) and segmented using CellProfiler. Cells were stained with 10 μM of AO and acquired using a 20× objective lens. The green channel (GFP filter) highlights the nuclei and cytoplasmic outlines. The red channel (PI filter) delineates acidic vesicular compartments as well as features within the cytoplasm, nuclei, and nucleoli. Scale bar = 100 μm.
Data analysis
1. Use Pycytominer’s collate function to merge .csv files generated per site into a single dataset [15].
2. Aggregate single-cell data into well-level profiles using the median function via Pycytominer’s aggregate. The median is used to reduce the influence of outliers and cell-to-cell variability, providing a robust summary of the phenotypic profile within each well.
3. Annotate aggregated profiles with experimental metadata (compound, concentration, plate ID, cell type).
4. Normalize features per plate relative to the negative control using the RobustMAD method:
5. Use Pycytominer’s feature_select function; configure to remove:
• Features with >5% missing values.
• Features with low variance.
• Features with Pearson correlation > 0.9.
• Features with outliers > 500.
6. Apply batch correction using pyCombat [16] to correct day-of-experiment effects.
7. The data is now ready for downstream analyses, which may include multivariate analyses, such as dimensionality reduction, unsupervised clustering, and classification, as well as statistical testing using standard methods.
8. Replicates:
We recommend three technical replicates per condition per plate and two biological replicates (independent passages or plates).
To reduce batch effects associated with plate position, vary the treatment layout (i.e., well positions) across biological replicates. Avoid assigning the same treatments to the same wells or arranging them in the same sequence across experiments. Instead, randomize or rotate the positions of each treatment to evenly distribute potential positional biases and minimize systematic variation.
9. Required skills and tools:
• Beginner/intermediate Python programming skills.
• Experience with Jupyter Notebooks.
• Familiarity with CellProfiler, Pycytominer, pyCombat, Seaborn, Scikit-learn.
10. Published reference:
The complete CellProfiler pipeline and profiling approach is described in detail in the GitHub repository: https://github.com/broadinstitute/scripts_notebooks_fossa.
Validation of protocol
This protocol has been used and validated in the following research article:
• Garcia-Fossa et al. [1]. Live-cell painting: Image-based profiling in live cells using acridine orange. Molecular Biology of the Cell, vol. 36, no. 7, p. mr7, 2025, doi: 10.1091/mbc.E24-07-0308
In this study, the protocol was applied to live-cell image-based profiling across multiple biological replicates and different cell lines. To demonstrate phenotypic sensitivity, cells were treated with a range of compounds known to induce distinct morphological responses. Both negative and positive controls were included to ensure the reliability and reproducibility of the results. Data analysis included dimensionality reduction (UMAP) and hierarchical clustering (HDBSCAN) to confirm reproducibility and biological relevance. The results demonstrated high consistency across replicates and effective separation of phenotypic profiles, supporting the protocol’s robustness. A detailed description of the validation experiments and results can be found in the published article.
General notes and troubleshooting
General notes
1. Optimization of AO concentration: Before starting the assay, perform an ATP-based viability assay to assess the cytotoxicity of AO for the specific cell line of interest. Incubate cells with a range of AO concentrations (e.g., 2.5, 5, 10, 20, and 40 μM) for 4 h, or for the average total imaging time required for your system to capture the entire plate. This ensures that AO remains non-toxic throughout the imaging process. In parallel, acquire fluorescence images for each concentration to evaluate staining quality and identify the optimal condition for your cell line.
2. Criteria for AO concentration selection: Select a concentration that:
• Does not reduce cell viability compared to vehicle-treated control wells (preferably >90% viability).
• Allows clear visualization of nuclei, nucleoli, and cytoplasm in the green wavelength without vesicle staining.
• Results in exclusive vesicle labeling in the red wavelength, with no nuclear or cytoplasmic background.
Note: Each cell line may require different AO concentrations; thus, optimization is essential for every new model.
3. AO sensitivity to cellular state: It is important to note that although AO, at optimal concentrations and under healthy cell states, typically exhibits green fluorescence in the cytoplasm, nuclei, and nucleoli, and red fluorescence in acidic vesicles, this behavior may change when cells are under stress. Under such conditions, structures other than acidic vesicles may also emit red fluorescence, as demonstrated in some of the images included in this protocol.
4. Hoechst 33342 optional staining: For cell lines with complex morphology that impairs whole-cell segmentation—such as those growing in dense clusters or islands (e.g., HepG2), exhibiting extensive cellular projections (e.g., SH-SY5Y, Walker), or showing weak nuclear labeling in the AO green channel—co-staining with Hoechst 33342 (1 μg/mL, 20 min at 37 °C) is recommended. Hoechst provides a distinct nuclear signal that, when combined with the green fluorescence channel of AO (which labels multiple compartments, including the cytoplasm), enables the creation of stacked images for training segmentation models (e.g., in CellPose). In this approach, the Hoechst signal acts as a positional anchor to guide accurate cell boundary detection using the AO-green channel. Hoechst should be added concurrently with FluoroBrite DMEM during the replacement of the AO solution.
5. Avoiding over-confluency: Cells should not exceed 80%–85% confluency at the time of staining. High confluency can impair image quality and hinder proper cell segmentation.
6. AO removal and medium replacement: After 10 min of incubation with AO, it is critical to remove the AO solution and replace it with FluoroBrite DMEM. Residual AO can increase the background signal and affect staining specificity.
7. Plate type requirements: Use imaging-compatible 96-well plates with a thin, optically clear bottom, such as μClear® plates. Plates not designed for microscopy may distort imaging or reduce signal clarity.
8. Illumination and photobleaching control: Include extra wells specifically for setting illumination intensity and autofocus parameters. This helps minimize bleaching or light exposure variability across experimental wells.
9. Controls for high content screening (HCS): For HCS assays involving treatments or perturbations:
• Include positive and negative controls (e.g., known modulators and vehicle-treated wells) evenly distributed across the plate to ensure robust normalization and assay performance.
• Controls should represent at least 15%–20% of the total plate.
For staining-only or profiling protocols:
• Vehicle-treated wells are sufficient as controls but should still cover at least 15% of the plate layout.
10. Randomized plating: To minimize positional bias, cells should be plated in a non-sequential manner or using a randomized plating across the plate. Systematic plating (e.g., row-by-row) may introduce unintended correlations between well position and experimental outcomes, especially in high-throughput or imaging-based assays. Randomization ensures a more uniform distribution of potential confounding factors and enhances the reproducibility of the results.
11. Light sensitivity of AO: AO is light-sensitive and prone to photobleaching. All steps involving AO preparation, staining, and incubation should be performed with minimal light exposure. Use amber tubes or wrap containers in aluminum foil, and keep the plate protected from direct light to preserve dye integrity and signal quality during imaging.
Acknowledgments
Conceptualization, T.M.-L. and M.R.-S.; Investigation, T.M.-L. and M.R.-S.; Writing—Original Draft, T.M.-L. and M.R.-S.; Writing—Review & Editing, M.B.J. and S.S.; Funding acquisition, M.B.J.; Supervision, M.B.J. This work was supported by the Coordination for the Improvement of Higher Education Personnel, Brazil (CAPES), Funding Code 001; the São Paulo Research Foundation (FAPESP, grants no. 2023/06143-0 and 2020/01218-3); the National Council for Scientific and Technological Development (CNPq); and the Support Fund for Teaching, Research, and Extension (FAEPEX, UNICAMP, grants no. 2633/17, 2421/20, 2237/21, 2178/22, and 2534/23). The methodology applied in this study is based on the protocol described and validated in Garcia-Fossa et al. [1].
Competing interests
This work was supported by funds provided by São Paulo Research Foundation (FAPESP) #2022/01483-4, #2019/24033-1, #2023/06143-0, and #2020/01218-3. S.S. serves as scientific advisor for companies that use image-based profiling and Cell Painting (Waypoint Bio, Dewpoint Therapeutics, Deepcell) and receives honoraria for occasional scientific visits to pharmaceutical and biotechnology companies.
References
- Garcia-Fossa, F., Moraes-Lacerda, T., Rodrigues-da-Silva, M., Diaz-Rohrer, B., Singh, S., Carpenter, A. E., Cimini, B. A. and de Jesus, M. B. (2025). Live-cell painting: Image-based profiling in live cells using acridine orange. Mol Biol Cell. 36(7): ee24–07–0308. https://doi.org/10.1091/mbc.e24-07-0308
- Lin, S., Schorpp, K., Rothenaigner, I. and Hadian, K. (2020). Image-based high-content screening in drug discovery. Drug Discov. 25(8): 1348–1361. https://doi.org/10.1016/j.drudis.2020.06.001
- Way, G. P., Sailem, H., Shave, S., Kasprowicz, R. and Carragher, N. O. (2023). Evolution and impact of high content imaging. SLAS Discovery. 28(7): 292–305. https://doi.org/10.1016/j.slasd.2023.08.009
- Scheeder, C., Heigwer, F. and Boutros, M. (2018). Machine learning and image-based profiling in drug discovery. Curr Opin Syst Biol. 10: 43–52. https://doi.org/10.1016/j.coisb.2018.05.004
- Tang, Q., Ratnayake, R., Seabra, G., Jiang, Z., Fang, R., Cui, L., Ding, Y., Kahveci, T., Bian, J., Li, C., et al. (2024). Morphological profiling for drug discovery in the era of deep learning. Briefings Bioinf. 25(4): e1093/bib/bbae284. https://doi.org/10.1093/bib/bbae284
- Vamathevan, J., Clark, D., Czodrowski, P., Dunham, I., Ferran, E., Lee, G., Li, B., Madabhushi, A., Shah, P., Spitzer, M., et al. (2019). Applications of machine learning in drug discovery and development. Nat Rev Drug Discovery. 18(6): 463–477. https://doi.org/10.1038/s41573-019-0024-5
- Almeida, T. L., Moreira, A. F., de Oliveira, J. L., Rogerio, C. B., Kiihl, S. F., Fraceto, L. F. and de Jesus, M. B. (2024). A multiparametric and orthogonal approach indicates low toxicity for zein nanoparticles in a repellent formulation. Toxicol in Vitro. 95: 105747. https://doi.org/10.1016/j.tiv.2023.105747
- Dahlin, J. L., Hua, B. K., Zucconi, B. E., Nelson, S. D., Singh, S., Carpenter, A. E., Shrimp, J. H., Lima-Fernandes, E., Wawer, M. J., Chung, L. P. W., et al. (2023). Reference compounds for characterizing cellular injury in high-content cellular morphology assays. Nat Commun. 14(1): e1038/s41467–023–36829–x. https://doi.org/10.1038/s41467-023-36829-x
- Chin, M. Y., Espinosa, J. A., Pohan, G., Markossian, S. and Arkin, M. R. (2021). Reimagining dots and dashes: Visualizing structure and function of organelles for high-content imaging analysis. Cell Chem Biol. 28(3): 320–337. https://doi.org/10.1016/j.chembiol.2021.01.016
- Seal, S., Trapotsi, M. A., Spjuth, O., Singh, S., Carreras-Puigvert, J., Greene, N., Bender, A. and Carpenter, A. E. (2024). Cell Painting: a decade of discovery and innovation in cellular imaging. Nat Methods. 22(2): 254–268. https://doi.org/10.1038/s41592-024-02528-8
- Schnell, U., Dijk, F., Sjollema, K. A. and Giepmans, B. N. G. (2012). Immunolabeling artifacts and the need for live-cell imaging. Nat Methods. 9(2): 152–158. https://doi.org/10.1038/nmeth.1855
- Wang, W., Douglas, D., Zhang, J., Kumari, S., Enuameh, M. S., Dai, Y., Wallace, C. T., Watkins, S. C., Shu, W., Xing, J., et al. (2020). Live-cell imaging and analysis reveal cell phenotypic transition dynamics inherently missing in snapshot data. Sci Adv. 6(36): eaba9319. https://doi.org/10.1126/sciadv.aba9319
- Pachitariu, M. and Stringer, C. (2022). Cellpose 2.0: how to train your own model. Nat Methods. 19(12): 1634–1641. https://doi.org/10.1038/s41592-022-01663-4
- Weisbart, E. and Cimini, B. A. (2023). Distributed-Something: scripts to leverage AWS storage and computing for distributed workflows at scale. Nat Methods. 20(8): 1120–1121. https://doi.org/10.1038/s41592-023-01918-8
- Serrano, E., Chandrasekaran, S. N., Bunten, D., Brewer, K. I., Tomkinson, J., Kern, R., Bornholdt, M., Fleming, S. J., Pei, R., Arevalo, J., et al. (2025). Reproducible image-based profiling with Pycytominer. Nat Methods. 22(4): 677–680. https://doi.org/10.1038/s41592-025-02611-8
- Behdenna, A., Colange, M., Haziza, J., Gema, A., Appé, G., Azencott, C. A. and Nordor, A. (2023). pyComBat, a Python tool for batch effects correction in high-throughput molecular data using empirical Bayes methods. BMC Bioinf. 24(1): e1186/s12859–023–05578–5. https://doi.org/10.1186/s12859-023-05578-5
Article Information
Publication history
Received: Jul 22, 2025
Accepted: Aug 29, 2025
Available online: Sep 15, 2025
Published: Oct 5, 2025
Copyright
© 2025 The Author(s); This is an open access article under the CC BY-NC license (https://creativecommons.org/licenses/by-nc/4.0/).
How to cite
Readers should cite both the Bio-protocol article and the original research article where this protocol was used:
- Moraes-Lacerda, T., Rodrigues-Da-Silva, M., Singh, S. and De Jesus, M. B. (2025). Image-Based Profiling in Live Cells Using Live Cell Painting. Bio-protocol 15(19): e5464. DOI: 10.21769/BioProtoc.5464.
- Garcia-Fossa, F., Moraes-Lacerda, T., Rodrigues-da-Silva, M., Diaz-Rohrer, B., Singh, S., Carpenter, A. E., Cimini, B. A. and de Jesus, M. B. (2025). Live-cell painting: Image-based profiling in live cells using acridine orange. Mol Biol Cell. 36(7): ee24–07–0308. https://doi.org/10.1091/mbc.e24-07-0308
Category
Bioinformatics and Computational Biology
Cell Biology > Cell imaging > Fluorescence
Do you have any questions about this protocol?
Post your question to gather feedback from the community. We will also invite the authors of this article to respond.