- Protocols

- Articles and Issues
- For Authors
- About
- Become a Reviewer

A Model of Breast Cancer Micrometastasis in a Three-Dimensional (3D) Liver Spheroid for Testing an Antimetastatic Therapy
Published: Vol 15, Iss 18, Sep 20, 2025 DOI: 10.21769/BioProtoc.5454 Views: 3511
Reviewed by: Dipak Kumar PoriaKrishna Priya SyamaAnonymous reviewer(s)
Original research article
The authors used this protocol in:
Mar 2025


Protocol Collections
Comprehensive collections of detailed, peer-reviewed protocols focusing on specific topics


Related protocols
Abstract
Even though the survival and proliferation stages of cancer cells that have newly settled at a metastatic site are the rate-limiting stages and the most promising targets for drugs, there is a lack of models of the earliest stage of metastasis formation. A method for modeling breast cancer liver metastasis is described here: a stage of transition of a differentiated tumor cell into a cell actively proliferating in a three-dimensional (3D) liver spheroid. Opposite to existing heterocellular 3D models of metastases, the protocol allows modeling the initial stage of liver colonization by metastatic cells, the so-called “micrometastases.” The method includes obtaining a line of fluorescent tumor cells, fluorescence-activated sorting of differentiated cells, preparing a single-cell suspension of liver cells, forming a liver spheroid in an agarose mold, inducing the tumor cell dedifferentiation and proliferation using IL-6, and intravital microscopy of spheroids, with subsequent processing and analysis of fluorescent images in the ImageJ software. The performance of the proposed model was demonstrated using microRNA therapeutics. The ability of a combination of microRNAs to suppress the transition of micrometastasis to macrometastasis in the 3D liver spheroid was confirmed by an immunofluorescent assay of spheroid sections and transcriptome analysis.
Key features
• The method introduces a 3D model of liver micrometastasis formation using differentiated tumor cells.
• The 3D spheroid consists of all the main types of normal liver cells and better reproduces the microenvironment.
• The method allows one to evaluate the effectiveness of a drug that blocks the transition of micrometastases to macrometastases.
• The model is optimal for studying RNA-based therapeutic agents, as well as prodrugs that require metabolism in the liver for activation.
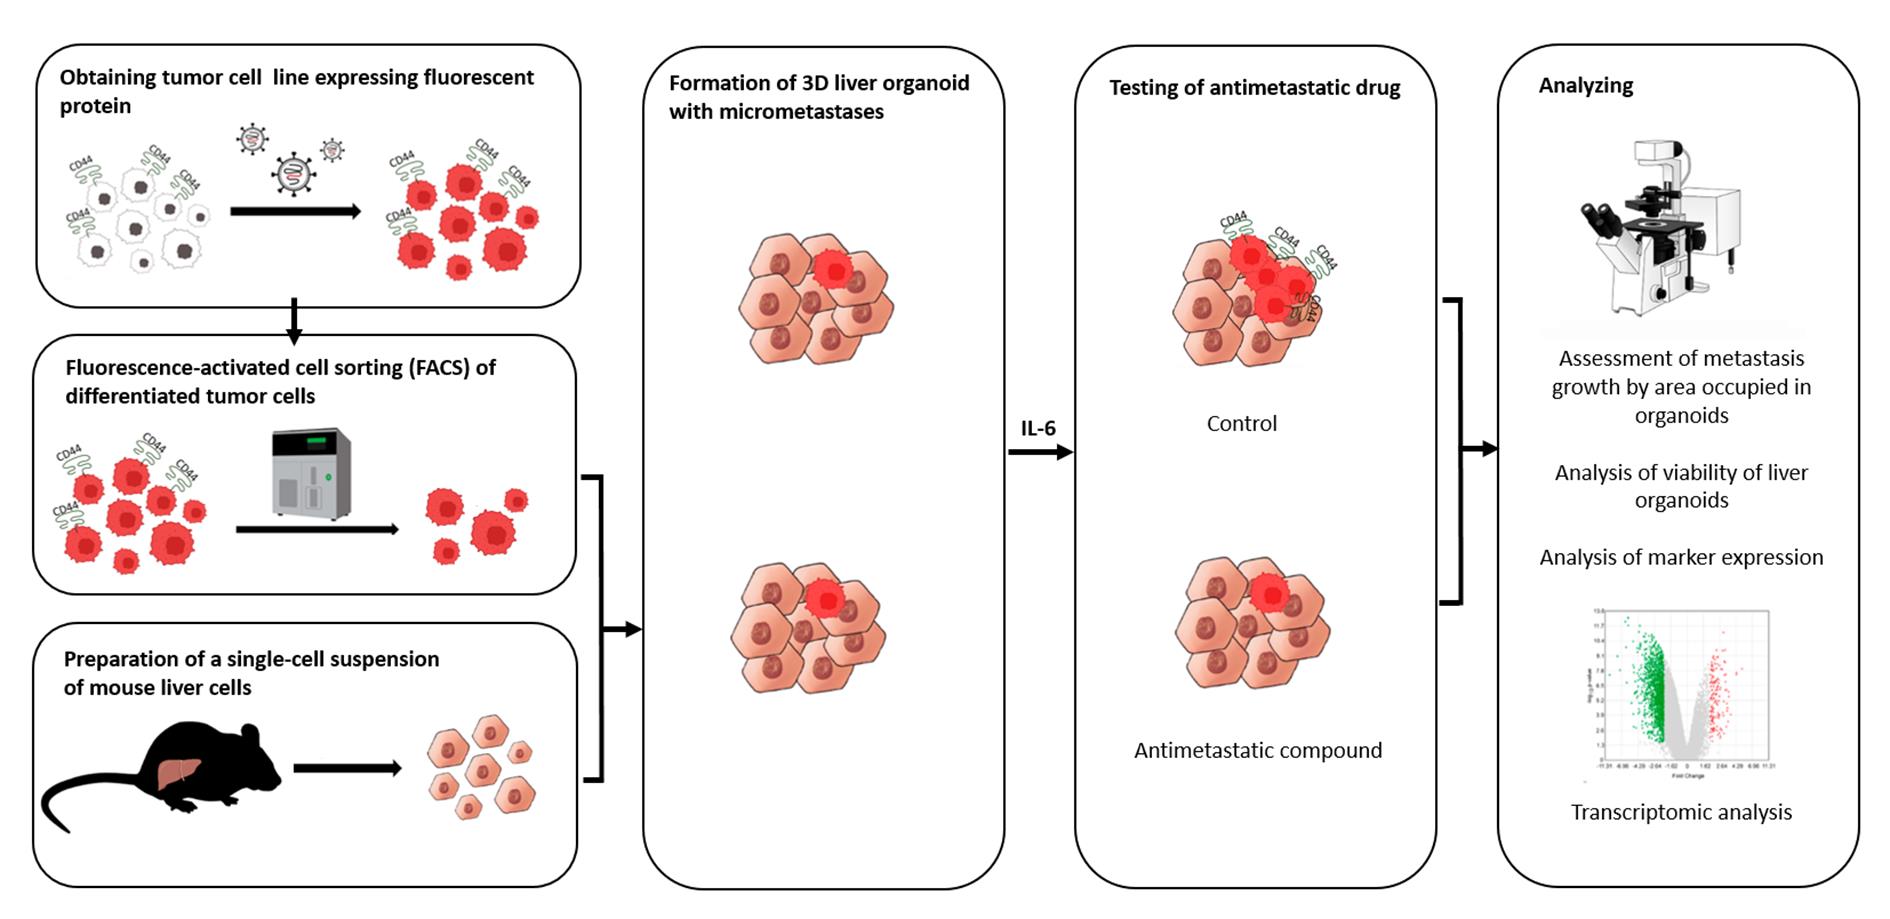
Keywords: SpheroidGraphical overview
Background
Metastases are some of the main causes of mortality in cancer patients. In this regard, the development of effective methods for studying antimetastatic therapies is an important scientific task. After getting into a distant organ, cancer cells find themselves in a new microenvironment, and those that survive give rise to a secondary tumor, whose biology differs from that of the primary tumor. To effectively prevent the formation of secondary tumors, it is necessary to devise specific therapeutic strategies and agents [1] that are aimed at suppressing key stages of metastasis.
According to the current understanding of this phenomenon, a metastatic cascade is a multistage process that includes the following stages: invasion and intravasation, survival in the circulation and dissemination, arrest in a distant organ and extravasation, formation of micrometastasis and dormancy, escape of dormancy, and dedifferentiation, which end in macrometastasis growth [2]. The action of the vast majority of antimetastatic drugs developed to date is aimed at preventing the invasiveness and migration of tumor cells [3]. Nonetheless, hematogenous dissemination of cancer cells is often a very early event in tumor progression [4]. Moreover, metastasis, in particular in breast cancer, can remain undetectable for months to decades after initial diagnosis and treatment [5]. Thus, survival and proliferation of cancer cells that have newly settled at a metastatic site (micrometastasis) are the rate-limiting stage [6] and the most promising targets for antimetastatic drugs.
Drugs acting on a secondary tumor can be designed to inhibit mesenchymal-epithelial transition, prolong the dormant state [7], block protective autophagy [8], or suppress the dedifferentiation of tumor cells into stem-like cells [9]. Accordingly, the development of micrometastasis models for evaluating the effectiveness of new antimetastatic drugs is in demand.
Two-dimensional (2D) cell cultures, represented by a monolayer of more than 1,000 tumor cells, are not able to adequately model metastatic colonization of a distant organ by one or several disseminated tumor cells. Therefore, at present, animal models are used to test antimetastatic agents and biomedical technologies. Among them, mouse models are the main research tool [10], and the latest approaches devised in recent years make it possible to examine the behavior of individual cells in a metastatic niche in vivo [11].
Nonetheless, the extremely high attrition rate of drugs already in the first phase of clinical trials underscores the poor transferability of research results obtained in animal models to humans. Preclinical models are constantly being improved to more fully reflect the processes occurring in humans, for example, through xenotransplantation of a human tissue, creation of genetically engineered animals carrying mutant alleles/oncogenes, or humanized animals that more accurately model a human immune response [12]; however, some crucial features of human biology cannot be reproduced in other mammals, even in nonhuman primates [13].
This problem is especially serious during the determination of the biological activity of gene- and RNA-targeted drugs. Genomic differences caused by phenomena such as retrotranspositions, gene amplification or deletion, genomic rearrangements, differences in coding and noncoding sequences, or differences in expression regulation mediated by epigenetic mechanisms collectively are responsible for species-specificity of a gene expression profile [14]. For instance, only 80% of human protein-coding genes and 72% of murine ones have a one-to-one orthologous relation (~15,000 genes). The remaining 20%–30% of protein-coding genes are either in one-to-many or many-to-many orthologous relations and are members of gene families that have undergone species-specific expansion or contraction or contain species-specific open reading frames (ORFs). Even more severe divergences are characteristic of noncoding RNA sequences. For example, almost 3,000 and 2,000 microRNAs (miRNAs, miRs) are annotated in the human genome and mouse genome, respectively, but only a small proportion of them (300 miRNAs) have a specific ortholog [14]. Moreover, the effects of small noncoding RNAs are context dependent [e.g., the presence (in the cell) of sets of long noncoding RNAs, circular RNAs, and RNA-binding, RNA-modifying, and RNA-editing proteins]. As a consequence, for example, the same miRNA can act as a tumor suppressor in one situation and as an oncogene in another [15]. A comparative transcriptomic analysis showed that many biological processes are subject to human-specific regulation and can be extrapolated from mice to humans only with caution [16]. Additional serious limitations of mouse models are low tropism, i.e., low probability of metastasis formation in a given organ, and a long latency period [10,17]. In general, the establishment of animal models is expensive, time-consuming, and laborious, which makes them extremely inconvenient at initial stages of drug development and of evaluation of a drug’s specific activity.
In this regard, more and more attention is given to the creation of in vitro 3D models [17,18]. The liver is one of the most common sites of cancer metastasis [19]. For instance, metastases of breast cancer to the liver occur in 32%–35% of patients with cancer recurrence [20]. On the other hand, there are a few models of breast cancer metastasis to the liver [18]. In recent years, models based on microfluidic systems—microphysiological systems or organ-on-a-chip—have been actively designed. They allow for simulating the process of tumor cell extravasation and colonization of a secondary site by tumor cells, for example, breast cancer cells [21,22] and lung cancer cells [23]. Despite high research potential, successful reproduction of experimental models in an organ-on-a-chip system is still available only to a small number of laboratories, requires special equipment, and is quite expensive.
In this article, we describe our protocol for modeling the earliest stage of secondary-lesion formation, namely, the transition of a differentiated tumor cell to a cell actively proliferating in a three-dimensional (3D) liver organoid. The model is based on obtaining a line of fluorescent tumor cells, isolating a population of differentiated cells by sorting, incorporating them into a liver organoid, inducing the transition of micrometastasis to macrometastasis by means of IL-6, and analyzing the organoids by intravital microscopy with subsequent processing and analysis of fluorescent images in the ImageJ software.
Validation of the proposed model was performed using miRNA therapeutics. Recently, we proposed a strategy for metastasis prevention with the help of a combination of three miRNAs that inhibit stemness genes, block the dedifferentiation of cancer cells in a metastatic niche, and prevent macrometastasis formation. In the original work, to confirm the efficacy of the combination of miRNAs, via intravenous administration of miRNAs in liposomal form, we conducted a series of experiments indicating the suppression of stemness gene expression, inhibition of mammosphere formation in vitro, and the prevention of metastasis in mice carrying experimental tumors [9]. In the present article, we confirm the ability of the combination of miRNAs to suppress the transition of micrometastasis to macrometastasis in our proposed model of breast cancer metastasis in a 3D liver organoid.
Materials and reagents
Biological materials
1. Human infiltrating ductal carcinoma of the breast, T47D cells (Bioresource Collection at N.N. Blokhin National Medical Research Center of Oncology, Moscow, Russia, ATCC HTB-133)
2. Human embryonic kidney 293T cells (ATCC, CRL-3216)
3. Human monocyte-like THP-1 cells (ATCC, TIB-202)
4. Human hepatocellular carcinoma HepG2 cells (State Research Center of Virology and Biotechnology VECTOR, 353 Koltsovo, Russia, ATCC, HB-8065)
5. Packaging plasmid pMDLg/pRRE#54 (Addgene plasmid #12251)
6. Packaging plasmid pRSV-Rev (Addgene plasmid #12253)
7. Envelope plasmid pMD2.G (Addgene plasmid #12259)
8. Lenti-gRNA-RFP plasmid (a gift from Dr. Maxim N. Karagyaur, Institute of Regenerative Medicine, Lomonosov Moscow State University, Russia)
9. C57BL/6 mice (SPF vivarium of the Institute of Cytology and Genetics, the Siberian Branch of the Russian Academy of Sciences, Russia); 8–12-week-old male mice were used throughout the experiments
Reagents
1. Poly-L-lysine hydrobromide (Paneco, catalog number: Ф069)
2. Phosphate buffered saline (PBS) (Sigma, catalog number: P4417)
3. Dulbecco's modified Eagle's medium/nutrient Ham's mixture F-12 (DMEM/F-12) (Gibco, catalog number: 11320033)
4. RPMI-1640 medium (Gibco, catalog number: 31870025)
5. Fetal bovine serum (FBS) (Gibco, catalog number: 10091148)
6. Heat-inactivated FBS (Gibco, catalog number: A5670502)
7. GlutaMAX, 100× (Gibco, catalog number: 35050061)
8. Antibiotic-antimycotic, 100× (Sigma, catalog number: A5955)
9. Collagenase, Type II (Paneco, catalog number: 2275)
10. Potassium bicarbonate (KHCO3) (Sigma, catalog number: 237205)
11. Ammonium chloride (NH4Cl) (Sigma, catalog number: А4514)
12. Ethylenediaminetetraacetic acid disodium salt dehydrate (Na2EDTA·2H2O) (Helicon, catalog number: Am-O105B-0.5)
13. William's E medium (Gibco, United Kingdom, catalog number: 12551032)
14. Dexamethasone (KPKA, catalog number: ЛП-006755)
15. Insulin-transferrin-selenium, 100× (Biolot, catalog number: 1.2.006)
16. Agarose (Helicon, catalog number: B-5000-0.5)
17. Calcein AM (Invitrogen, catalog number: C1430)
18. Dimethyl sulfoxide (DMSO) (Paneco, catalog number: Ф135)
19. Polybrene (Sigma, catalog number: 107689)
20. TrypLE Express Enzyme (1×), no phenol red (Gibco, catalog number: 12604021)
21. Metafectene (Biontex, catalog number: T040-1.0)
22. Isoflurane (Karizoo, catalog number: ЛП-006558)
23. Accutase (Stemcell Technologies, catalog number: 07922)
24. Fluorescein isothiocyanate (FITC)-conjugated anti-human CD44 antibody (clone BJ18, BioLegend, catalog number: 338804)
25. Allophycocyanin (APC)-conjugated anti-human CD24 antibody (clone ML5) (BioLegend, catalog number: 311118)
26. Interleukin 6 (IL-6) (Abcam, catalog number: ab9627)
27. Paraformaldehyde (Sigma, catalog number: P6148-500G)
28. Sucrose (GERBU, catalog number: 1331)
29. Optimal cutting temperature (OCT) Tissue Tek compound (Sakura, catalog number: 4583)
30. Isopentane (Fisher Chemical, catalog number: P/1030/08)
31. Bovine serum albumin (BSA) (Sigma, catalog number: A2153-100G)
32. Fluoroshield mounting medium with DAPI (Abcam, catalog number: ab104139)
33. RNA later (Qiagen, catalog number: 1018087)
34. RNeasy Plus Mini kit (Qiagen, catalog number: 74134)
35. Tris(hydroxymethyl)aminomethane hydrochloride (Tris-HCl) (pH 8.0) (Helicon, catalog number: Am-0234-0.5)
36. Sodium chloride (NaCl) (Helicon, catalog number: H-1401-1.0)
37. Hanks' balanced salt solution (HBSS), calcium, magnesium, no phenol red (Gibco, catalog number: 14025092)
38. RNA oligonucleotides (Syntol, Russia)
39. Cyclophosphamide (Deko, catalog number: ЛС-001048)
Solutions
1. Coating of wells with poly-L-lysine (see Recipes)
2. DMEM/F-12 or RPMI 1640 medium (see Recipes)
3. Collagenase type II (see Recipes)
4. Ammonium-chloride-potassium (ACK) buffer (see Recipes)
5. William’s E medium (see Recipes)
6. Agarose solution (see Recipes)
7. Agarose molds (see Recipes)
8. Calcein AM solution (see Recipes)
9. Polybrene solution (see Recipes)
10. Mixture of miRNAs (see Recipes)
Recipes
1. Coating of wells with poly-L-lysine
| Reagent | Final concentration | Quantity or volume |
|---|---|---|
| Water | 100% | 50 mL |
| Poly-L-lysine hydrobromide | 0.1 mg/mL | 5 mg |
Prepare a 0.1 mg/mL solution in water. Store at 4 °C. To coat the bottom of the wells of a 6-well plate, add 500 μL of the solution into each well and incubate for 1 h in a CO2 incubator. At the end of the incubation, wash three times with 1 mL of 1× PBS. Use immediately or let it dry for future use. Store at 4 °C for no more than 4 weeks.
2. DMEM/F-12 or RPMI 1640 medium
| Reagent | Final concentration | Volume |
|---|---|---|
| DMEM/F-12 or RPMI 1640 medium | 88% | 440 mL |
| FBS | 10% | 50 mL |
| GlutaMAX | 1% | 5 mL |
| Antibiotic-antimycotic solution (optional) | 1% | 5 mL |
To the DMEM/F-12 or RPMI 1640 medium, add 10% of FBS, 1× GlutaMAX, and an antibiotic-antimycotic solution (optional). In case of cultivation with an antibiotic-antimycotic, penicillin at 10 U/mL, streptomycin at 10.0 μg/mL, and amphotericin B at 25 μg/mL can be added. Store at 4 °C for no more than 4 weeks.
3. Collagenase type II
| Reagent | Final concentration | Volume |
|---|---|---|
| HBSS | 10% | 1 mL |
| Collagenase type IV (powder) | 0.1 mg/mL | 1 mg |
| DMEM/F-12 | 90% | 9 mL |
Prepare a stock solution of type II collagenase (125 U/mg) with a concentration of 1 mg/mL: Dilute 1 mg of collagenase powder in 1 mL of HBSS. Pass it through a 0.22-μm filter. To prepare a working solution of the collagenase, mix 9 mL of the complete DMEM/F-12 medium and 1 mL of the collagenase stock solution. Prepare the stock and working solutions of collagenase immediately before use.
4. Ammonium-chloride-potassium (ACK) buffer
| Reagent | Final concentration | Quantity or volume |
|---|---|---|
| KHCO3 | 9.99 mM | 1 g |
| NH4Cl | 154.42 mM | 8.26 g |
| Na2EDTA·2H2O | 0.10 mM | 37.2 mg |
| H2O | to 1 L |
Dissolve 1 g of KHCO3, 8.26 g of NH4Cl, and 37.2 mg of Na2EDTA·2H2O in 800 mL of distilled deionized water. Measure pH and adjust it to 7.2–7.4 if necessary. Bring volume to 1 L with water and pass the solution through a 0.22-μm filter. Store at 4 °C for no more than 6 months.
5. William’s E medium
| Reagent | Final concentration | Volume |
|---|---|---|
| William’s E medium | 86% | 430 mL |
| FBS | 10% | 50 mL |
| GlutaMAX | 1% | 5 mL |
| Dexamethasone (4 mg/mL) | 1% | 5 mL |
| Insulin-transferrin-selenium solution | 1% | 5 mL |
| Antibiotic-antimycotic solution | 1% | 5 mL |
To William’s E medium, add 10% of heat-inactivated FBS, 1× GlutaMAX, dexamethasone to a final concentration of 40 μg/mL, a 1× insulin-transferrin-selenium solution (final concentration: 10 mg/L insulin, 5.5 mg/L transferrin, and 67 μg/L sodium selenite), and an antibiotic-antimycotic solution (e.g., penicillin 10 U/mL, streptomycin 10 μg/mL, and amphotericin B 25 μg/mL). Store at 4 °C for no more than 2 weeks.
6. Agarose solution
| Reagent | Final concentration | Quantity or volume |
|---|---|---|
| Agarose | 2% | 2 g |
| 1× PBS | 98% | 100 mL |
Dissolve 2 g of agarose in 100 mL of 1× PBS. Sterilize by autoclaving for 20 min at 15 psi (1.05 kg/cm2) on a liquid cycle. Store at room temperature for no more than 6 months.
7. Agarose molds
Heat the agarose solution in a water bath to 95 °C or in a microwave oven (in pulse mode) until boiling. To form 81 wells, pour 500 μL of hot agarose into silicone molds (3D Petri Dish; MicroTissues Inc.). After the agarose mold solidifies (after ~5 min), remove it from the mold and place it in a well of a 12-well plate. Add 1 mL of complete William’s medium (Recipe 5) into each well and incubate for at least 10–15 min. Immediately before use, remove the complete medium from the well and from the agarose mold. Agarose molds can be prepared either on the day of the experiment or in advance. If the molds are prepared in advance, then after removing them from the silicone paternal mold, they must be filled with 1× PBS supplemented with 2× concentration of antibiotics. Seal the plate (or Petri dish) containing the molds air-tightly with parafilm and store at 4 °C for no more than a week.
8. Calcein AM solution
| Reagent | Final concentration | Volume |
|---|---|---|
| Calcein AM stock solution (1 mg/mL, 1 mM) | 2 μM | 1 μL |
| 1× PBS | 0.5 mL |
To obtain a stock solution, dilute this reagent in DMSO to a concentration of 1 mg/mL (1 mM). Store the resulting stock solution at -20 °C. The working solution of calcein AM is prepared immediately before use by diluting to a concentration of 2 μM. To this end, dilute the stock solution 1:500 with HBSS or a medium without added FBS.
9. Polybrene solution
| Reagent | Final concentration | Quantity or volume |
|---|---|---|
| Polybrene | 10 mg/mL | 10 mg |
| H2O | 1 mL |
Dilute polybrene to 10 mg/mL with water. Pass it through a 0.22-μm filter. Store at 4 °C.
10. Mixture of miRNAs
miRNA mimics were prepared using a protocol described in [9]. The RNA oligonucleotide sequences are provided in Table S1. Three miRNA mimics (miR-195-5p, miR-520a, and miR-630) in 10 mM Tris (pH 8.0), 50 mM NaCl, and 0.1 mM Na2EDTA·2H2O were mixed at equimolar concentrations at a final concentration of each miRNA of 50 nM. For testing, the microRNA mixture and Metafectene PRO were mixed in a 5:1 ratio according to the manufacturer's protocol and transferred dropwise to spheroids in individual wells of a 12-well plate.
Laboratory supplies
1. Cell culture plates, 6-well, tissue culture treated (SPL Lifesciences, catalog number: 30006)
2. Cell culture plates, 12-well, tissue culture treated (SPL Lifesciences, catalog number: 30012)
3. T25 flask, tissue culture treated (SPL Lifesciences, catalog number: 70075)
4. T75 flask, tissue culture treated (SPL Lifesciences, catalog number: 70025)
5. 5 mL serological pipettes (SPL Lifesciences, catalog number: 95005)
6. 10 mL serological pipettes (SPL Lifesciences, catalog number: 95010)
7. 25 mL serological pipettes (SPL Lifesciences, catalog number: 91025)
8. 10 μL pipette tips (GenFollower, catalog number: FTB10-10)
9. 200 μL pipette tips (GenFollower, catalog number: TVB200YE)
10. 1,000 μL pipette tips (GenFollower, catalog number: TB1000-10)
11. Microcentrifuge tubes, 1.5 mL (GenFollower, catalog number: LMTB015)
12. Centrifuge tubes, 15 mL (SPL Lifesciences, catalog number: 50015)
13. Centrifuge tubes, 50 mL (SPL Lifesciences, catalog number: 70050)
14. Cell strainer, 100 μm (SPL Lifesciences, catalog number: 93100)
15. 3D Petri dish micro-mold spheroids, 9 × 9 array (MicroTissues, catalog number: Z764019)
16. Syringe filter, 0.45 μm (GVS Abluo, catalog number: FJ25BSCPS004AP01)
17. Syringe filter unit, PES, 0.22 μm (GVS Abluo, catalog number: FJ25BSPSA002AL01)
18. ClariomTM S assay platform (Affymetrix, catalog number: 902927)
19. Microscope Polylisine slides (Thermo Scientific, catalog number: J2800AMNZ)
20. CountessTM cell counting chamber slides (Invitrogen, catalog number: C10228)
Equipment
1. Class II biological safety cabinet (Lamsystems, model: 1R-B.001-15)
2. Laboratory centrifuge with cooling (Nuve, model: NF400R)
3. pH meter (MettlerToledo, model: G2S)
4. CO2 incubator (Sanyo, model: МСО15АС)
5. Autoclave (Tuttnauer, model: TUT 2540)
6. Stirred water bath (Biosan, model: WB-4MS)
7. Microwave oven
8. PCR cabinet (Lamsystems, model: 1R-F.004-10)
9. Thermal cycler (Applied Biosystems, model: 2720)
10. Porkka ice flake machines (Porkka, model: 45А)
11. Cryogenic vessel (Thermo, model: Biocane 47 СK509Х4)
12. Flow cytometer Cytoflex (Beckman Coulter, model: B5-R3-V5)
13. Incubating rocking platform shaker (Russia, model: KТ 103)
14. Cryostat (Thermo Scientific, model: HM525 NX)
15. Centrifuge (Eppendorf, model: MiniSpin Plus)
16. Classic anesthesia system (Braintree Scientific, model: EZ-7000-320)
17. Automated Cell Counter Countess II FL (Thermo, model: Countess II FL)
18. Fluorescent microscope equipment with DFC9000 GT sCMOS (Leica, model: DMi8)
19. Confocal laser scanning microscope (Nexcope, model: NCF1000)
20. Cell sorter FuTech (Shanghai Future Technology Co., Ltd., model: SE309)
21. NanoDrop-2000 spectrophotometer (Thermo Scientific, model: ND-2000)
22. TapeStation instrument for capillary electrophoresis (Agilent Technologies, model: 4150)
23. GeneChip System 3000 (Affymetrix, model: 00-0218)
Software and datasets
1. Image-processing freeware ImageJ (Fiji) [24]
2. Transcriptome Analysis Console (TAC) software (version 4.0)
Procedure
A. Cell culture
T47D and THP-1 cells were cultured in the complete RPMI 1640; HepG2 and 293T cells were cultured in the complete DMEM/F12 medium; both complete media were supplemented with 10% FBS, 1× GlutaMAX, and 1× antibiotic-antimycotic solution. All cell lines were grown in a humidified incubator with 5% CO2 at 37 °C.
Before experiments, thawed cells were cultured until passage 3. To remove cells from a plastic surface (unless specified otherwise), use the following protocol: remove the medium, wash with PBS, add TrypLE, and place the flask in the CO2 incubator for 3–7 min of incubation. When the cell monolayer begins to separate from the plastic surface, add a complete growth medium (a volume equivalent to the volume of TrypLE) for neutralization, collect the cells into a centrifuge tube, and pellet them by centrifugation at 180× g for 5 min; then, resuspend the cells in the medium.
B. Obtaining a genetically modified T47D_Red cell line expressing red fluorescent protein (RFP)
To obtain the genetically modified breast cancer cell line expressing RFP, the lentivirus transduction method is used. Below is a protocol for generating a T47D_Red cell line expressing RFP. The protocol involves transfection of 293T cells with a plasmid mixture for lentivirus production, infection of T47D cells, and obtaining a monoclonal cell line from a polyclonal pool of stably transfected cells by limiting dilution. This protocol can be successfully applied to other cell lines with any third-generation lentiviral plasmid encoding a fluorescent protein.
Day 0
1. Seed 293T cells in wells of a 6-well plate precoated with poly-L-lysine at 0.6 × 10⁶ cells/well in 2 mL of the complete DMEM/F-12 medium.
Day 1
Note: The complete DMEM/F12 medium, Metafectene, and PBS must be at room temperature.
2. Check the confluence of the 293T cells; a confluence of ~80%–90% is recommended.
3. Before transfection, remove the medium, wash the wells with 1× PBS, and add 2 mL of fresh complete DMEM/F-12 medium containing no antibiotics to each well.
4. Perform transfection of 293T cells via Metafectene in accordance with the manufacturer’s instructions. Place 43 μL of PBS in a 0.6 cm3 microfuge tube, add 7 μL of Metafectene, and mix gently by pipetting.
5. In a separate tube, mix 1.25 μg of a third-generation lentiviral plasmid encoding a fluorescent protein (we used a plasmid encoding RFP expressed under the control of the EF-1α core promoter; Figure S1), 1 μg of packaging plasmid pMDLg/pRRE#54, 0.5 μg of packaging plasmid pRSV-Rev, and 0.75 μg of envelope plasmid pMD2.G. After that, adjust the volume with PBS to 50 μL.
6. Transfer the DNA plasmid mixture to the Metafectene-containing tube and mix gently once by pipetting.
7. Incubate the mix for 15 min at room temperature.
8. Add the transfection mixture into wells of the plate containing 293T cells dropwise, while gently swirling the plate.
Note: Plasmids are not added to one well with cells, in which the untransfected 293T cells are used as a negative control.
Day 2
9. At 16 h after transfection, replace the medium with the complete growth medium without antibiotics.
Note: (optional) Twenty-four hours post-transfection, you can check transfection efficiency under a fluorescence microscope.
10. Harvest the lentiviral particles at 12-h intervals after a medium change. For this purpose, collect the medium into a 15 mL Falcon® tube and add 2 mL of fresh complete growth medium into the well. Store lentiviral particles at 4 °C.
11. Seed the cells (0.4 × 10⁶ of T47D cells per well of a 6-well plate) in complete growth medium RPMI 1640 without antibiotics so that they will reach 70%–80% confluence the next day.
Day 3
12. Harvest the lentivirus two more times at 12-h intervals.
13. Centrifuge the tubes with freshly collected lentiviruses at 400× g for 7 min to pellet cell debris.
14. Collect the supernatant and pass it through 0.45-μm syringe filters.
Note: (optional) After the final collection of the lentivirus-containing medium, detach transfected cells using TrypLE or Accutase and check transfection efficiency by flow-cytometric analysis.
Day 4
15. In separate microfuge tubes, mix 1 mL of the lentivirus-containing medium (after filtration), 2 mL of the complete RPMI 1640 medium without antibiotics, and 2.4 μL of polybrene (to achieve a final concentration of 8 μg/mL), and transfer the entire contents of the tubes to the wells with T47D cells.
16. As a negative control, use T47D cells without the transduction mixture.
17. Place the multi-well plate in the CO2 incubator at 37 °C.
18. Replace the medium after 24 h.
19. After another 24 h, assess the fluorescence level by fluorescence microscopy or flow cytometry.
Note: (optional): To establish a monoclonal cell line, the cells are dissociated from the plate, counted, diluted to a density of 10 cells/mL (it is recommended to make serial dilutions to minimize errors), and seeded in a 96-well plate in a volume of the medium of 100 μL (at ~1 cell per well). The next day, inspect the plate under a fluorescence microscope and mark the well that contains one fluorescent cell. Next, replace the medium every 3 days. After 90% confluence is reached, transfer the cells (monoclone) to a culture dish with a larger surface area, in accordance with the dilution recommended for a given cell line (e.g., 1:4 for T47D). When the number of cells is sufficient for analysis, check the expression level by flow cytometry. The histogram should show a single-phase distribution, and the proportion of fluorescent cells should be 90%.
C. Preparation of a single-cell suspension of mouse liver cells
1. Anesthetize the mouse via inhalation of isoflurane.
2. Disinfect the surgical area with an alcohol disinfectant solution.
3. Dissect the skin and proper fascia of the abdominal wall along the white line of the abdomen and obtain access to the liver.
4. Remove the liver, place it in a Petri dish, and chop it with a scalpel.
5. Transfer the resulting homogenate to a 50-mL test tube.
6. Add 10 mL of type-II collagenase solution and incubate for 25 min on a rotator shaker at 37 °C.
Note: It is recommended to find an optimal time for tissue dissociation in the collagenase solution beforehand in your laboratory. Typically, it varies from 20 to 60 min; the efficiency of tissue dissociation can be estimated by means of the density of the formed spheroids (Figure S2).
8. Bring the suspension volume to 30 mL with cold 1× PBS.
9. Grind the sample through a strainer with a 100-μm pore size.
10. Wash the strainer with 10 mL of 1× PBS.
11. Centrifuge at 323× g for 10 min.
12. Lyse erythrocytes with ACK buffer: add 2 mL of ACK buffer to the precipitate and incubate for 3 min, then add 30 mL of PBS, mix, and centrifuge at 323× g for 10 min.
13. Resuspend the resulting cell pellet in 1 mL of complete William’s medium and count the obtained cells. The resulting cells can be stored on ice for several hours. Proceed to Section E as quickly as possible.
D. Fluorescence-activated cell sorting (FACS) of differentiated tumor cells
1. Detach T47D cells from a culture plastic surface using Accutase. Remove the medium, wash with PBS, add Accutase, and place the flask in the CO2 incubator for 5–7 min. When the cell monolayer begins to detach from the plastic surface, add a complete growth medium (a volume equivalent to the volume of Accutase) for neutralization, collect the cells into a centrifuge tube, and pellet them by centrifugation at 180× g for 5 min.
2. Wash the cell pellet once in FACS buffer.
3. Stain with a fluorescently labeled antibody to CD44 according to the manufacturer’s instructions.
Note: An antibody with any fluorochrome compatible with your sorter and not coinciding with the fluorescence spectra of the fluorescent protein expressed by tumor cells can be chosen.
3. After staining, wash cells twice with 2 mL of PBS and centrifuge at 80× g for 10 min.
4. After the second wash, resuspend the cells in complete RPMI 1640 medium and place them on ice to maintain their viability.
5. Perform сell sorting to obtain a CD44– population, i.e., a population of differentiated cancer cells. Acquire flow cytometry data and display cells on an SSC-A (side scatter-area) vs. FSC-A (forward scatter-area) density plot. Set the initial gate (gate P1) to select the main population of intact single cells while excluding debris and cellular fragments. From the P1-gated population, generate an FSC-H (forward scatter-height) vs. FSC-A (forward scatter-area) plot. Apply a secondary gate (gate P2) to exclude cell doublets and aggregates by selecting the population displaying a linear relationship between FSC-H and FSC-A. Next, identify the population of RFP+CD44– cells based on their fluorescence intensities in the FITC and PE channels using single-stained controls to set up compensation and to determine positive-negative thresholds.
6. Fill the centrifuge tube for collecting the target population with complete RPMI 1640 medium to ensure cell viability.
7. After collection, centrifuge the cells, and resuspend the resultant pellet in 1 mL of complete William’s medium. The cells can be stored on ice for several hours. Proceed to Section E as quickly as possible.
E. Obtaining 3D liver spheroids with micrometastases
1. To obtain the spheroids, prepare a cell suspension as follows: 150,000 mouse liver cells (from the single-cell suspension) and 10,000 CD44– T47D_Red cells in 190 μL of complete William’s medium per mold (to obtain 81 spheroids). The 81-spheroid mold provides adequate cell density for single-cell resolution in tumor cell tracking, while restricting spheroid diameter below the hypoxia threshold, thereby preventing central necrosis development. Additionally, this format enables robust statistical analysis by generating multiple biological replicates per experimental condition.
Note: The number of molds and cells must be increased proportionally to the number of drugs tested.
2. Transfer the resulting suspension onto a mold made of 2% agarose in a 12-well plate.
3. Incubate for 60 min in a CO2 incubator.
4. Add 1 mL of complete William’s medium into each well.
5. To induce dedifferentiation, introduce IL-6 to all wells (final concentration: 50 ng/mL).
6. To test the antimetastatic activity at this stage, it is necessary to add a tested compound to the wells with IL-6. The volume of the added solutions should not exceed 10% of the volume of the medium. As a control, it is necessary to employ cells in molds with added IL-6 and the solvent (vehicle) of the tested substances (without the substances themselves). The initial stage of spheroid formation can be observed as early as 1 h, and subsequent compaction occurs during further cultivation.
7. After 24 h, replace the medium with a fresh one.
8. At 96 h from the start of the incubation, replace half of the medium with fresh medium supplemented with a 2-fold concentration of IL-6 to maintain the dedifferentiation of tumor cells in the system under study.
F. Evaluation of antimetastatic potential of the compounds being tested
Under the influence of IL-6, differentiated cells undergo a process of dedifferentiation and acquire the ability to proliferate. Because tumor cells within the spheroid are fluorescent, the effectiveness of the antimetastatic compound can be assessed by intravital fluorescence microscopy of the spheroids: when cell proliferation is blocked successfully, there should be no increase in the area occupied by RFP+ cells.
G. Semiquantitative analysis of the viability of liver spheroids
Assessment of cell viability in a spheroid is conveniently performed by an assay for the activity of intracellular esterases by means of a dye (Calcein AM). At this stage, it is possible to analyze the viability of all spheroids in a mold at the same time and of several spheroids extracted from the mold.
G1. For an analysis of the viability of spheroids directly on the mold:
1. Carefully remove the medium from the mold.
2. Wash the mold twice with 200 μL of 1× PBS.
3. Add 200 μL of the working solution of Calcein AM (with a concentration of 2 μM).
4. Incubate this system for 30 min at 37 °C.
5. Carefully remove the solution and add 200 μL of complete William’s medium.
6. Incubate this system for 30 min at 37 °C.
7. Examine the samples under a fluorescence microscope.
G2. In case of an analysis of individual spheroids:
1. Carefully remove them from a mold using a 1,000-μL pipette tip and transfer them to a 96-well flat-bottomed plate.
2. Wash the spheroids in the plate twice with PBS: add 200 μL of PBS and then carefully remove the liquid.
3. Add 100 μL of the working solution of Calcein AM (with a concentration of 2 μM).
4. Incubate for 30 min at 37 °C.
5. Carefully remove the solution and add 100 μL of complete William’s medium.
6. Incubate for 30 min at 37 °C.
7. Analyze the samples under a fluorescence microscope. Viable, metabolically active cells will emit green fluorescence.
8. Obtain images under the fluorescence microscope and perform an analysis in ImageJ with the SpheroidJ plugin.
Note: To validate the proposed viability assay, liver spheroids were incubated with cyclophosphamide at concentrations of 0.04–1.00 mg/mL for 48 h (Figure S3).
H. Analysis of marker expression by immunostaining
To evaluate the repression or activation of certain genes, it is convenient to perform immunostaining of spheroids with appropriate antibodies. The frequency of this assay (on the day of analysis) should be selected in accordance with the objectives of a study. We recommend evaluating at least 10 spheroids in each experimental group. It is worthwhile to collect the material on the first day at the stage of spheroid formation. The advantage of our model is that the agarose mold itself can be cut into several parts with a scalpel after the formation of spheroids, thus enabling a time course analysis by means of only one mold. In our experiment, we assessed dedifferentiation under the influence of the tested drug via staining for stemness markers: staining with antibodies to CD24 and CD44. Analysis of the expression of these surface markers is most often chosen to evaluate the differentiation of tumor cells.
1. Remove the medium from the mold (or from a part of it), taking care not to aspirate any spheroid.
2. Fix the spheroids in 500 μL of 4% paraformaldehyde for 30 min.
3. Incubate for 1 h in 500 μL of 30% sucrose.
4. Carefully remove the liquid and place the spheroids in a cryo-mold, completely covered with the OCT matrix medium. Freeze in isopentane cooled in liquid nitrogen.
5. On a cryotome, obtain 8 μm thick sections and place them on histological glass slides with an adhesive coating. Outline each section with a hydrophobic marker.
6. Wash the glass slides with sections three times in 1× PBS.
7. Perform blocking in 3% BSA in PBS for 1 h in a humidified chamber.
8. Stain with fluorescently labeled antibodies to CD44 and CD24 for 1 h in a humidified chamber in the dark (in our case, the working concentration of each antibody was 1:500 in PBS, added at 30 μL per section).
9. Wash with 1× PBS three times.
10. Apply an embedding medium (Fluoroshield mounting medium with DAPI) and cover the sections with a coverslip.
11. Image spheroids under an inverted fluorescence microscope in transmitted light and in the DAPI/GFP/RFP/Cy5 channels at 40× magnification.
I. Transcriptomic analysis
RNA expression profiling is a powerful research approach that allows an investigator to comprehensively evaluate the effects of a drug on cells; this approach is especially important when gene therapy modalities are tested.
1. Collect all spheroids from molds by pipetting. We recommend collecting at least 1,620 spheroids (~100,000–200,000 T47D_Red cells) in each experimental tube for RNA isolation.
2. Wash the molds twice with 1× PBS to collect all cells.
3. Centrifuge the resultant cell suspension at 269× g for 10 min.
Note: If long-term storage of the samples is planned, then RNAlater is added to the cell pellet at this stage, and the samples are stored at -20 °C.
4. Isolate the total RNA from cells using the RNeasy Plus Mini kit containing DNase I.
5. Assess the concentration and purity of the isolated RNA on a NanoDrop-2000 spectrophotometer.
6. Evaluate RNA integrity by capillary electrophoresis on a TapeStation instrument with the R6K ScreenTape kit. In our experiments, the concentration of RNA ranged from 15 to 150 ng/μL, the А260/А280 ratio was 1.65–1.95, А260/А230 was 1.80–1.95, and the RNA integrity number was 6.8–9.0.
6. Next, carry out an analysis involving microarrays designed for transcriptomic analysis of human genes on the ClariomTM S assay platform. At least three biological replicates are required for differential gene expression analysis.
Data analysis
A. Semiquantitative analysis of macrometastasis formation in a liver spheroid
To quantitatively assess the effectiveness of inhibition of cancer cell proliferation, image analysis is performed using tools of the ImageJ software and the SpheroidJ plugin [25]. Intravital images of spheroids in molds are captured via fluorescence microscope every 24 h for 7 days. To analyze quantitative characteristics of tumor foci in the liver spheroids at different time points, the percentage of the area occupied by tumor cells inside a spheroid is calculated.
1. To analyze quantitative characteristics of tumor foci in liver spheroids at different time points, obtain spheroid images using a Leica DMi8 microscope (with software LAS X) and export as TIFF images. The dimension of the exported file is in micrometers. For each sample, create a separate directory into which the image of the RFP channel is loaded; place the image of the transmitted-light channel in an additional subdirectory for correct operation of the SpheroidJ plugin.
2. In the ImageJ Fiji software, open the spheroid image in the transmitted light channel. Using the SpheroidJ plugin, determine the spheroid parameters, including the area and region of interest (ROI) by the segmentation algorithm Threshold plus edges (Figure 1). The measured parameters are saved automatically in the folder with the original image.
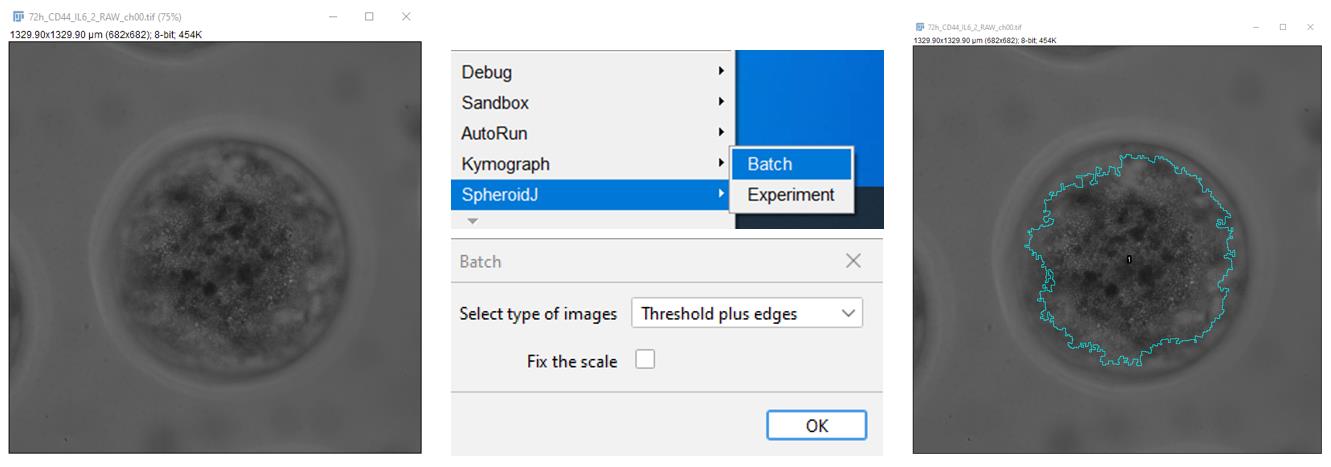
Figure 1. Determination of the area and region of interest (ROI)
3. In ImageJ Fiji, open a spheroid image in the RFP channel. Apply standard tools to visualize the tumor foci (Figure 2). Using the Image/Adjust/Threshold command, set the range of the threshold value for pixels so that the boundaries of each object (a cell or a group of cells) can be determined. For this purpose, in the opened window, select the Default algorithm to display white objects on a black background (Dark background). Then, apply the selected settings.
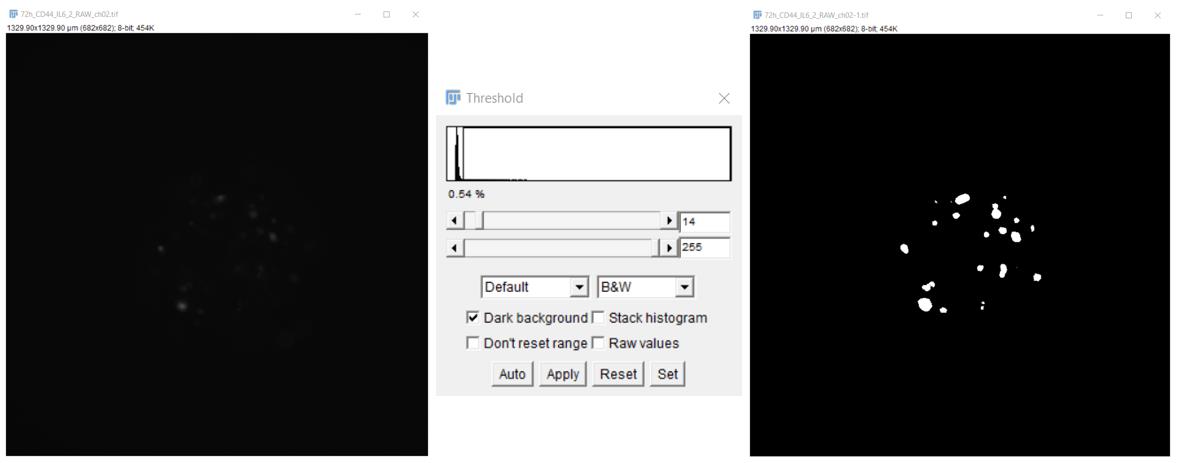
Figure 2. Visualization of tumor foci in liver spheroids
4. To segment objects that are close to each other (stand-alone cells or cell groups arising as a result of cell proliferation), execute the Process/Binary/Watershed command (Figure 3).
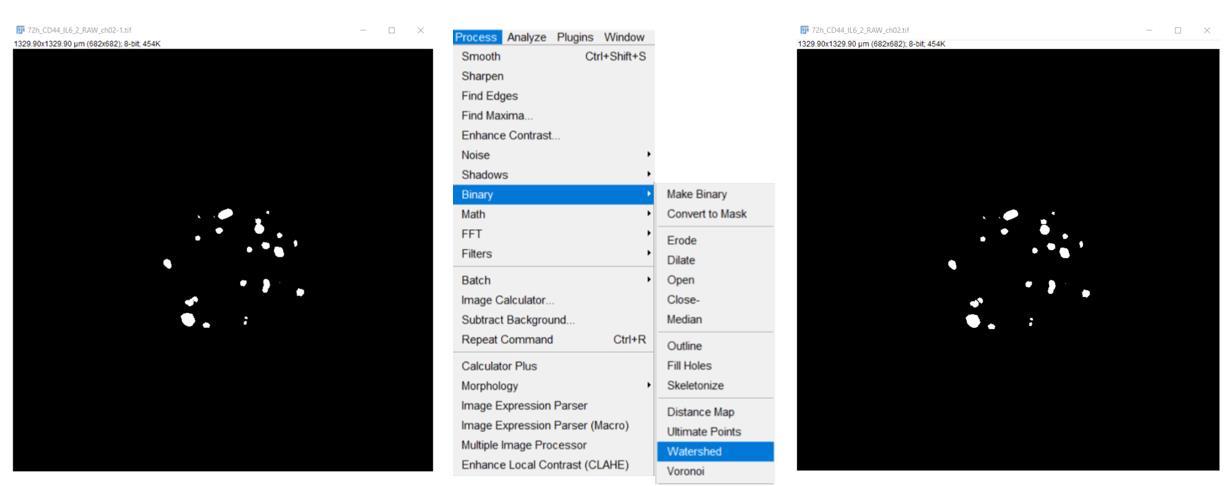
Figure 3. Segmentation of objects that are close to each other (stand-alone cells or cell groups)
5. After that, via the Analyze/Analyze Particles command, measure the number and size (area) of objects, with the following settings: size (μm2), 50–Infinity; Circularity, 0.15–1.00; show “Select Overlay Masks” to display filled outlines of the measured particles and “Check Display Results” to have the measurements for each particle [the number of objects (spots) and their size in μm2] displayed in the Results window. Check Exclude on Edges to ignore particles touching the edge of an image or selection (Figure 4).
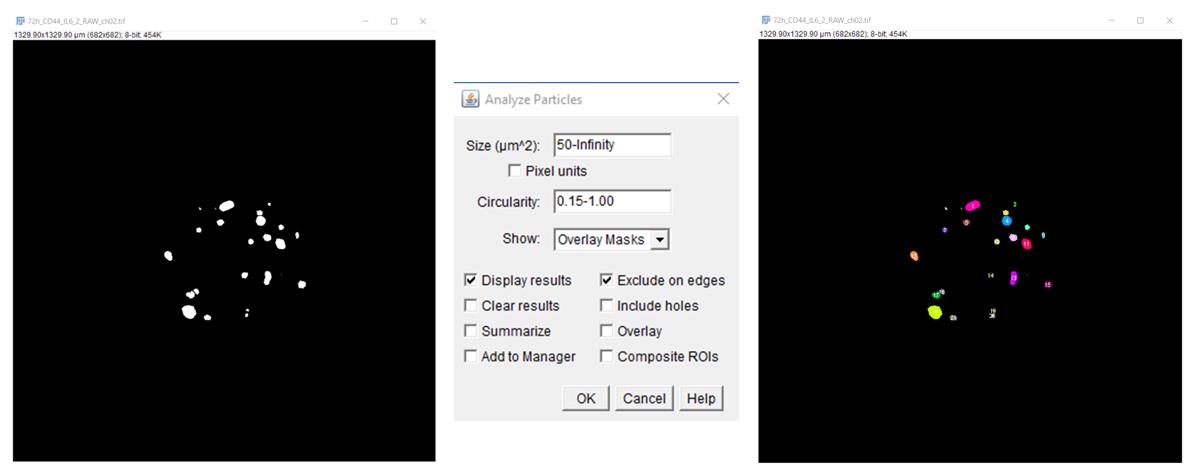
Figure 4. Measurement of the number and size (area) of objects
6. Enter the obtained data (Figure 5) into an Excel table.
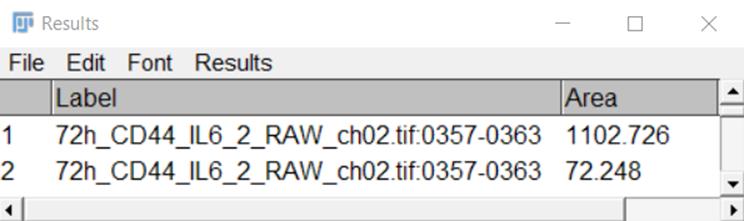
Figure 5. A representative view of a Results table
7. To calculate the percentage of the area occupied by tumor cells inside the spheroid (area fraction) employ the ROI generated using the SpheroidJ plugin for a given spheroid and standard tools. For the image of the RFP channel after the segmentations performed in the previous paragraph, use the ROI file saved in the folder containing the spheroid image in transmitted light (Figure 6).
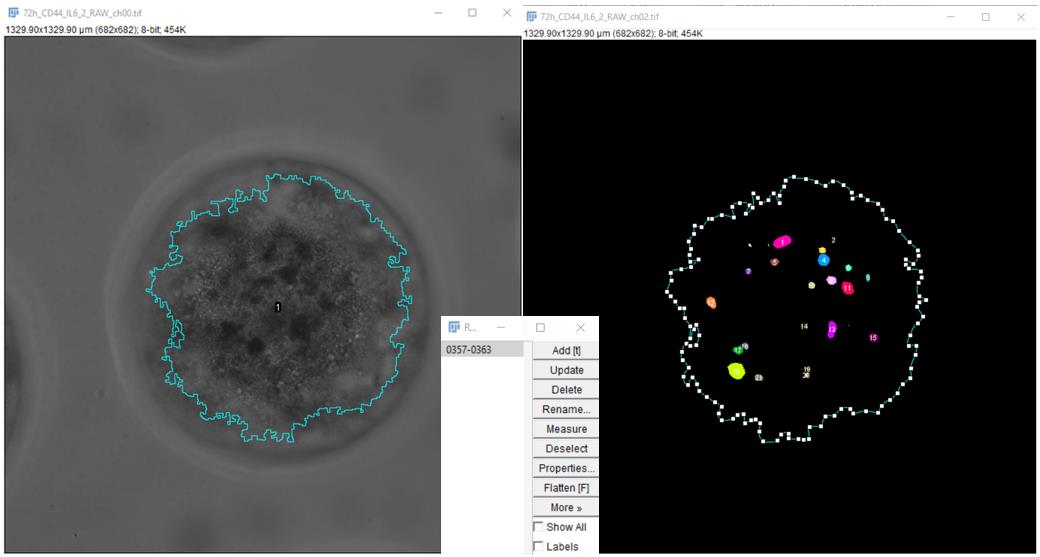
Figure 6. Application of the ROI generated using the spheroid image in transmitted light
8. Using the Analyze/Set Measurements command, set the following measurement parameters: area, area fraction, and display label (Figure 7).
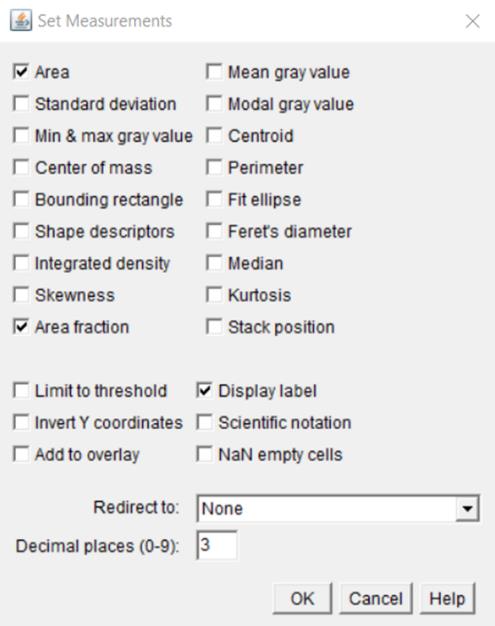
Figure 7. Selection of measurement parameters in the Set Measurements window
9. Via the Measure command, output a table of measurement results (Figure 8) and transfer the data to an Excel table.
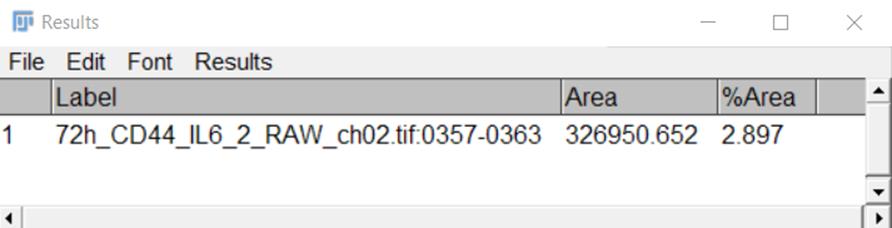
Figure 8. Representative view of a Results table
B. Semiquantitative analysis of the viability of a liver spheroid
1. To evaluate the viability of cells in a liver spheroid at different time points, obtain spheroid images using a Leica DMi8 microscope (with software LAS X) and export as a TIFF image. The dimensions of the exported files are in micrometers. For each sample, a separate directory is created, into which the FITC channel image is loaded; the image from the brightfield channel is placed in an additional subdirectory for correct operation of the SpheroidJ plugin.
2. Using the SpheroidJ plugin, determine the spheroid parameters, including the area and ROI by the segmentation algorithm Threshold plus edges. The measured parameters are saved automatically in the folder with the original image.
3. In ImageJ Fiji, open a spheroid image in the FITC channel (channel of Calcein AM detection). To calculate the percentage of area occupied by viable cells (calcein AM–positive cells) (area fraction), employ the ROI generated using the SpheroidJ plugin for a given spheroid and standard tools.
4. Via the Image/Adjust/Threshold command, we set the range of the threshold value for pixels so that the boundaries of Calcein AM–positive cells could be determined. For this purpose, in the opened window, select the Default algorithm to display white objects on a black background (Dark background). Then, apply the selected settings. The ROI file is saved in the folder containing the spheroid image, where the transmitted light was applied to the FITC channel image.
5. Using the Analyze/Set Measurements command, set the following measurement parameters: area, area fraction, and display label.
6. Via the Measure command, output a table of measurement results and transfer the data to an Excel table.
C. Transcriptomic analysis
The Transcriptome Analysis Console (TAC) software (version 4.0) is employed to process the microarray data (examination of differentially expressed genes, including the construction of heat maps and identification of signaling pathways). The threshold of differential expression is set to p < 0.05 (fold change: >2 or <–2). ANOVA with eBayes adjustment is used to identify differentially expressed genes. eBayes adjusts ANOVA via an empirical Bayes approach that utilizes information from all test sets to produce an improved estimate of variance. A probe set is considered expressed if 50% of the samples in the dataset have DABG (detection above background) values below a DABG cutoff. The latter is set to 0.05, and the positive/negative area under the curve threshold is set to >0.7.
An alternative is to prepare formalin-fixed paraffin-embedded sections or frozen spheroids for analysis by spatial transcriptomic methods.
Validation of protocol
Parts of this protocol have been used and validated in the following research article: Nevskaya et al. [26].
As a result of transduction of T47D cells with the lentiviruses, a polyclonal cell line is obtained that can already be subjected to research. In this way, for T47D cells, after transduction, we obtained a polyclone where there were 60% of RFP+ cells (Figure S4). Considering that fluorescence-activated cell sorting with FITC-labeled antibodies is used to isolate the desired population of CD44– cells, at this stage, it is possible to sort out, for example, RFP+CD44– cells.
Nevertheless, obtaining a monoclonal cell line with bright fluorescence may be more preferable and convenient for systematic investigation. Accordingly, we obtained a monoclone of T47D_Red cells stably expressing RFP, as confirmed by fluorescence microscopy and flow cytometry (Figure S4).
It should be noted that with our protocol, one can use any third-generation lentiviral plasmid encoding a fluorescent protein to obtain a fluorescent cell line. For example, we have previously successfully constructed the MDA-MB231_Green cell line stably expressing green fluorescent protein [27] using the pGpur plasmid (Figure S5).
Using a primary culture of mouse liver cells to generate a spheroid is convenient because mouse liver cells are easy to obtain, unlike human liver cells. An additional advantage is that work with mouse liver cells enables an analysis of the transcriptome of tumor cells by means of human microarrays for transcriptome analysis, without the technically complicated additional step of separating a small number of human cancer cells from the bulk of the spheroid. The use of primary cell culture gives a more adequate micrometastasis model to assess the effect of a compound on the proliferation of cancer cells, as compared to when tumorous or immortalized liver cell lines are used. Nonetheless, our protocol helps to generate spheroids from any other cells, including established cell lines, and to incorporate additional cell types, such as fibroblasts or immune cells, into the spheroid. In Figure 9, a heterocellular spheroid composed of HepG2, THP-1_Green, and T47D_Red cells is presented. Such heterocellular spheroids help to reproduce a complex multicellular system, which can be useful for drug screening. However, HepG2 is a cancerous cell line, and it should be used with caution for testing anticancer agents, taking into account the mechanism of action of the drug under investigation. Protocol adaptation may be required to suit specific experimental needs.
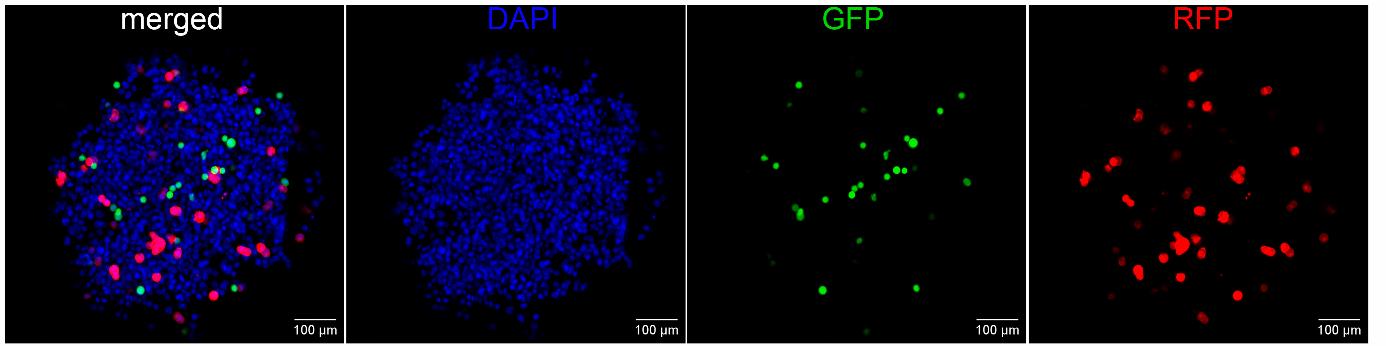
Figure 9. A representative image of a heterocellular liver spheroid consisting of nonfluorescent HepG2 cells, GFP-expressing THP-1 cells (green), and RFP-expressing T47D cells (red) mixed in a 17:1:1 ratio, respectively. Nuclei are stained with DAPI (blue). The image was captured by means of a Nexcope NCF950 confocal laser scanning microscope (China).
The literature describes examples of successful preparation of heterocellular 3D models of metastases, e.g., to bones [28,29] or to the liver [30]. In those studies, bone tissue cells and cancer cells (prostate, breast, or colon cancer) have been mixed with hepatocytes in various ratios, e.g., 1:1 [28], 9:1 [29], or 10:1 [30]. To model micrometastasis in the liver and to imitate colonization of the organ by metastatic cells, it is necessary to obtain “micrometastases” consisting of one or a few cells; therefore, in our model, the proportion of breast cancer cells in the spheroid was reduced to 17:1.
The use of model cancer cells expressing a fluorescent protein allows a researcher to track their proliferation: the transition of micrometastasis to macrometastasis. An hour after coincubation of mouse liver cells (from a single-cell suspension) and a CD44– population of human tumorous T47D_Red cells, the initial stage of formation of a spheroid was observed; within it, stand-alone tumor cells were identified (Figure 10). The introduction of IL-6 into the wells triggered a dedifferentiation process [31] and active proliferation of the tumor cells during the first 2 days. The observed increase in the area of tumor foci (Figure 10B, C) imitates the formation of macrometastasis. It must be pointed out that without the induction by IL-6, the cells almost did not proliferate (Figure 10B). Thus, we successfully modeled in vitro the transition of breast cancer micrometastasis to macrometastasis in the liver. According to the staining with Calcein AM, the formed liver spheroid maintains its viability at a constant level for at least 7 days.
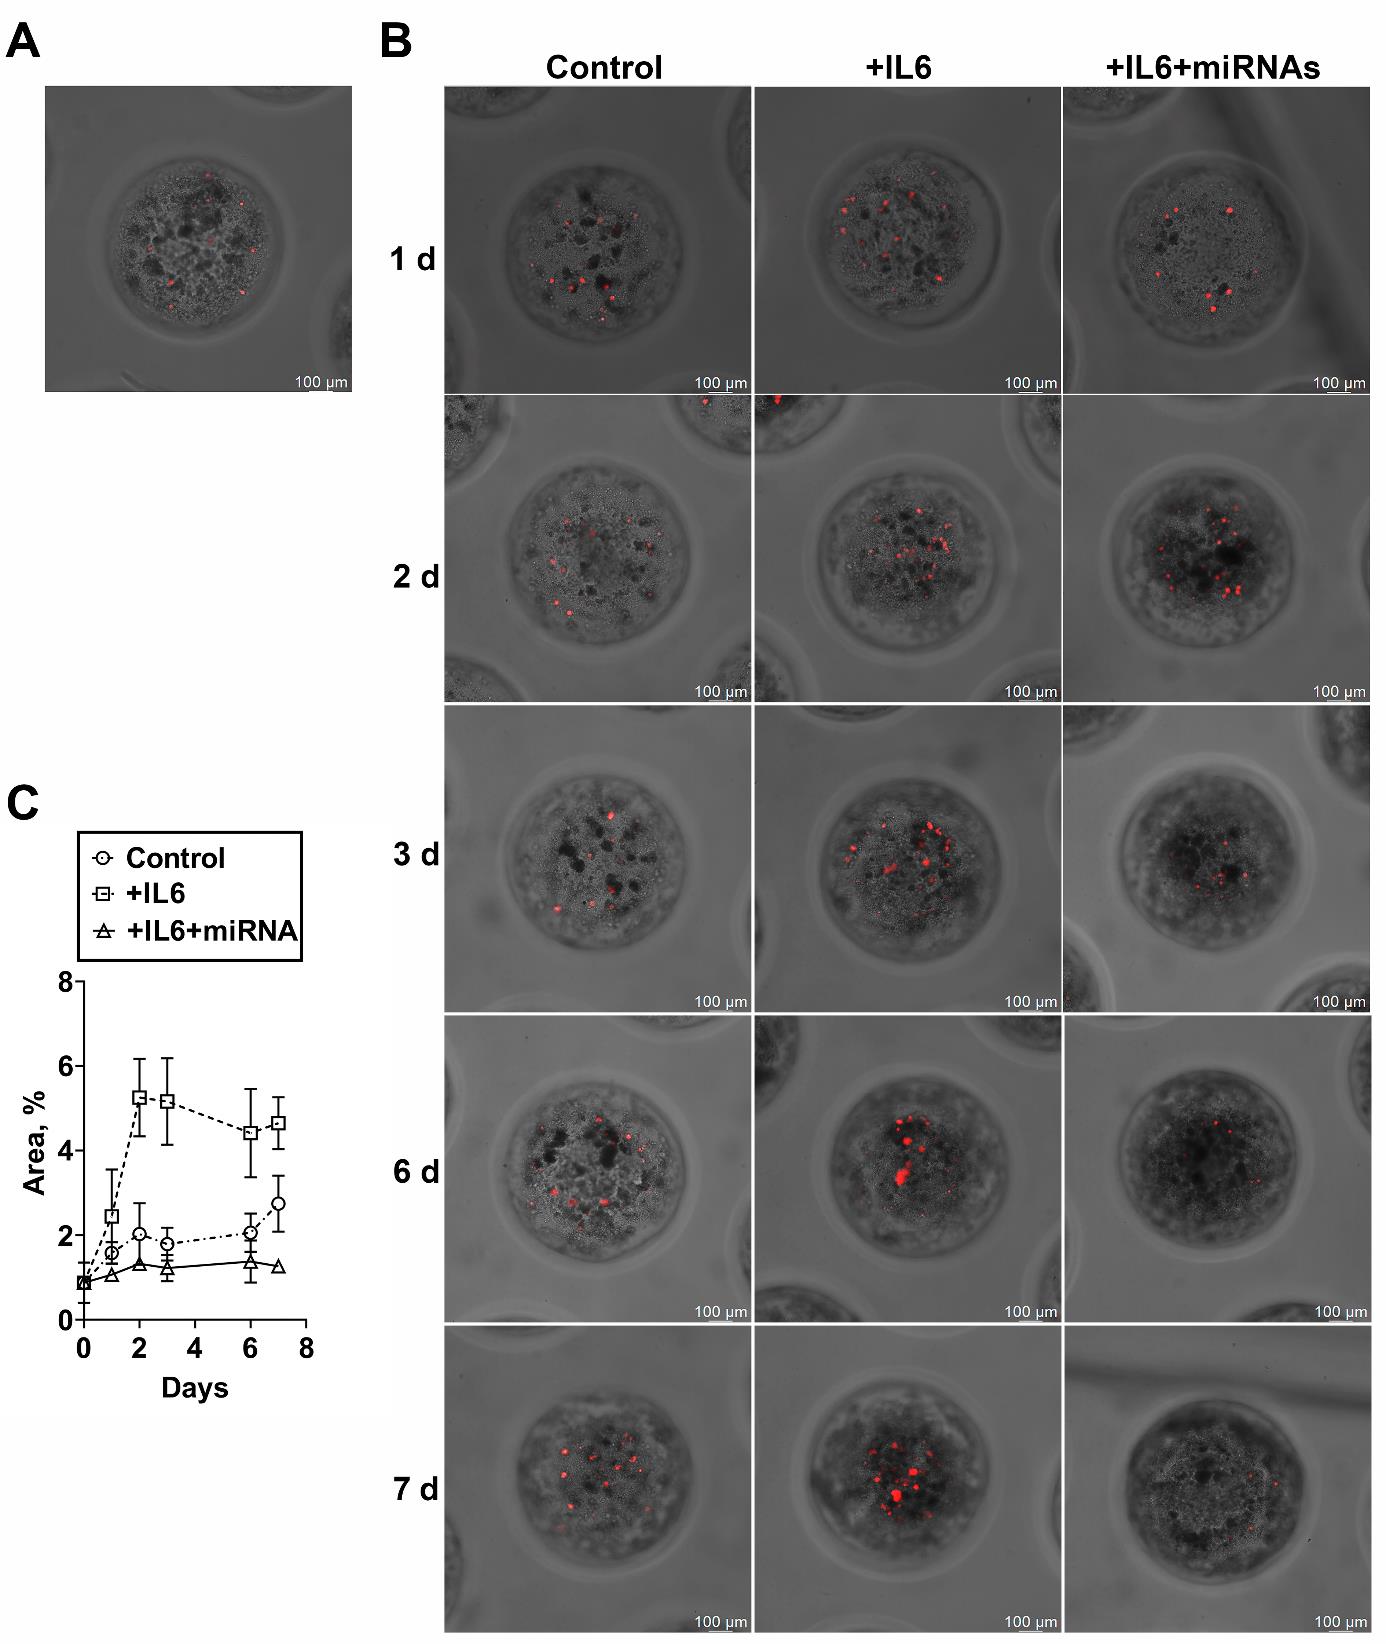
Figure 10. Assay of the efficacy of miRNAs in the model of breast cancer micrometastasis within a three-dimensional (3D) liver spheroid. (A) Representative images of spheroids formed from a single-cell suspension of mouse liver cells and CD44– (differentiated) human breast cancer cells (T47D_Red cells stably expressing RFP) after 1 h of incubation or (B) 1, 2, 3, 6, or 7 days of incubation without dedifferentiation (Control), after induction of dedifferentiation with IL-6 (+IL-6), or after IL-6–induced dedifferentiation and addition of a mixture of miRNAs (+IL-6+miRNAs). (C) A change in the percentage of area occupied by T47D_Red tumor cells in the liver spheroid during incubation for 7 days. Data are presented as mean ± SD.
To determine the applicability of our model to the testing of antimetastatic drugs, we employed a mixture of miRNAs (miR-195-5p, miR-520a, and miR-630) blocking the dedifferentiation of a differentiated cancer cell. For this purpose, IL-6 and a mixture of miRNAs were added to experimental wells containing spheroids at the stage of dedifferentiation induction to block dedifferentiation and to prevent the transition of the micrometastasis to macrometastasis. It was found that there was no increase in the area of tumor foci in liver spheroids when the mixture of miRNAs was added (Figure 10C). The reproducibility of the protocol, namely the ability of the miRNAs mixture to prevent tumor cell proliferation within the three-dimensional liver spheroid, was confirmed in two independent experiments.
Both at the development stage and at the stage of evaluation of the efficiency of drug batches, it is important to confirm the mechanism of biological action. For gene therapy modalities, the development of such rapid assays is in demand [32]. Examination of spheroids by an immunofluorescence assay involving specific antibodies allowed us to analyze the expression of stem cell markers in order to confirm the targeted effect of miRNAs on the cancer cells within the spheroid. One hour after coincubation of a single-cell suspension of mouse liver cells and CD44– T47D_Red cells (the initial stage of spheroid formation), stand-alone differentiated tumor cells with the RFP+CD44–CD24+ phenotype were detectable within the spheroid (Figure 11).
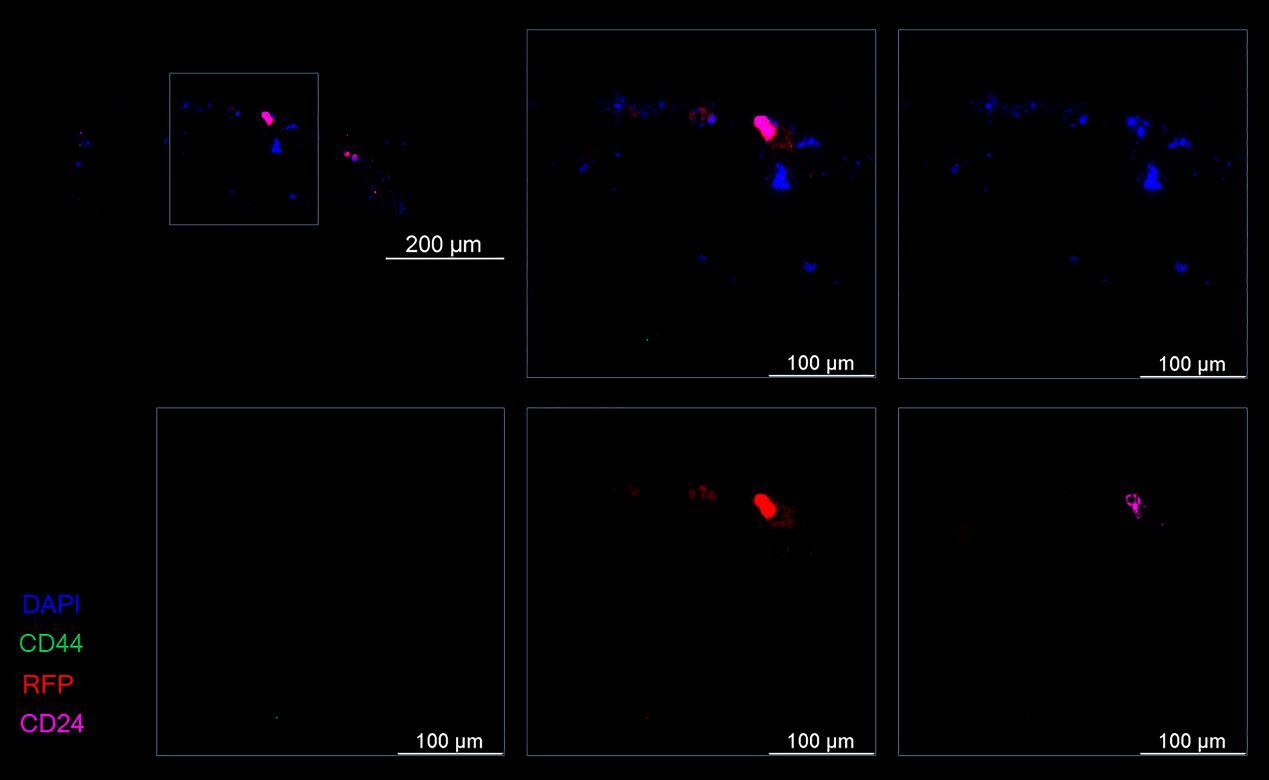
Figure 11. Representative images of a spheroid at the formation stage at 1 h after coincubation of mouse liver cells and differentiated (CD44–) T47D_Red tumor cells. Cancer T47D_Red cells are red, CD44+ cells are green, CD24+ cells are magenta, and nuclei are stained with DAPI (blue).
By day 4 of the experiment, in spheroids after the IL-6–induced dedifferentiation, stand-alone tumor cells with the RFP+CD44+CD24+ phenotype (progenitor cells) or RFP+CD44+CD24– phenotype (stem cells) were observed, as were foci consisting of several tumor cells having the RFP+CD44+CD24+ phenotype (Figure 12A). In the spheroids incubated with IL-6 and the mixture of miRNAs, only a few RFP+CD44+CD24+ cells and RFP+CD44–CD24+ (differentiated) cells were noted within the spheroid (Figure 12B).
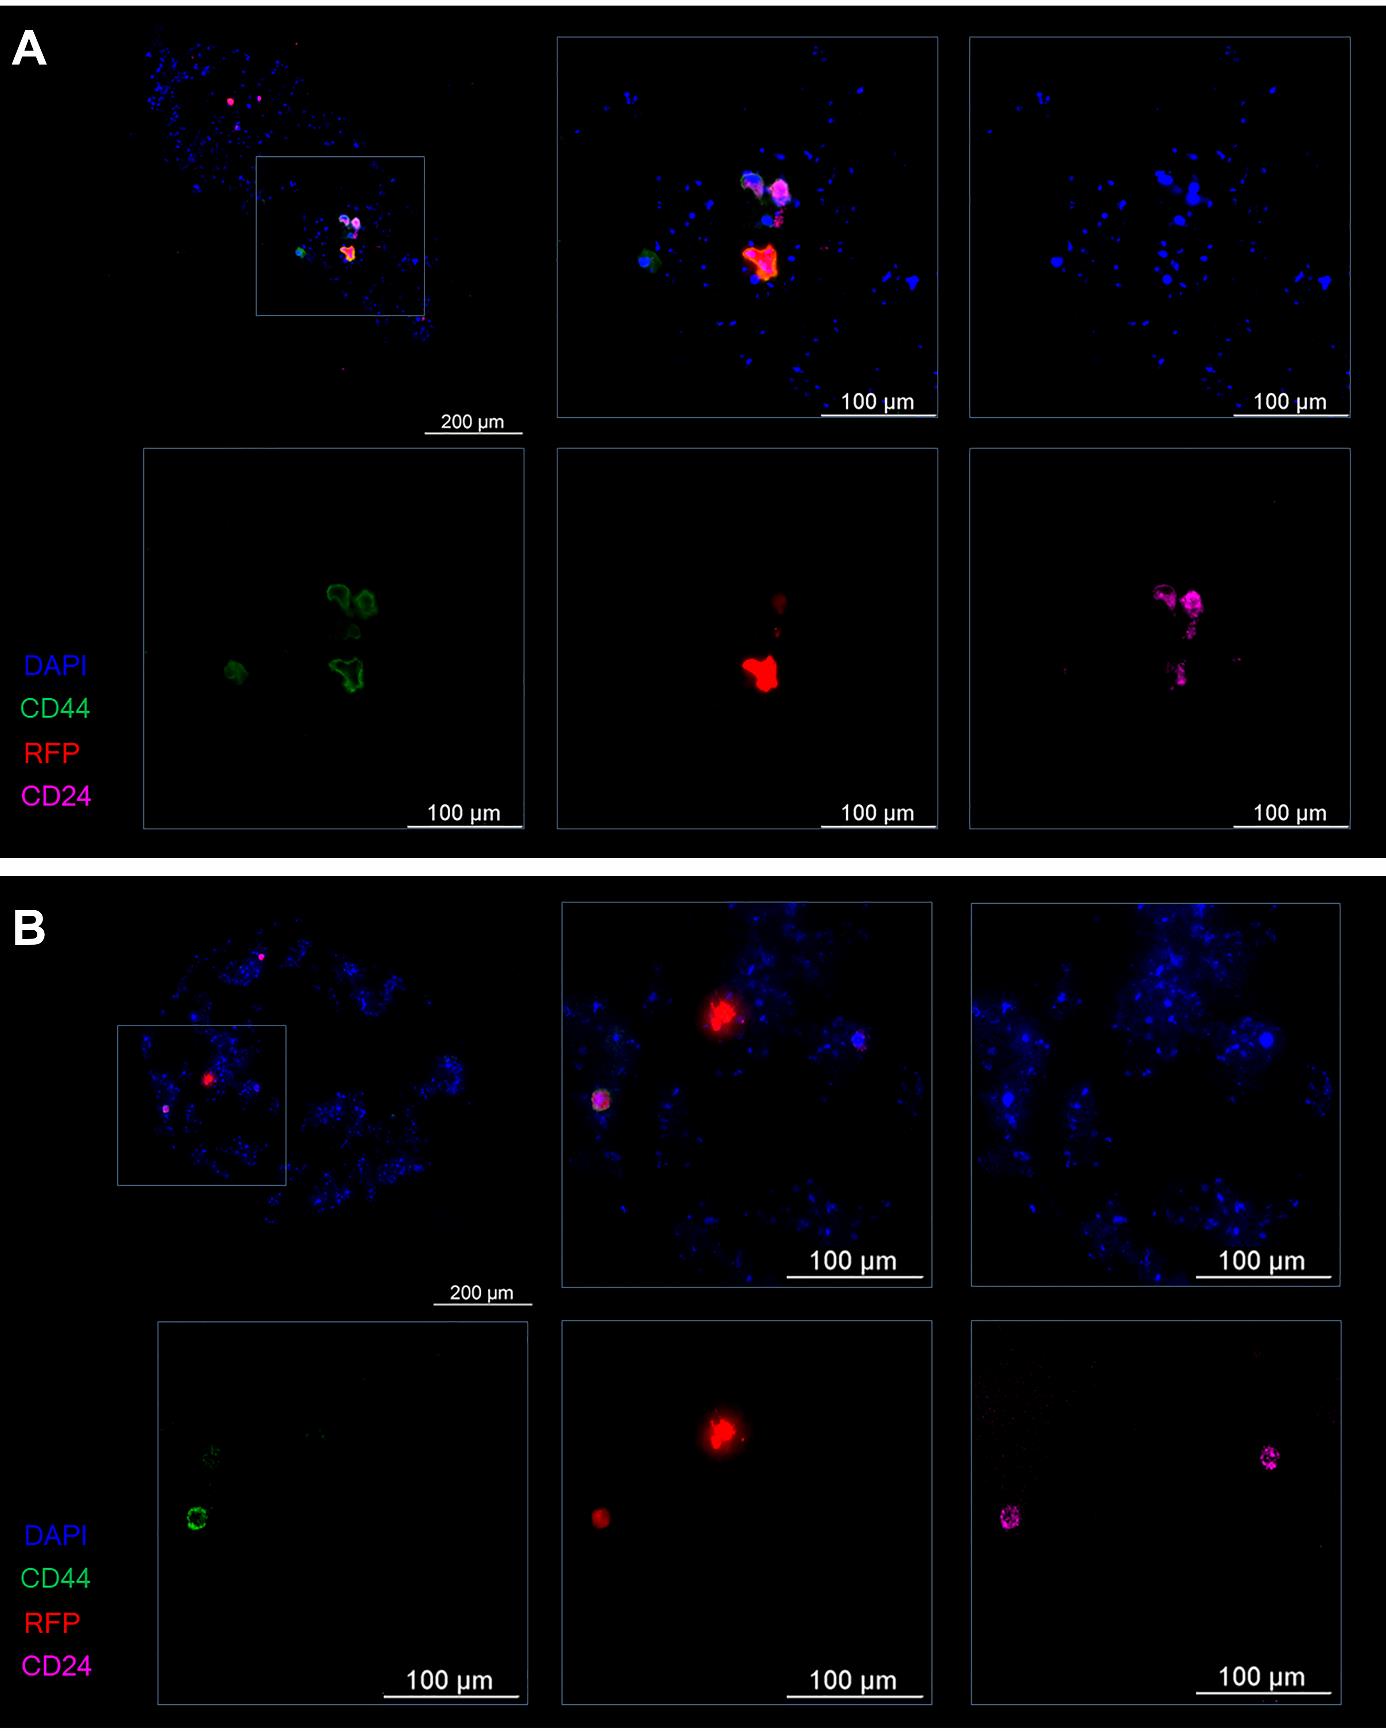
Figure 12. Representative images of the spheroid on the fourth day of the experiment. (A) The control (induction by IL-6) and (B) experiment (induction by IL-6 and treatment with the mixture of miRNAs). Cancer T47D_Red cells are red, CD44+ cells are green, CD24+ cells are magenta, and nuclei are stained with DAPI (blue).
By the seventh day of the experiment, foci of clusters of CD44+CD24–/low stem cells were detectable in spheroids of the control group (without miRNAs) (Figure 13A). Within the spheroids after exposure to the mixture of miRNAs, predominantly differentiated CD44–CD24– cells and only a few CD44–CD24+ cells were found. Progenitor and stem tumor cells were absent (Figure 13B).
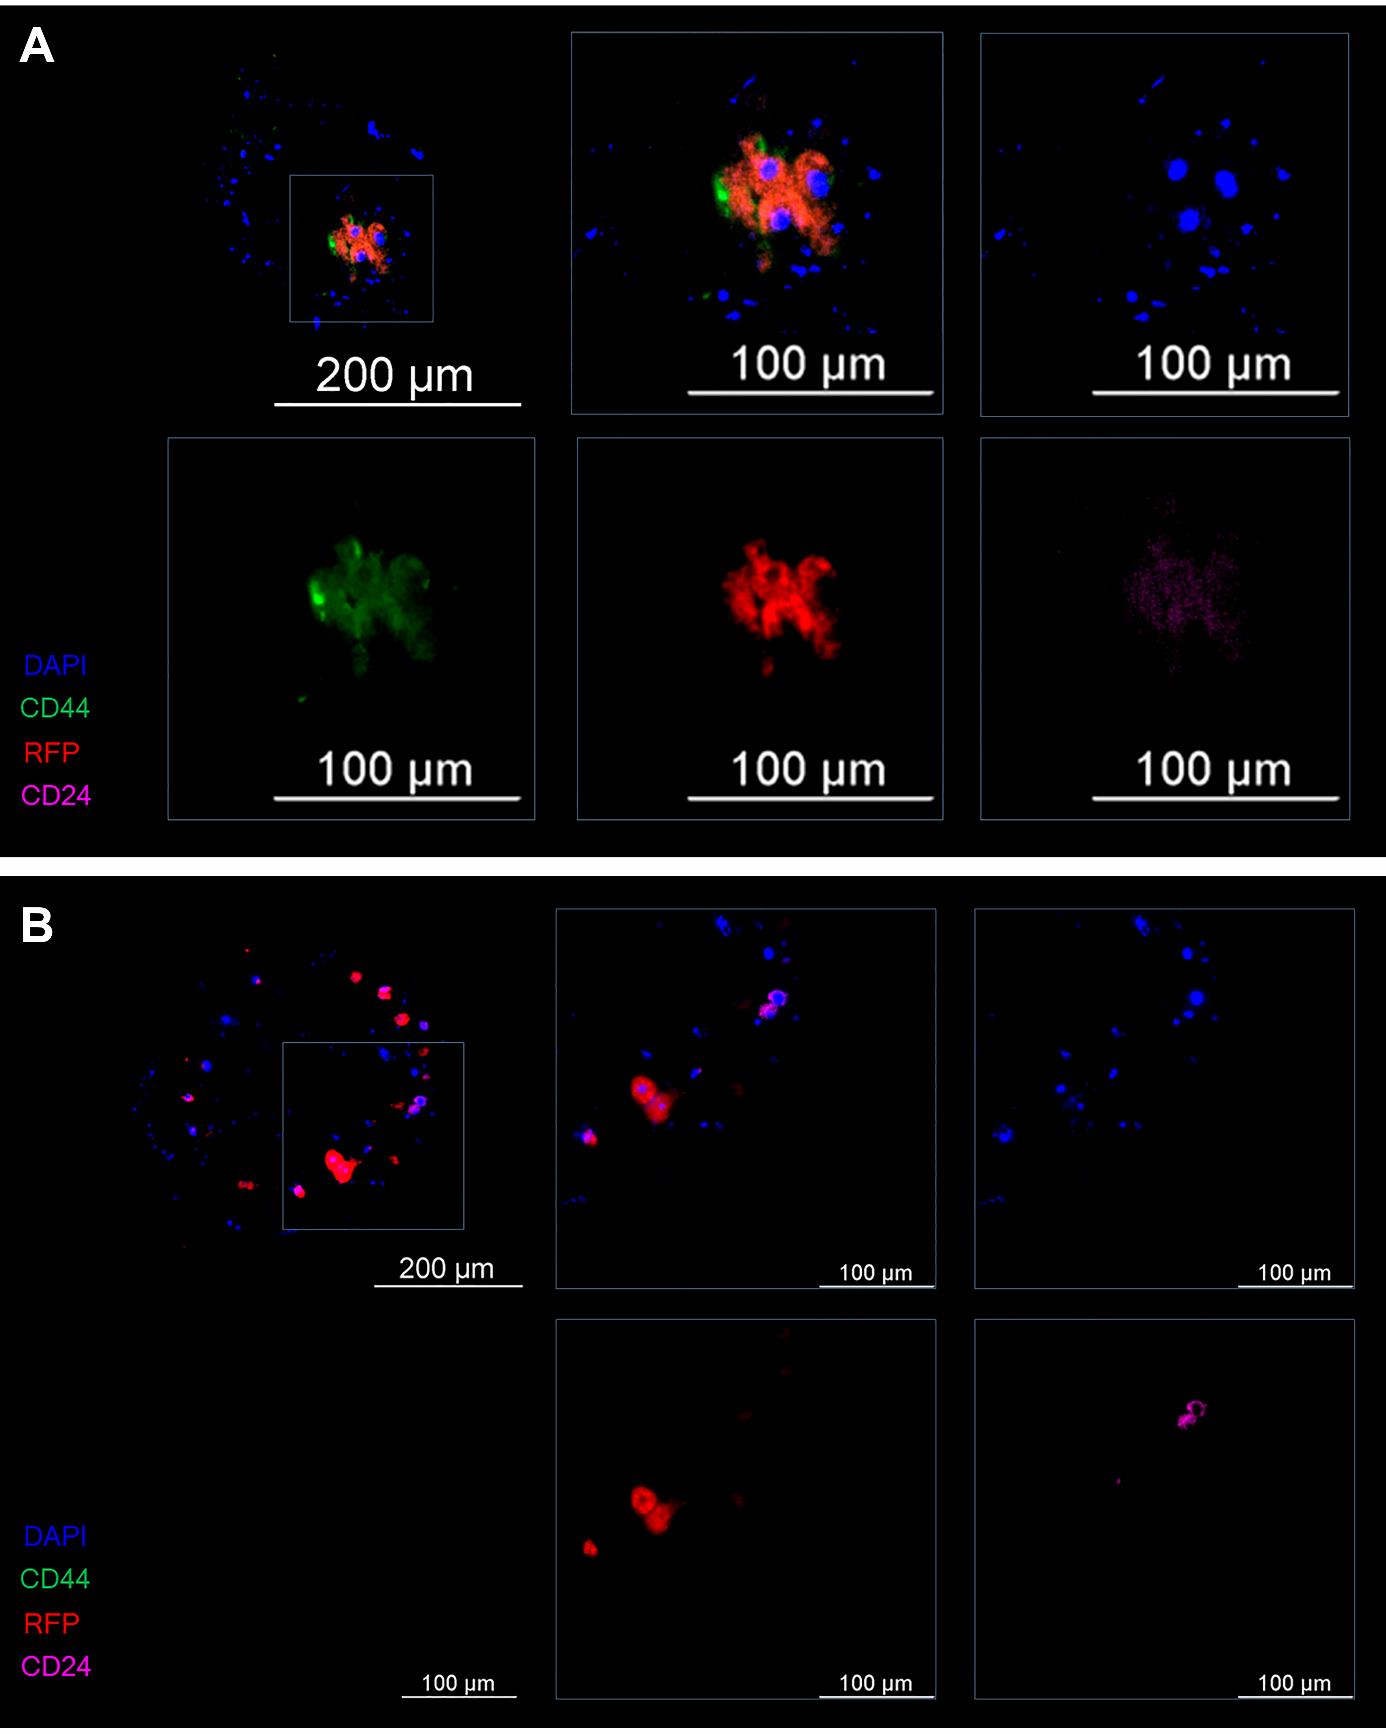
Figure 13. Representative images of the spheroid on the seventh day of the experiment. (A) The control (induction by IL-6) and (B) experiment (induction by IL-6 and treatment with the mixture of miRNAs). Cancer T47D_Red cells are red, CD44+ cells are green, CD24+ cells are magenta, and nuclei are stained with DAPI (blue).
Thus, treatment of the spheroid with the mixture of miRNAs in the model of IL-6–induced dedifferentiation helps tumor cells to retain the differentiated phenotype and prevents their proliferation and thus the transition of micrometastasis to macrometastasis.
Suppression of genes responsible for the induction and maintenance of stemness of tumor cells by means of the miRNAs in the model of IL-6–induced dedifferentiation in liver spheroids was confirmed by the results of a transcriptomic analysis (Figure 14).
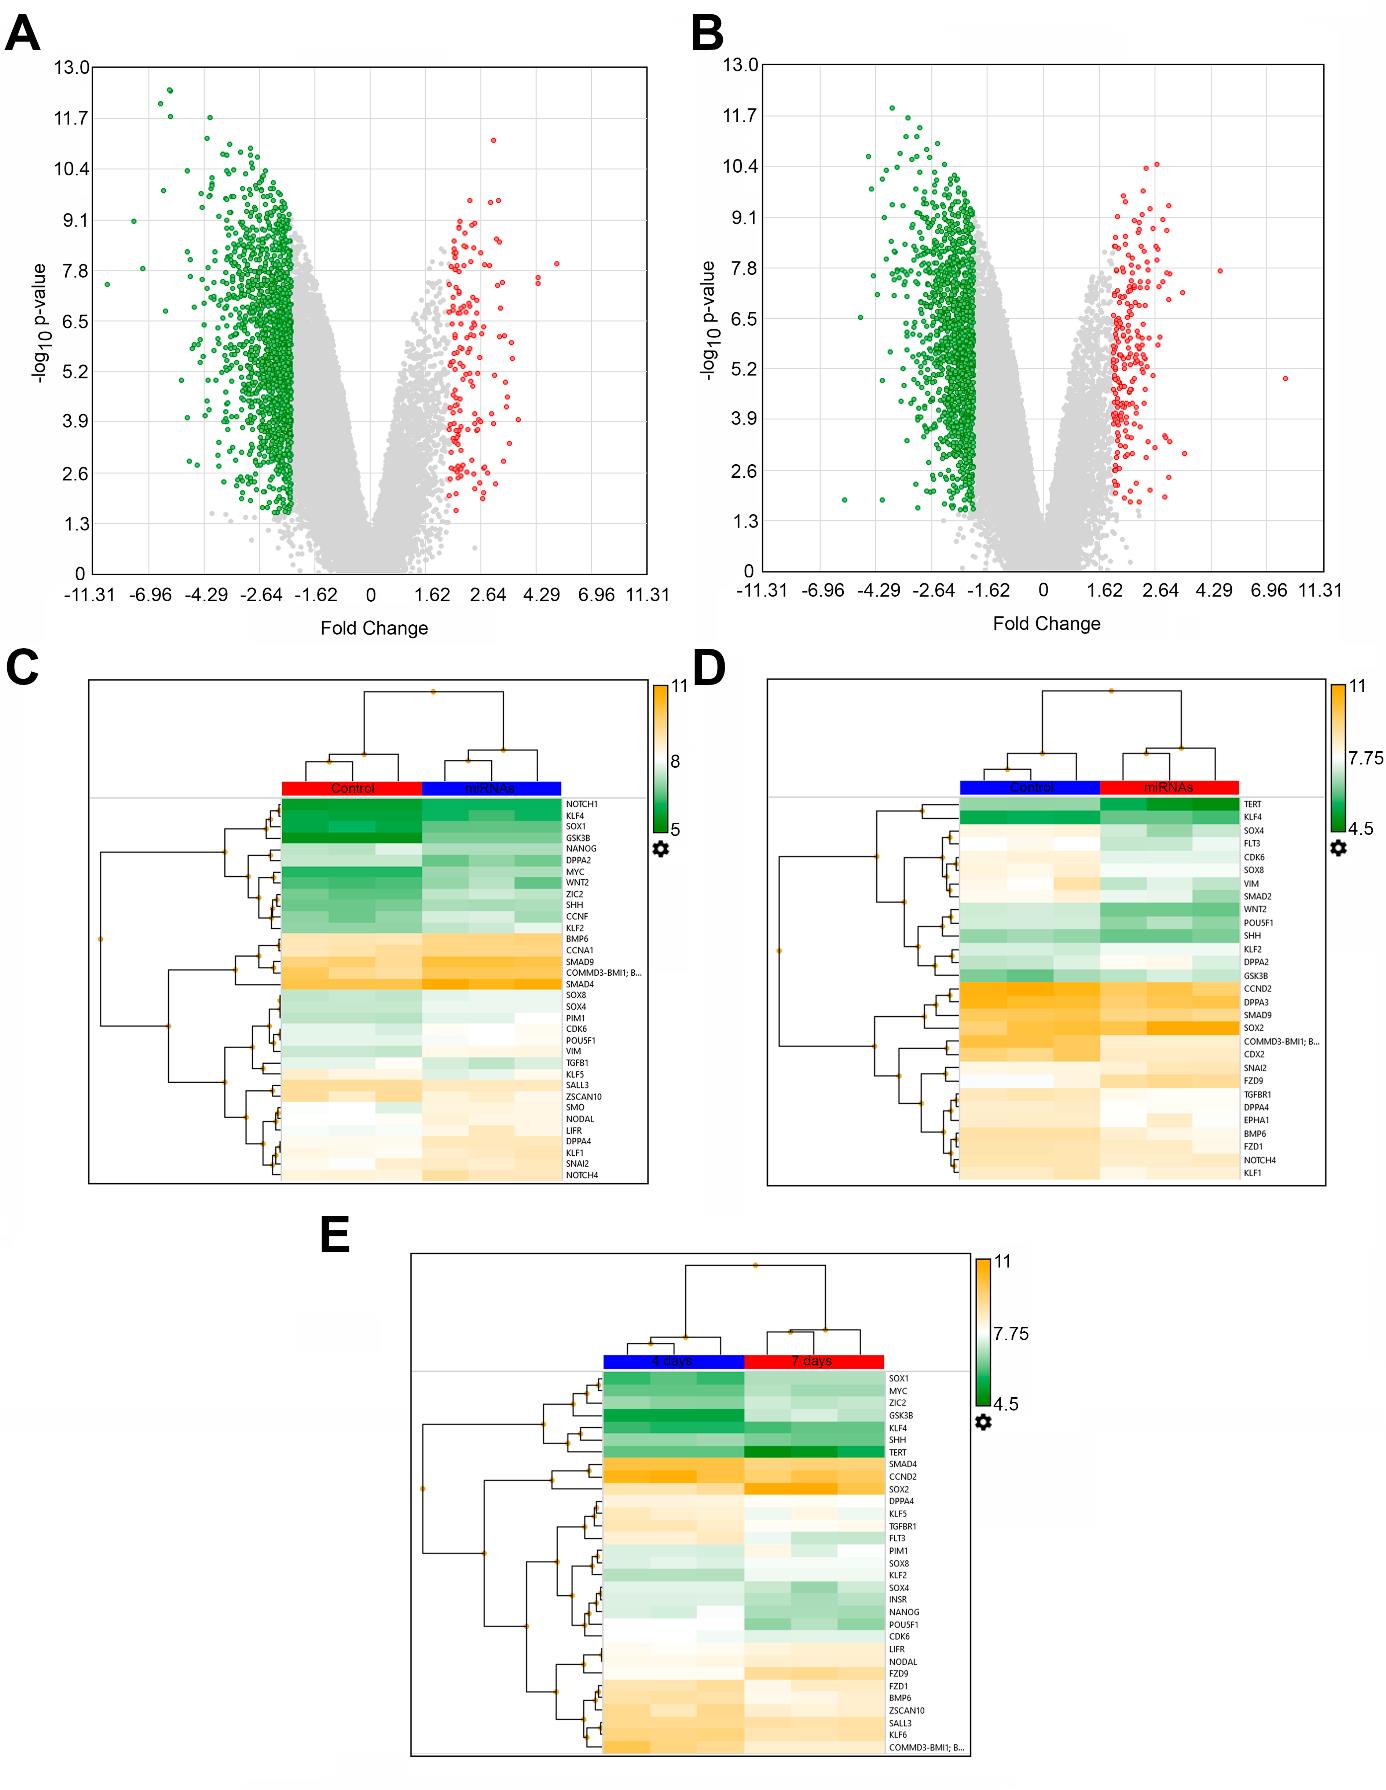
Figure 14. Transcriptomic analysis of human breast cancer T47D_Red cells in the model of IL-6–induced dedifferentiation within 3D liver spheroids under the influence of the mixture of miRNAs on days 4 and 7 of incubation. (A) Volcano plot of gene expression in tumor cells in group “miRNAs” vs. group “Control” on the fourth day and (B) on the seventh day. (C) Heat map of differential expression of stemness genes on the fourth day and (D) on the seventh day (group “miRNAs” vs. “Control”). (E) Heat map of differential expression of stemness genes in group “miRNAs on the fourth day” vs. group “miRNAs on the seventh day.”
Relative to the control, on day 4, miRNAs statistically significantly (p-value < 0.05, false discovery rate–adjusted p-value < 0.05) suppressed 1,484 genes and activated 153 genes. On day 7, the expression of 1,377 genes proved to be reduced, and the expression of 217 genes was found to be enhanced (Figure 14A, B). A separate analysis of stemness genes’ expression (the suppression of which underlies the inhibition of tumor cell dedifferentiation by means of the miRNAs) revealed that on day 4 of the incubation, among the 50 stemness genes assessed, 28 genes were statistically significantly inhibited by the miRNAs, and only six genes were activated (Figure 14C). The suppressive effect of the miRNAs on the stemness genes persisted on day 7; the expression of 22 stemness genes was found to be reduced, and the expression of seven genes proved to be increased (Figure 14D). Among differentially expressed stemness genes, on the seventh day, the inhibitory effect of the miRNAs was still present for 11 stemness genes, and another 11 stemness genes were additionally inhibited; only for four genes, the inhibition switched to activation, while the stemness genes expressed on the fourth day were inactive. If we compare expression levels of the stemness genes under the action of the miRNAs on the fourth and seventh days combined, we can see that the number of suppressed stemness genes is greater than the number of activated ones (19 vs. 12). This observation indicates the persistence and enhancement of miRNAs’ effects over time (Figure 14E).
Thus, according to the transcriptomic analysis, these miRNAs inhibit stemness genes for a long time, thereby preventing the dedifferentiation of tumor cells into stem tumor cells.
General notes and troubleshooting
General notes
Limitations: the drug under study should not fluoresce, at least in the spectrum region in which the cancer cells in question fluoresce, in order to avoid flooding of the sample with background illumination.
Troubleshooting
Problem 1: Spheroids are not formed.
Solution: Optimize tissue dissociation time with collagenase solution. Note that primary murine hepatocyte spheroids display low compaction.
Problem 2: Bacterial contamination of the medium in wells containing spheroids.
Solution: Thoroughly sterilize instruments and disinfect the surgical area prior to liver extraction. Optionally, the spheroid culture medium may be supplemented with a 2× concentration of antibiotic-antimycotic solution.
Problem 3: Spheroids float after sucrose addition.
Solution: To prevent spheroid flotation, slowly pipette sucrose along the side of the agarose mold, away from the spheroids.
Supplementary information
The following supporting information can be downloaded here:
1. Table S1. Ribooligonucleotides
2. Figure S1. Map of the Lenti-gRNA-RFP plasmid
3. Figure S2. Influence of the duration of liver tissue incubation with collagenase (to obtain a single-cell suspension) on spheroid morphology
4. Figure S3. Assessment of the drug’s effect on the viability of liver spheroids by staining with Calcein AM and subsequent fluorescence analysis in ImageJ
5. Figure S4. Establishment of a T47D_Red cell line stably expressing RFP
6. Figure S5. Map of the pGpur plasmid
Acknowledgments
K.V.N.: Writing – original draft, Visualization, Validation, Methodology, Investigation, and Data curation. A.G.P.: Writing – original draft, Methodology, Supervision, Visualization, Data curation, and Conceptualization. L.V.E.: Methodology, Investigation, and Data curation. E.V.S.: Methodology and Investigation. P.K.K.: Investigation. A.Y.R.: Investigation. E.S.H.: Investigation. M.K.I.: Methodology and Investigation. I.A.T.: Investigation. N.V.L.: Writing – original draft, Methodology, Supervision, Data curation, and Conceptualization. E.V.U.: Supervision, Conceptualization, Resources, and Project administration. This protocol was used in [26].
Competing interests
The authors declare no conflicts of interest.
Ethical considerations
These experiments were carried out in accordance with the Guidance on the Operation on the Animals (Scientific Procedures) Act 1986 and associated guidelines, EU Directive 2010/63 for the protection of animals used for scientific purposes, and the NIH (National Research Council) Guide for the Care and Use of Laboratory Animals. The study protocol was approved by the Institutional Animal Care and Use Committee at the Siberian State Medical University (decision No. 1 of 1 November 2023).
References
- Anderson, R. L., Balasas, T., Callaghan, J., Coombes, R. C., Evans, J., Hall, J. A., Kinrade, S., Jones, D., Jones, P. S., Jones, R., et al. (2019). A framework for the development of effective anti-metastatic agents. Nat Rev Clin Oncol. 16(3): 185–204. https://doi.org/10.1038/s41571-018-0134-8
- Massagué, J. and Obenauf, A. C. (2016). Metastatic colonization by circulating tumour cells. Nature. 529(7586): 298–306. https://doi.org/10.1038/nature17038
- Lengrand, J., Pastushenko, I., Vanuytven, S., Song, Y., Venet, D., Sarate, R. M., Bellina, M., Moers, V., Boinet, A., Sifrim, A., et al. (2023). Pharmacological targeting of netrin-1 inhibits EMT in cancer. Nature. 620(7973): 402–408. https://doi.org/10.1038/s41586-023-06372-2
- Pantel, K. and Brakenhoff, R. H. (2004). Dissecting the metastatic cascade. Nat Rev Cancer. 4(6): 448–456. https://doi.org/10.1038/nrc1370
- Riggio, A. I., Varley, K. E. and Welm, A. L. (2021). The lingering mysteries of metastatic recurrence in breast cancer. Brit J Cancer. 124(1): 13–26. https://doi.org/10.1038/s41416-020-01161-4
- Luzzi, K. J., MacDonald, I. C., Schmidt, E. E., Kerkvliet, N., Morris, V. L., Chambers, A. F. and Groom, A. C. (1998). Multistep nature of metastatic inefficiency: dormancy of solitary cells after successful extravasation and limited survival of early micrometastases. Am J Pathol. 153(3): 865–873. https://doi.org/10.1016/s0002-9440(10)65628-3
- Ren, D., Dai, Y., Yang, Q., Zhang, X., Guo, W., Ye, L., Huang, S., Chen, X., Lai, Y., Du, H., et al. (2019). Wnt5a induces and maintains prostate cancer cells dormancy in bone. J Exp Med. 216(2): 428–449. https://doi.org/10.1084/jem.20180661
- Zhou, N., Liu, Q., Wang, X., He, L., Zhang, T., Zhou, H., Zhu, X., Zhou, T., Deng, G. and Qiu, C. (2022). The combination of hydroxychloroquine and 2-deoxyglucose enhances apoptosis in breast cancer cells by blocking protective autophagy and sustaining endoplasmic reticulum stress. Cell Death Discov. 8(1): 286. https://doi.org/10.1038/s41420-022-01074-6
- Nevskaya, K. V., Pershina, A. G., Hmelevskaya, E. S., Efimova, L. V., Ibragimova, M. K., Dolgasheva, D. S., Tsydenova, I. A., Ufandeev, A. A., Buyko, E. E., Perina, E. A., et al. (2024). Prevention of Metastasis by Suppression of Stemness Genes Using a Combination of microRNAs. J Med Chem. 67(7): 5591–5602. https://doi.org/10.1021/acs.jmedchem.3c02199
- Giacobbe, A. and Abate-Shen, C. (2021). Modeling metastasis in mice: a closer look. Trends Cancer. 7(10): 916–929. https://doi.org/10.1016/j.trecan.2021.06.010
- Dai, J., Cimino, P. J., Gouin, K. H., 3rd, Grzelak, C. A., Barrett, A., Lim, A. R., Long, A., Weaver, S., Saldin, L. T., Uzamere, A., et al. (2022). Astrocytic laminin-211 drives disseminated breast tumor cell dormancy in brain. Nat Cancer. 3(1): 25–42. https://doi.org/10.1038/s43018-021-00297-3
- Kostlan, R. J., Phoenix, J. T., Budreika, A., Ferrari, M. G., Khurana, N., Cho, J. E., Juckette, K., McCollum, B. L., Moskal, R., Mannan, R., et al. (2023). Clinically relevant humanized mouse models of metastatic prostate cancer to evaluate cancer therapies. bioRxiv. https://doi.org/10.1101/2023.10.13.562280
- Grompe, M. and Strom, S. (2013). Mice with human livers. Gastroenterology. 145(6): 1209–1214. https://doi.org/10.1053/j.gastro.2013.09.009
- Breschi, A., Gingeras, T. R. and Guigó, R. (2017). Comparative transcriptomics in human and mouse. Nat Rev Genet. 18(7): 425–440. https://doi.org/10.1038/nrg.2017.19
- Chen, P., Liao, K. and Xiao, C. (2018). MicroRNA says no to mass production. Nat Immunol. 19(10): 1040–1042. https://doi.org/10.1038/s41590-018-0215-y
- Jiang, C., Li, P., Ruan, X., Ma, Y., Kawai, K., Suemizu, H. and Cao, H. (2020). Comparative Transcriptomics Analyses in Livers of Mice, Humans, and Humanized Mice Define Human-Specific Gene Networks. Cells. 9(12). https://doi.org/10.3390/cells9122566
- Ruiz-Espigares, J., Nieto, D., Moroni, L., Jiménez, G. and Marchal, J. A. (2021). Evolution of Metastasis Study Models toward Metastasis-On-A-Chip: The Ultimate Model? Small. 17(14): e2006009. https://doi.org/10.1002/smll.202006009
- Nuckhir, M., Withey, D., Cabral, S., Harrison, H. and Clarke, R. B. (2024). State of the Art Modelling of the Breast Cancer Metastatic Microenvironment: Where Are We? J Mammary Gland Biol Neoplasia. 29(1): 14. https://doi.org/10.1007/s10911-024-09567-z
- Tsilimigras, D. I., Brodt, P., Clavien, P.-A., Muschel, R. J., D’Angelica, M. I., Endo, I., Parks, R. W., Doyle, M., de Santibañes, E. and Pawlik, T. M. (2021). Liver metastases. Nat Rev Dis Primers. 7(1): 27. https://doi.org/10.1038/s41572-021-00261-6
- Ibragimova, M. K., Tsyganov, M. M., Kravtsova, E. A., Tsydenova, I. A. and Litviakov, N. V. (2023). Organ-Specificity of Breast Cancer Metastasis. Int J Mol Sci. 24(21): 15625. https://doi.org/10.3390/ijms242115625
- Bersini, S., Jeon, J. S., Dubini, G., Arrigoni, C., Chung, S., Charest, J. L., Moretti, M. and Kamm, R. D. (2014). A microfluidic 3D in vitro model for specificity of breast cancer metastasis to bone. Biomaterials. 35(8): 2454–2461. https://doi.org/10.1016/j.biomaterials.2013.11.050
- Kim, J., Lee, C., Kim, I., Ro, J., Kim, J., Min, Y., Park, J., Sunkara, V., Park, Y. S., Michael, I., et al. (2020). Three-Dimensional Human Liver-Chip Emulating Premetastatic Niche Formation by Breast Cancer-Derived Extracellular Vesicles. ACS Nano. 14(11): 14971–14988. https://doi.org/10.1021/acsnano.0c04778
- Xu, Z., Li, E., Guo, Z., Yu, R., Hao, H., Xu, Y., Sun, Z., Li, X., Lyu, J. and Wang, Q. (2016). Design and Construction of a Multi-Organ Microfluidic Chip Mimicking the in vivo Microenvironment of Lung Cancer Metastasis. ACS Appl Mater Interfaces. 8(39): 25840–25847. https://doi.org/10.1021/acsami.6b08746
- Schindelin, J., Arganda-Carreras, I., Frise, E., Kaynig, V., Longair, M., Pietzsch, T., Preibisch, S., Rueden, C., Saalfeld, S., Schmid, B., et al. (2012). Fiji: an open-source platform for biological-image analysis. Nat Methods. 9(7): 676–682. https://doi.org/10.1038/nmeth.2019
- Lacalle, D., Castro-Abril, H. A., Randelovic, T., Domínguez, C., Heras, J., Mata, E., Mata, G., Méndez, Y., Pascual, V., Ochoa, I., et al. (2021). SpheroidJ: An Open-Source Set of Tools for Spheroid Segmentation. Comput Methods Programs Biomed. 200: 105837. https://doi.org/10.1016/j.cmpb.2020.105837
- Nevskaya, K. V., Efimova, L. V., Kozlova, P. K., Pershina, A. G. and Udut, E. V. (2025). Heterocellular spheroids as a model of liver metastasis. Vestn Tomsk Gos Univ, Biol. 69: 122–129. https://doi.org/10.17223/19988591/69/14
- Pershina, A. G., Efimova, L. V., Brikunova, O. Y., Nevskaya, K. V., Sukhinina, E. V., Hmelevskaya, E. S., Demin, A. M., Naumenko, V. A., Malkeyeva, D., Kiseleva, E., et al. (2024). Nano-bio interaction of magnetic nanoparticles with cells in a tumor at the single-cell level. Nano Today. 56: 102300. https://doi.org/https://doi.org/10.1016/j.nantod.2024.102300
- Suurmond, C. E., Leeuwenburgh, S. C. G. and van den Beucken, J. (2024). Modelling bone metastasis in spheroids to study cancer progression and screen cisplatin efficacy. Cell Prolif. 57(9): e13693. https://doi.org/10.1111/cpr.13693
- Kumar, V., Naqvi, S. M., Verbruggen, A., McEvoy, E. and McNamara, L. M. (2024). A mechanobiological model of bone metastasis reveals that mechanical stimulation inhibits the pro-osteolytic effects of breast cancer cells. Cell Rep. 43(5): 114043. https://doi.org/10.1016/j.celrep.2024.114043
- Skardal, A., Devarasetty, M., Rodman, C., Atala, A. and Soker, S. (2015). Liver-Tumor Hybrid Organoids for Modeling Tumor Growth and Drug Response In Vitro. Ann Biomed Eng. 43(10): 2361–2373. https://doi.org/10.1007/s10439-015-1298-3
- Nevskaya, K. V., Efimova, L. V., Korda, P. V., Dolgasheva, D. S., Ibragimova, M. K., Menyailo, M. E., Udut, E. V., Litviakov, N. V. and Pershina, A. G. (2022). Optimization of mammosphere formation assay for quantif cation of il6-induced stemness in differentiated breast cancer cells. Sib J Oncol. 21(6): 59–67. https://doi.org/10.21294/1814-4861-2022-21-6-59-67
- Salmikangas, P., Carlsson, B., Klumb, C., Reimer, T. and Thirstrup, S. (2023). Potency testing of cell and gene therapy products. Front Med (Lausanne) 10: 1190016. https://doi.org/10.3389/fmed.2023.1190016
Article Information
Publication history
Received: Jul 2, 2025
Accepted: Aug 20, 2025
Available online: Sep 2, 2025
Published: Sep 20, 2025
Copyright
© 2025 The Author(s); This is an open access article under the CC BY-NC license (https://creativecommons.org/licenses/by-nc/4.0/).
How to cite
Nevskaya, K. V., Pershina, A. G., Efimova, L. V., Sukhinina, E. V., Kozlova, P. K., Ryzhkova, A. Y., Hmelevskaya, E. S., Ibragimova, M. K., Tsydenova, I. A., Litviakov, N. V. and Udut, E. V. (2025). A Model of Breast Cancer Micrometastasis in a Three-Dimensional (3D) Liver Spheroid for Testing an Antimetastatic Therapy. Bio-protocol 15(18): e5454. DOI: 10.21769/BioProtoc.5454.
Category
Cancer Biology > Invasion & metastasis > Animal models
Cancer Biology > General technique > Drug discovery and analysis
Cancer Biology > Microenvironment
Do you have any questions about this protocol?
Post your question to gather feedback from the community. We will also invite the authors of this article to respond.