- Protocols

- Articles and Issues
- For Authors
- About
- Become a Reviewer

An Optimized Enzyme-Coupled Spectrophotometric Method for Measuring Pyruvate Kinase Kinetics
Published: Vol 15, Iss 16, Aug 20, 2025 DOI: 10.21769/BioProtoc.5415 Views: 2455
Reviewed by: Elena A. OstrakhovitchAnonymous reviewer(s)
Original research article
The authors used this protocol in:
Mar 2025

Protocol Collections
Comprehensive collections of detailed, peer-reviewed protocols focusing on specific topics


Related protocols

Abstract
Pyruvate kinase M2 (PKM2) is a key glycolytic enzyme that catalyzes the conversion of phosphoenolpyruvate (PEP) to pyruvate, producing ATP in the final step of glycolysis. Unlike other isoforms, PKM2 is uniquely regulated, shifting between active tetramers and less active dimers to balance energy production with biosynthetic demands. This flexibility is exploited in cancer cells to support the Warburg effect and anabolic growth. Additionally, PKM2 can translocate to the nucleus and act as a transcriptional co-activator, influencing gene expression and tumor progression. To facilitate functional studies of PKM2, we present a robust and reproducible protocol for its expression, purification, and enzymatic characterization. PKM2 is expressed in E. coli and purified via Ni-NTA affinity and size-exclusion chromatography to ensure high purity and proper folding. Enzymatic activity is measured using a lactate dehydrogenase (LDH)-coupled assay that tracks NADH oxidation at 340 nm, allowing sensitive kinetic analysis under various conditions, including different PEP concentrations, pH levels, and presence of the allosteric activator fructose-1,6-bisphosphate (FBP). This non-radioactive, high-resolution method is suitable for analyzing PKM2 regulation, post-translational modifications, and mutant variants, as well as for screening potential therapeutic modulators, providing a valuable tool for cancer metabolism research.
Key features
• Enables robust and scalable expression of recombinant wild-type PKM2 in E. coli, yielding protein suitable for biochemical and structural studies.
• Utilizes a non-radioactive, LDH-coupled spectrophotometric assay to accurately measure PKM2 enzymatic activity in real time by monitoring NADH consumption at 340 nm.
• Supports kinetic analysis under physiologically relevant conditions, including variable pH and in the presence or absence of the allosteric activator fructose-1,6-bisphosphate (FBP).
• Suitable for comparative activity profiling of PKM2 variants, mutants, or post-translationally modified forms.
Keywords: PKM2Graphical overview
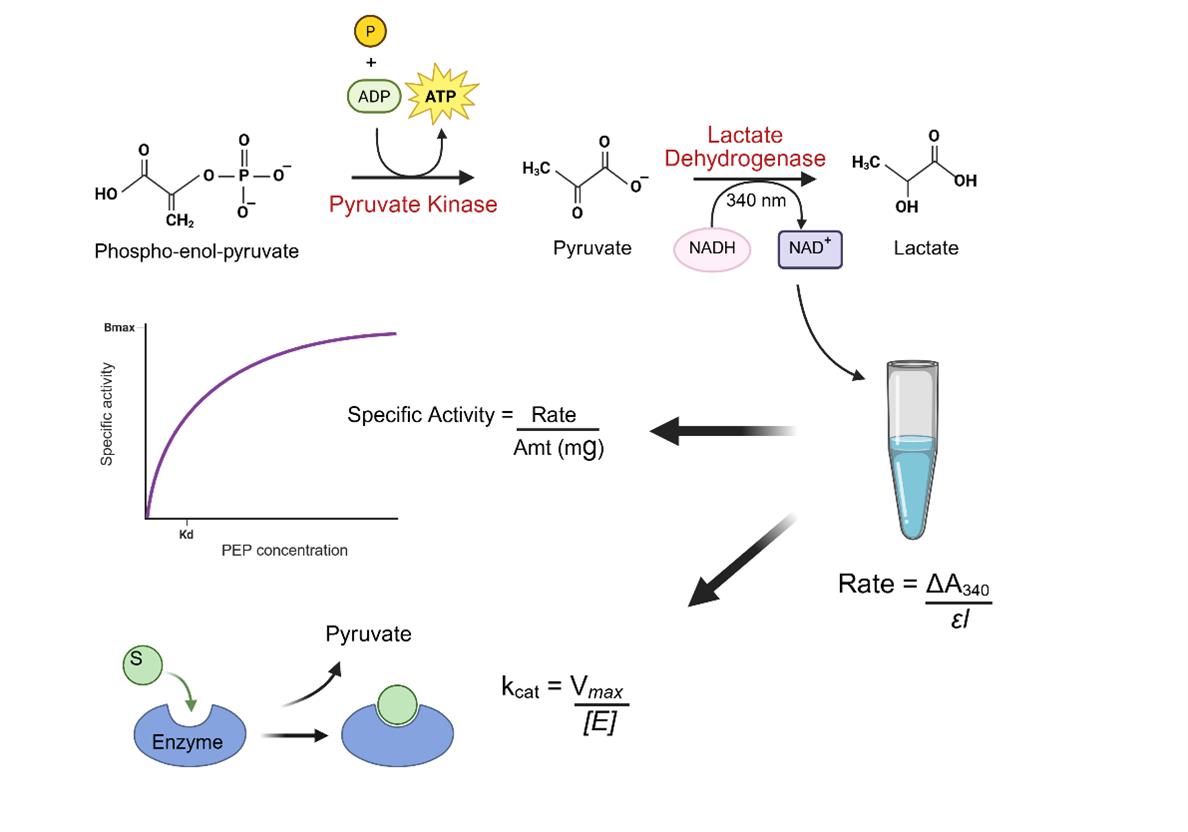
Schematic overview of the coupled enzyme assay for measuring pyruvate kinase activity. The assay monitors pyruvate kinase (PK)-catalyzed conversion of phosphoenolpyruvate (PEP) and ADP to pyruvate and ATP. The pyruvate formed is subsequently reduced to lactate by the lactate dehydrogenase (LDH), which oxidizes NADH to NAD+. The decrease in NADH concentration is measured spectrophotometrically at 340 nm and used to determine enzyme activity. This assay provides a sensitive and quantitative method for analyzing PK activity and enzyme kinetics.
Background
Pyruvate kinase M2 (PKM2) is a key regulatory enzyme in the glycolytic pathway, responsible for catalyzing the final, ATP-generating step in which phosphoenolpyruvate (PEP) is converted to pyruvate [1]. Unlike the other pyruvate kinase isoforms (PKL, PKR, and PKM1), PKM2 is uniquely regulated, capable of existing in multiple oligomeric states—highly active tetramers or less active dimers—allowing it to toggle between promoting energy production and facilitating biosynthetic processes [2,3]. This dynamic regulatory property is particularly relevant in rapidly proliferating and cancerous cells, where PKM2 plays a dual role: maintaining glycolytic flux through the Warburg effect and acting as a nuclear transcriptional co-activator that promotes gene expression linked to cell growth and survival [1,4].
In cancer metabolism, PKM2 serves as a metabolic checkpoint that supports anabolic growth. The less active dimeric form slows pyruvate formation, leading to the accumulation of upstream glycolytic intermediates that are redirected into biosynthetic pathways for nucleotide, amino acid, and lipid synthesis [5]. Meanwhile, nuclear PKM2 modulates gene transcription by interacting with transcription factors such as HIF-1α and β-catenin, thereby linking metabolic status to cellular signaling networks [6,7]. This multifaceted functionality makes PKM2 an attractive therapeutic target, and understanding its biochemical behavior under different conditions is essential for uncovering regulatory mechanisms and discovering modulators.
In recent years, enzyme activity assays have emerged as powerful tools for elucidating the function and inhibition of key enzymes involved in metabolic regulation and disease. Robust enzymatic assays have been successfully developed for a range of enzymes, including D-amino acid oxidase (DAAO), SARS-CoV-2 main protease 3CLpro, and others [8,9]. These tools have proven invaluable for screening small-molecule inhibitors, understanding catalytic mechanisms, and validating potential drug targets. Similarly, there is a critical need for reliable, reproducible assays to study PKM2 activity with high sensitivity and quantitative rigor.
The present protocol addresses this need by offering a streamlined pipeline for the expression, purification, and enzymatic characterization of wild-type PKM2. PKM2 is expressed in Escherichia coli and purified using Ni-NTA affinity chromatography followed by size-exclusion chromatography, resulting in a highly pure, properly folded protein suitable for downstream biochemical and structural studies [10]. A major strength of this protocol lies in its enzymatic activity assay, which employs a lactate dehydrogenase (LDH)-coupled spectrophotometric method to monitor NADH oxidation at 340 nm in real time [11]. This non-radioactive approach allows for continuous kinetic readouts and is both safe and scalable.
The assay is optimized to assess pyruvate kinase activity across a wide range of PEP concentrations, pH values, and in the presence or absence of the allosteric activator fructose-1,6-bisphosphate (FBP). It enables accurate determination of key kinetic parameters such as Km, Vmax, and kcat, and is adaptable to evaluate PKM2 mutants, post-translationally modified forms, and potential inhibitors or activators. Compared to traditional assays using crude lysates or radioactive tracers, this method offers improved specificity, reproducibility, and quantitative resolution. This protocol improves upon existing PK activity assays by offering a higher-resolution kinetic profile, a defined workflow for FBP-stimulated activity, and optimized substrate saturation conditions. Unlike prior generalized methods, this protocol includes a validated, reproducible expression and purification system yielding highly pure PKM2 for consistent biochemical assays. The protocol is also compatible with high-throughput screening platforms and structural techniques like crystallography and cryo-EM, making it a valuable resource for dissecting PKM2 regulation and targeting its activity in cancer and metabolic research.
Materials and reagents
Biological materials
1. pET28a vector containing wild-type PKM2 gene (available from Addgene #25538); store at -20 °C
2. E. coli BL21 (DE3) competent cells (NEB, catalog number: C2527H); store at -80 °C
Reagents
Notes:
1. PEP, NADH, and FBP are light- and temperature-sensitive; handle with care.
2. Buffers should be freshly prepared or stored at 4 °C for up to 2 weeks unless otherwise stated by the vendors.
3. Enzyme and cofactor stocks should be stored in small aliquots to avoid freeze–thaw cycles.
1. Protein ladder (Bio-Rad, catalog number: 1610375); store at -20 °C
2. Coomassie Brilliant Blue R-250** (Sigma-Aldrich, catalog number: B0149); store at room temperature
3. SDS-PAGE Gel kit reagents** (Bio-Rad, catalog number: 1610156)
4. Ammonium persulfate (APS) (catalog number: 1610700)
5. TEMED, 5 mL (catalog number: 1610800) and 50 mL (catalog number: 1610801)
6. Gel buffers: Resolving (catalog number: 1610798) and stacking (catalog number: 1610799)
7. Sample buffers: 4× Laemmli (catalog number: 1610747) and 2× Laemmli (catalog number: 1610737)
8. 2-Mercaptoethanol (β-mercaptoethanol) (catalog number: 1610710)
9. Dithiothreitol (DTT) (catalog numbers: 1610610)
10. Fructose-1,6-bisphosphate (FBP), trisodium salt (Sigma-Aldrich, catalog number: F6803); 100 mM stock, store at -80 °C
11. PEP, sodium salt (Sigma-Aldrich, catalog number: P7127); 100 mM stock, store at -20 °C
12. ADP, disodium salt (Sigma-Aldrich, catalog number: A2754); 100 mM stock, store at -20 °C
13. NADH (β-Nicotinamide adenine dinucleotide, reduced form) (Sigma-Aldrich, catalog number: N7410); 10 mM stock, light-sensitive, store at -20 °C in amber tubes
14. Lactate dehydrogenase (LDH) from rabbit muscle (Sigma-Aldrich, catalog number: L1254); ≥4 U/mL final, aliquots stored at -20 °C
15. MgCl2 (Sigma-Aldrich, catalog number: M8266); 1 M stock stored at 4 °C
16. EDTA disodium salt dihydrate (Sigma-Aldrich, catalog number: E5134); 0.5 M stock stored at room temperature
17. Glycerol (Sigma-Aldrich, catalog number: G5516); store at room temperature
18. Imidazole (Sigma-Aldrich, catalog number: I5513); 1 M stock stored at 4 °C
19. NaCl (Sigma-Aldrich, catalog number: S7653); store at room temperature
20. KCl (Sigma-Aldrich, catalog number: P5405); store at room temperature
21. Tris-HCl, pH 7.5 (Sigma-Aldrich, catalog number: T6066); 1 M stock stored at 4 °C
22. Kanamycin sulfate (Sigma-Aldrich, catalog number: K1377); 50 mg/mL stock stored at -20 °C
23. Terrific Broth (TB) medium (Invitrogen, catalog number: 22711022); store at room temperature
24. Luria–Bertani (LB) medium (Invitrogen, catalog number: 12780052); store at room temperature
25. HEPES, pH 7.5 (Sigma-Aldrich, catalog number: 83264); 1 M stock stored at 4 °C
Solutions
1. Buffers for PKM2 purification (see Recipes)
Buffer A (lysis/binding buffer)
Elution buffer
Storage buffer (for dialysis and SEC)
2. Buffers and stocks for PKM2 activity assay (see Recipes)
Assay buffer
PEP stock
ADP stock
FBP stock
NADH stock
LDH stock
PKM2 enzyme stock
3. Additional recipes (see Recipes)
Luria-Bertani (LB) broth
Terrific Broth (TB) medium
Antibiotic stock (kanamycin)
IPTG stock (1 M)
Tris-HCl buffer (1 M, pH 7.5)
KCl solution (1 M)
Imidazole stock (1 M)
EDTA stock (0.5 M, pH 8.0)
DTT stock (1 M)
Recipes
1. Buffers for PKM2 purification
Buffer A (lysis/binding buffer): 20 mM Tris-HCl, pH 7.5; 100 mM KCl; 5 mM imidazole; 1 mM DTT; 5% glycerol
Elution Buffer: Buffer A + 300 mM Imidazole
Storage buffer (for dialysis and SEC): 20 mM Tris-HCl, pH 7.5; 100 mM KCl; 5% glycerol; 1 mM DTT; 0.25 mM EDTA
2. Buffers and stocks for PKM2 activity assay
Assay buffer: 20 mM Tris-HCl, pH 7.5 (or 7.0/8.0 as needed); 150 mM KCl; 5 mM MgCl2; 0.5 mM NADH; 4–5 U/mL LDH.
PEP stock: 100 mM in water, aliquot and store at -20 °C, dilute freshly before use.
ADP stock: 100 mM in water, adjust pH to 7.0, store at -20 °C.
FBP stock: 100 mM in water; store at -80 °C.
NADH stock: 10 mM in water. This is light-sensitive; aliquot and store at -20 °C.
LDH stock: Prepare as per vendor instructions; dilute to working concentration just before use.
PKM2 enzyme stock: Thaw on ice; avoid repeated freeze–thaw cycles.
3. Additional recipes
Luria-Bertani (LB) Broth: 10 g of tryptone, 5 g of yeast extract, 10 g of NaCl. Add distilled water to 1 L. Adjust pH to 7.0 with NaOH if needed. Sterilize by autoclaving at 121 °C for 15–20 min.
Terrific Broth (TB) medium: 12 g of tryptone, 24 g of yeast extract, 4 mL of glycerol. Dissolve in 900 mL of water. Separately prepare phosphate buffer (2.31 g of KH2PO4 + 12.54 g of KH2PO4 in 100 mL of water). Combine both solutions and adjust volume to 1 L. Sterilize by autoclaving at 121 °C for 15–20 min.
Antibiotic stock (kanamycin): Dissolve kanamycin sulfate in sterile water to make a 50 mg/mL stock solution. Filter sterilize using a 0.22 μm filter. Store aliquots at -20 °C.
IPTG stock (1 M): Dissolve 2.38 g of IPTG in 10 mL of distilled water to obtain a 1 M concentration. Filter sterilize (0.22 μm). Store at -20 °C in small aliquots.
Tris-HCl buffer (1 M, pH 7.5): Dissolve 121.1 g of Tris base in ~800 mL of distilled water. Adjust pH to 7.5 with concentrated HCl. Bring volume to 1 L. Sterilize by autoclaving or filter sterilization, depending on the application.
KCl solution (1 M): Dissolve 74.55 g of KCl in 1 L of distilled water. Sterilize by autoclaving. Store at room temperature or 4 °C.
Imidazole stock (1 M): Dissolve 68.08 g of imidazole in 1 L of distilled water. Adjust pH to 7.5 if needed. Filter sterilize and store at 4 °C.
EDTA stock (0.5 M, pH 8.0): Dissolve 186.1 g of disodium EDTA in ~800 mL of water. Adjust pH to 8.0 using NaOH pellets (EDTA dissolves only at pH 8.0). Bring to 1 L and sterilize by filtration.
DTT stock (1 M): Dissolve 15.4 g of DTT in 100 mL of water. Aliquot and store at -20 °C. DTT is unstable in solution.
Laboratory supplies
1. UV-transparent 96-well plates (Corning, catalog number: 3635); store at room temperature
2. Centrifugal protein concentrators (Amicon Ultra-15, 10–30 kDa MWCO, Millipore Sigma)
3. Dialysis tubing (Thermo Fisher, MWCO 10 kDa, catalog number: 88243)
4. Cryovials (Corning, catalog number: 430661); store at room temperature
5. Multichannel pipettes
6. Superdex 200 Increase 10/300 GL column** (Cytiva, catalog number: 28990944); use with FPLC
7. Ni2+-NTA resin** (Qiagen, catalog number: 30210); store at 4 °C
Equipment
1. Epoch 2 microplate spectrophotometer (BioTek)
2. ÄKTA pure FPLC system (Cytiva)
3. UV-Vis spectrophotometer (e.g., NanoDrop 2000c, Thermo Scientific)
4. Refrigerated centrifuge (swinging bucket and fixed-angle rotor) (Beckman Coulter, model: Avanti J-15R)
5. Sonicator with microtip (Branson, model: Sonifier® SFX150)
6. Temperature-controlled incubator shaker (22–37 °C) (Eppendorf, model: Innova S44i Shaking Incubator)
7. UV-Vis spectrophotometer (e.g., NanoDrop 2000c)
8. SDS-PAGE electrophoresis setup (Bio-Rad)
9. pH meter (METTLER TOLEDO)
10. Autoclave (for media and buffer sterilization)
11. -20 °C and -80 °C freezers
12. Ice bucket or cold room for protein work
13. Dialysis tubing or cassette
Software and datasets
1. GraphPad Prism (v. 10)
2. Microsoft Excel
Procedure
A. PKM2 expression and purification
1. Cloning and transformation
Clone the wild-type PKM2 gene into the pET28a expression vector containing an N-terminal His6 tag to enable purification via Ni-NTA affinity chromatography. Transform the recombinant plasmid into chemically competent E. coli BL21 (DE3) cells using the heat shock method. Plate the transformed cells onto LB-agar plates supplemented with kanamycin (50 μg/mL), and incubate overnight at 37 °C to allow colony formation.
2. Starter and main culture preparation
a. Pick a single colony from the LB-kanamycin plate and inoculate into 10 mL of LB broth containing kanamycin (50 µg/mL).
b. Incubate this starter culture overnight at 37 °C with shaking at 200 rpm.
c. The next day, inoculate 1 L of TB medium supplemented with kanamycin with the 10 mL overnight culture and allow to grow at 37 °C with shaking at 180 rpm.
Note: Do not chill the culture on ice before IPTG induction. Perform induction directly once the optical density at 600 nm (OD600) reaches ~2.0.
3. Expression induction
a. Monitor bacterial culture by measuring the OD600 using a spectrophotometer.
b. Once OD600 reaches approximately 2.0, induce protein expression by adding IPTG to a final concentration of 0.2 mM.
c. After induction, shift the culture to a lower temperature of 18 °C and incubate with shaking at 180 rpm for an additional 18 h to promote soluble protein expression.
4. Harvesting and cell lysis
a. Following the expression period, harvest the bacterial cells by centrifugation at 7,025× g for 30 min at 4 °C.
b. Resuspend the resulting cell pellet, typically weighing around 5 g, in 40 mL of lysis/binding buffer (Buffer A).
c. Perform cell lysis using a probe sonicator with the following settings: 40% amplitude, 6 s ON and 20 s OFF, for a total sonication time of 8 min, while keeping the sample on ice to prevent overheating.d. Clarify the lysate by centrifugation at 20,913× g for 30 min at 4 °C using a fixed-angle rotor. Carefully collect the supernatant, containing soluble His-tagged PKM2, for purification.
5. Ni-NTA affinity chromatography
a. Pre-equilibrate a 10 mL column packed with Ni2+-NTA resin with Buffer A.
b. Load the clarified supernatant onto the column at a slow flow rate to maximize binding of His-tagged protein to the resin.
c. After loading, wash the column with two column volumes of Buffer A to remove unbound proteins. Elute bound PKM2 using elution buffer containing increasing concentrations of imidazole (300 mM in buffer A).
d. Analyze eluted fractions by SDS-PAGE and pool the fraction corresponding to 300 mM imidazole, which shows the highest purity, for further purification. The size-exclusion chromatography (SEC) chromatogram displays only the native tetrameric form of PKM2. Confirmation of monomeric or dimeric species would require the use of detergents or strong chaotropic agents such as 2M NaCl or urea to disrupt the tetramer. However, since this protocol is focused on measuring enzymatic activity, we avoided such treatments in order to preserve the native conformation and functional integrity of PKM2.
6. Size-exclusion chromatography (SEC)
a. Dialyze the eluted protein from the Ni-NTA column overnight at 4 °C against storage buffer to remove excess imidazole.
b. Following dialysis, concentrate the sample to ~2 mL using a centrifugal concentrator (10 kDa MWCO).
c. Load the concentrated protein onto a Superdex 200 Increase 10/300 GL size-exclusion column pre-equilibrated with the same storage buffer. Perform chromatography using an FPLC system and monitor elution at 280 nm. Collect fractions for the tetrameric form of PKM2 only. For calibration of the Superdex 200 Increase column, readers are referred to the main article [10] for detailed calibration data and molecular weight determination. Figure 1 shows the SEC profile and SDS-PAGE data for the purified PKM2 used in the assays.
d. Determine protein concentration using a NanoDrop 2000c spectrophotometer. Use absorbance at 280 nm to calculate the concentration based on a molecular weight of 59.96 kDa and an extinction coefficient of 29.91 mM-1·cm-1.
e. Flash-freeze aliquots of purified PKM2 in liquid nitrogen and store at -80 °C.
f. Validate the oligomeric state of purified PKM2 WT using native PAGE, as previously shown in Figure S9 of the original research article [10].
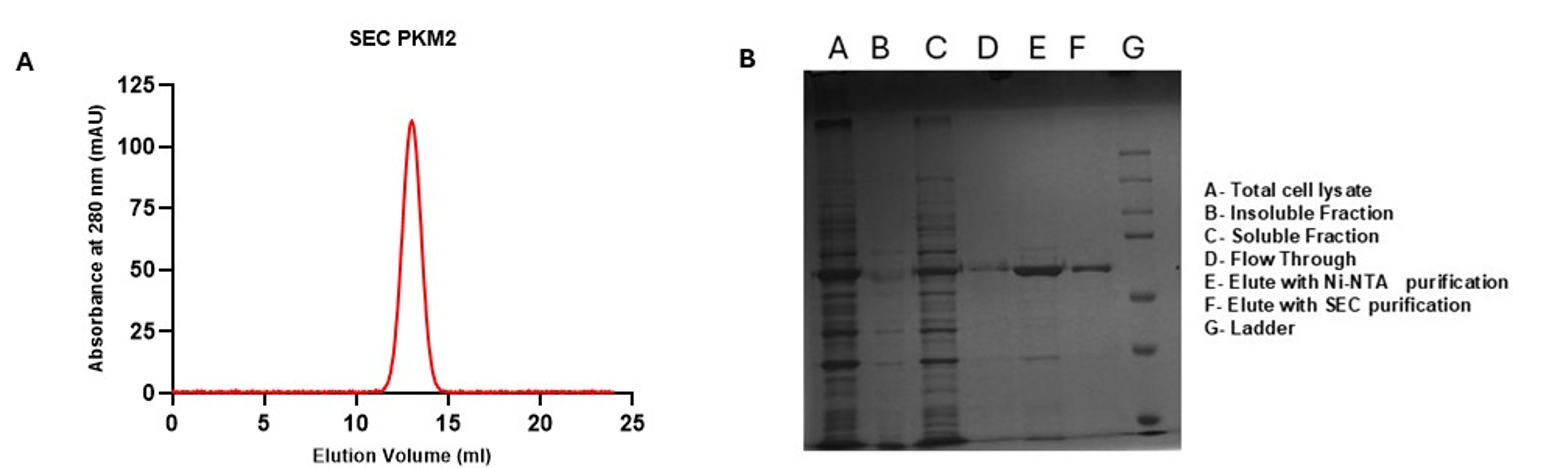
Figure 1. Size-exclusion chromatography (SEC) profile and SDS image of purified PKM2. Recombinant wild-type PKM2 was purified and subjected to SEC using a Superdex 200 Increase 10/300 GL column pre-equilibrated with storage buffer (20 mM Tris-HCl pH 7.5, 100 mM KCl, 1 mM DTT, 5% glycerol, and 0.25 mM EDTA). The chromatogram shows a dominant peak corresponding to the tetrameric form of PKM2. Fractions were collected based on this elution peak. Column calibration was performed in the original research article cited herein [10]; readers are encouraged to consult that study for molecular weight standards and detailed characterization (A). Distinct bands in elution fractions indicate successful enrichment of the target protein following affinity chromatography as well as size exclusion chromatography (B). For a detailed process of protein purification, see the original research article [10].
B. PKM2 activity assay using the LDH-coupled system
1. Preparation of stock solutions
Prepare all buffer recipes fresh before use. Follow the detailed preparation steps provided in the “Buffers and stocks for PKM2 activity assay” section of Recipes.
2. Pyruvate kinase activity assay
a. Prepare assay buffer. Keep on ice.
b. Prepare stock solutions of ADP (0–3,000 μM) and PEP (0–2,000 μM) in assay buffer (see Recipes).
c. In a UV-transparent 96-well flat-bottom microplate, assemble 100 μL reaction mixtures as follows: 20 mM Tris-HCl (pH 7.5), 150 mM KCl, 5 mM MgCl2, 0.5 mM NADH, 4 U/mL LDH, ADP at 0–3,000 μM (for ADP titration) or fixed at 1.0 mM, and PEP at 0–2,000 μM (for PEP titration) or fixed at 2.0 mM.
d. Add PKM2 enzyme to each well at a final concentration of 13 nM. For FBP-stimulated reactions, include 0.5–0.8 mM FBP.
e. Initiate reactions by adding 10 μL of pre-mixed ADP and PEP to each well.
f. Immediately begin measuring absorbance at 340 nm using a microplate reader, recording readings every 5–10 s for 60 s at 25 °C.
g. For each well, calculate ΔA340 as A0–At, where A0 is the initial absorbance and At is the absorbance at the selected time point (Figure 2A and 2B).
h. Determine initial velocity from the linear portion of the absorbance vs. time curve.
i. Convert ΔA340 to NADH concentration using the Beer–Lambert law:
Δ[NADH] = ΔA340/(ε × l)
where ε = 6,220 M-1·cm-1 and l = 0.5 cm.
j. Plot initial velocity against substrate concentration to generate saturation curves for ADP and PEP.
k. Fit velocity data to the Michaelis–Menten equation using nonlinear regression. Use the Hill equation if sigmoidal kinetics are observed (Figure 3A, B).
l. Based on titration curves, select 1.0 mM ADP and 2.0 mM PEP as saturating concentrations for all subsequent kinetic assays (Figure 2A, B).
m. Repeat the assay under these final conditions in triplicate, using three independent biological replicates.
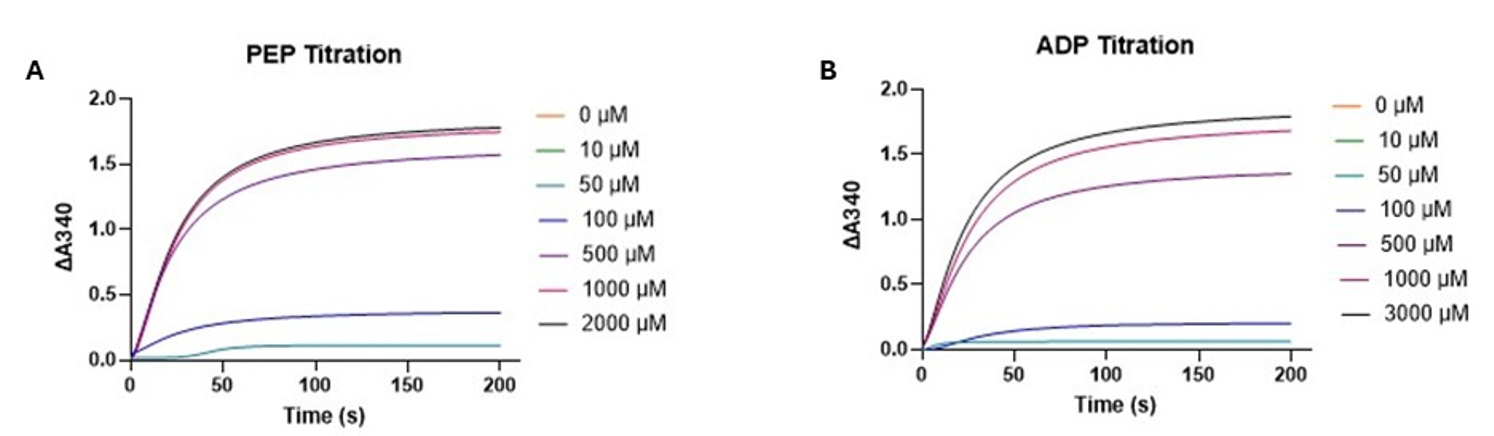
Figure 2. Substrate titration of ADP and PEP in a pyruvate kinase activity assay. (A) PEP titration absorbance at 340 nm over time at increasing concentrations of PEP (0–2,000 μM), with ADP held constant at 1 mM. (B) ADP titration absorbance at 340 nm over time at increasing concentrations of ADP (0–3,000 μM), with PEP held constant at 2 mM. The curves exhibit an exponential saturation trend, not a sigmoidal profile. Although NADH oxidation results in a decrease in absorbance at 340 nm, the plots display the extent of absorbance change (ΔA340 = A0–At) to visualize reaction progress as an increasing trend.
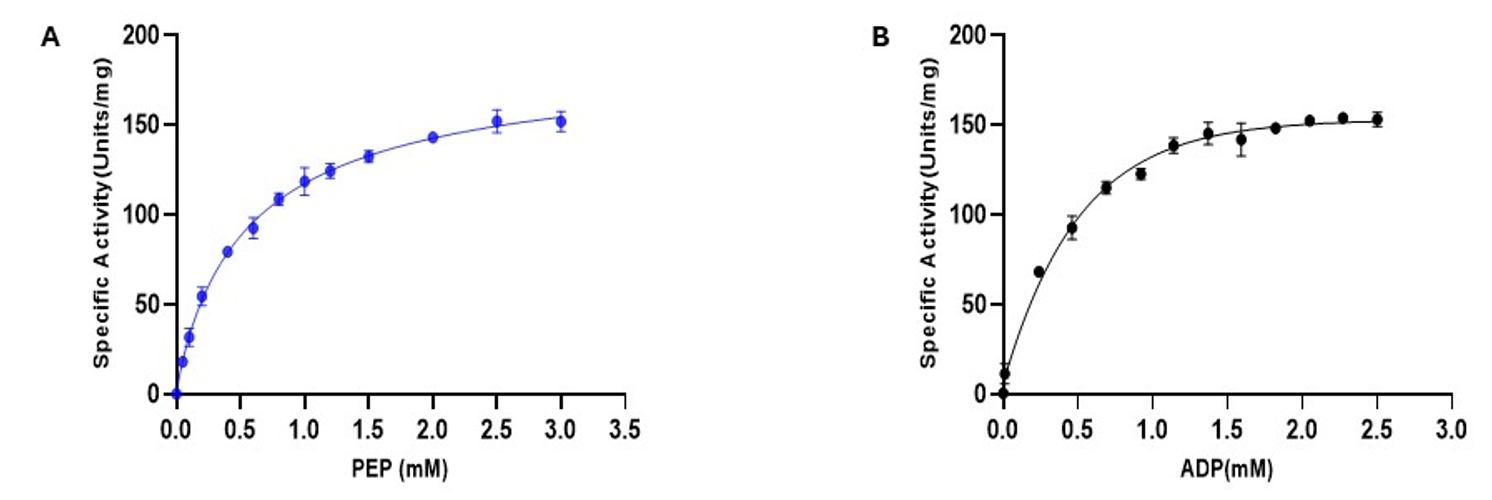
Figure 3. Pyruvate kinase activity as a function of PEP and ADP concentrations. Initial velocities were measured using a NADH-coupled assay and plotted against increasing concentrations of (A) PEP and (B) ADP, with the non-varied substrate held constant (1 mM PEP or 2 mM ADP, respectively). Absorbance at 340 nm (A340) was monitored to track NADH oxidation. Data confirms that 1 mM ADP and 2 mM PEP are near-saturating concentrations for accurate activity measurements. Data points represent the mean ± standard error (SE) from three independent experiments.
Data analysis
1. Protein quantification after purification: To determine the concentration of purified PKM2 protein, absorbance at 280 nm was measured using a NanoDrop 2000c spectrophotometer. The following values were used:
• Molecular weight (MW) of PKM2 monomer: 59.96 kDa
• Extinction coefficient (ε): 29.91 mM-1·cm-1
• Pathlength (l): 1 mm
Protein concentration was calculated using the Beer–Lambert law:
2. Spectrophotometric measurement: Following PEP addition, the plate was immediately transferred to an Epoch microplate spectrophotometer or equivalent reader. The absorbance at 340 nm was recorded every 5–10 s for a total duration of 60 s at room temperature (or precisely 25 °C if the reader had temperature control). It was ensured that the absorbance values remained within the linear detection range, confirming the reliability of the reaction kinetics.
3. Enzyme kinetics from the LDH-coupled assay: Initial reaction velocities (V0) were determined from the linear portion of the absorbance vs. time curves using GraphPad Prism or Microsoft Excel. The change in absorbance at 340 nm (ΔA340/min) was converted to the rate of NADH consumption using the Beer–Lambert law. The resulting data were fitted to the Michaelis–Menten equation to derive kinetic parameters. To convert the change in absorbance into the molar concentration of NADH oxidized, the Beer–Lambert law was applied. This assumes a direct 1:1 stoichiometric relationship between PEP conversion and NADH oxidation.
a. From absorbance to enzyme activity
b. Specific activity (µmol/min/mg)
c. kcat (turnover number)
where ε is the extinction coefficient of NADH (6,220 M-1·cm-1), and l is the optical path length, which depends on volume and plate geometry; for a 100 μL volume in a flat-bottom 96-well plate, the path length is approximately 3 mm (0.3 cm).
Km and Vmax values were derived using nonlinear regression fitting to the Michaelis–Menten equation using GraphPad Prism software, with goodness-of-fit (R2) monitored for curve accuracy.
Initial velocity values were plotted against the corresponding ADP or PEP concentrations to generate kinetic curves. Data were fitted to the Michaelis–Menten equation for standard kinetics, or to the Hill equation if cooperative binding was observed. The kinetic parameters Km, Vmax, and kcat were calculated for each titration. kcat was derived by dividing Vmax by the total molar concentration of PKM2 in the reaction (calculated as ~16.7 nM based on 0.1 μg enzyme and a 60 kDa monomer MW in 100 μL volume).
The following kinetic parameters were obtained:
i. ADP titration (PEP fixed at 2 mM):
Km (ADP) = 0.402 mM
Vmax = 181.11 μmol/min/mg
kcat = 10,866.62 min-1
ii. PEP titration (ADP fixed at 1 mM):
Km (PEP) = 0.50 mM
Vmax = 178.02 μmol/min/mg
kcat = 10,681.24 min-1
All results were derived from at least three independent biological replicates.
Validation of protocol
The protocol was validated using three independent biological replicates to ensure reproducibility. Each replicate included separate rounds of PKM2 expression, purification, and activity measurements. Kinetic parameters (Km, Vmax, and kcat) were consistent across replicates, remaining within standard error margins, which confirmed the assay’s reliability. SDS-PAGE analysis demonstrated >95% purity at each purification stage. More information can be found in the original research article [10].
The enzymatic assay was also performed under FBP-stimulated conditions to confirm sensitivity to allosteric regulation. Control reactions using heat-inactivated PKM2 verified a minimal background signal, confirming the assay’s specificity. To assess linearity and kinetic fidelity, NADH oxidation was monitored over time across a range of substrate concentrations, demonstrating robust signal responsiveness. Enzymatic activity and the correlation of activity and native state of the protein are available in the original research article [10].
Each data point was measured in technical triplicate, and all experiments were independently repeated across three biological replicates. A validated PKM2 stock served as a positive control in every run to ensure consistency. These validation steps confirm the robustness, reproducibility, and specificity of the described PKM2 activity assay.
General notes and troubleshooting
General notes
1. Fresh reagents are critical: NADH and PEP are sensitive to degradation. Always prepare fresh working stocks of NADH and dilute PEP just before use to ensure consistent reaction kinetics.
2. To preserve enzyme activity, keep PKM2, FBP, and LDH on ice during setup. Only warm the plate to room temperature during the actual spectrophotometric reading.
3. Avoid bubbles in microplate wells. Bubbles can interfere with absorbance readings at 340 nm. Gently tap the plate or briefly centrifuge it before placing it in the reader.
4. Maintain consistent path length. Use the same type of 96-well plate across experiments. Preferably, use UV-transparent flat-bottom plates to ensure accurate A340 readings.
5. Pre-warm plate reader: If your instrument has temperature control, set it to room temperature (~25 °C) at least 15–20 min in advance to equilibrate.
6. Linear range of reaction: Ensure that the NADH absorbance decreases linearly over the time course (typically 1 min). If not, adjust enzyme concentration.
7. Run all conditions in triplicate and perform at least three biological replicates to ensure statistical robustness of kinetic parameters.
Troubleshooting
1. Low or no expression of PKM2
Possible cause: Suboptimal induction conditions or issues with the plasmid or competent cells.
Solution: Confirm that the plasmid contains the correct insert via restriction digestion or sequencing. Optimize induction by reducing IPTG concentration (0.1–0.5 mM) and lowering temperature to 18 °C to improve solubility. Always use fresh BL21 (DE3) competent cells for transformation.
Note: By “fresh BL21 (DE3)” cells, we refer to competent cells stored at -80 °C that have not undergone repeated freeze–thaw cycles. Always use a freshly thawed aliquot for transformation.
2. Protein forms inclusion bodies (insoluble protein)
Possible cause: High expression rate at 37 °C leading to misfolding.
Solution: Shift induction to lower temperatures (16–20 °C) to promote proper folding. Co-expression with molecular chaperones or using additives like arginine or glycerol in lysis buffer can also help improve solubility.
Note: Induction temperature recommendations should be contextual. If protein expression is already performed at 18 °C post-induction, no additional shift is needed for solubility.
3. Lysate is highly viscous after sonication
Possible cause: Genomic DNA released during lysis.
Solution: Add DNase I (5–10 µg/mL) and 1–2 mM MgCl2 to the lysis buffer (Buffer A) and incubate on ice for 15 min after sonication to degrade DNA and reduce viscosity.
4. Impurities in eluted protein after Ni-NTA affinity chromatography
Possible cause: Nonspecific binding to Ni2+ resin or incomplete washing.
Solution: Increase the imidazole concentration in the wash buffer (e.g., 20–40 mM) to reduce nonspecific binding. Always perform a second elution step with a higher imidazole concentration (e.g., 1,000 mM) to check for leftover bound proteins.
5. A steady decrease in A340 is expected in active reactions and confirms NADH oxidation by the coupled PKM2-LDH system (flat baseline)
Possible causes: Inactive enzyme, missing component, or degraded NADH.
Solutions: Confirm that all components were added. Use freshly prepared NADH. Test enzyme activity with a known working batch. Ensure PKM2 and LDH are active and stored properly.
6. Very rapid decrease in absorbance (nonlinear signal)
Possible causes: Excess enzyme concentration or high PEP levels.
Solutions: Reduce PKM2 concentration (especially in the presence of FBP). Shorten the reading interval to 5 s. Use lower PEP concentrations if needed.
7. High background absorbance or noisy data.
Possible causes: Contaminants in reagents, bubbles in wells, or inconsistent pipetting.
Solutions: Use high-purity reagents and clean pipette tips. Eliminate air bubbles before measurement. Calibrate pipettes and use a consistent pipetting technique.
Note: Air bubbles in wells can be removed by gently tapping the side of the microplate or a short low-speed centrifugation (~100× g for 30 s).
8. Inconsistent replicates or high standard deviation
Possible causes: Uneven reagent mixing or plate layout errors.
Solutions: Prepare master mixes and pipette into wells consistently. Use a multichannel pipette when possible. Ensure the plate reader is properly calibrated and aligned.
9. NADH absorbance does not decrease despite visible enzyme bands on SDS-PAGE
Possible causes: The protein is folded incorrectly or lacks activity despite being present.
Solutions: Verify activity with a positive control. Consider refolding or expressing protein at a lower temperature. Re-purify to remove potential inhibitors.
Note: To assess enzyme activity, run parallel reactions with a previously validated PKM2 batch as the positive control. Enzyme inactivity could result from freeze–thaw cycles or improper storage.
Acknowledgments
This work received funding from the Department of Biotechnology, India, under grant number DBT/2018/IIT-D/1056. The authors also acknowledge the financial support from the Department of Biotechnology, Ministry of Science and Technology, Government of India, for graduate fellowship and Kusuma Trust, IIT-Delhi. The protocol was developed by Upadhyay et al. Biochemistry 2025, 64, 7, 1463–1475 [10].
The abstract figure in this protocol was created with BioRender.com. Upadhyay, S. (2025) https://BioRender.com/aa6wmrv.
Competing interests
The authors declare no competing interests.
References
- Upadhyay, S., Khan, S. and Hassan, M. I. (2024). Exploring the diverse role of pyruvate kinase M2 in cancer: Navigating beyond glycolysis and the Warburg effect. Biochim Biophys Acta Rev Cancer. 1879(3): 189089. https://doi.org/10.1016/j.bbcan.2024.189089.
- Zhang, Z., Deng, X., Liu, Y., Liu, Y., Sun, L. and Chen, F. (2019). PKM2, function and expression and regulation. Cell Biosci. 9: 52. https://doi.org/10.1186/s13578-019-0317-8.
- Gao, X., Wang, H., Yang, J. J., Liu, X. and Liu, Z. R. (2012). Pyruvate kinase M2 regulates gene transcription by acting as a protein kinase. Mol Cell. 45(5): 598–609. https://doi.org/10.1016/j.molcel.2012.01.001.
- Rajala, R. V., Rajala, A., Kooker, C., Wang, Y. and Anderson, R. E. (2016). The Warburg Effect Mediator Pyruvate Kinase M2 Expression and Regulation in the Retina. Sci Rep. 6: 37727. https://doi.org/10.1038/srep37727.
- Dong, G., Mao, Q., Xia, W., Xu, Y., Wang, J., Xu, L. and Jiang, F. (2016). PKM2 and cancer: The function of PKM2 beyond glycolysis. Oncol Lett. 11(3): 1980–1986. https://doi.org/10.3892/ol.2016.4168.
- Luo, W., Hu, H., Chang, R., Zhong, J., Knabel, M., O'Meally, R., Cole, R. N., Pandey, A. and Semenza, G. L. (2011). Pyruvate kinase M2 is a PHD3-stimulated coactivator for hypoxia-inducible factor 1. Cell. 145(5): 732–744. https://doi.org/10.1016/j.cell.2011.03.054.
- Yang, W., Xia, Y., Ji, H., Zheng, Y., Liang, J., Huang, W., Gao, X., Aldape, K. and Lu, Z. (2011). Nuclear PKM2 regulates beta-catenin transactivation upon EGFR activation. Nature. 480(7375): 118–122. https://doi.org/10.1038/nature10598.
- Khan, S., Upadhyay, S., Dave, U., Kumar, A. and Gomes, J. (2024). Structural and mechanistic insights into ALS patient derived mutations in D-amino acid oxidase. Int J Biol Macromol. 256(Pt 2): 128403. https://doi.org/10.1016/j.ijbiomac.2023.128403.
- Bhardwaj, M., Anjum, R., Hariprasad, P. and Patel, A. K. (2025). Allosteric mutations impact the catalytic activity and oligomeric state of the main protease of coronavirus. Int J Biol Macromol 309(Pt 1): 142765. https://doi.org/10.1016/j.ijbiomac.2025.142765.
- Upadhyay, S., Bhardwaj, M., Kumar, S. P., Khan, S., Kumar, A. and Hassan, M. I. (2025). Impact of Cancer-Associated PKM2 Mutations on Enzyme Activity and Allosteric Regulation: Structural and Functional Insights into Metabolic Reprogramming. Biochemistry. 64(7): 1463–1475. https://doi.org/10.1021/acs.biochem.5c00009.
- Nandi, S., Razzaghi, M., Srivastava, D. and Dey, M. (2020). Structural basis for allosteric regulation of pyruvate kinase M2 by phosphorylation and acetylation. J Biol Chem. 295(51): 17425–17440. https://doi.org/10.1074/jbc.RA120.015800.
Article Information
Publication history
Received: May 18, 2025
Accepted: Jul 10, 2025
Available online: Aug 5, 2025
Published: Aug 20, 2025
Copyright
© 2025 The Author(s); This is an open access article under the CC BY-NC license (https://creativecommons.org/licenses/by-nc/4.0/).
How to cite
Upadhyay, S. (2025). An Optimized Enzyme-Coupled Spectrophotometric Method for Measuring Pyruvate Kinase Kinetics. Bio-protocol 15(16): e5415. DOI: 10.21769/BioProtoc.5415.
Category
Biochemistry > Protein > Activity
Biochemistry > Protein > Quantification
Molecular Biology > Protein > Expression
Do you have any questions about this protocol?
Post your question to gather feedback from the community. We will also invite the authors of this article to respond.