- Protocols

- Articles and Issues
- For Authors
- About
- Become a Reviewer

In Vitro Co-culture of Bacterial and Mammalian Cells to Investigate Effects of Potential Probiotics on Intestinal Barrier Function
Published: Vol 15, Iss 12, Jun 20, 2025 DOI: 10.21769/BioProtoc.5361 Views: 2941
Reviewed by: Alba BlesaAnonymous reviewer(s)
Original research article
The authors used this protocol in:

Apr 2024
Advertisement


Protocol Collections
Comprehensive collections of detailed, peer-reviewed protocols focusing on specific topics


Related protocols
Abstract
Human intestinal barrier function is crucial for health. Beneficial microbes, such as commensal gut bacteria and probiotics, are known to contribute to the regulation of this barrier function. Interactions between bacteria and human intestinal cells can be analyzed by co-culturing bacteria with mammalian cells in vitro. Here, we describe a method to assess the effect of individual bacterial strains on intestinal barrier function using automated transepithelial electrical resistance (TEER) measurements. Caco-2 cells are used as a model of the intestinal epithelium, as these cells spontaneously differentiate into small intestinal epithelial-like cells characterized by tight junctions between adjacent cells. These cells are seeded on polyester filter inserts and cultured for 17 days to form a differentiated monolayer prior to the co-culture experiment. Bacteria are grown on agar, and a single colony is used to prepare a liquid culture in bacterial broth appropriate for the bacteria of interest. On the day of the co-culture experiment, the bacterial culture is resuspended in cell culture medium at the desired concentration. Inserts are transferred to cellZscope cell modules to enable automated TEER measurements, and the medium in the insert is replaced with cell culture medium containing the bacteria of interest. This method allows for intestinal tight junction barrier function to be assessed non-invasively and in real-time in response to probiotics. The use of the automated cellZscope system eliminates the need for labor-intensive manual TEER measurements, which reduces the variability in data that results from human handling and temperature changes that occur when cells are removed from the incubator.
Key features
• Real-time measurement of the effects of aerobic or aerotolerant-anaerobic probiotics on intestinal barrier integrity.
• Automated TEER measurements are achieved by a nanoAnalytics CellZscope instrument.
• Requires at least four weeks to complete one experimental run, including the revival and growth of mammalian cells in flasks, prior to differentiation in inserts.
• Completing the recommended three experimental runs, staggered by one week, takes six weeks.
Keywords: Transepithelial electrical resistanceGraphical overview
Background
The human intestine not only digests food and absorbs nutrients but also acts as a vital barrier against harmful compounds [1]. The intestinal epithelium, a single layer of polarized cells, plays a crucial role in maintaining this barrier function [2]. Tight junctions (TJs), located at the apical aspect of epithelial cells, seal the paracellular space, restricting the passage of unwanted compounds and potential pathogens while allowing selective nutrient uptake [3]. Intestinal barrier dysfunction, characterized by a "leaky" epithelium, is implicated in various chronic diseases, including inflammatory bowel disease and diabetes [4]. Environmental stressors and dietary factors can compromise barrier integrity, leading to increased paracellular permeability and potential systemic inflammation [5].
Functional foods and beneficial microbes, such as probiotics, have gained attention for their potential to enhance intestinal barrier function [6]. Probiotics, particularly strains of lactobacilli, have been shown to strengthen the epithelial barrier by modulating TJ structure and function. For example, Lactiplantibacillus plantarum and Lacticaseibacillus rhamnosus have been observed to upregulate TJ protein expression, improve barrier integrity, and protect against pathogen-induced barrier disruption [7–10]. Hence, probiotics may represent a promising strategy for enhancing intestinal barrier function and promoting overall health.
We recently demonstrated the barrier-enhancing properties of two probiotic strains in an in vitro model of the intestinal epithelial barrier [12]. The method utilized the immortalized colorectal adenocarcinoma cell line Caco-2 as a model of the small intestinal epithelium [13,14]. This cell line is widely accepted as a model of the intestinal barrier because when cultured to confluence, the cells form a monolayer and spontaneously differentiate into small intestine–like cells expressing morphological and biochemical characteristics similar to enterocytes, including microvilli and TJ between adjacent cells. The barrier function of the TJs was assessed in real-time using transepithelial electrical resistance (TEER). TEER measures the electrical resistance across an epithelial monolayer, providing a sensitive indicator of barrier integrity [15]. These experiments utilized a validated apical-anaerobic model of the intestinal epithelium that mimicked the anaerobic environment of the intestinal lumen, while ensuring the survival of oxygen-requiring intestinal cells [16].
As the apical anaerobic model requires a custom-built co-culture chamber, as well as a modified anaerobic workstation, here we present a simplified version of the protocol, which utilizes an automated cell monitoring system (i.e., cellZscope) and a standard cell culture incubator, both of which can be purchased from a commercial supplier. The protocol can be used to study the effects of aerobic or aerotolerant-anaerobic bacteria on intestinal barrier function using TEER. Note that for studying the effects of live obligate anaerobic bacteria, the apical anaerobic model is needed. Following the co-culture of bacterial and mammalian cells using the methods described, researchers may carry out further downstream analyses to gain insights into the underlying mechanisms of action, for example, gene expression and immunolocalization analyses to investigate the modulation of TJ-related genes and proteins, as described in Zhang et al. [12].
Materials and reagents
Biological materials
1. Cryopreserved stocks of colorectal carcinoma cell line (Caco-2) (ATCC, catalog number: HTB-37, passage 22)
2. Cryopreserved stocks of aerobic or aerotolerant bacteria of interest (in Zhang et al. [12], Lactiplantibacillus plantarum ST-III and Lacticaseibacillus rhamnosus KF7 were used)
Reagents
1. Fetal bovine serum (FBS) (Moregate)
2. Non-essential amino acids (NEAA) (Gibco, catalog number: 11140050)
3. Medium 199 (M199) (Gibco, catalog number: 11150059)
4. TrypLE Express (TrypLE) (Gibco, catalog number: 12605028)
5. Lactobacilli MRS broth (Difco, catalog number: 288130) or other appropriate medium if bacteria of interest are not lactobacilli
6. Lactobacilli MRS agar (Difco, catalog number: 288210) or other appropriate medium if bacteria of interest are not lactobacilli
7. Phosphate-buffered saline (PBS) (Difco, catalog number: 10010049)
8. Type 1 water (Milli-Q, catalog number: ZEQ7000T0C)
Solutions
1. Caco-2 standard growth medium (Std medium) (see Recipes)
2. Caco-2 TEER experimental medium (TEER medium) (see Recipes)
3. MRS agar (see Recipes)
4. MRS broth (see Recipes)
Recipes
1. Caco-2 standard growth medium (Std medium)
| Reagent | Final concentration | Volume |
|---|---|---|
| M199 | 445 mL | |
| FBS | 10% | 50 mL |
| NEAA | 1% | 5 mL |
| Total | 500 mL |
Storage conditions: 4 °C for up to 8 weeks.
2. Caco-2 TEER experimental medium (TEER medium)
| Reagent | Final concentration | Volume |
|---|---|---|
| M199 | 495 mL | |
| NEAA | 1% | 5 mL |
| Total | 500 mL |
Storage conditions: 4 °C for up to 8 weeks.
3. MRS agar
| Reagent | Final concentration | Quantity |
|---|---|---|
| Agar powder | 7% (w/v) | 49 g |
| Type 1 water | 700 mL |
Storage conditions: 4 °C for up to 2 weeks.
4. MRS broth
| Reagent | Final concentration | Quantity |
|---|---|---|
| Broth powder | 5.5% (w/v) | 38.5 g |
| Type 1 water | 700 mL |
Storage conditions: 4 °C for up to 2 weeks.
Laboratory supplies
1. 10 μL pipette tips (Eppendorf, catalog number: 0030078500)
2. 100 μL pipette tips (Eppendorf, catalog number: 0030078543)
3. 200 μL pipette tips (Eppendorf, catalog number: 0030078551)
4. 300 μL pipette tips (Eppendorf, catalog number: 0030078560)
5. 1,000 μL pipette tips (Eppendorf, catalog number: 0030078578)
6. 100 mm diameter Petri dishes (Corning, catalog number: 430167)
7. 10 μL inoculating loops (Sigma-Aldrich, catalog number: I8388)
8. 38 mm magnetic stirring bar (FisherScientific, catalog number: 22-331439)
9. 96-well plates, flat bottom, clear, polystyrene wells (Greiner, catalog number: M3061)
10. 96-well plate sealing film (Sigma-Aldrich, catalog number: Z369667)
11. Cell culture flasks, 75 cm2, filter cap (T-75 flask) (ThermoFisher Scientific, catalog number: 156499)
12. Polyester membrane inserts, 6.5 mm diameter, 0.4 µm pore (Corning, catalog number: 3470)
13. Countess cell counting chamber slides and holder with trypan blue solution (Invitrogen, catalog number: C10283)
14. 15 mL conical centrifuge tubes (ThermoFisher, catalog number: 339650)
15. 1.5 mL microcentrifuge tubes (Eppendorf, catalog number: 0030125150)
16. 0.6 mL microcentrifuge tubes (Sigma-Aldrich, catalog number: T5149)
17. Counting chamber (Marienfeld-Superior, catalog number: 0642110)
18. Hemocytometer coverslips (Carl Roth, catalog number: KHT8.1)
19. Lint-free paper (Kimtech, catalog number: 34155)
20. 2× 1000 mL Duran glass bottles (Schott, catalog number: 218015455)
21. Tweezers, stainless steel (ThermoFisher, catalog number: 12-000-126)
Equipment
1. Biosafety Cabinet A: Class II biosafety cabinet for mammalian cells (Esco, catalog model: NC2-L)
2. Biosafety Cabinet B: Class II biosafety cabinet for bacteria and co-culture (Nuaire, catalog model: NU-540)
3. Centrifuge A: benchtop centrifuge for mammalian cells (ThermoFisher, catalog number: 3376282)
4. Centrifuge B: benchtop centrifuge for bacterial cells [ThermoFisher, catalog model: Multifuge X3 (Ventilated) Centrifuge]
5. 0.5–10 μL pipette (Eppendorf, catalog number: 3123000020)
6. 10–100 μL pipette (Eppendorf, catalog number: 3123000047)
7. 20–200 μL pipette (Eppendorf, catalog number: 3123000050)
8. 30 –300 μL pipette (Eppendorf, catalog number: 3123000101)
9. 100–1,000 μL pipette (Eppendorf, catalog number: 3123000063)
10. Serological pipette controller (ThermoFisher, catalog number: 9541)
11. Warming oven (Memmert, catalog model: UFE 600/230) set to 37 °C
12. EndOhm chamber and cap (World Precision Instruments, catalog model: EndOhm-6G)
13. Epithelial volt/ohm meter (World Precision Instruments, catalog model: EVOM2)
14. cellZscope (nanoAnalytics, catalog model: cellZscope +)
15. Automated cell counter (Invitrogen, catalog model: Countess 3)
16. Microplate reader (Molecular Devices, catalog model: FlexStation3)
17. Microscope A: inverted microscope for mammalian cells (Nikon, catalog number: TS-100)
18. Microscope B: inverted microscope for bacteria enumeration (Nikon, catalog model: Eclipse Ti-S)
19. Incubator A: humidified cell culture incubator for mammalian cells (ThermoFisher, catalog number: 50163013) set at 37 °C, 5% CO2
20. Incubator B: humidified incubator for bacterial cells (Sanyo; catalog number: MCO-18AIC) set at 37 °C
21. Incubator C: humidified incubator for co-culture experiments (ThermoFisher, catalog number: 50163013) set at 37 °C, 5% CO2
22. Magnetic hotplate stirrer (IKA, catalog number: C-MAG HS 7)
23. Vortex (IKA Vortex 3 Shaker, catalog number: 3340000)
24. Autoclave (Tuttnauer, model: 3870EA)
Software and datasets
1. nanoAnalytics (version 4.3.1, 2019)
2. Excel 365 (Microsoft, 21/11/2024)
3. RStudio Build 446 (Posit PBC, 01/03/2023)
Procedure
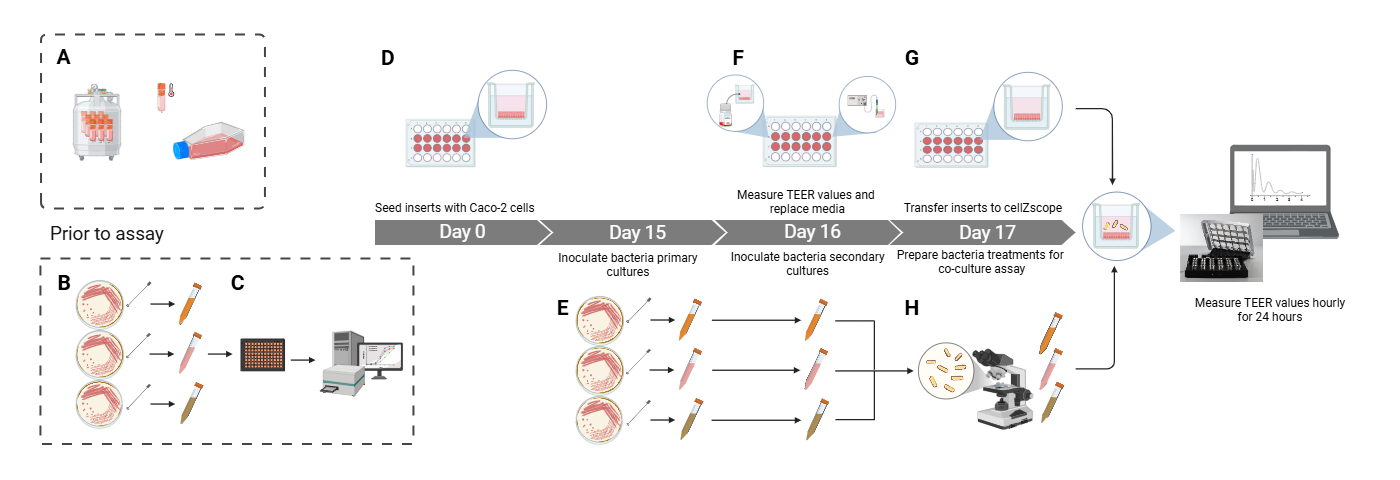
Experimental design: To achieve sufficient statistical power, complete three independent experimental runs with inserts seeded on three different days using cells from three successive Caco-2 cell passages. In each run, include at least four replicates of each treatment. This means that in one cellZscope module with 24 wells, six treatment groups (including controls) can be investigated per experiment. Overall, this results in 12 replicates per treatment group, split across three experimental runs/blocks. It is recommended to stagger the runs by one week to allow sufficient time to clean and sterilize the cellZscope equipment between runs.
Procedure overview (illustrated in the Graphical abstract): Grow and maintain Caco-2 cells in cell culture flasks (as described in section A) and bacterial cells on agar (as described in section B). Complete growth curves for the bacteria of interest (as described in section C) to inform the bacterial culture duration and volumes required for preparing bacterial treatments. Seed the Caco-2 cells onto inserts 17 days before the co-culture experimental run, which is designated Day 0 (as described in section D). Start preparing bacterial treatments in broth on approximately Day 15 (as described in section E). On Day 16, the day before the co-culture experiment, take the initial TEER readings and prepare the Caco-2 cells for the experiment (as described in section F). Finally, set up and complete the experiment on Day 17 (as described in section G), including enumeration of the bacteria to achieve the correct treatment concentration (as described in section H). It is recommended that mammalian culture be carried out in a dedicated cell culture laboratory devoid of bacteria, while bacterial culture and mammalian-bacterial co-culture be carried out in a separate co-culture laboratory, as suggested below.
A. Maintaining cultures of Caco-2 cells
Carry out the following steps in a dedicated cell culture laboratory to avoid potential bacterial contamination of cell cultures.
1. Working inside biosafety cabinet A, add 17 mL of Std medium to a T-75 flask.
2. Place the flask in incubator A until required.
3. Retrieve a cryovial containing frozen Caco-2 cells from cryostorage and thaw the cells by placing the cryovial in the warming oven for ~2 min.
4. Inside biosafety cabinet A, pipette the thawed cell suspension into a 15 mL centrifuge tube containing 4 mL of prewarmed Std medium.
5. Centrifuge the tube at 110× g for 3 min using centrifuge A.
6. Working inside biosafety cabinet A, decant the supernatant and resuspend the cell pellet in 1 mL of prewarmed Std medium by gently aspirating and dispensing to disperse the pellet. Continue until the pellet is dispersed and the solution appears homogenous.
7. In a 6 mL microcentrifuge tube, combine 17 μL of trypan blue solution with 17 μL of the resuspended Caco-2 cells. Ensure the mixture is homogeneous for accurate cell enumeration.
8. Transfer 10 μL of the homogenous mixture to each of the two chambers on the Countess slide. Use the two chambers to increase confidence and accuracy of the cell count. Insert the slide into an automated cell counter to initiate cell enumeration.
9. Calculate the concentration of the live cells in the cell suspension by averaging the results of the live cell concentrations obtained from the two counting chambers.
Critical: Do not use the cells if viability is below 80%. Repeat steps A8–10 if the cell count between the two chambers varies by more than 5%.
10. Divide the live cell concentration (in cell/mL) by 1 × 10⁶ to determine the volume of cell suspension (in milliliters) that would contain 1 × 10⁶ cells. Working in biosafety cabinet A, pipette this volume into the T-75 flask prepared in step A2. The remaining cell suspension can be discarded appropriately.
11. Gently rock the flask to help ensure the Caco-2 cells are distributed evenly.
12. Incubate the flask in incubator A. Incubate the flask facing the openings to the back to minimize the risk of contamination.
13. Monitor cell growth every second day using microscope A. Follow the steps below to passage the Caco-2 cells as growth approaches 80% confluence.
14. Working inside biosafety cabinet A, aspirate the medium from the T-75 flask.
15. Quickly rinse the cells by adding 2 mL of TrypLE into the flask, ensuring the growth surface is covered by gently rocking the flask, and then immediately decant off the TrypLE.
16. Add another 3 mL of TrypLE to the flask and incubate the flask in incubator A for 8 min. Incubate the flask facing the openings to the back to minimize the risk of contamination. After 8 min, carefully remove the flask from the incubator. Hold the flask upright with the lid facing upward and examine the surface where the Caco-2 cells were growing. If the dissociation is complete, the surface will appear clear, and the medium will look cloudy due to the presence of suspended cells. If the surface still has attached cells, return the flask to the incubator for up to 2 min and continue to monitor. If necessary, use microscope A to observe the degree of cell dissociation. Once you confirm that the cells have completely detached, add 3 mL of standard growth medium to the flask to stop the dissociation process.
17. Transfer the cell suspension to a 15 mL centrifuge tube and centrifuge at 110× g for 3 min at room temperature.
18. Working in biosafety cabinet A, discard the supernatant and resuspend the cell pellet in 1 mL of Std medium by gently repeating the cycle of aspirating and dispensing the cell suspension until the pellet is completely suspended.
19. In a 0.1 mL microcentrifuge tube, mix 17 μL of cell suspension with 17 μL of trypan blue stain to determine cell count. Transfer 10 μL of the mixture to each of the two counting chambers available on a Countess chamber slide for cell enumeration using an automated cell counter.
20. Determine the concentration of the live cells in the cell suspension obtained in step A19 by repeating the enumeration procedure described in step A9.
21. Prepare a T-75 flask containing 17 mL of prewarmed Std medium and inoculate the flask with 1 × 10⁶ cells from the cell suspension in step A19.
22. Gently rock the flask to help ensure the Caco-2 cells are distributed evenly.
23. Incubate the flask in incubator A.
24. Replace culture medium in the flask with fresh Std medium once every 3 days. Monitor the cells under microscope A to ensure they remain attached to the surface of the flask.
25. After reviving the cells, complete at least two rounds of cell passaging (steps A14–23) prior to differentiating the cells on inserts (as described in section D).
Note: For reproducible results, use cells between passages 28 and 33 for subsequent co-culture experiments.
B. Growing and maintaining bacteria on agar
Carry out the following steps in a dedicated microbiology or co-culture laboratory.
1. Transfer all components specified in the MRS agar recipe into a 1,000 mL Schott bottle. Mix the components thoroughly using a magnetic stirrer equipped with a hot plate. Bring the solution to a boil, and sustain boiling for 2–3 min.
2. Sterilize the agar immediately in an autoclave at 121 °C for 20 min at 15 psi.
3. Working in biosafety cabinet B, aseptically transfer ~ 20 mL of warm autoclaved MRS agar into sterile Petri dishes. Allow the agar in the plates to solidify within the biosafety cabinet for about 2 h, or until agar has set.
Note: Prepared MRS agar plates can be stored at 4 °C for up to 1 month. Seal the plates with parafilm to prevent the agar from drying out.
4. Inoculate sterile MRS agar plates with the desired bacterial strains at least 14 days before the co-culture experiment.
5. Transfer MRS agar plates from 4 °C storage to biosafety cabinet B and allow the plates to equilibrate to room temperature. Prepare a sufficient number of plates: one plate for each bacterial strain and an additional plate as a sterility control (un-inoculated).
6. Working in biosafety cabinet B, aseptically inoculate each MRS agar plate with the corresponding bacterial strain using the four-quadrant streak method. Briefly touch a sterile loop into a vial of frozen bacterial culture stock and use the loop to streak inoculum onto the agar surface. Perform a similar streaking procedure on a separate plate as a sterility control without introducing any bacterial cells.
7. Incubate the agar plates in incubator B. Once the single colonies are visible (which may take 3–5 days, depending on the bacterial strain), the agar plates can be stored at 4 °C for up to 10 days.
C. Determining growth kinetics of bacteria in liquid broth
Carry out the following steps in a dedicated microbiology or co-culture laboratory.
1. Prepare MRS broth by weighing and measuring the components according to the recipe. Transfer all components to a 1000 mL Schott bottle. Heat the mixture with stirring using a magnetic stirrer and hot plate until all components are completely dissolved. Sterilize the broth by autoclaving at 121 °C for 20 min at 15 psi.
2. Determine the approximate time required for the primary bacterial cultures to reach the stationary phase:
a. Working in biosafety cabinet B, use a sterile loop to scrape a single bacterial colony from a MRS agar plate prepared in section B and inoculate it into a 15 mL centrifuge tube containing 5 mL of sterile MRS broth. Vortex the tube to mix. Prepare one tube for each bacterial strain.
b. Transfer 100 μL of inoculated broths to at least three replicate wells of a 96-well plate and seal the plate with sealing film.
c. Commence a kinetic assay using a microplate reader set to measure absorbance at 600 nm. Program the plate reader to take measurements at 30-min intervals, with a 1-min period of moderate shaking before each reading. Continue the measurement cycle for a duration of 72 h.
d. Use Excel, R, or other appropriate graphing software to plot absorbance against time for each bacterial culture. Analyze the generated growth curves to determine the approximate time (e.g., 16, 24, 48, or 72 h) required for the primary bacterial cultures to reach the stationary phase.
3. Determine the volume of primary culture required to inoculate a secondary culture such that the secondary culture will reach the stationary phase at ~16 h.
a. For each primary bacterial culture, prepare five secondary cultures of different dilutions. For each dilution, inoculate a 15 mL centrifuge tube containing 5 mL of sterile MRS broth with 10, 25, 40, 100, or 500 μL of the corresponding primary culture.
b. Transfer 100 μL of inoculated broths to at least three replicate wells of a 96-well plate and seal the plate with sealing film.
c. Commence a kinetic assay using a microplate reader set to measure absorbance at 600 nm. Program the plate reader to take measurements at 30-min intervals, with a 1-min period of moderate shaking before each reading. Continue the measurement cycle for a duration of 24 h.
d. Use Excel, R, or other appropriate graphing software to plot absorbance against time for each strain and dilution of the bacterial cultures. For each strain, analyze the growth curves to determine which dilution results in the secondary culture reaching stationary phase at ~16 h.
D. Differentiating Caco-2 monolayers in inserts (Days 0–17)
Carry out the following steps in a dedicated cell culture laboratory, starting 17 days prior to the co-culture experiment.
1. Carry out steps A14–23 to subculture the cells.
2. In a 15 mL centrifuge tube, prepare 5 mL of cell suspension containing 4 × 10⁵ live cells/mL in Std medium. This cell suspension is sufficient to seed 24 inserts at 80,000 cells per insert.
3. Add 800 μL of prewarmed Std medium to each well in the 24-well plate that contains an insert.
4. Carefully pipette 200 μL of cell suspension into each insert using a P200 pipette.
5. Incubate plates containing seeded inserts in incubator A. This is regarded as Day 0 of the 17-day Caco-2 differentiation.
6. Twenty-four hours after seeding, replace the medium in the inserts with 200 μL of fresh Std medium. Using a P200 pipette, gently aspirate as much of the medium as possible from the insert. To minimize disruption, elevate the back of the plate to allow the medium to pool toward the front of the insert. Prioritize the integrity of the membrane over complete removal of the medium. Gently add 200 μL of fresh Std medium to the insert by directing the pipette tip against the insert wall and dispensing the medium slowly along the wall.
7. Two days later, and every 3 days thereafter, replace the medium in each of the inserts and wells with fresh Std medium (200 and 800 μL, respectively). First, remove the medium from the wells (this will improve the visibility of the membrane when aspirating medium from the insert). Tilt the plate forward and use a P1000 pipette to aspirate the medium from each well by carefully sliding the pipette tip through the opening on the edge of the insert. Aspirate the medium from each insert as described in the previous step, prioritizing the integrity of the cellular monolayer. Add 200 μL of fresh Std medium to each insert by directing the pipette tip against the insert wall and dispensing slowly. Finally, add 800 μL of fresh Std medium to each well by dispensing through the opening on the edge of the insert.
E. Preparing bacterial treatments (Days ~15*–16)
Carry out the following steps in a dedicated microbiology or co-culture laboratory.
*Start day will depend on bacterial growth kinetics as determined in section C.
1. Prepare primary cultures of bacteria for the bacterial treatment. Use a single bacterial colony (from an MRS agar plate prepared in section B) to inoculate a 15 mL centrifuge tube containing 5 mL of sterile MRS broth. Vortex the tube to mix. Prepare one tube for each bacterial strain, and an additional tube containing 5 mL of sterile MRS broth as a negative control (no bacterial inoculation).
2. Incubate the tubes in incubator B for the length of time required for the culture to reach the stationary growth phase, as determined in step C2.
Critical: The timing of bacterial inoculations may need to be staggered to ensure all primary cultures are in stationary phase on the evening of Day 16.
3. On the evening of Day 16, prepare secondary bacterial cultures for treatment. Aseptically inoculate 5 mL of sterile MRS broth with the volume of primary bacterial culture determined in step C3. Repeat for all tubes of primary cultures, including the negative control.
4. Incubate for 16 h in incubator B.
F. Preparing Caco-2 cells for co-culture experiment (Day 16)
Carry out the following steps in a dedicated cell culture laboratory, one day prior to the co-culture experiment.
1. Working in biosafety cabinet A, sterilize the EndOhm chamber and cap, epithelial volt/ohm meter, and tweezers by spraying with 70% ethanol. Allow the ethanol to evaporate from the equipment. Ensure that the electrode of the EndOhm cap and the tips of the tweezers do not come into contact with the surface of the biosafety cabinet.
2. Place the cap onto the chamber. Use a spare insert to adjust the clearance between the top electrode and the culture membrane to 1–2 mm. Once the upper electrode height is set, do not change it until all TEER measurements have been completed.
3. Connect the cap and the chamber using the EndOhm cable. Connect the other end of the cable to the epithelial volt/ohm meter. Add 1 mL of prewarmed TEER medium into the chamber. To make resistance measurements, set the function switch in the epithelial volt/ohm to Ohms, and turn the power on.
4. From incubator A, transfer a plate of inserts to biosafety cabinet A. Only remove one plate at a time to minimize the impact of temperature change on TEER.
5. Using sterile tweezers, carefully transfer one insert into the EndOhm chamber. Ensure that the cap is well-seated on the chamber, so that the top electrode is centered. Record the resistance value in ohms. Determine TEER by multiplying the resistance by the surface area of the insert membrane (0.33 cm2 for the inserts used here). Do not use inserts with a TEER value below 500 Ω.cm2 in the co-culture experiment (section G).
6. Once TEER measurements have been completed for all inserts in the plate, replace the medium in the inserts with 260 μL of TEER medium using the technique as described in step D6. Return the plate to incubator A until the co-culture assay on Day 17.
G. Setup for cellZscope TEER assay (Days 17 and 18)
Carry out the following steps in a dedicated co-culture laboratory.
1. Aseptically assemble the cellZscope module in biosafety cabinet B following the manufacturer’s assembly instructions. Lightly spray 70% ethanol over the measurement wells and allow to evaporate.
Critical: Ensure ethanol has completely evaporated before proceeding.
2. Fill each well of the cellZscope module with 810 μL of prewarmed TEER medium and place it in incubator C until required.
3. Upon completion of the 16-h incubation (step E4), spin the stationary phase bacterial cultures at room temperature for 20 min at 2,500× g using centrifuge B. Proceed with steps G4–10 while the centrifugation completes.
4. Transfer the cellZscope module (from incubator C) and the plates of inserts containing the 17-day-old Caco-2 monolayers (from incubator A) into biosafety cabinet B.
5. Transfer the inserts into the cellZscope wells using sterile tweezers.
Critical: Ensure inserts are carefully lowered into the wells to maintain the integrity of the monolayer in the insert.
6. Transfer the cellZscope module into incubator C and connect it to the cellZscope controller with the cable provided. Connect the controller to a computer running the nanoAnalytics software.
7. Initiate an electrode test within the nanoAnalytics software to ensure that all electrodes are functioning appropriately. In the software interface, navigate to Extras → Test Electrodes and then click Start. Electrode functionality will be visually indicated by color: green for successful function and red for failure.
Critical: If an electrode fails the test, return cellZscope module to the biosafety cabinet. For the wells that failed, check the electrode connections and media volumes. Repeat the electrode test after returning the cellZscope module to the incubator.
8. In the nanoAnalytics software, go to the Layout tab → Insert, and for each well select the correct insert type (i.e., Corning polyester membrane inserts, 6.5 mm diameter, 0.4 μm pore size) from the drop-down list, to ensure resistance is converted to TEER correctly.
9. Create a data file by navigating to File → Save measurement as and entering the file name for the data. Complete file creation by selecting Save.
10. Perform background measurements by selecting the Exp Control tab and setting the Wait time to 30 min. Initiate background measurements by selecting Start. Acquire three consecutive measurements at 0, 30, and 60 min. Proceed to step G11 after the 0 min measurement has been initiated.
11. Once centrifugation (step G3) has completed, transfer the spun-down bacterial cultures into biosafety cabinet B and discard the supernatant.
12. Gently resuspend each bacterial cell pellet in 2 mL of prewarmed TEER medium.
13. Enumerate the bacterial concentration in each suspension as described in section H.
14. Based on the concentration determined in the previous step, prepare 2 mL of 1.4 × 10⁸ cells/mL bacterial suspension in TEER medium for each strain. Keep the bacterial suspensions in incubator B until required.
Note: The 1.4 × 10⁸ cells/mL concentration is selected because adding 260 μL of the suspension to a 6 mm insert will result in a multiplicity of infection (MOI) of ~1,000 (i.e., 1000 bacterial cells per Caco-2 cell).
15. Stop the background measurement initiated in step G10 after completing the three time points by selecting Stop in the nanoAnalytics software.
16. Transfer the cellZscope module to biosafety cabinet B. Remove the medium from each insert using a P300 pipette. Critical: Avoid contact between the cell monolayer and the pipette tip. Tilt the cellZscope module by elevating the back slightly to help improve visibility of the insert membrane.
17. Immediately add 260 μL of the appropriate bacterial suspension prepared in step G14 or 260 μL of TEER medium as the control treatment.
18. Return the cellZscope module to incubator C to commence the electrode test as described in step G7.
19. Change the measurement frequency to hourly intervals by navigating to the Exp Control tab and selecting “1 hour” from the Wait time drop menu. Commence TEER measurements by selecting START on the software.
20. On Day 18, once 24 h of measurement have been collected, select STOP on the nanoAnalytics software to complete the TEER assay.
21. Move the cellZscope module to biosafety cabinet B and collect any samples, such as conditioned medium or cells, if needed for further analysis.
22. Clean the cellZscope module by discarding the inserts (if not required) and medium (if not collected). Disassemble the cellZscope module and sterilize the appropriate parts by autoclaving.
H. Bacterial enumeration
Carry out the following steps in a dedicated microbiology or co-culture laboratory.
1. Gently clean a counting chamber slide with lint-free paper.
2. In biosafety cabinet B, dilute an aliquot of the bacterial suspension 200-fold in PBS.
3. Transfer 10 μL of the diluted suspension to fill the counting chambers on the slide. The chambers are recognizable by the grids etched on the glass. Gently lower a coverslip over the counting chamber.
4. View the slide under microscope B. Adjust the focus on the microscope until the grids are visible and sharp. Count the number of bacterial cells in five squares within the double-lined grid, excluding the cells intersected by the double grid lines. Critical: If the bacterial cell count per square is below 80 or above 240, then adjust the dilution in step H2 accordingly, and repeat steps H3–4.
5. To determine the bacterial cell concentration in the undiluted suspension, apply the following formula:
[average cell count per square] × [dilution factor from step 2] × [1.25 × 106 (constant for Petroff counting chamber slide)].
Data analysis
Data quality control and formatting
Export the cellZscope data in xlsx format by selecting File → Export Data in the nanoAnalytics software, selecting the wells of interest, and clicking Export. Name the file before clicking Save. Open the exported file in Microsoft Excel or other compatible spreadsheet software. Note that in the spreadsheet, each well of the cellZscope is represented by a column, and each time point is represented by a row. The TEER at the time point immediately before the addition of the bacterial co-culture treatment was considered the baseline TEER. Discard the time point immediately following the baseline (i.e., 0 min post-treatment), as these TEER values may be affected due to handling and alterations in temperature. The following time point (i.e., 1-h post-treatment) is considered the first time point.
To ensure the data is of sufficient quality, check that for each well, (i) the baseline TEER is >500 Ω·cm2, (ii) the TEER at the first time point is >500 Ω·cm2 and over 60% of the value of the baseline TEER, (iii) the TEER does not reach over three times the value of the baseline TEER at any time point, and (iv) the TEER does not consistently drop below 40% of the baseline TEER within the first 12 h following treatment. If a well does not satisfy all these criteria, this likely indicates an erroneous electrode connection or a cell monolayer that has been disrupted by handling or contamination; hence, the data from these wells should be discarded. Finally, calculate the change in TEER for each well using the following formula: change in TEER (%) = ((TEER (Ω·cm2) − baseline TEER (Ω·cm2))/baseline TEER (Ω·cm2) × 100 (%).
In preparation for statistical analysis in R, format the data table to include rows of metadata. These additional rows can be placed above the row showing the “well” number. As a minimum, include a row named treatment that indicates the bacterial strain used in the co-culture, a row named block that indicates the experimental run number, and a row named subject. Use the subject row to denote each well with a unique identifier, so that the TEER across a given monolayer can be tracked over time. Note that the well number alone does not suffice as a unique identifier because a given well may be reused over multiple experimental runs, and because well numbers are shared between multiple cellZscope modules.
Statistical analysis
To analyze the repeated TEER measures in R, each row in the data frame needs to represent one time point per subject. Hence, each subject will have data in multiple rows, while the metadata (which does not change across time) will have the same value in all the rows for the given subject. To achieve this format, after importing the data from Excel into R, transpose the resulting data frame such that each row represents a single subject. Next, extract the metadata columns and create a second data frame named Metadata. Then take the original data frame, henceforth referred to as TEERdata, and delete the metadata columns apart from the subject column. Further modify the TEERdata data frame by transposing it a second time, whereby each row represents a single time point, and each column represents a single subject. Next, reshape the data from wide to long format such that the data frame has three columns: time point, subject, and the change in TEER. Finally, add columns from the Metadata data frame, matching the rows based on subject.
As shown in the code below, use the nlme [17] package in R to fit the TEER data using a linear mixed effects model (lme1) with time + treatment + time × treatment as fixed effects, and subject nested within a block as a random effect:
lme1 <- lme(TEER ~ Time*Treatment, random=~ 1|Block/Subject,
weights = (varIdent(form=~1|Treatment), varIdent(form=~1|Time)),
method="ML", control=lmeControl(opt="optim"), TEERData)
After computing the analysis of variance for the model, if the treatment × time interaction is significant (P < 0.05), then carry out pairwise comparisons using estimated marginal means using the emmeans [18] package in R and correct for multiple comparisons by applying false discovery rate as shown in the codes below. The difference between means may be considered significant if q < 0.05.
To look for differences between treatments at a given time point:
emmeans (lme1, pairwise~Treatment | Time, type = "response", adjust = "fdr")
To look for differences between time points for a given treatment:
emmeans(lme1, pairwise~Time | Treatment, type = "response", adjust = "fdr")
Visualize the data by plotting the mean of (the change in) TEER over time with error bars denoting the standard deviation or standard error. Alternatively, plot the estimated marginal mean of (the change in) TEER over time with error bars denoting the confidence level or standard error, as shown in Figure 1.
Note: In using different statistical software, ensure that a linear mixed effects model with time + treatment + time × treatment as fixed effects and subject nested within a block as a random effect is used.
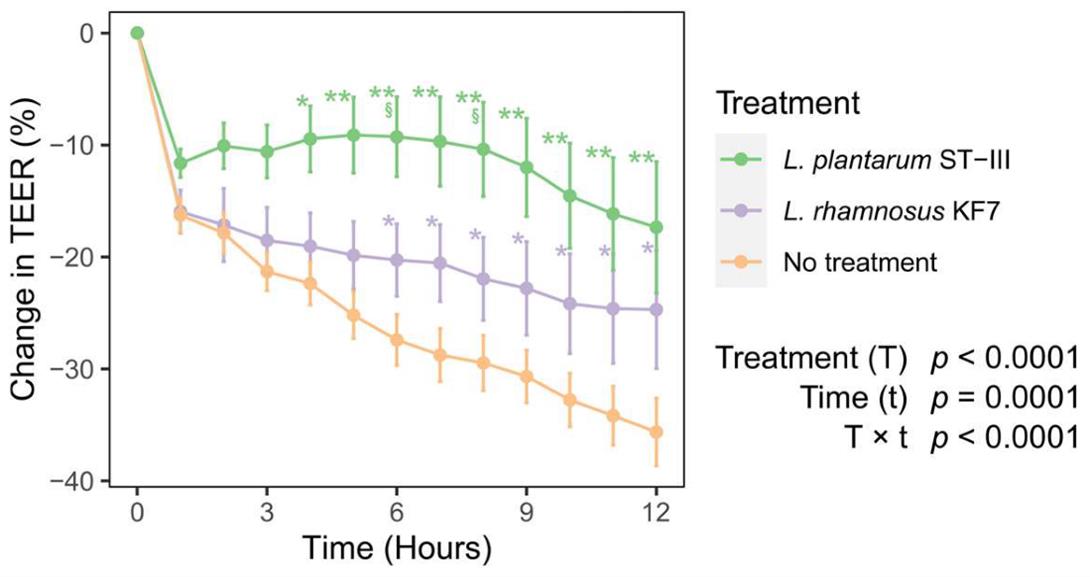
Figure 1. Example of change in transepithelial electrical resistance (TEER) data. Effect of probiotic treatment on TEER across Caco-2 monolayers over time. Seventeen-day-old differentiated Caco-2 monolayers were co-cultured with Lactiplantibacillus plantarum ST-III or Lacticaseibacillus rhamnosus KF7 with a multiplicity of infection of 1,000 or cultured without probiotic bacteria (no treatment; control). Graph shows mean (+/− SEM) change in TEER (n = 14–17 per treatment). * q < 0.05, ** q < 0.01, compared to control; § q < 0.05 compared to L. rhamnosus KF7 treatment. Reprinted from [12]. © The Authors, some rights reserved; exclusive licensee, MPDI. Distributed under a Creative Commons Attribution NonCommercial License 4.0 (CC BY-NC) http://creativecommons.org/licenses/by-nc/4.0/.
Validation of protocol
This protocol or parts of it has been used and validated in the following research article(s):
Anderson et al. [9]. Lactobacillus plantarum DSM 2648 is a potential probiotic that enhances intestinal barrier function. FEMS Microbiology Letters (Figure 1).
Anderson et al. [19]. Bovine dairy complex lipids improve in vitro measures of small intestinal epithelial barrier integrity. PLoS One (Figure 1).
General notes and troubleshooting
General notes
1. It is essential to apply aseptic techniques when handling mammalian and bacterial cells.
2. Negative controls should be handled similarly to bacterial samples.
Troubleshooting
Problem 1: Low TEER values prior to initiating co-culture assay.
Possible cause: Number of cells seeded may not be at the appropriate amount due to poor mixing when preparing cell solution and trypan blue mixture.
Solution: Ensure the mixture is homogenous and cell count is repeated at least two times; repeat if readings are inconsistent.
Problem 2: Resistance measured in cellZscope begins to increase over time before reducing to zero.
Possible cause: Contamination in cellZscope measuring cups.
Solution: Ensure measuring cups of the cellZscope are sterile prior to commencement of the assay and inserts are transferred aseptically.
Problem 3: Agar plates contain more than one type of colony.
Possible cause: Bacterial culture is contaminated.
Solution: Streak new plates from frozen stock.
Problem 4: Cell culture media becomes cloudy or acidic (yellow color) prior to the addition of bacterial cultures.
Possible cause: Mammalian cells contaminated with bacterial cells.
Solution: Discard Caco-2 cells and start with fresh cells from frozen stocks.
Acknowledgments
The authors would like to express their sincere gratitude to Catherine Lloyd-West for statistical advice and for preparing the code presented in this paper. The protocol was based on methods presented in Anderson et al. [9] and Zhang et al. [12]. The authors thank Raise Ahmad and Alicia Barnett for a critical review of the protocol prior to submission.
Competing interests
The authors declare that they have no competing interests. No author has received any financial support or other benefits from any organization or entity that may have an interest in the subject matter of this article.
References
- Camilleri, M. (2021). Human Intestinal Barrier: Effects of Stressors, Diet, Prebiotics, and Probiotics. Clin Transl Gastroenterol. 12(1): e00308. https://doi.org/10.14309/ctg.0000000000000308
- Chelakkot, C., Ghim, J. and Ryu, S. H. (2018). Mechanisms regulating intestinal barrier integrity and its pathological implications. Exp Mol Med. 50(8): 1–9. https://doi.org/10.1038/s12276-018-0126-x
- Ulluwishewa, D., Anderson, R. C., McNabb, W. C., Moughan, P. J., Wells, J. M. and Roy, N. C. (2011). Regulation of Tight Junction Permeability by Intestinal Bacteria and Dietary Components. J Nutr. 141(5): 769–776. https://doi.org/10.3945/jn.110.135657
- Schoultz, I. and Keita, Ã. V. (2020). The Intestinal Barrier and Current Techniques for the Assessment of Gut Permeability. Cells. 9(8): 1909. https://doi.org/10.3390/cells9081909
- Camilleri, M. (2019). Leaky gut: mechanisms, measurement and clinical implications in humans. Gut. 68(8): 1516–1526. https://doi.org/10.1136/gutjnl-2019-318427
- Rose, E. C., Odle, J., Blikslager, A. T. and Ziegler, A. L. (2021). Probiotics, Prebiotics and Epithelial Tight Junctions: A Promising Approach to Modulate Intestinal Barrier Function. Int J Mol Sci. 22(13): 6729. https://doi.org/10.3390/ijms22136729
- Qin, H. L. (2005). Effect of lactobacillus on the gut microflora and barrier function of the rats with abdominal infection. World J Gastroenterol. 11(17): 2591. https://doi.org/10.3748/wjg.v11.i17.2591
- Anderson, R. C., Cookson, A. L., McNabb, W. C., Park, Z., McCann, M. J., Kelly, W. J. and Roy, N. C. (2010). Lactobacillus plantarum MB452 enhances the function of the intestinal barrier by increasing the expression levels of genes involved in tight junction formation. BMC Microbiol. 10(1): 316. https://doi.org/10.1186/1471-2180-10-316
- Anderson, R. C., Cookson, A. L., McNabb, W. C., Kelly, W. J. and Roy, N. C. (2010). Lactobacillus plantarum DSM 2648 is a potential probiotic that enhances intestinal barrier function. FEMS Microbiol Lett. 309(2): 184–192. https://doi.org/10.1111/j.1574-6968.2010.02038.x
- Blackwood, B. P., Yuan, C. Y., Wood, D. R., Nicolas, J. D., Grothaus, J. S. and Hunter, C. J. (2017). Probiotic Lactobacillus Species Strengthen Intestinal Barrier Function and Tight Junction Integrity in Experimental Necrotizing Enterocolitis. J Probiotics Health. 5(1): e1000159. https://doi.org/10.4172/2329-8901.1000159
- Lee, B., Moon, K. M. and Kim, C. Y. (2018). Tight Junction in the Intestinal Epithelium: Its Association with Diseases and Regulation by Phytochemicals. J Immunol Res. 2018: 1–11. https://doi.org/10.1155/2018/2645465
- Zhang, Y., Anderson, R. C., You, C., Purba, A., Yan, M., Maclean, P., Liu, Z. and Ulluwishewa, D. (2024). Lactiplantibacillus plantarum ST-III and Lacticaseibacillus rhamnosus KF7 Enhance the Intestinal Epithelial Barrier in a Dual-Environment In Vitro Co-Culture Model. Microorganisms. 12(5): 873. https://doi.org/10.3390/microorganisms12050873
- Pinto, M., Robine, S. and Appay, M. D. (1983). Enterocyte-like differentiation and polarization of the human colon carcinoma cell line CACO-2 in culture. Biol Cell. 47: 323–330. https://www.scienceopen.com/document?vid=07f3fdcd-c23c-47d4-ad63-105346ef5453
- Hidalgo, I. J., Raub, T. J. and Borchardt, R. T. (1989). Characterization of the Human Colon Carcinoma Cell Line (Caco-2) as a Model System for Intestinal Epithelial Permeability. Gastroenterology. 96(2): 736–749. https://doi.org/10.1016/s0016-5085(89)80072-1
- Srinivasan, B., Kolli, A. R., Esch, M. B., Abaci, H. E., Shuler, M. L. and Hickman, J. J. (2015). TEER Measurement Techniques for In Vitro Barrier Model Systems. SLAS Technol. 20(2): 107–126. https://doi.org/10.1177/2211068214561025
- Ulluwishewa, D., Anderson, R. C., Young, W., McNabb, W. C., van Baarlen, P., Moughan, P. J., Wells, J. M. and Roy, N. C. (2014). Live Faecalibacterium prausnitziiin an apical anaerobic model of the intestinal epithelial barrier. Cell Microbiol. 17(2): 226–240. https://doi.org/10.1111/cmi.12360
- Pinheiro, J., Bates, D., DebRoy, S., Sarkar, D. and R Core Team (2024). nlme: Linear and Nonlinear Mixed Effects Models_. R package version 3.1–144, https://CRAN.R-project.org/package=nlme
- Lenth, R. V. (2024). emmeans: Estimated Marginal Means, aka Least-Squares Means_. R package version 1.8.7, https://CRAN.R-project.org/package=emmeans.
- Anderson, R. C., MacGibbon, A. K. H., Haggarty, N., Armstrong, K. M. and Roy, N. C. (2018). Bovine dairy complex lipids improve in vitro measures of small intestinal epithelial barrier integrity. PLoS One. 13(1): e0190839. https://doi.org/10.1371/journal.pone.0190839
Article Information
Publication history
Received: Jan 29, 2025
Accepted: May 20, 2025
Available online: Jun 11, 2025
Published: Jun 20, 2025
Copyright
© 2025 The Author(s); This is an open access article under the CC BY-NC license (https://creativecommons.org/licenses/by-nc/4.0/).
How to cite
Purba, A., Anderson, R. C. and Ulluwishewa, D. (2025). In Vitro Co-culture of Bacterial and Mammalian Cells to Investigate Effects of Potential Probiotics on Intestinal Barrier Function. Bio-protocol 15(12): e5361. DOI: 10.21769/BioProtoc.5361.
Category
Microbiology > Microbe-host interactions > Bacterium
Cell Biology > Cell-based analysis > Electrophysiological technique
Do you have any questions about this protocol?
Post your question to gather feedback from the community. We will also invite the authors of this article to respond.