- Protocols

- Articles and Issues
- For Authors
- About
- Become a Reviewer

PI(4,5)P2 Imaging Using a GFP Reporter in Living Cells
Published: Vol 15, Iss 11, Jun 5, 2025 DOI: 10.21769/BioProtoc.5336 Views: 1956
Reviewed by: Thirupugal GovindarajanAnonymous reviewer(s)
Original research article
The authors used this protocol in:
May 2024
Advertisement


Protocol Collections
Comprehensive collections of detailed, peer-reviewed protocols focusing on specific topics


Related protocols
Abstract
Phosphatidylinositol 4,5-bisphosphate [PI(4,5)P2] is a phospholipid enriched on the cytoplasmic leaflet of the plasma membrane, where it plays important roles in membrane trafficking and cytoskeletal dynamics through proteins that directly bind to it. PI(4,5)P2 can be metabolized to other phosphorylated forms of phosphatidylinositol to regulate numerous processes such as cell growth and development. PI(4,5)P2 can also be hydrolyzed to generate the second messengers diacylglycerol (DAG) and inositol triphosphate (IP3). Altered metabolism or mislocalization of PI(4,5)P2 can perturb one or more of its functions and contribute to disease states. Here, we present a protocol to visualize and quantify the localization of PI(4,5)P2 in live cells. The protocol uses a highly specific PI(4,5)P2 protein binding domain coupled to enhanced green fluorescence protein (PH-PLCD1-GFP), enabling localization and quantification of cytosol-facing PI(4,5)P2 to be determined. Localization and quantification of the PH-PLCD1-GFP, PI(4,5)P2 specific probe, is enabled by fluorescence imaging and confocal microscopy. This approach can be used to study the dynamics of PI(4,5)P2 localization temporally in live cells under both physiological and pathological conditions.
Key features
• Protocol for the quantification of PI(4,5)P2 membrane localization in live cells.
• Uses the expression of the highly specific PH-PLCD1-GFP, PI(4,5)P2 probe, in cells, followed by fluorescence image acquisition using confocal microscopy and subsequent image processing.
• Adaptable to various cell types and experimental conditions.
• Presents detailed instructions for reagent preparation, fluorescence measurement, and quantification.
Keywords: PI(4,5)P2Graphical overview
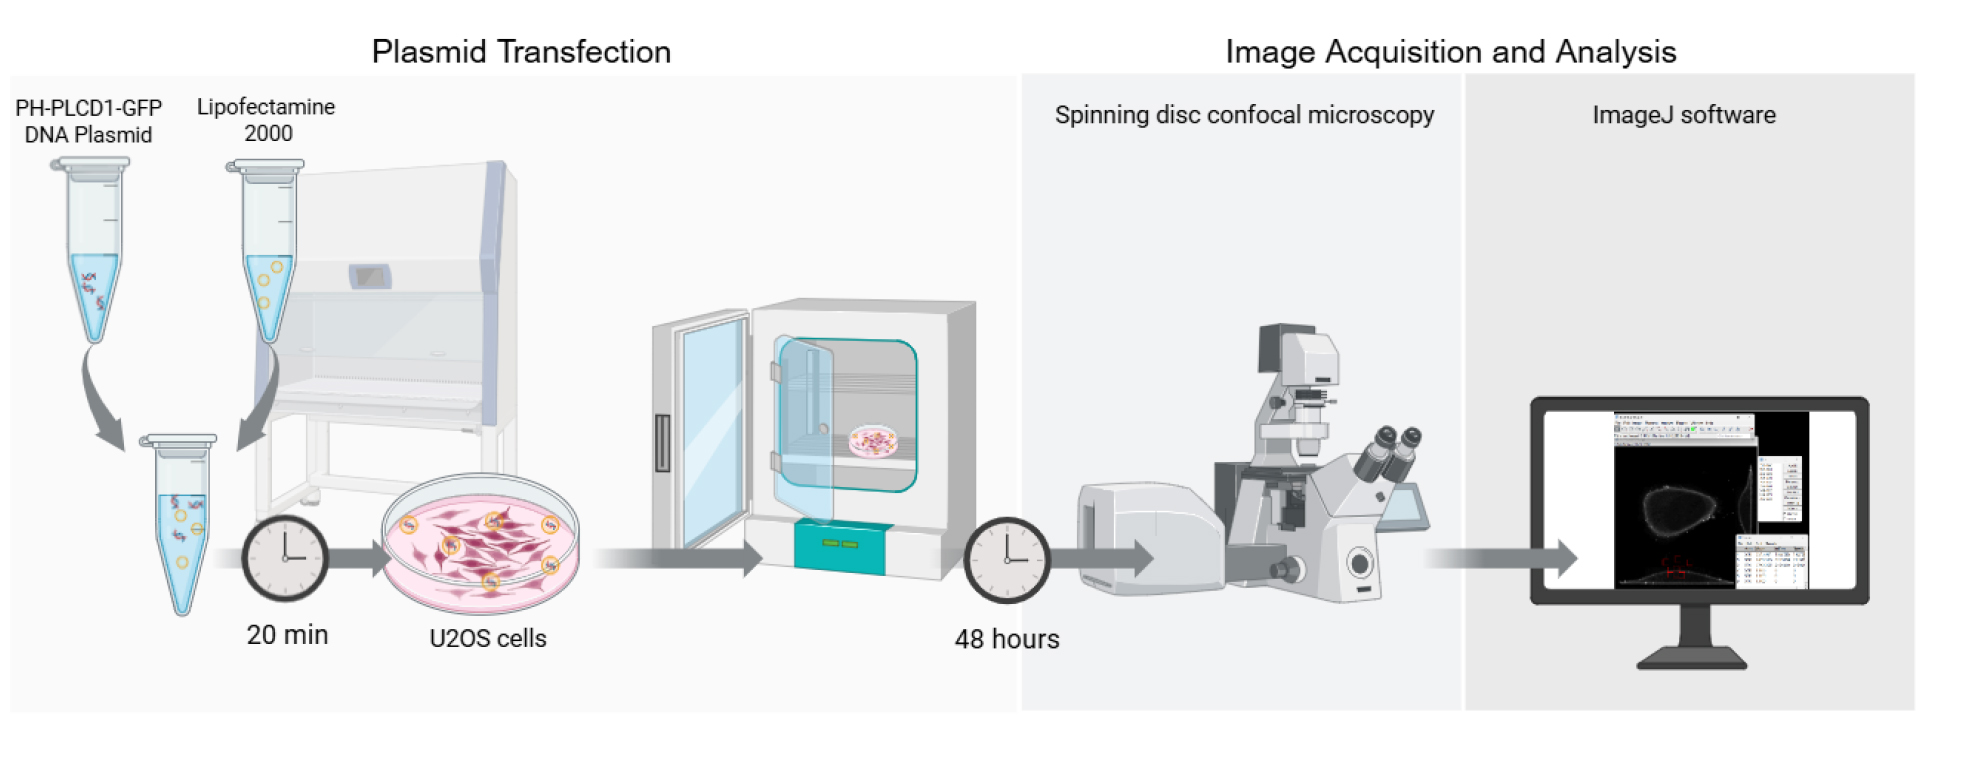
Graphical overview of the key steps for quantifying PI(4,5)P2 localization in living cells
Background
Phosphatidylinositol 4,5-bisphosphate [PI(4,5)P2] is a phospholipid that belongs to the phosphoinositide family. Phosphoinositides are phosphorylated derivatives of phosphatidylinositol that can be further phosphorylated at different positions on the inositol ring to generate a variety of distinct lipid signaling molecules [1,2]. PI(4,5)P2 is a phosphoinositide that is preferentially localized to the inner leaflet of the plasma membrane [3–5]. PI(4,5)P2 can bind to numerous proteins, often through a distinct PI(4,5)P2 binding domain, with exemplars including Pleckstrin homology (PH) domain, Phox (PX) homology domain, Postsynaptic Density-95 (PSD-95)/Discs Large (Dlg)/Zonula Occludens-1 (PDZ), Protein Kinase C conserved Region 2 (C2), Src Homology 2 (SH2), Plant Homeodomain (PHD), and Myristoylated Alanine-Rich C-Kinase Substrate (MARCKS) domains [2,6–10]. This binding often aids in the localization of a protein to the plasma membrane, where they regulate numerous processes such as membrane trafficking and cytoskeletal dynamics [1,5,7–11]. PI(4,5)P2 also serves as a substrate for phospholipase Cs that convert PI(4,5)P2 to diacylglycerol and inositol triphosphate (IP3). Diacylglycerol can itself recruit proteins to membranes, including members of the protein kinase C family, while IP3 releases Ca2+ from the endoplasmic reticulum [12,13]. Perturbation of the level or localization of PI(4,5)P2 can have profound effects on cell dynamics and cell signaling and contribute to disease states [14–16].
Numerous phosphoinositide binding domains have varying affinities and specificities for each phosphoinositide [2,3,17]. The PH domain of phospholipase C delta (PH-PLCD1) has high affinity and specificity for PI(4,5)P2, and a chimeric PH-PLCD1-GFP fusion is an accurate reporter for PI(4,5)P2 localization [5,6,11,17,18]. This interaction has been validated in multiple species and cell types, including mammalian cells, Xenopus oocytes, Drosophila, and yeast, supporting its broad applicability [19–22]. Our optimized protocol allows for the visualization of PI(4,5)P2 and enables the quantification of the ratio of plasma membrane to intracellular PI(4,5)P2. Using the PH-PLCD1-GFP fusion allows for real-time high-resolution tracking of PI(4,5)P2 in live cells. This protocol serves as a comprehensive step-by-step guide providing a standardized approach to quantify PI(4,5)P2 plasma membrane localization.
Materials and reagents
Biological materials
1. U20S cells (ATCC, HTB-96)
2. PH-PLCD1-GFP plasmid (Addgene, plasmid #51407; map available at: https://www.addgene.org/51407)
Reagents
1. Lipofectamine 2000 (InvitrogenTM, catalog number: 11668019)
2. Opti-MEM (Gibco, catalog number: 31985070)
3. DMEM, high glucose (Gibco, catalog number: 11965092)
4. Fetal bovine serum (FBS) (Gibco, catalog number: A3160502)
5. Antibiotic-antimycotic (AA) (100×) (Gibco, catalog number: 15240062)
Laboratory supplies
1. Two-chamber Lab-Tek® II chambered German coverslip system (Thermo Fisher Scientific, catalog number: 155379)
2. 1.5 mL Eppendorf tubes (Eppendorf, catalog number: 0540294)
3. Eppendorf Research® pipettes, 0.5–10 μL, 10–100 μL, 20–200 μL, 100–1,000 μL (Eppendorf, catalog number: 3123000942)
4. Biosphere® plus filter tip, 1000 μL, 200 μL, 100 μL, 10 μL (Sarstedt)
Equipment
1. Zeiss Axio Observer Z.1 spinning disk confocal microscope (Carl Zeiss AG)
2. Automated cell counter (Bio-Rad, model: 1450102)
3. Cell counting dual-chambered slides (Bio-Rad, catalog number: 1450011)
4. Tissue culture incubator, 37 °C, 5% CO2 (Eppendorf, model: CellXpert® C170i)
5. Tissue culture hood, class II biosafety cabinet (Bio-Klone, model: BK-2-4)
Software and datasets
1. ZEISS ZEN (version 3.1; Carl Zeiss Microscopy GmbH, Jena, Germany)
2. Fiji (ImageJ-win64; version 1.54; https://imagej.net/software/fiji/downloads)
3. Microsoft Excel (version 2502; Microsoft Corporation, Redmond, WA, USA)
4. GraphPad Prism (version 10; GraphPad Software, San Diego, CA, USA)
Procedure
A. Transfection of U2OS cells with PH-PLCD1-GFP
All the following steps are performed in a Class II biosafety cabinet under sterile conditions.
1. Seed U2OS cells in 1 mL of complete media (DMEM supplemented with 10% FBS and 1% AA) in a 2-well chamber slide system at a density of 50,000 cells per well one day prior to transfection.
Note: The size of each well in a 2-well chamber slide system is 4.2 cm2. If a different well format is used, volumes/concentrations may be upscaled or downscaled accordingly.
2. For cell counting, load 10 μL of cell suspension into each chamber of the dual-chambered counting slide and insert into the Bio-Rad automated cell counter, which automatically provides total cell concentration in cells/mL.
3. On the day of transfection, change media to AA-free DMEM media supplemented with 10% FBS (1 mL per well).
4. In a 1.5 mL Eppendorf tube, dilute PH-PLCD1-GFP DNA plasmid in Opti-MEM to achieve a concentration of 0.5 μg in 75 μL of Opti-MEM per well.
5. In another 1.5 mL Eppendorf tube, dilute Lipofectamine 2000 in Opti-MEM to achieve a concentration of 3 μL of Lipofectamine 2000 in 75 μL of Opti-MEM per well.
6. Add diluted PH-PLCD1-GFP DNA (0.5 μg in 75 μL of Opti-MEM) to diluted Lipofectamine 2000 (3 μL in 75 μL of Opti-MEM) and gently mix by pipetting. Incubate at room temperature for 20 min.
7. Add 150 μL of PH-PLCD1-GFP DNA-Lipofectamine complex mixture dropwise to each well and incubate cells at 37 °C with 5% CO2 for 24 h.
8. Twenty-four hours post-transfection, change transfection media to fresh complete DMEM media with AA and incubate cells at 37 °C with 5% CO2 for an additional 24 h to allow peak expression of the GFP reporter, consistent with the general transfection guidelines. The post-transfection time frame for optimal reporter expression can be optimized based on the cell type being studied.
9. Following 48 h post-transfection, cells are ready for imaging. The robust expression of the GFP-tagged reporter in over 80% of U2OS cells confirmed successful transfection.
B. Imaging U2OS cells transfected with PH-PLCD1-GFP
Images of U2OS cells transfected with PH-PLCD1-GFP are acquired using a Zeiss Axio Observer Z.1 spinning disk confocal microscope at 100× magnification in a temperature-controlled chamber maintained at 37 °C with 5% CO2 and ambient O2 and humidity following the steps described below.
Notes:
1. While not strictly required, a spinning disc confocal microscope was used for live cell Z-stack imaging due to its ability to capture rapid transient dynamics through faster acquisition and its lower phototoxicity.
2. By using the lowest laser power necessary to acquire high-quality images, along with a spinning disk confocal system, photobleaching was minimized and not observed under the conditions used.
3. Imaging was carried out over a period of approximately 10–20 min, during which pH was preserved by using CO2-buffered imaging medium. No replenishment of medium was required during the acquisition period as the imaging time was kept short and environmental parameters (e.g., temperature and CO2 levels) were well controlled.
1. Set up the parameters for image acquisition as follows: laser intensity at 20%, exposure at 65 m/s, and EM gain at 50. Select cells that are well defined and not in proximity to other cells within the microscope field.
Note: These settings can be used as a starting point and may require adjustment to optimize the signal to background ratio based on cell type, reporter expression, and microscope configuration (Figure 1).
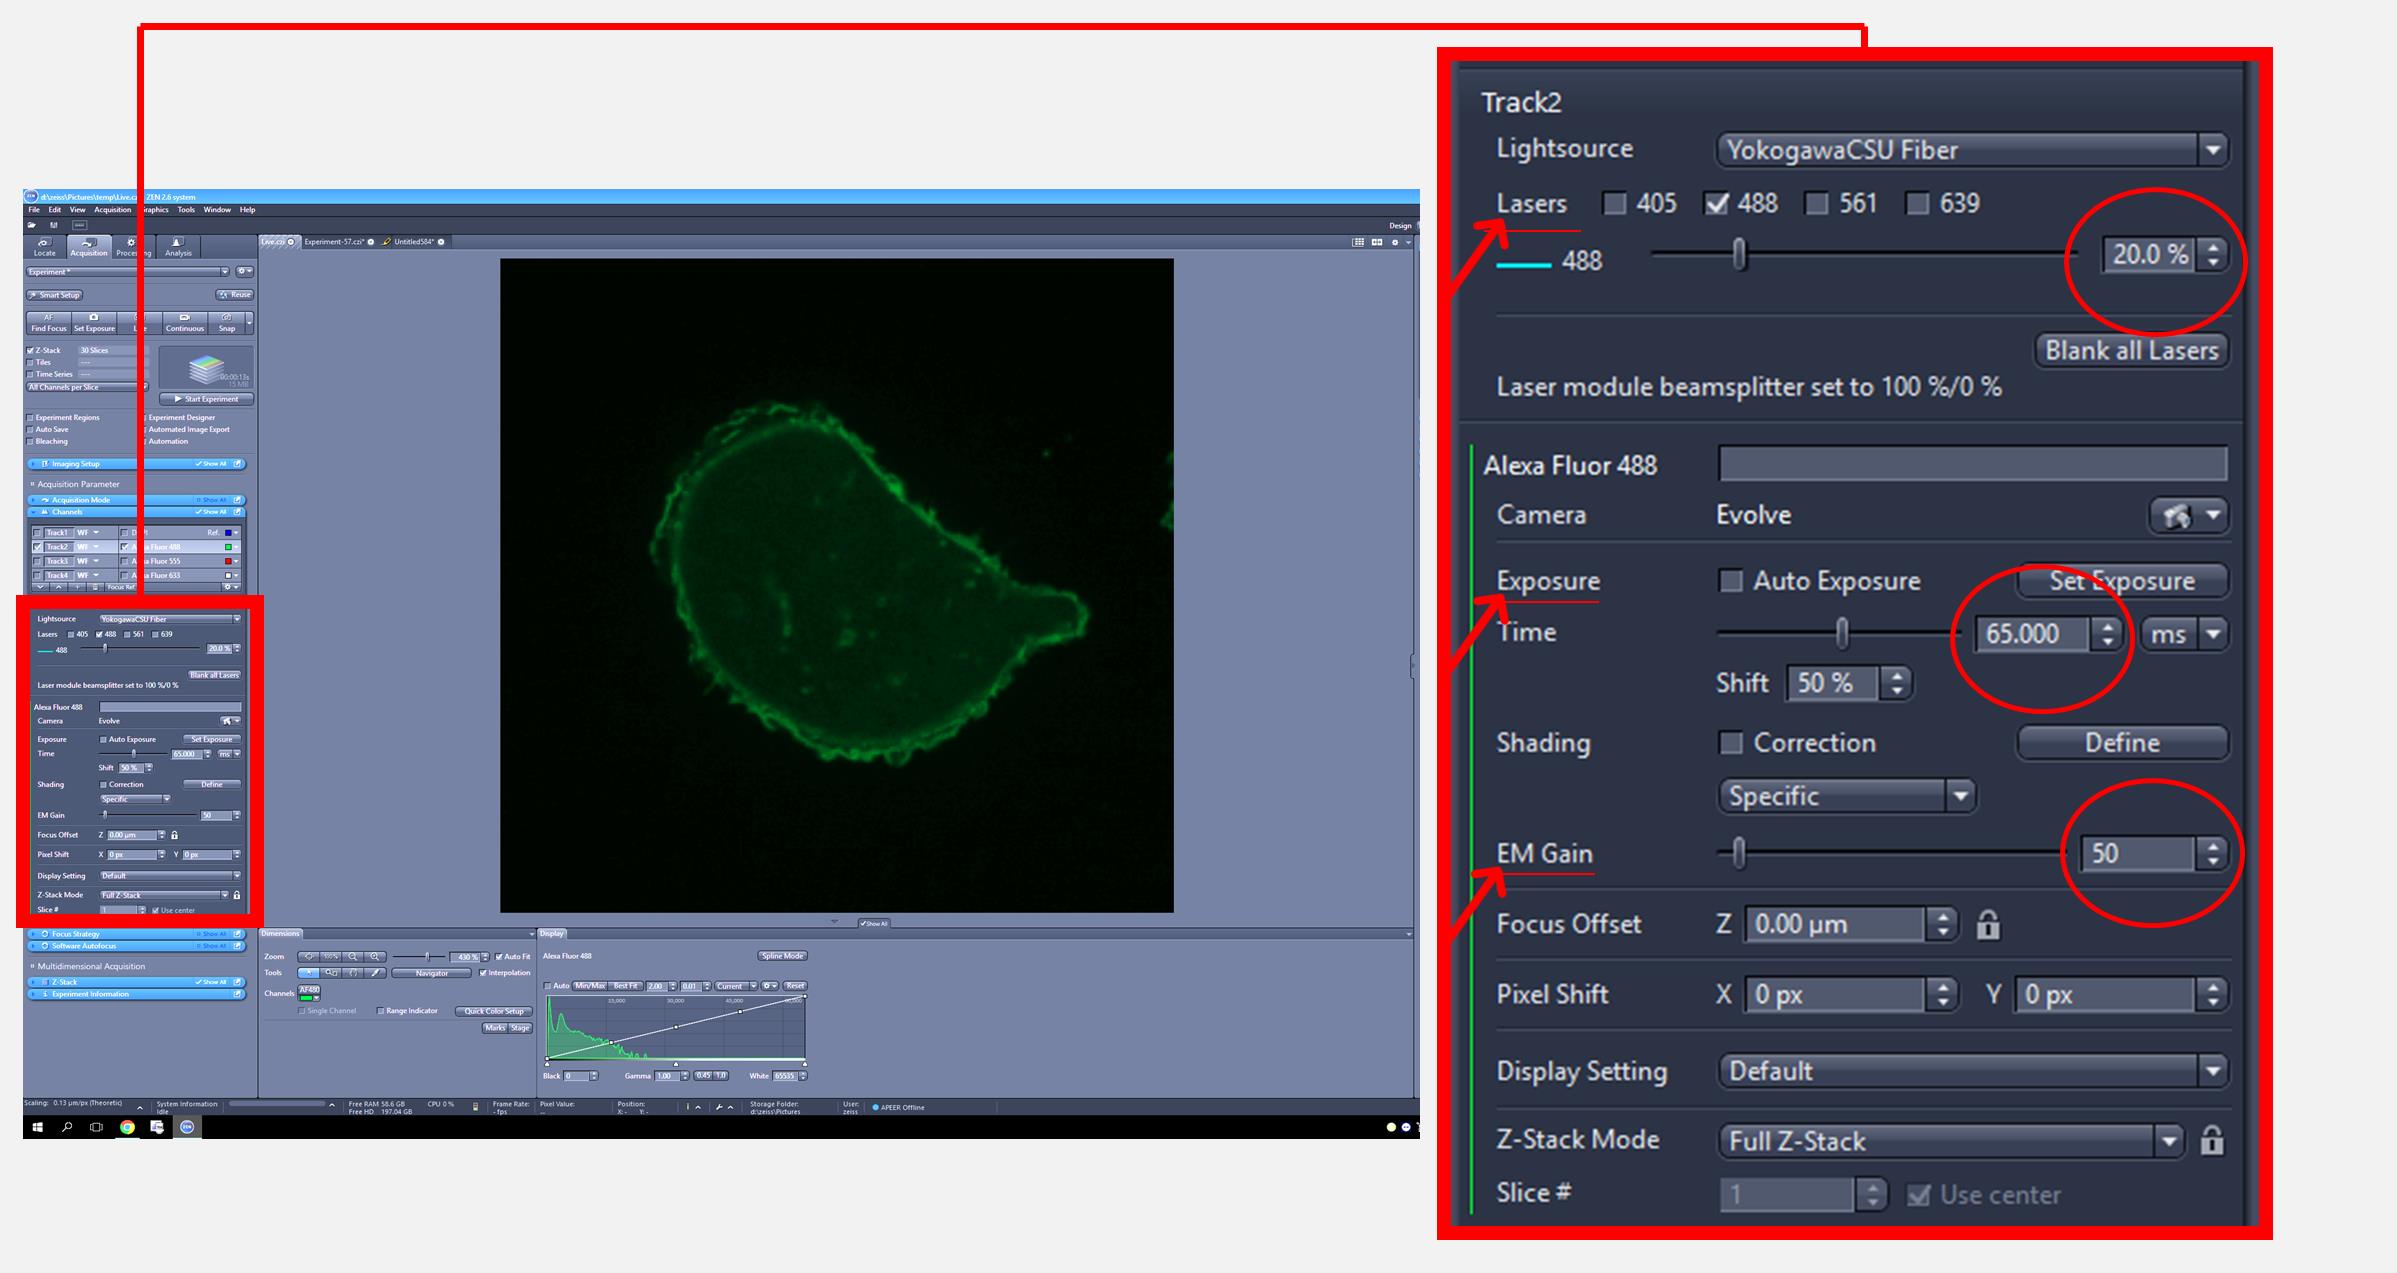
Figure 1. Zeiss imaging software interface for adjusting image acquisition settings. The full screen view (left) displays the overall interface, with a red square indicating the region that is magnified in the inset (right) to show laser intensity, exposure, and EM gain settings used for image acquisition.
2. Once a cell has been selected, acquire z-stack images using a 488 nm excitation wavelength and an emission filter at 517 nm while keeping a constant interval (0.36 μm) between each focal plane (Figure 2).
Note: Image acquisition may be carried out in a blinded manner to minimize bias.
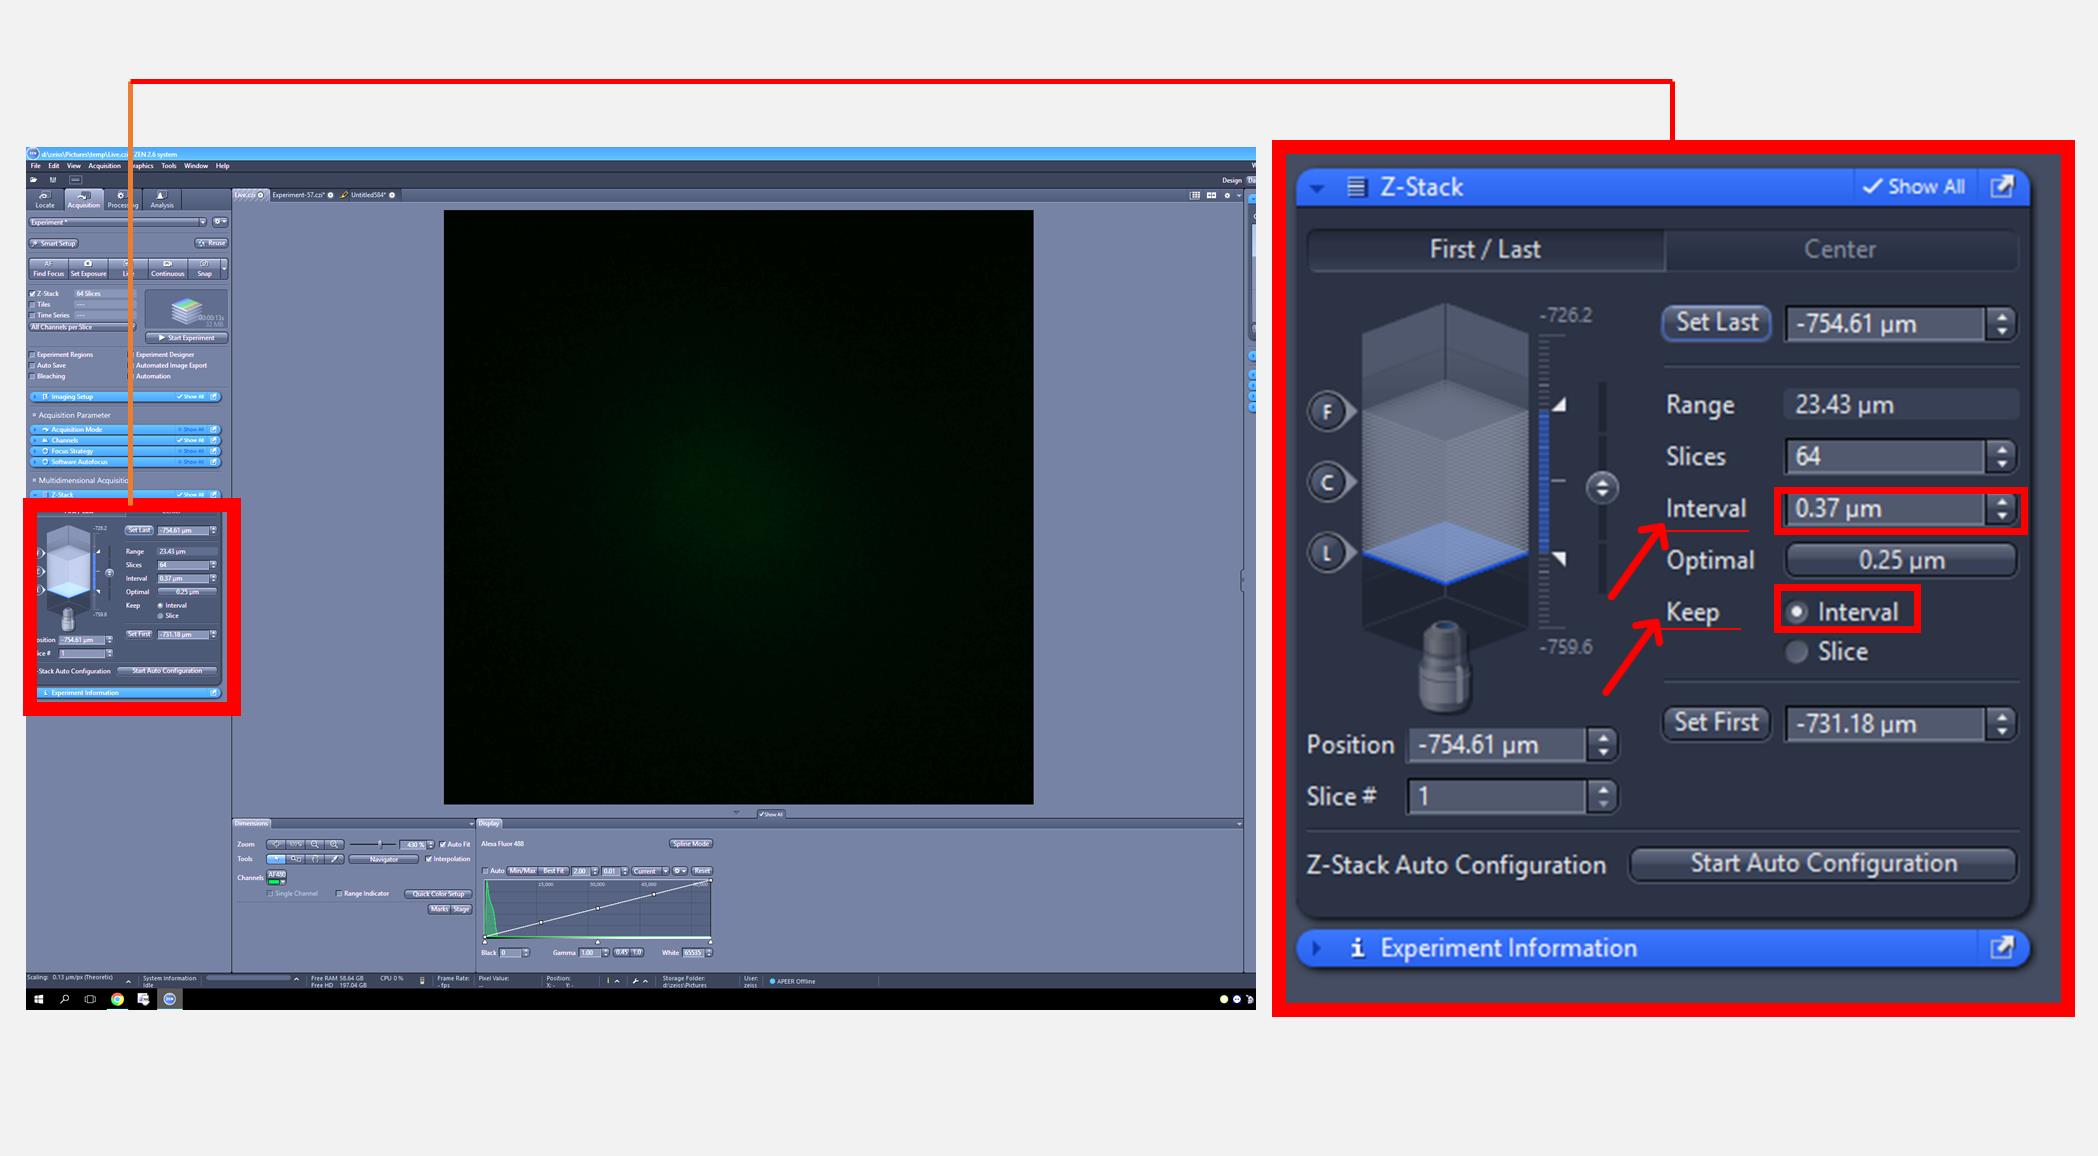
Figure 2. Zeiss imaging software interface for adjusting Z-stack image acquisition settings. The full screen view (left) displays the overall interface, with a red square indicating the region that is magnified in the inset (right) to show Z-stack image acquisition settings.
3. After acquiring the Z-stack image, display the image in orthogonal (ortho) mode, position the intersection point at the center of the cell, and create an image from the view (Figure 3).
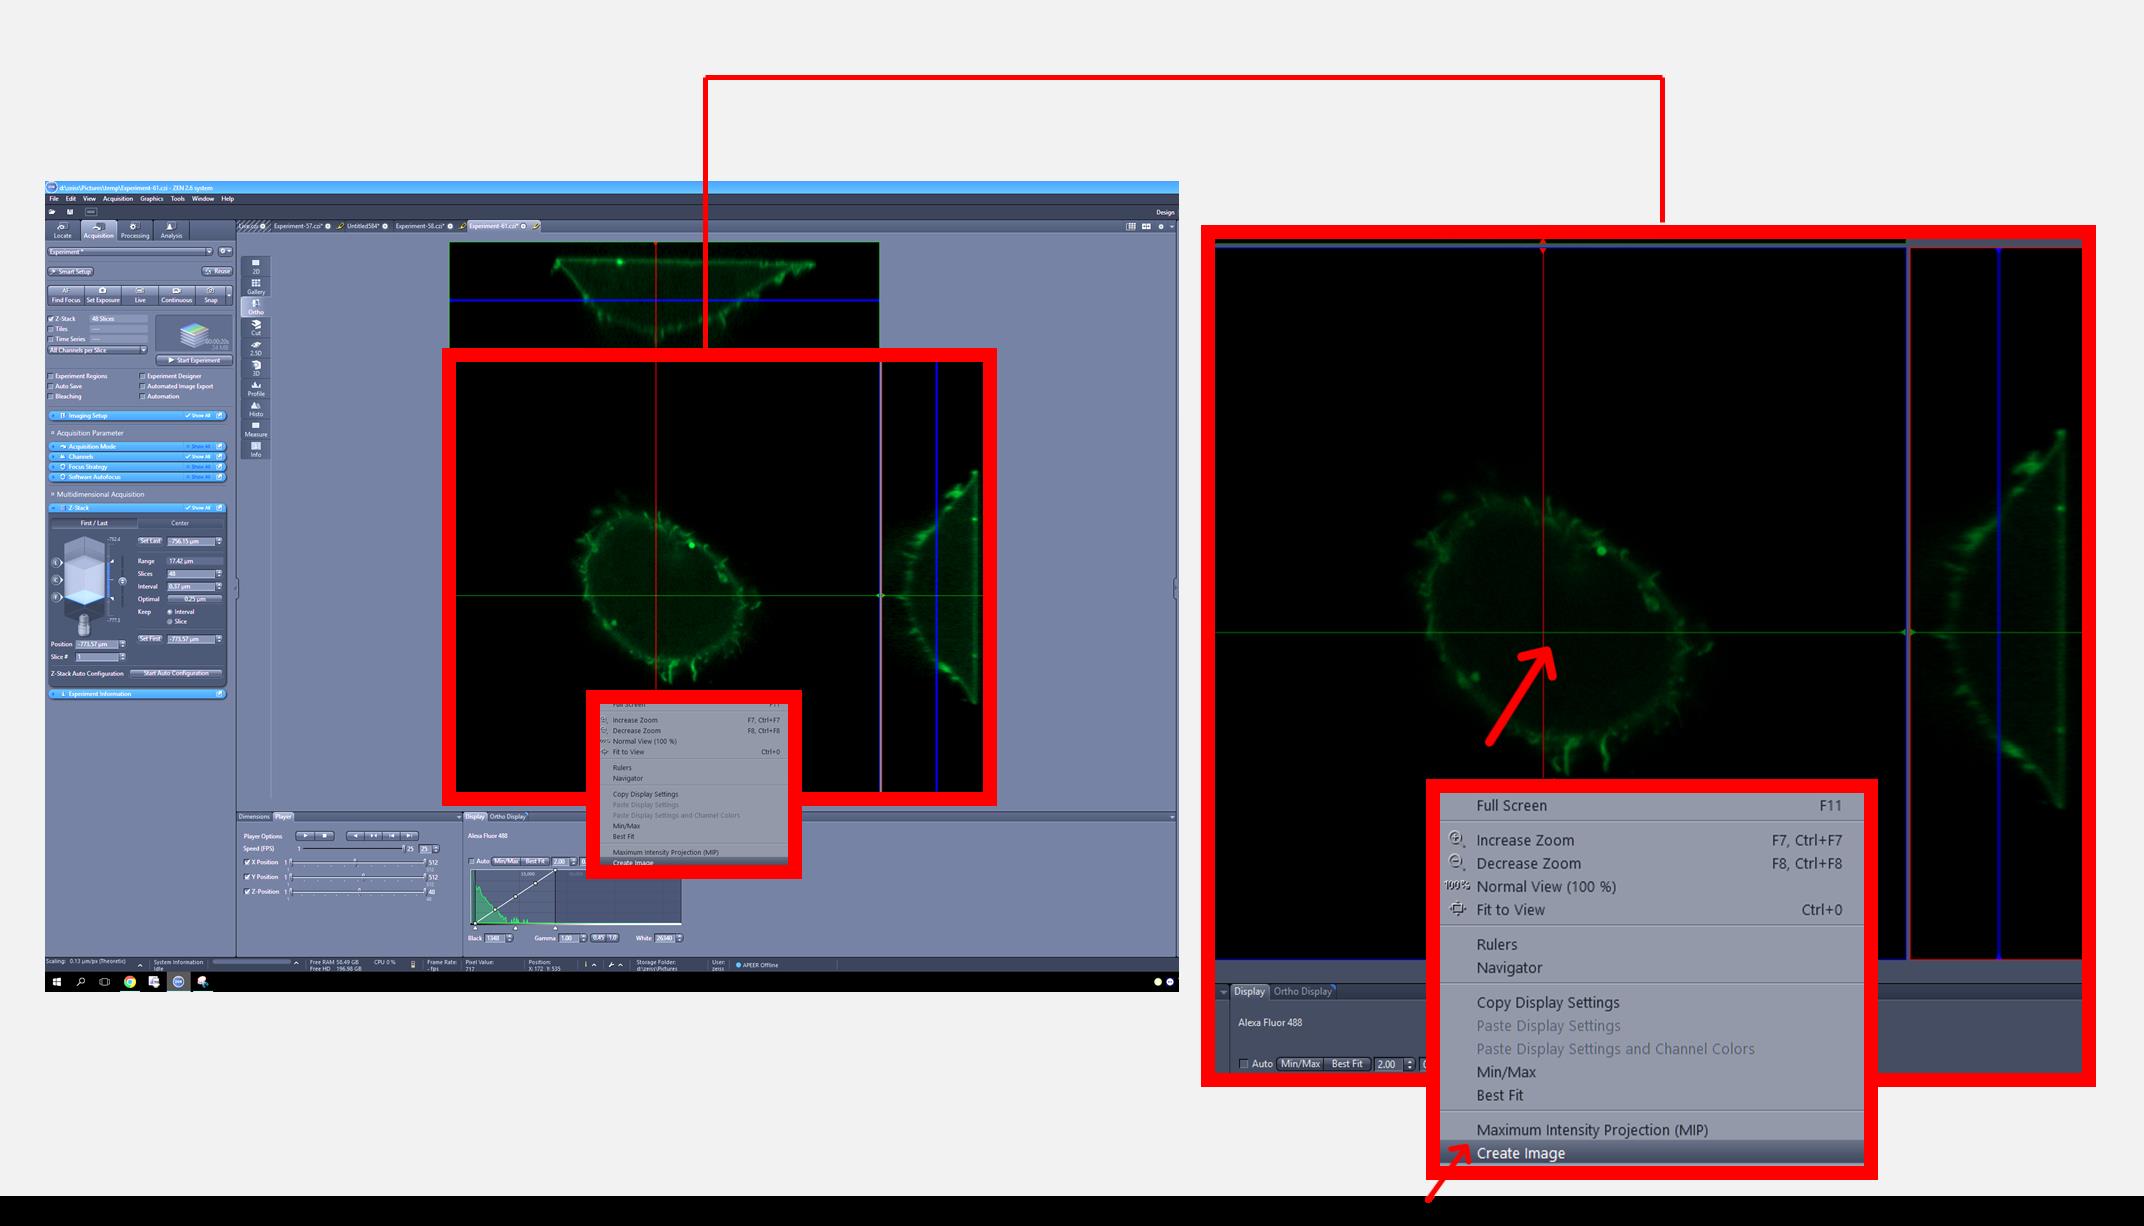
Figure 3. Zeiss imaging software interface for an orthogonal view of the cell generated from the Z-stack. The full screen view (left) displays the overall interface, with a red square indicating the region that is magnified in the inset (right) to show the intersection point at the center of the cell to generate an orthogonal view.
4. In the graphics section, uncheck the visibility option to hide the lines and save the image in TIFF format (Figure 4).
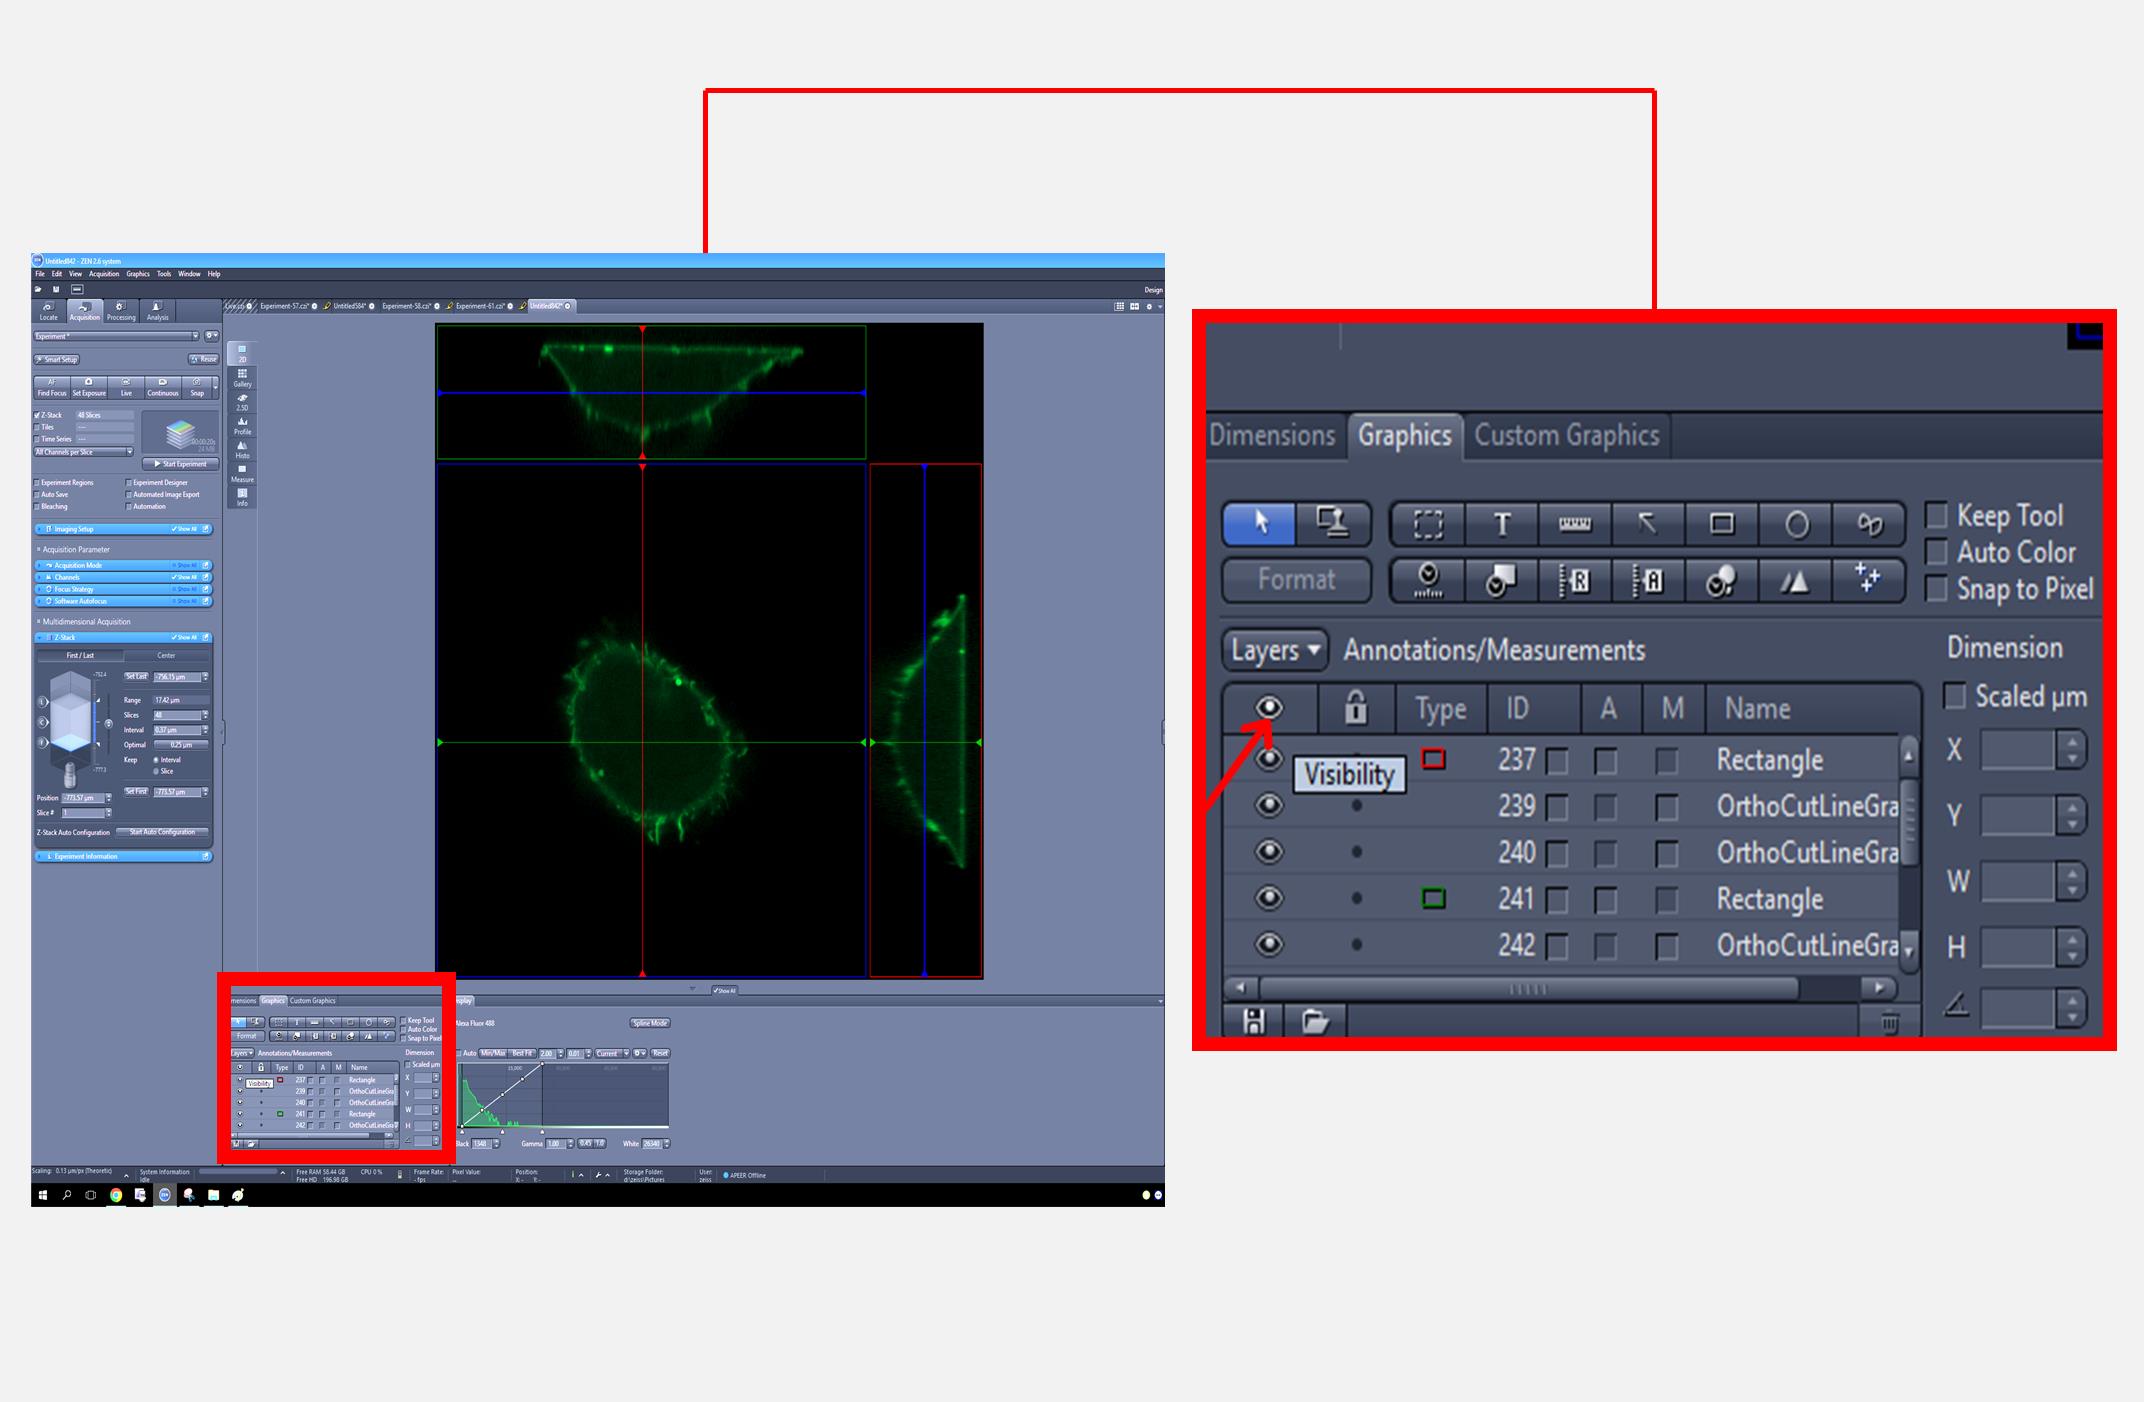
Figure 4. Zeiss imaging software interface for an orthogonal view of the cell generated from the Z-stack. The full screen view (left) displays the overall interface, with a red square indicating the region that is magnified in the inset (right) to demonstrate how to hide axis lines by unchecking the visibility option in the graphics section.
C. Quantification of the plasma membrane to cytosol ratio of PH-PLCD1-GFP
1. Open images in the FIJI ImageJ software and convert them to grayscale (8-bit or 16-bit).
Notes:
1. Quantification by FIJI may be carried out in a blinded manner to minimize bias.
2. If your image is too bright or too dark, you may need to adjust the contrast/brightness.
2. Go to the ROI Manager by clicking Analyze > Tools > ROI manager.
3. Select the rectangle tool from the Toolbar to draw the first square on the image.
Note: Due to variability in cell size across cell types, the dimensions of the rectangular ROI were not strictly prespecified. Instead, the ROI size was adjusted to ensure appropriate sampling of either cytosolic or membrane signal, while maintaining consistency in size across ROIs within the same imaging field and across the same experiment. The ROI was chosen to be small enough to focus on subcellular regions of interest, rather than encompassing the entire cell.
4. When the rectangle is in the desired position, click Add [t] in the ROI manager.
5. Enable show all on the ROI manager to view all saved ROIs.
6. Draw three equal squares on the dorsal plasma membrane (cell apex and immediately left and right) and another three identical squares below these in the cytosol, and three random squares outside the cell (background) (Figure 5).
Notes:
1. For the squares positioned immediately to the left and right of the apex, place the squares at locations that encompass most of the membrane within each square.
2. Membrane intensity was measured at the apical region of the cell to standardize the sampling location. While the GFP signal may vary along the membrane, consistent apical sampling ensured comparability across conditions.
3. A separate membrane marker was not used, as the PH-PLCd1-GFP reporter provides sufficient and specific plasma membrane labeling due to its selective binding to PI(4,5)P2.
7. Once the nine squares are added to the ROI manager, click measure in the ROI manager and export results (Figure 5).
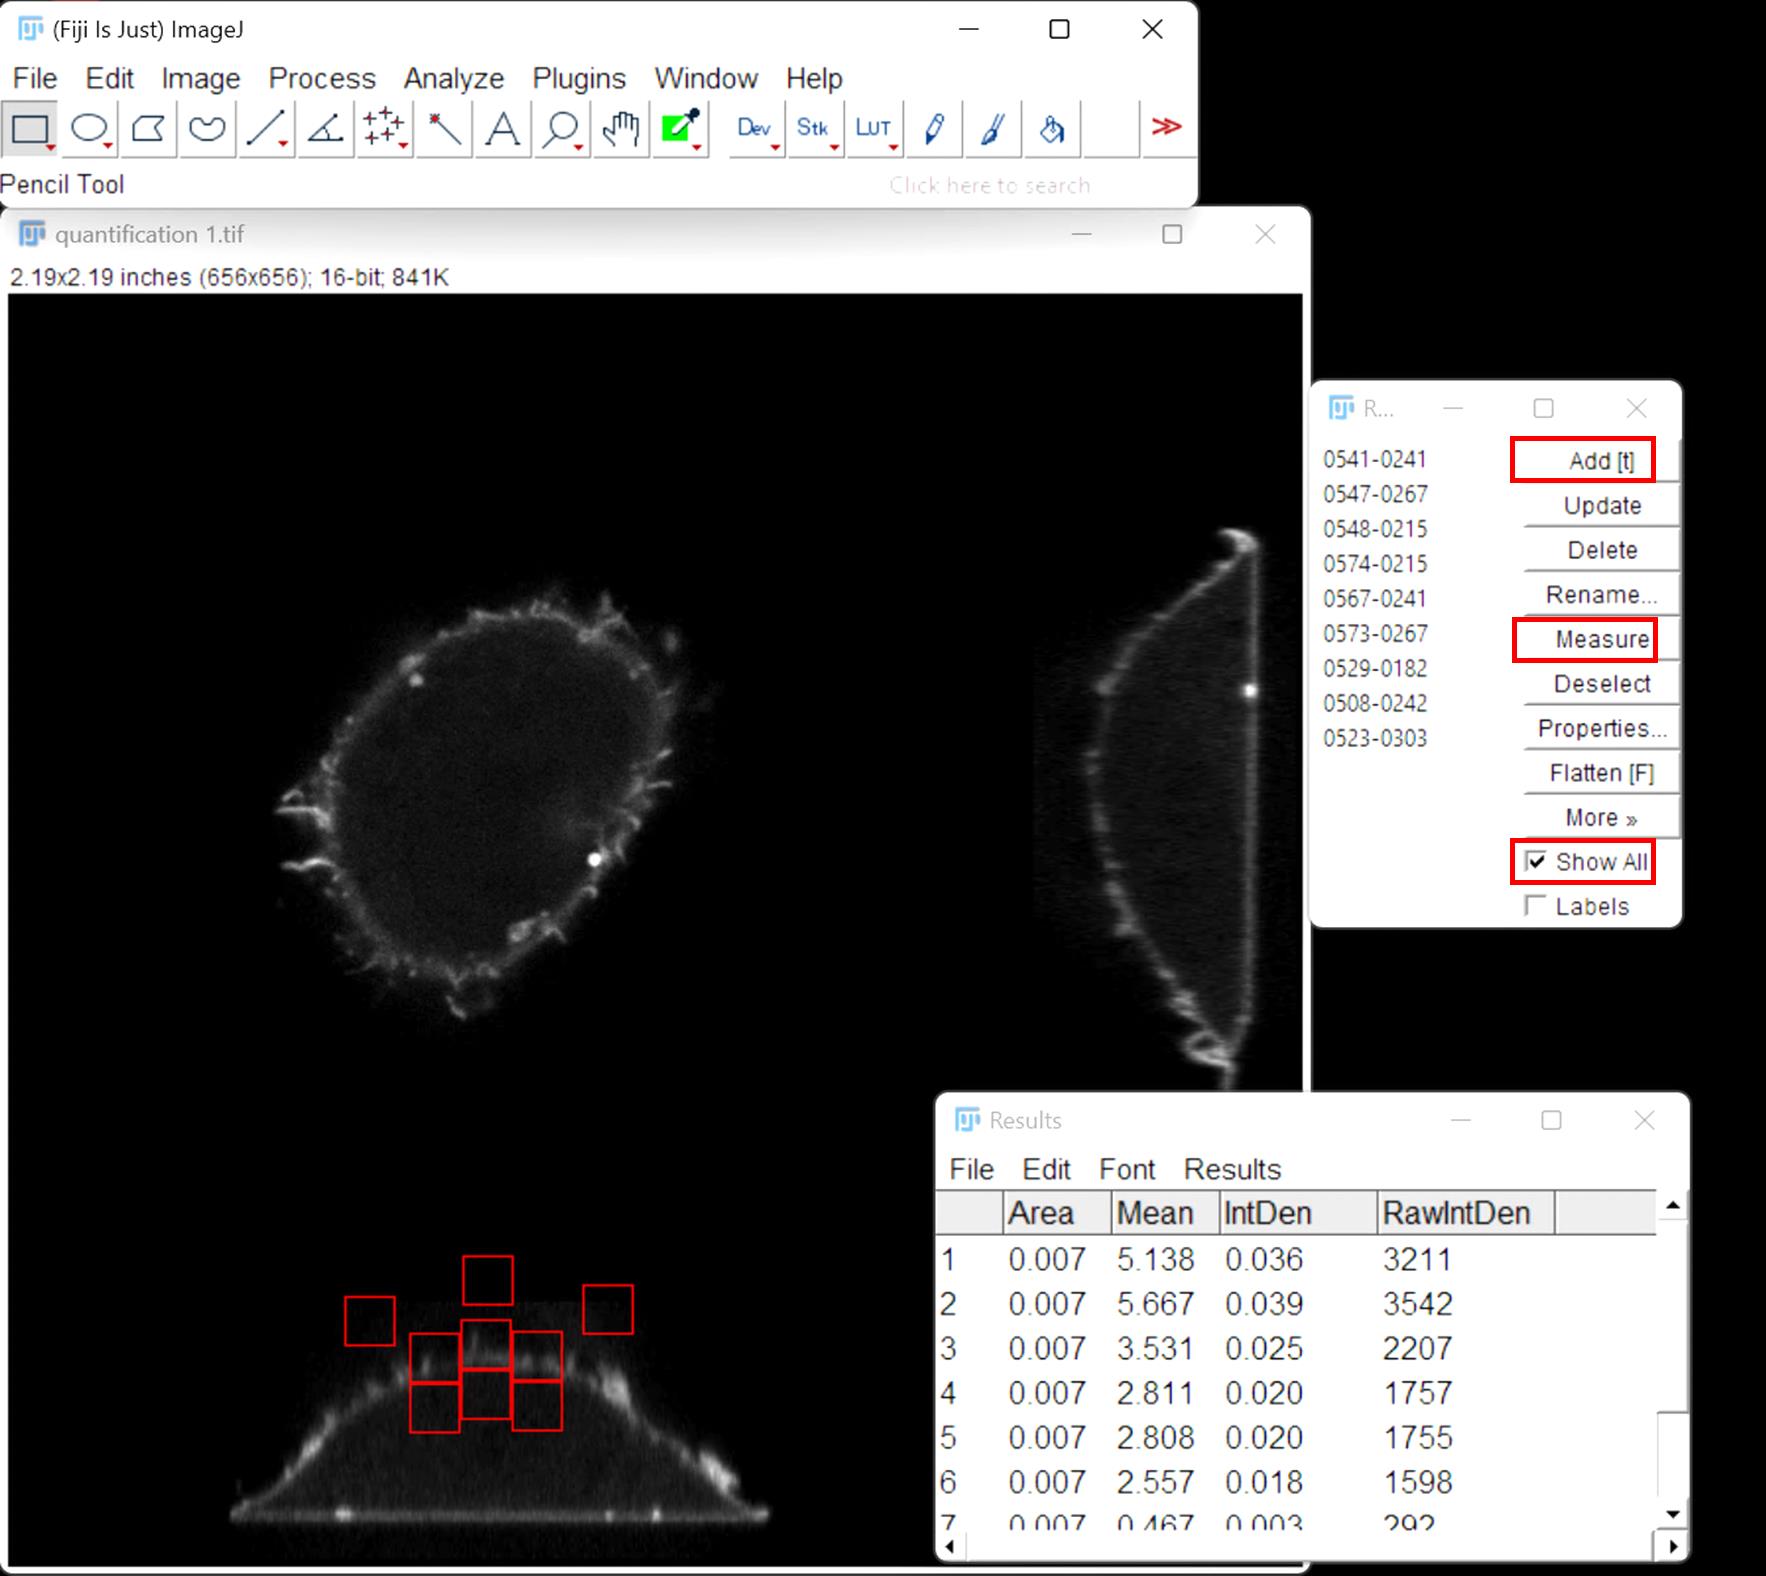
Figure 5. ImageJ interface showing placement of ROIs corresponding to the plasma membrane, cytosol, and background. Mean fluorescence intensities were measured within each ROI to calculate the plasma membrane to cytosol intensity ratio.
8. Calculate the mean intensity from the three background ROIs and subtract this value from each of the individual mean intensity measurements for the plasma membrane and cytosol.
9. Divide the mean intensity of each of the three squares on the dorsal plasma membrane (one on the apex and two immediately adjacent) by the mean intensity of the cytosolic ROI directly below it. The final plasma membrane to cytosol ratio of PH-PLCD1-GFP per cell is the average of three individual membrane to cytosol ratios. An Excel sheet with representative calculations is included in the supplementary materials (Supplementary file 1).
10. By following steps C1–9, the plasma membrane to cytosol ratio of PH-PLCD1-GFP was quantified for two images to demonstrate the quantification approach described in this protocol (Figure 6).
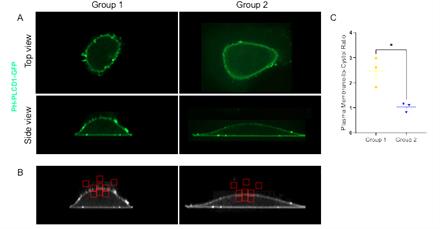
Figure 6. Quantification of PH-PLCD1-GFP localization. A. acquired microscopy images of U2OS cells transfected with PH-PLCD1-GFP. B. Processed images from panel A using FIJI/ImageJ following steps outlined in section C to quantify plasma membrane to cystol fluorescence intensity ratio. C. Quantification dorsal plasma membrane: cytoplasmic PH-PLCD1-GFP ratio. Bars show mean± SEM. Statistical significance was determined using t-test, *P < 0.05.
Data analysis
Data analysis is performed to study the subcellular localization of PI(4,5)P2 by quantifying the plasma membrane to cytosol ratio of PH-PLCD1-GFP. The steps for ratio calculation are outlined in section C and illustrated in the supplementary Excel sheet. Quantification is performed for 10–20 cells for each experimental group from three independent experiments. (Note: Figure 6 includes data from a single cell per group and is intended for illustrative purposes only.) For comparison of two groups, a two-tailed t-test is used. Comparison involving more than two groups is performed using one-way ANOVA followed by Tukey’s multiple comparison test. A threshold of P < 0.05 was used to determine statistical significance. Results may be communicated through representative images together with quantification of the PH-PLCD1-GFP plasma membrane to cytosol fluorescence intensity ratio (Figure 6A, C). Quantitative analysis may be shown as a bar graph with a scatter plot or scatter blot with a bar indicating the mean. Statistical analysis and graph generation were performed using GraphPad Prism.
Validation of protocol
This protocol or parts of it has been used and validated in the following research article:
Tavasoli et al. [23]. Defects in integrin complex formation promote CHKB-mediated muscular dystrophy. Life Science Alliance (Figure 4A–C and G–I).
General notes and troubleshooting
General notes
1. Seeding density and DNA:Lipofectamine/DNA/cell ratio may require further optimization if a different cell type is used.
Troubleshooting
Problem 1: Transfection efficiency may vary dramatically across cells.
Possible cause: Following our steps for U2OS, the transfection efficacy was uniform across cells, and lipofectamine toxicity was not observed. However, transfection efficiency differences and lipofectamine toxicity are not uncommon in cells, which may result in variability in signal intensity across cells.
Solution: 1: Transfection experiments should be optimized for the cell line under study for optimal plasmid uptake and minimal toxicity. A helpful reference provided by Thermo Fisher Scientific can be used as a starting point for transfection optimization (https://www.thermofisher.com/ca/en/home/references/gibco-cell-culture-basics/transfection-basics/applications/plasmid-transfection/optimizing-plasmid-dna-transfection.html). Solution 2: Given that a ratio of signal between two areas (plasma membrane vs. intracellular) within the same image field is to be calculated, imaging settings can be adjusted for each field to increase or decrease the signal, as these adjustments should not impact the relative ratio.
Problem 2: GFP PH-PLCD1 reporter does not show expected membrane localization or displays unexpected intracellular distribution.
Possible cause: The reporter may not be binding specifically to PI(4,5)P2 due to suboptimal experimental conditions. Alternatively, the reporter itself may not be functioning properly.
Solution: To verify that the reporter is working as intended, several controls and validation steps should be included:
1. Positive control: Co-transfect the reporter with a known PI(4,5)P2-stimulating construct (e.g., mCherry- PIP5K1α) or activate pathways that elevate PI(4,5)P2 (e.g., through GPCR or RTK activation) [24,25]. This should enhance membrane localization of the reporter. When using signaling pathway activation, it is a good idea to ensure that the selected pathway is supported by the literature to be expressed or functional in the studied cell line.
2. Negative control: Use a mutant PH domain that cannot bind PI(4,5)P2 or apply conditions that deplete PI(4,5)P2 (e.g., overexpression of phosphoinositide phosphatases) [26,27]. This should abolish or reduce PI(4,5)P2 membrane localization to confirm the specificity of the (WT) PH domain construct.
3. Membrane enrichment quantification: Measure membrane-to-cytosol fluorescence intensity ratios to assess reporter enrichment. Consistent membrane localization in control conditions supports proper reporter functionality.
Problem 3: Photobleaching observed during imaging.
Cause: High laser power or prolonged exposure times during image acquisition.
Solution: Use the lowest laser power necessary for acquiring high-quality images. Spinning disk confocal systems are preferred as they reduce phototoxicity and minimize photobleaching due to rapid image acquisition. Shorten exposure times and avoid repeatedly imaging the same field to reduce fluorescence loss.
Problem 4: Cells do not achieve optimal confluency before transfection.
Cause: Inconsistent seeding or over- or under-seeding of cells.
Solution: Seed cells at the recommended density (as outlined in the protocol) and allow them to adhere for at least 16–24 h prior to transfection. Ensure even distribution of cells when seeding to avoid regions of over-confluency, which can affect transfection efficiency and membrane dynamics.
Problem 5: Inconsistent live-cell imaging conditions during acquisition.
Cause: Fluctuations in temperature, CO2, or humidity within the live cell chamber.
Solution: Ensure that the live cell imaging chamber is pre-equilibrated to 37 °C with 5% CO2 and that humidity levels are maintained. Avoid removing the dish from the incubator for extended periods to prevent changes in cell culture conditions. Always monitor environmental settings throughout imaging.
Problem 6: Long quantification times for large numbers of images.
Cause: Manual quantification of large datasets can be time-consuming.
Solution: Consider using ImageJ/Fiji macros or batch processing tools to streamline quantification. Pre-programmed macros (e.g., using the ROI Manager) can automatically process multiple images and reduce manual effort, especially for high-throughput applications.
Supplementary information
The following supporting information can be downloaded here:
1. Supplementary file 1. Representative calculations
Acknowledgments
M.A., C.R.M., and M.T. designed the experiments. M.A. and M.T. performed the experiments and collected and analyzed the data. M.A. wrote the first draft of the paper and prepared the figures. M.T. and C.R.M. supervised the project, guided, wrote, and reviewed the manuscript. This work was funded by the Canadian Institutes of Health Research operating grant (SOP-159230). This protocol is used in Life Science Alliance 7, e202301956 (2024), DOI: 10.26508/lsa.202301956.
Competing interests
The authors declare no conflict of interest.
References
- Yang, Y., Lee, M. and Fairn, G. D. (2018). Phospholipid subcellular localization and dynamics. J Biol Chem. 293(17): 6230–6240. https://doi.org/10.1074/jbc.r117.000582
- Posor, Y., Jang, W. and Haucke, V. (2022). Phosphoinositides as membrane organizers. Nat Rev Mol Cell Biol. 23(12): 797–816. https://doi.org/10.1038/s41580-022-00490-x
- Harlan, J. E., Hajduk, P. J., Yoon, H. S. and Fesik, S. W. (1994). Pleckstrin homology domains bind to phosphatidylinositol-4,5-bisphosphate. Nature. 371(6493): 168–170. https://doi.org/10.1038/371168a0
- Stauffer, T. P., Ahn, S. and Meyer, T. (1998). Receptor-induced transient reduction in plasma membrane PtdIns(4,5)P2 concentration monitored in living cells. Curr Biol. 8(6): 343–346. https://doi.org/10.1016/s0960-9822(98)70135-6
- Yang, Y., Park, M., Maekawa, M. and Fairn, G. D. (2019). Enforced expression of phosphatidylinositol 4-phosphate 5-kinase homolog alters PtdIns(4,5)P2 distribution and the localization of small G-proteins. Sci Rep. 9(1): e1038/s41598–019–51272–z. https://doi.org/10.1038/s41598-019-51272-z
- Al-Momany, A., Li, L., Alexander, R. T. and Ballermann, B. (2014). Clustered phosphatidylinositol 4,5 bisphosphate accumulation and ezrin phosphorylation in response to CLIC5A. J Cell Sci. 127(Pt 24): e147744. https://doi.org/10.1242/jcs.147744
- Chinthalapudi, K., Patil, D. N., Rangarajan, E. S., Rader, C. and Izard, T. (2015). Lipid-Directed Vinculin Dimerization. Biochemistry. 54(17): 2758–2768. https://doi.org/10.1021/acs.biochem.5b00015
- Chinthalapudi, K., Rangarajan, E. S., Patil, D. N., George, E. M., Brown, D. T. and Izard, T. (2014). Lipid binding promotes oligomerization and focal adhesion activity of vinculin. J Cell Biol. 207(5): 643–656. https://doi.org/10.1083/jcb.201404128
- Lu, F., Zhu, L., Bromberger, T., Yang, J., Yang, Q., Liu, J., Plow, E. F., Moser, M. and Qin, J. (2022). Mechanism of integrin activation by talin and its cooperation with kindlin. Nat Commun. 13(1): e1038/s41467–022–30117–w. https://doi.org/10.1038/s41467-022-30117-w
- Saltel, F., Mortier, E., Hytönen, V. P., Jacquier, M. C., Zimmermann, P., Vogel, V., Liu, W. and Wehrle-Haller, B. (2009). New PI(4,5)P2- and membrane proximal integrin–binding motifs in the talin head control β3-integrin clustering. J Cell Biol. 187(5): 715–731. https://doi.org/10.1083/jcb.200908134
- Tavasoli, M. and McMaster, C. R. (2024). Defects in integrin complex formation promoteCHKB-mediated muscular dystrophy. Life Sci Alliance. 7(8): e202301956. https://doi.org/10.26508/lsa.202301956
- Arige, V. and Yule, D. I. (2024). PIP2 primes IP3 receptor activity: It takes at least three IP3s to open!. Cell Calcium. 124: 102970. https://doi.org/10.1016/j.ceca.2024.102970
- Kolczynska, K., Loza-Valdes, A., Hawro, I. and Sumara, G. (2020). Diacylglycerol-evoked activation of PKC and PKD isoforms in regulation of glucose and lipid metabolism: a review. Lipids Health Dis. 19(1): 113. https://doi.org/10.1186/s12944-020-01286-8
- Staiano, L., De Leo, M. G., Persico, M. and De Matteis, M. A. (2015). Mendelian disorders of PI metabolizing enzymes. Biochim Biophys Acta Mol Cell Biol Lipids. 1851(6): 867–881. https://doi.org/10.1016/j.bbalip.2014.12.001
- Tavasoli, M., Lahire, S., Sokolenko, S., Novorolsky, R., Reid, S. A., Lefsay, A., Otley, M. O. C., Uaesoontrachoon, K., Rowsell, J., Srinivassane, S., et al. (2022). Mechanism of action and therapeutic route for a muscular dystrophy caused by a genetic defect in lipid metabolism. Nat Commun. 13(1): 1559. https://doi.org/10.1038/s41467-022-29270-z
- Tiosano, D., Baris, H. N., Chen, A., Hitzert, M. M., Schueler, M., Gulluni, F., Wiesener, A., Bergua, A., Mory, A., Copeland, B., et al. (2019). Mutations in PIK3C2A cause syndromic short stature, skeletal abnormalities, and cataracts associated with ciliary dysfunction. PLos Genet. 15(4): e1008088. https://doi.org/10.1371/journal.pgen.1008088
- Várnai, P. and Balla, T. (1998). Visualization of Phosphoinositides That Bind Pleckstrin Homology Domains: Calcium- and Agonist-induced Dynamic Changes and Relationship to Myo-[3H]inositol-labeled Phosphoinositide Pools. J Cell Biol. 143(2): 501–510. https://doi.org/10.1083/jcb.143.2.501
- Perrine-Walker, F. and Payne, J. (2022). Expression of the GFP-mammalian pleckstrin homology (PH) domain of the phospholipase C δ1 in Saccharomyces cerevisiae BY4741. Mol Biol Rep. 49(5): 4123–4128. https://doi.org/10.1007/s11033-022-07414-0
- Balla, T. (2013). Phosphoinositides: Tiny Lipids With Giant Impact on Cell Regulation. Physiol Rev. 93(3): 1019–1137. https://doi.org/10.1152/physrev.00028.2012
- Chakrabarti, P., Kolay, S., Yadav, S., Kumari, K., Nair, A., Trivedi, D. and Raghu, P. (2015). A dPIP5K Dependent Pool of Phosphatidylinositol 4,5 Bisphosphate (PIP2) Is Required for G-Protein Coupled Signal Transduction in Drosophila Photoreceptors. PLos Genet. 11(1): e1004948. https://doi.org/10.1371/journal.pgen.1004948
- Di Paolo, G. and De Camilli, P. (2006). Phosphoinositides in cell regulation and membrane dynamics. Nature. 443(7112): 651–657. https://doi.org/10.1038/nature05185
- Mandal, K. (2020). Review of PIP2 in Cellular Signaling, Functions and Diseases. Int J Mol Sci. 21(21): 8342. https://doi.org/10.3390/ijms21218342
- Tavasoli, M. and McMaster, C. R. (2024). Defects in integrin complex formation promoteCHKB-mediated muscular dystrophy. Life Sci Alliance. 7(8): e202301956. https://doi.org/10.26508/lsa.202301956
- Doughman, R. L., Firestone, A. J. and Anderson, R. A. (2003). Phosphatidylinositol Phosphate Kinases Put PI4,5P 2 in Its Place. J Membr Biol. 194(2): 77–89. https://doi.org/10.1007/s00232-003-2027-7
- Oude Weernink, P. A., Schmidt, M. and Jakobs, K. H. (2004). Regulation and cellular roles of phosphoinositide 5-kinases. Eur J Pharmacol. 500: 87–99. https://doi.org/10.1016/j.ejphar.2004.07.014
- Chang-Ileto, B., Frere, S. G., Chan, R. B., Voronov, S. V., Roux, A. and Di Paolo, G. (2011). Synaptojanin 1-Mediated PI(4,5)P2 Hydrolysis Is Modulated by Membrane Curvature and Facilitates Membrane Fission. Dev Cell. 20(2): 206–218. https://doi.org/10.1016/j.devcel.2010.12.008
- Yagisawa, H., Sakuma, K., Paterson, H. F., Cheung, R., Allen, V., Hirata, H., Watanabe, Y., Hirata, M., Williams, R. L., Katan, M., et al. (1998). Replacements of Single Basic Amino Acids in the Pleckstrin Homology Domain of Phospholipase C-δ1 Alter the Ligand Binding, Phospholipase Activity, and Interaction with the Plasma Membrane. J Biol Chem. 273(1): 417–424. https://doi.org/10.1074/jbc.273.1.417
Article Information
Publication history
Received: Mar 16, 2025
Accepted: May 8, 2025
Available online: May 23, 2025
Published: Jun 5, 2025
Copyright
© 2025 The Author(s); This is an open access article under the CC BY license (https://creativecommons.org/licenses/by/4.0/).
How to cite
Alkandari, M., McMaster, C. R. and Tavasoli, M. (2025). PI(4,5)P2 Imaging Using a GFP Reporter in Living Cells. Bio-protocol 15(11): e5336. DOI: 10.21769/BioProtoc.5336.
Category
Cell Biology > Cell structure > Plasma membrane
Biochemistry > Lipid > Membrane lipid
Cell Biology > Cell imaging > Fluorescence
Do you have any questions about this protocol?
Post your question to gather feedback from the community. We will also invite the authors of this article to respond.