- Protocols

- Articles and Issues
- For Authors
- About
- Become a Reviewer

In-house Fabrication of Nanoplastics of Tunable Composition and Application: Assessment of Bioelectric Changes in Primary Rat Lung Alveolar Epithelial Cell Monolayers Exposed to Nanoplastics
Published: Vol 15, Iss 11, Jun 5, 2025 DOI: 10.21769/BioProtoc.5329 Views: 2400
Reviewed by: Chiara AmbrogioAnonymous reviewer(s)
Original research article
The authors used this protocol in:
Dec 2007
Advertisement


Protocol Collections
Comprehensive collections of detailed, peer-reviewed protocols focusing on specific topics


Related protocols
Abstract
Plastic pollution presents a looming danger to the environment and virtually all life on planet Earth. Especially pernicious are nanoplastics (NPs), which are plastic fragments with dimensions ≤1 μm. Conventional detection methods are ineffective for NPs, while their high specific surface area renders them efficient carriers of toxic substances; additionally, they may even be inherently toxic. Although NP waste chiefly arises from environmental weathering of larger plastic fragments, most published studies employed manufactured pristine NPs of uniform size and shape. Furthermore, almost all NP effects were studied using polystyrene (PS) as a convenient model material, despite PS accounting for <6% of all plastic pollution. There is thus an urgent need to expand investigations of environmental NP pollution and effects on biota. The present work provides a comprehensive roadmap for studying the effects of “real-world” NP pollution on living systems, using, for example, lung alveolar epithelial cells on which such NPs deposit by breathing ambient air. Herein, we describe detailed in-house methods to fabricate various NPs that are weathered with UV light and O3 gas exposure to more closely mimic real environmental NPs. We also illustrate a simple and straightforward bioelectrical method for assessing passive and active ion transport properties of primary rat lung alveolar epithelial cell monolayers as a model for the distal mammalian lung exposed to one of the generated NPs. This protocol allows researchers to rapidly and more accurately assess the biological impact of various simulated environmental NPs on a vulnerable air–blood barrier in the lung.
Key features
• Many simulated weathered environmental NPs can be produced at high concentrations (up to 120 mg/mL) and yields (up to 12 mg/g bulk plastic).
• Any plastic waste can be “nano-sized” with this protocol and then studied for impacts on active and passive ion transport properties of cell monolayer models.
• Methods described herein are very relevant for studying environmental pollution effects, since NPs are found in many different shapes, sizes, and compositions.
• NP weathering and generation methods do not require any expensive or specialty lab instruments.
Keywords: In-house fabrication of weathered nanoplasticsGraphical overview
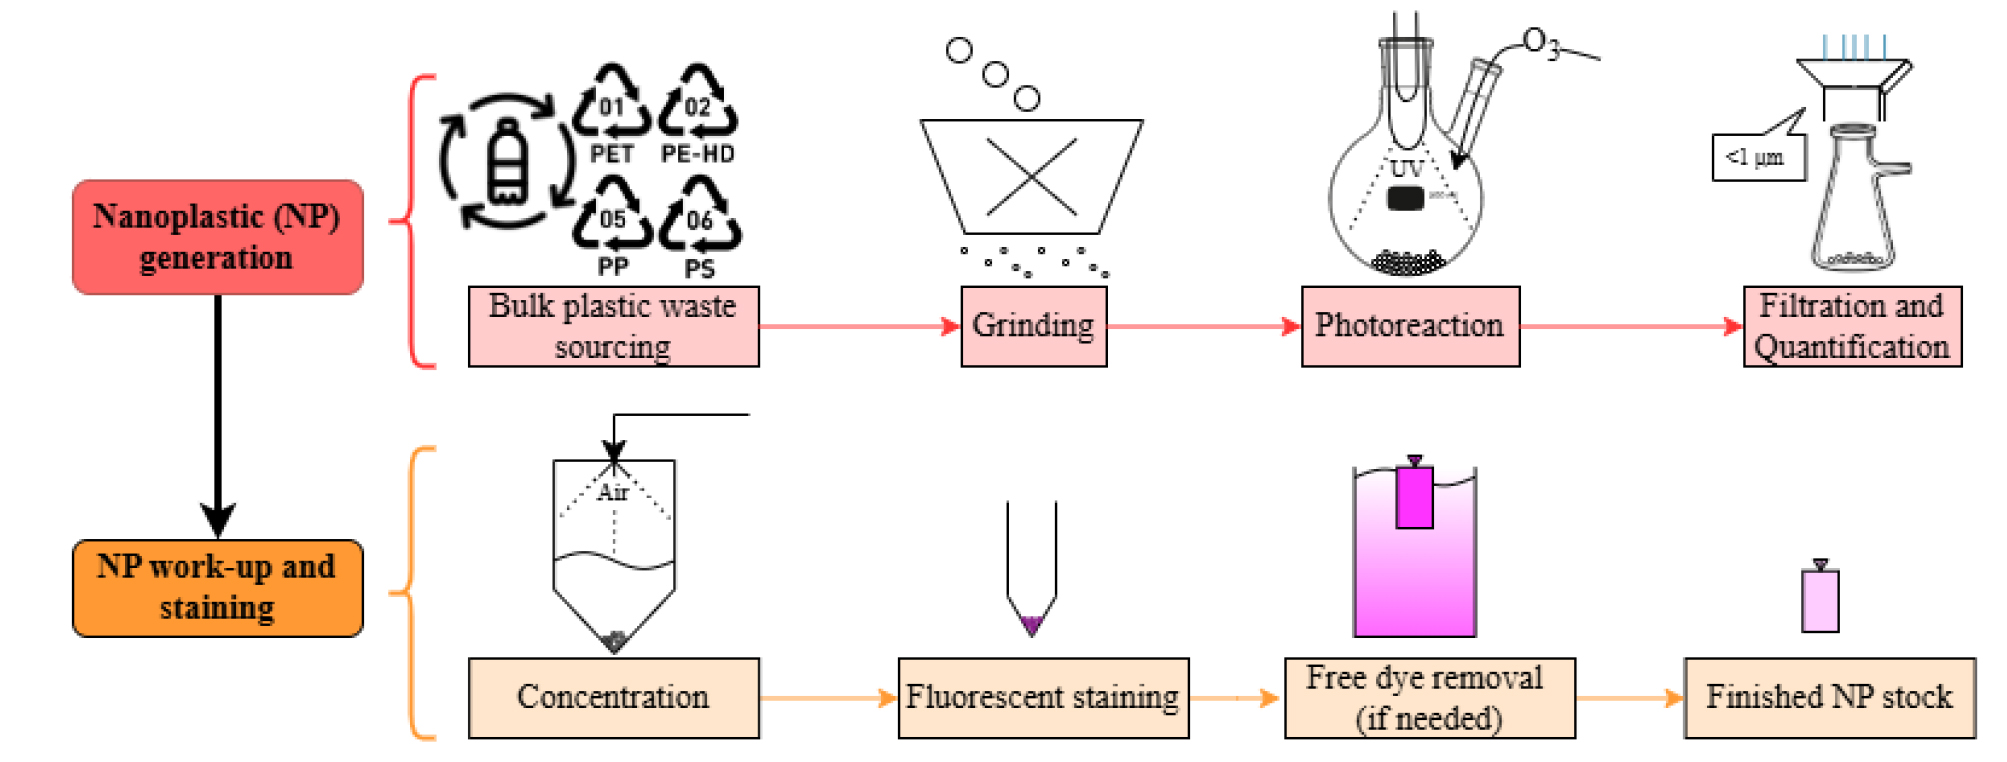
Graphical overview for in-house fabrication of nanoplastics (NP) 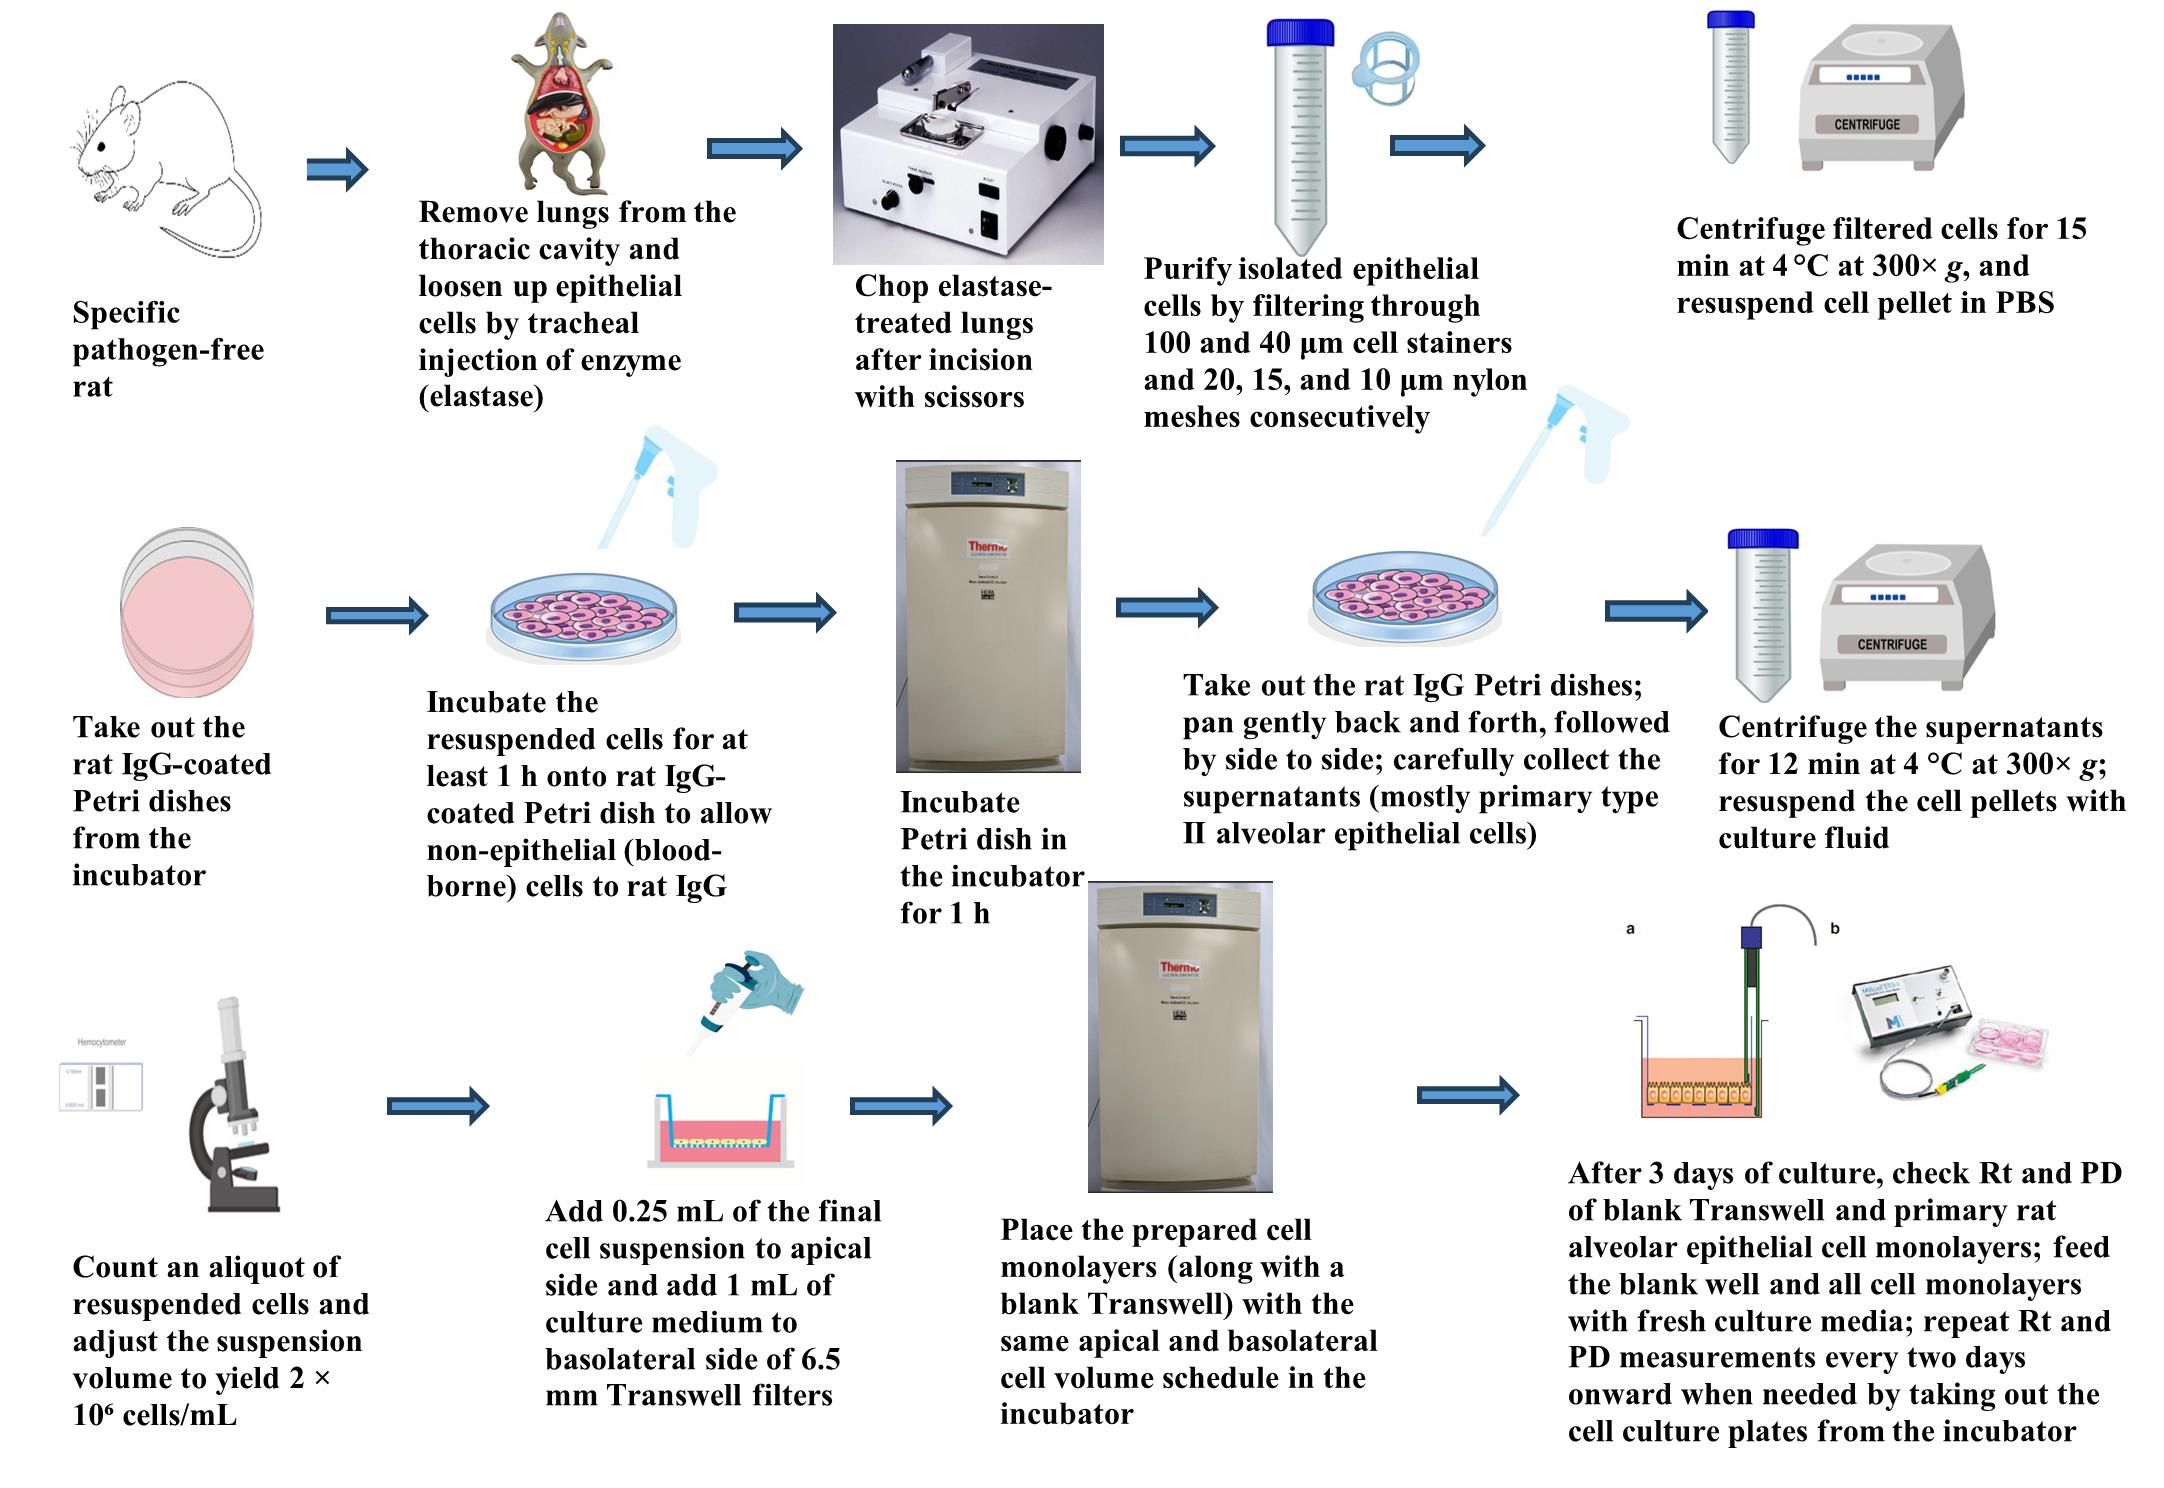
Graphical overview for primary culture of rat alveolar epithelial cells 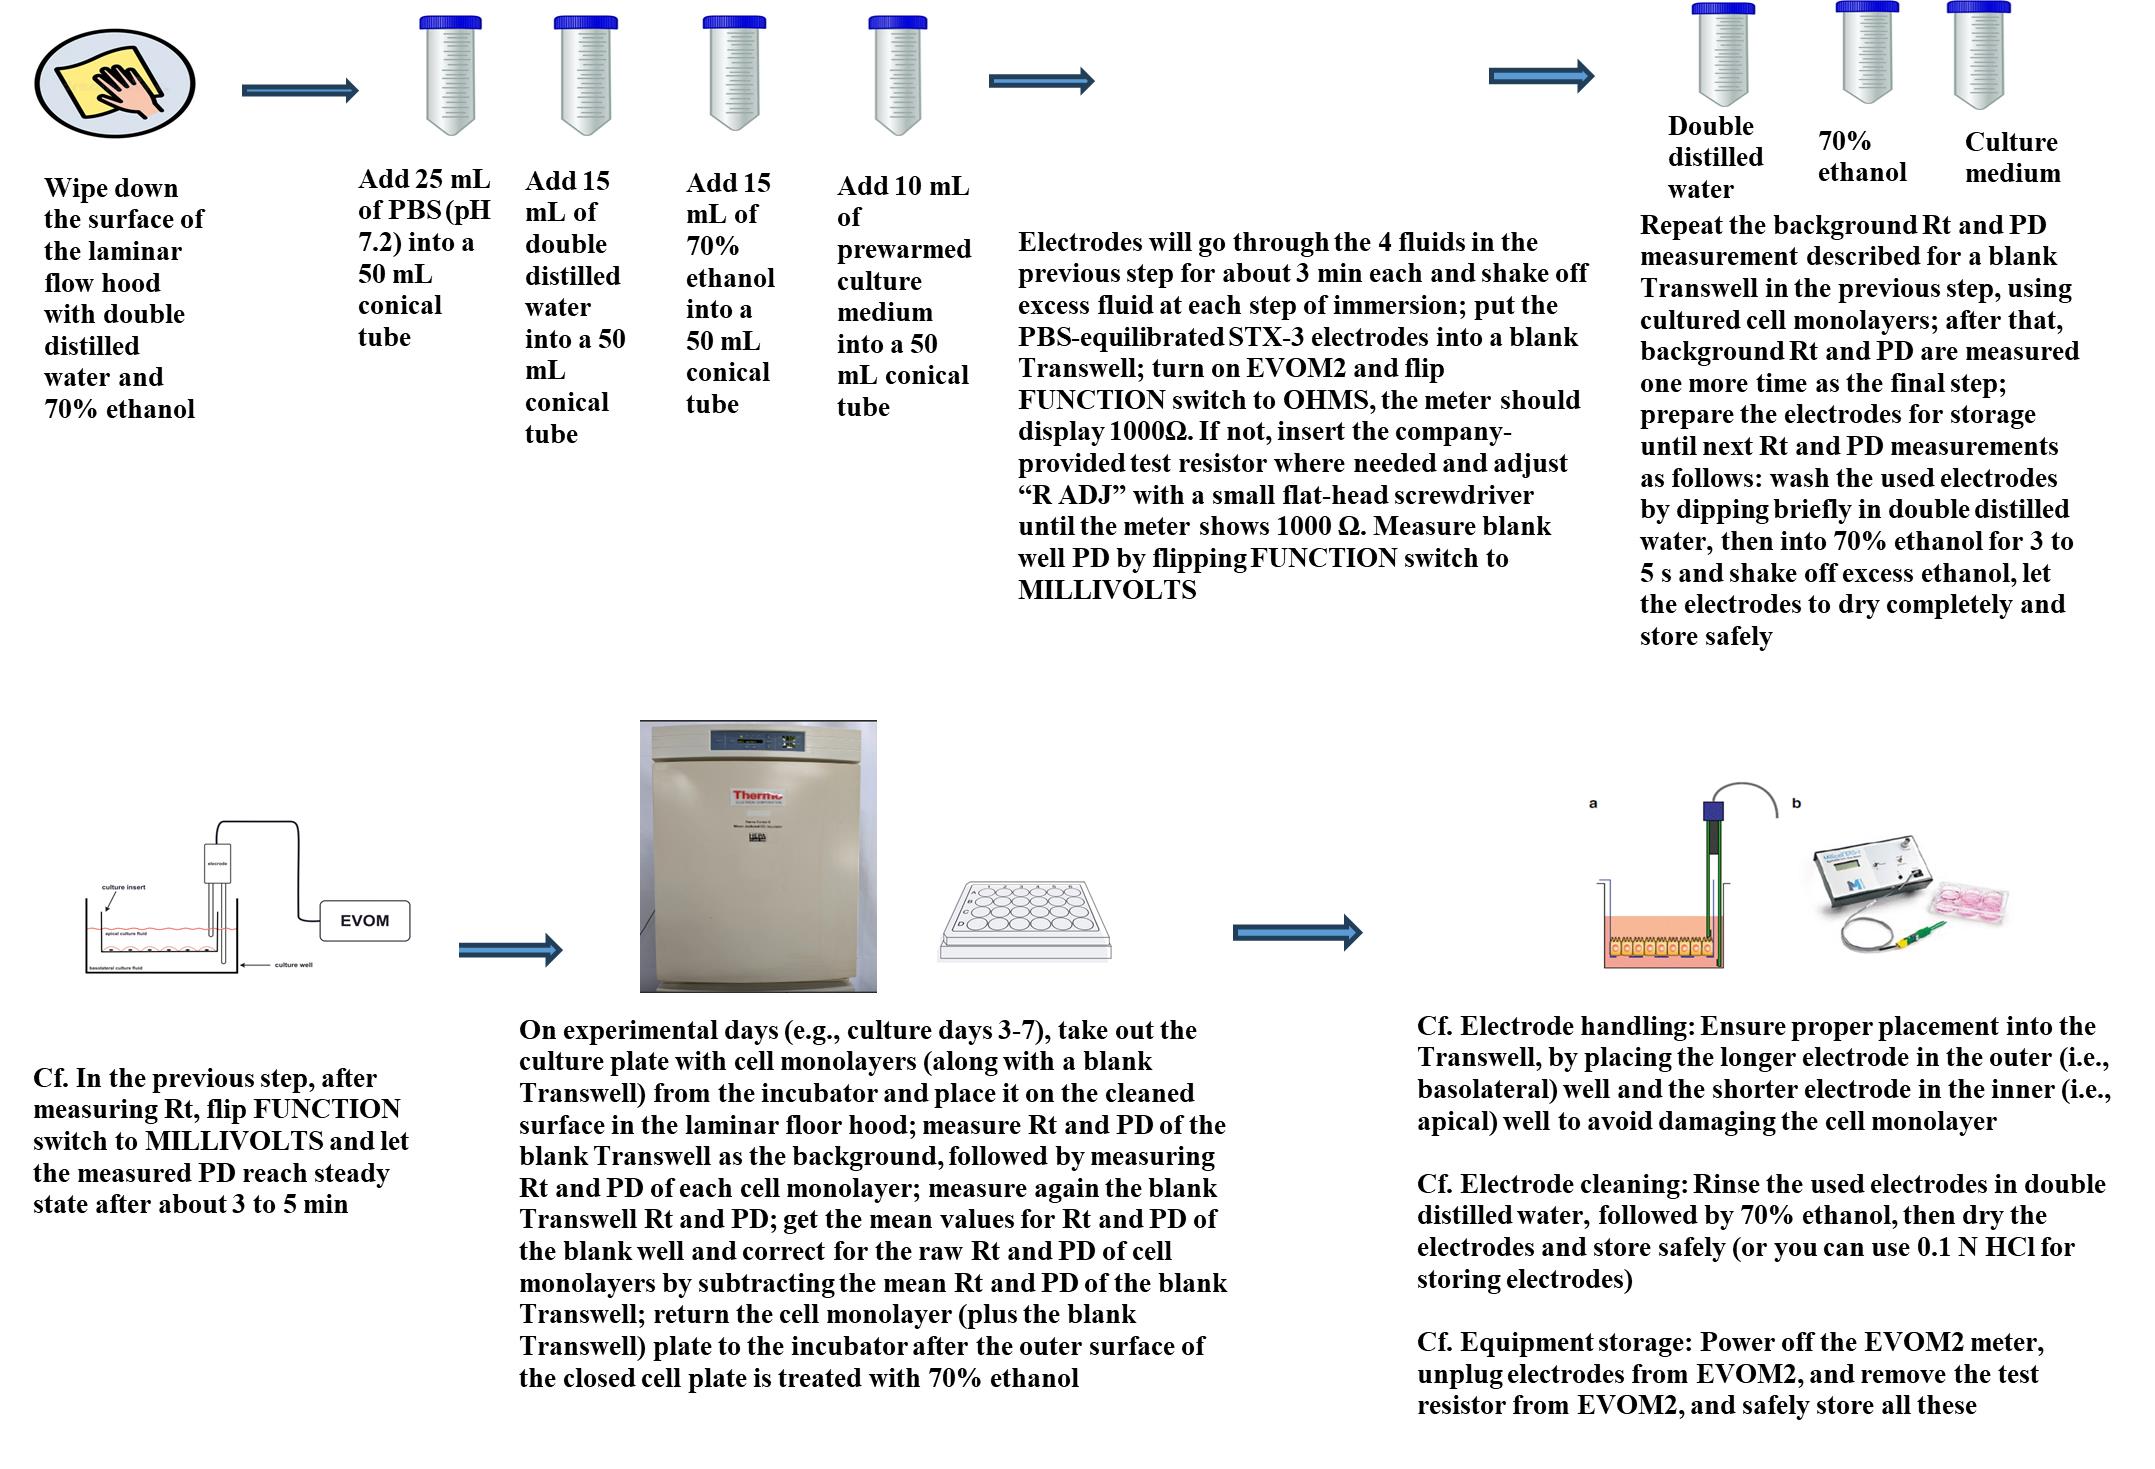
Graphical overview for measurement of Rt and PD of RAECM
Background
Waste plastic from consumer and industrial sources disperses freely into the environment, where it degrades into micro- (10–1,000 μm) and eventually nano (<1 μm) scale materials by natural weathering processes such as solar radiation and physical abrasion. These plastic fragments of micrometer and nanometer sizes are abbreviated in this article as MPs and NPs, respectively. They have become ubiquitous pollutants, with more than 250,000 metric tons of plastic estimated to persist across all waterways worldwide [1–3]. Of particular concern are NPs, because they are not only too small to be remediated by most conventional approaches [4] but are also small enough to infiltrate biological tissues and impact living systems on various cellular levels [5]. Biomimetic lipid bilayers have been extensively shown to be deformed and perforated when interacting with nanoparticles [6–11], where these damaging phenomena are reported to be driven by a combination of nanomaterial composition, size, shape, surface charge, and surface chemistry. Cell culture and toxicological studies have similarly shown various deleterious effects on biological function due to NP exposure [5,12,13].
Despite the vast differences in size, shape, and composition of environmental nanoplastic wastes, over 90% of research literature discussed in a recent review employs pristine or virgin plastic material engineered to have uniform shapes (most commonly spherical beads) and sizes. Furthermore, while polystyrene (PS) is the model plastic used in ~96% of those studies, PS comprises less than 6% of typical environmental samples [14,15]. Indeed, polystyrene (nano-PS) and polymethyl methacrylate (nano-PMMA) are often the only commercially available engineered nanoplastics [4]. The densities of nano-PS and nano-PMMA are greater than that of water/culture media, making them convenient choices for cell toxicity studies, and their particle uniformity in commercial preparations allows for predictable and consistent behavior in vivo [4]. On the other hand, “real-world” nanoplastic pollution is found with a variety of different compositions, shapes, surface chemistries, surface charges, additives, and adulterants due to the chaotic nature of environmental aging and the wide variety of plastic waste source streams [14]. Such adulterant matrices include, but are not limited to, non-plastic organic debris, including leaves and other plant matter, animal protein and remains, humic acid, soil, sediment, motor oil, bacteria, metals, paper, and fibers like cotton and rope from the environment that can be found alongside plastic waste [4]. There is thus a significant gap in understanding the biological impact of weathered waste NPs, as the vast majority of current literature uses NP models that are not environmentally realistic. In other words, those studies can demonstrate an impact on living systems, but because plastic waste is seldom uniformly shaped and pristine, further studies may be needed to determine real-world effects.
In this protocol, we describe a straightforward, customizable, and more environmentally relevant method to experimentally monitor the effects of nanoplastic pollution using, for example, rat alveolar epithelial cell monolayers for assessment of active and passive ion transport properties. NPs are generated by accelerated photoaging/photooxidation of pulverized plastic waste using an ultraviolet (UV) light source coupled with an ozone (O3) gas generator. It is estimated that this aging process simulates years of solar irradiation within an exposure time of just 72–144 h [16]. NPs generated by this method can be easily concentrated (up to ~120 mg/mL) and mixed with other NP materials as desired. Changes in cell functions (e.g., ion transport and membrane damage) of lung alveolar epithelial cell monolayers exposed apically to these different environmental NP contaminant models can then be monitored using a simple bioelectric assay by tracking both spontaneous potential difference (PD) and electrical resistance (Rt) of cell monolayers over time at different concentrations of various fabricated NPs. An equivalent short-circuit current (Ieq), which represents the active ion transport rate across the monolayer, can be estimated from the ratio PD/Rt as described previously [17,21–23]. Finally, NPs can be tagged with a fluorescent labeling molecule for convenient tracking, if needed. This will allow researchers using confocal microscopy to easily visualize NPs interacting with cells, to quantify NPs with particle counters, to track the flux of NPs across cell monolayers [17,21], and/or to further shed light on mechanisms underlying NP interactions with cells [e.g., NP interaction with lipid bilayers, endocytosis, autophagy, intracellular organelles (mitochondria, endoplasmic reticulum, Golgi, and lysosomes), and exocytosis].
The method for nanoplastic generation described herein is an improved and expanded version of the method described by Sorasan and coworkers [16]. In that original method, only PE, PP, and PS were considered, and the raw plastic materials were sourced from various plastic-strewn beaches in Spain and Portugal. While true environmental samples are the best models for studying NP pollution impact, collecting field samples can be an expensive and arduous task, since alternative methods such as Fourier transform infrared spectroscopy (FTIR) must be used to first identify the plastics found. In addition, the composition of plastics globally found in the environment is mostly PE and PP [14,16] but will vary widely among local sources. The method described herein is much more rapid, high-throughput, controllable, and cost-effective, as the researcher can “mix and match” any consumer plastic sources and have total control over the composition of the NP mixtures [e.g., PE, PP, PS, or polyethylene terephthalate (PET); any plastic amenable to grinding (e.g., PMMA, polycarbonate and nylon) can also work]. Furthermore, much less field travel time and collection and processing efforts are required. Finally, if desired, the researcher could easily adapt this procedure for field-collected samples, with the only difference being the sourcing of the plastic.
Part I: In-house fabrication and fluorescence labeling of various NPs
Materials and reagents
Reagents
1. Nile Red (Santa Cruz Biotech, catalog number: sc-203747 through sc-203747C)
2. Methanol (100%) (VWR, catalog number: BDH1135)
Solutions
1. Nile Red (1 mg/mL) in pure methanol (see Recipes)
Recipes
1. Nile Red (1 mg/mL) in pure methanol
Weigh 1.5 mg of Nile Red and place it into a glass amber vial. Add 1.5 mL of methanol (100%) into the vial and mix well to dissolve completely.
Laboratory supplies
1. Centrifuge tubes, 15 mL (VWR, catalog number: 89039-670)
2. Dye removal/size-exclusion columns, 2 mL (Thermo-Fisher, catalog number: A44299)
3. Centrifuge tubes, 50 mL (VWR, catalog number: 89079-494)
4. Microcentrifuge tubes, 1.7 mL (VWR, catalog number: 87003-294)
5. Two-necked round-bottom glass flask, 250 mL (Chemglass Life Sciences, catalog number: CG-1520-04)
6. Single-necked flat-bottom glass flask, 250 mL (Chemglass Life Sciences, catalog number: CG-1500-03)
7. Desired plastic waste for nano-sizing. Example sources include:
a. For polyethylene (PE): clear plastic transfer pipettes (Copan, catalog number: 200C or 201C)
b. For polypropylene (PP): clear microcentrifuge tubes (VWR, catalog number: 87003-294)
c. For polystyrene (PS): disposable cuvettes (Brand GmbH, catalog number: 759076D)
d. For polyethylene terephthalate (PET): clear disposable water bottles and clear food takeout containers marked with Resin Identification Code “1”
8. Polyethersulfone filters, 47 mm diameter (Pall Corporation, catalog number: 60110)
9. Dialysis cassettes, 3500 MWCO (Thermo Scientific, catalog number: PIA52966)
Equipment
1. Hg or Xe or Hg-Xe light source (Oriel Instruments, lamp numbers: 6291, 6292, 66142, 6293, 6295, 62712, or equivalent; Oriel instruments housing unit model 66902; see General notes and troubleshooting for guidelines on lamp selection) and power supply (Newport Corporation, model: 69910)
2. Ozone generator (A2Z Ozone, model: Aqua-6)
3. Ultrasonicator (Branson Ultrasonics, model: Sonifier S-450) with ~2.32 mm tip
4. Benchtop cyclone evaporator (BioChromato; model: S1-SU-120-A)
5. Vacuum filtration assembly: 1 L holding flask, 300 mL filtration funnel, 47 mm glass support base, and 47 mm aluminum clamp (Eisco Scientific, catalog number: FSAS16)
6. Block heater (VWR, catalog number: 75838-318)
7. Solid particle grinder or blender (e.g., coffee grinder, Hamilton Beach, model: 80350G)
8. Dynamic light scattering (DLS) and zeta-sizer instrument (Wyatt Technology Corporation, model: Mobius 305)
9. Other standard lab equipment [e.g., personal protective equipment (PPE), UV-resistant goggles, hotplate-magnetic stir plate, ring stand clamps, ½ inch ID (6.35 mm) vacuum hose, house vacuum line, house air line, and fume hood]
10. Centrifuge (e.g., Eppendorf, model: 5920 R)
11. Milli-Q water dispenser (e.g., Millipore, model: Advantage A10)
Software and datasets
1. DYNAMICS software (Wyatt Technology Corporation)
2. ImageJ (National Institutes of Health)
Note: With confocal laser scanning microscopy (CLSM) of Nile Red (NR)-labeled NP inside RAECM (see Figure 8), Image J can be used to quantify the fluorescence as needed (e.g., mitochondrial association of nanoplastics vs lysosome-associated nanoplastics).
3. Excel program (Microsoft)
4. Prism program version 10 (GraphPad Software)
Procedure
1. Obtain bulk plastic waste. Example sources are indicated in the Materials and Reagents section. Use scissors or similar device to cut up the bulk plastic into pieces no larger than ~1–2 cm.
Note: While any plastic waste may be adapted for this protocol, it is recommended to use only transparent (“natural”) rigid plastic. The transparency facilitates fluorescent staining and tracking of the particles, and rigid plastic is much easier to grind than flexible specimens.
2. Place the cut-up plastic into the chosen particle or coffee grinder. Grind on the highest setting, with the finest possible ground size.
Note: Depending on the grinder used, excessive amounts of heat might be generated, which may melt the plastic samples and/or break the grinder. Always be mindful of the temperature of the grinder during pulverization. As a guideline, do not grind continuously for more than ~2 min at a time.
3. Add 10 g of pulverized plastic powder into a clean two-necked round-bottom flask. This will be the photoreactor. To this powder, add 200 mL of Milli-Q water at ambient temperature. Gently mix to incorporate the plastic with the water and minimize plastic particles stuck to the flask walls.
Note: Ensure that no external plastic sources can contaminate the processed plastic. These precautions include, but are not limited to, using only glassware where possible, using a glass fitting for the ozone tube, wearing cotton lab coats and not polyester, and pre-washing all labware in 1% HCl.
4. Add a small or medium stir bar to the photoreactor.
5. Working in a fume hood, use a ring stand clamp to hold the photoreactor directly on a hotplate-magnetic stir plate.
6. Place the light guide, or other light-emitting outlet, into the central neck of the photoreactor using another clamp; position the light source a few centimeters above the surface of the water.
7. Place the ozone generator outlet tubing into the other neck of the flask; ensure the ozone outlet tubing is submerged at least halfway into the liquid.
8. Wear UV-resistant goggles and cover the flask with aluminum foil to minimize UV leakage; turn on the UV light source and ozone generator (for the Aqua-6, use setting 10); and turn on the stir plate (leave the heating OFF) to mix at a moderate speed, typically around 300–500 rpm.
Critical: The required ozone flow rate is 120 mg/h or higher.
Caution: Please be mindful to minimize exposure to UV and ozone, which are powerful oxidizers and irritants; wear appropriate PPE and follow safety procedures.
Critical: The required UV irradiance at the center of the flask must be at least 1,100 W/m2. Over 72 h, this is comparable to the average total UV solar irradiation at Earth’s surface over one year [16]. The irradiance E can be estimated using Eq. 1:
where P is the light source power and r is the distance from the light source to the center of the flask. For reference, using a Chemglass flask (catalog number: CG-1520-04), the required lamp power is ~160 W. (Refer to Figure 1 for the proper setup.)
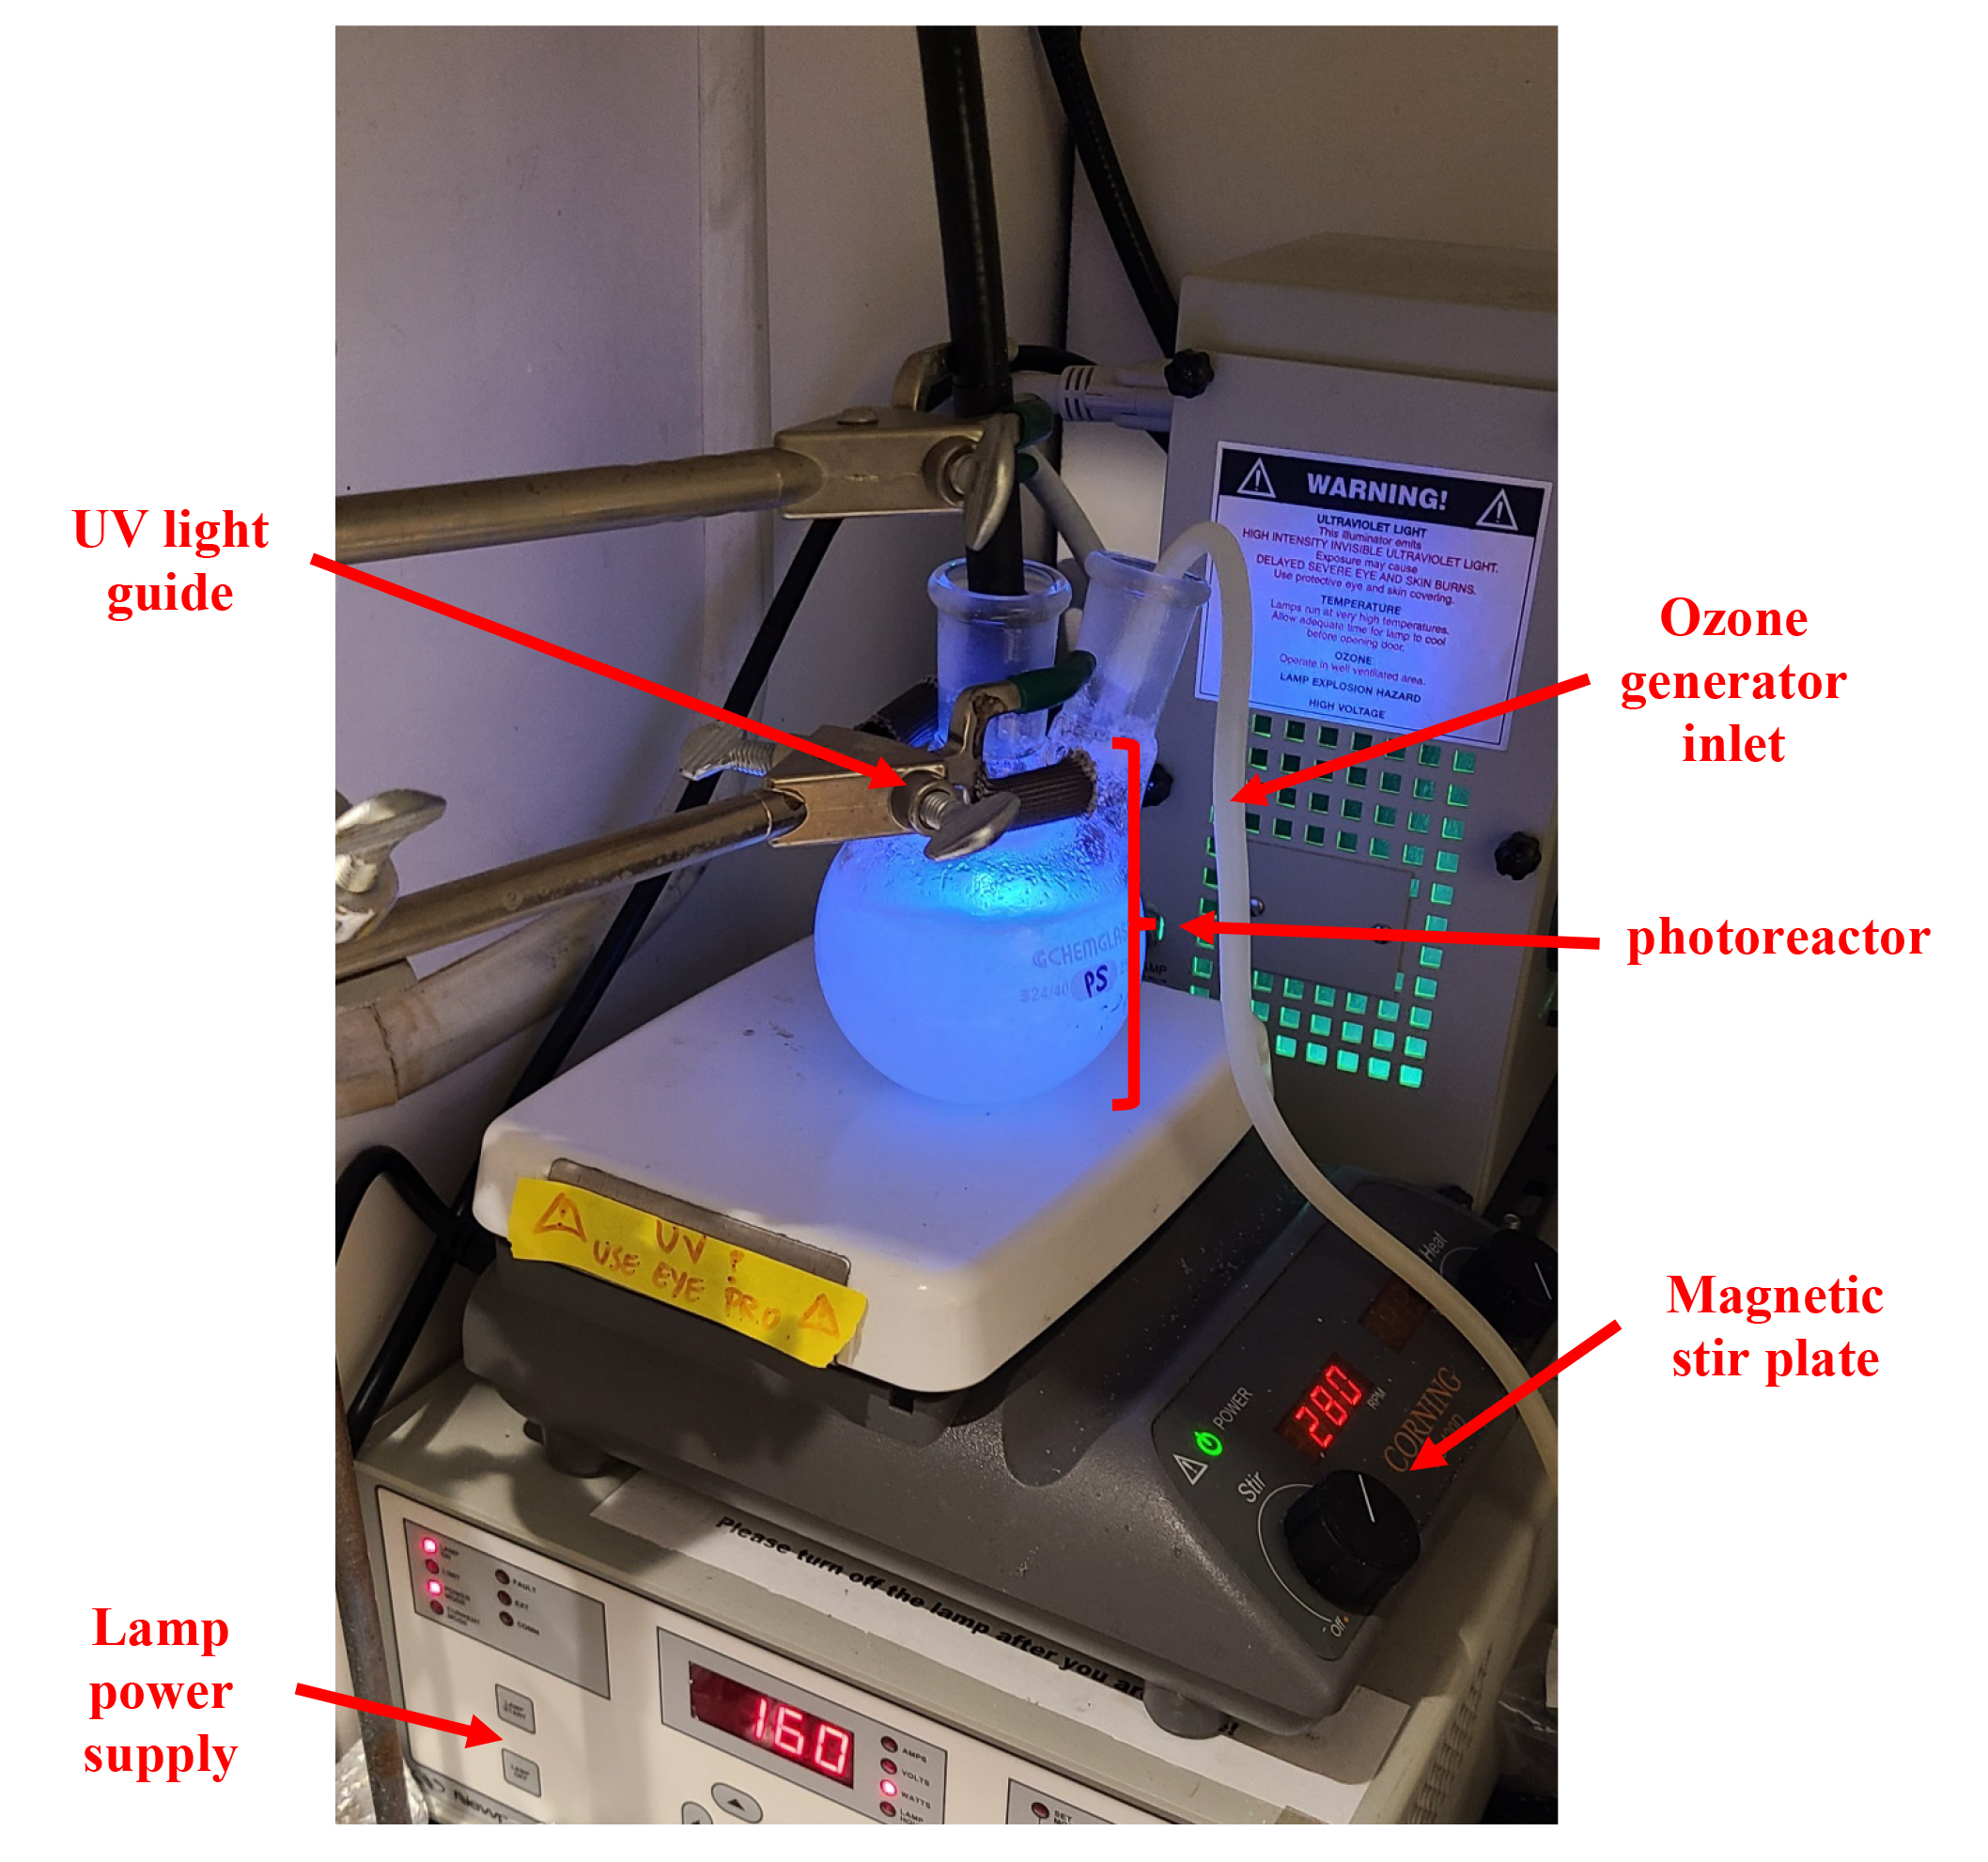
Figure 1. Photograph depicting the photoreactor loaded with plastic and light source
9. Allow to photoreact and ozone-treat for 72 h (assuming irradiance inside the photoreactor of 1,100 W/m2).
Note: If faster processing is required, the power of the lamp may be increased. As a reference, a photoreactor irradiance of 1,100 W/m2 will produce one year of solar UV energy dose within 72 h. Doubling that irradiance to 2,200 W/m2 will halve the time required to achieve a year-equivalent solar UV dose to 36 h; tripling it to 3,300 W/m2 will reduce that time to 24 h, and so forth.
Critical: Note that the required total energy dosage is at least 79.2 kWh/m2.
10. After the photoreaction is complete, assemble the vacuum filtration apparatus and install the 47 mm filter with 800 nm pore size (but any sub-micron pore size can work).
Note: Smaller particles can be obtained using smaller pore sizes (220 and 450 nm are common), but this might reduce the overall NP yield and produce high filtration resistance.
11. Obtain a clean, dry, single-necked flat-bottom round flask; weigh it on an analytical balance and record its tare weight.
12. Turn on the house vacuum and carefully pour off the liquid inside the photoreactor through the filter. Decant in a way to minimize the number of large particles getting caught on the filter.
13. The filtrate is the nanoplastic suspension; remove all particulates from the filter and set aside in a suitable clean glass vial. Discard the filter.
14. Take the filtrate and decant it to the single-necked, flat-bottom round flask you weighed in step 11 above; wash and rinse the 1 L holding flask extensively with Milli-Q or DI water.
15. Install a new 47 mm diameter filter with the same pore size as in step 10 onto the filtration apparatus and filter the filtrate from the round flask.
Note: There should be almost no visible solid particles trapped by the filter this time. Rinse and clean the round flask with Milli-Q water.
16. Take the filtrate from step 15 above and pour it back into the cleaned round flask.
17. Place the twice-filtered NP suspension into the cyclone evaporator and turn on the house air; the airflow should be high enough to cause the water surface to ripple moderately, but not so high as to cause the liquid to spray out of the flask. If desired, turn on the cyclone evaporator bath heating element to 100 °C.
18. Evaporate away all the water using a 250 mL round flask (e.g., Chemglass CG-1500-03); this will take approximately 24 h per 200 mL if the flask is not heated, or about 8–16 h if the evaporator heat bath is at 100 °C.
Note: Excessive heating, especially when the water is evaporated, may cause undesirable yellowing of the NP sample.
19. Once all the water is gone, there should be a visible crust of NPs at the bottom of the flask (see Figure 2A); weigh the flask on the same balance used in step 11 above and record that weight.
20. The approximate NP mass produced will be the difference between the masses of the flask with the NP residue (from step 19 above) and that of the clean, dry flask alone (from step 11 above). Resuspend the NP carefully in 1 mL of Milli-Q water, bringing all the encrusted NP back into suspension, where the resulting suspension will be milky-white to slightly yellow (see Figure 2B)
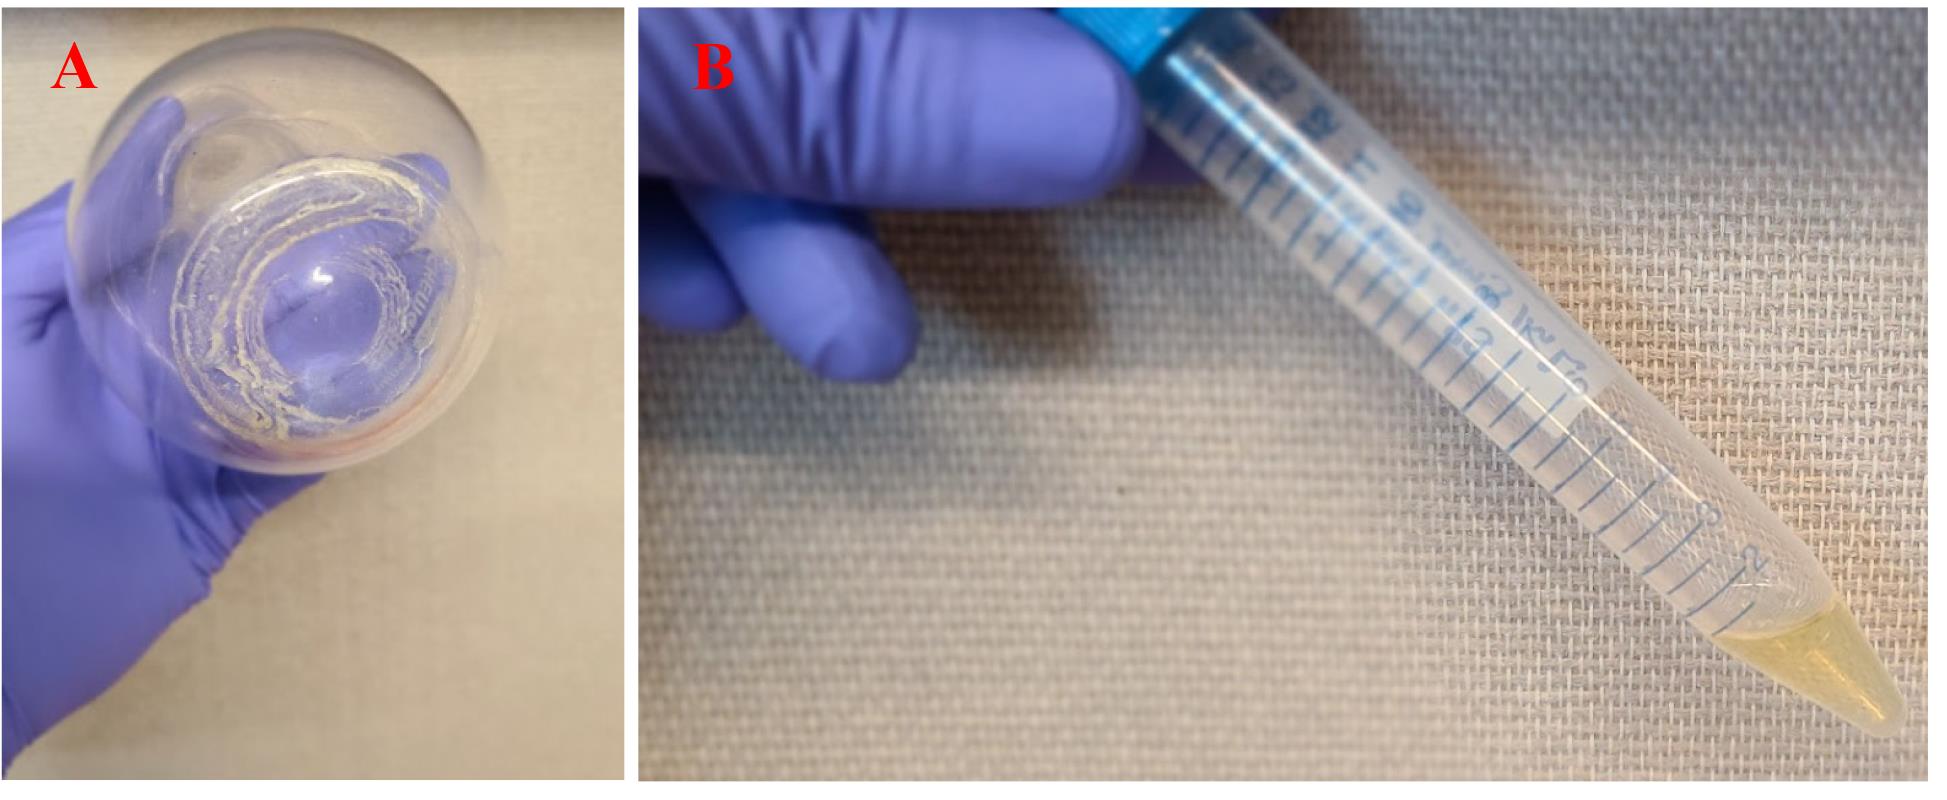
Figure 2. Photographs of finished weathered nanoplastic (NP). (A) Solid NP [i.e., polystyrene (PS)] residue. (B) Suspension (concentration shown is 60 mg/mL) of the same NP from (A) in 1 mL of water.
21. Pipette the NP into a 15 mL centrifuge tube. Place crushed ice in a suitable beaker and then place the tube containing the NP into the ice.
Note: The tube should be inserted into the ice far enough, so that the ice and NP suspension levels roughly coincide. The ice is used to mitigate the heating of the suspension during ultrasonication.
22. Insert the ultrasonicator tip into the center of the liquid in the tube and ultrasonicate on 50% pulsed mode at roughly 240 W for 15 min; on the Branson Sonifier 450, this is power setting 6.
Note: If DLS size/zeta potential/TEM characterization of the NP is desired, set aside enough sample at this point in the process.
23. Prepare a 1 mg/mL stock solution of Nile Red in absolute methanol.
24. To every milliliter of NP suspension, add 10–100 μL (depending on the desired staining intensity) of the Nile Red solution.
25. The final dye concentration will thus be 0.01–0.1 mg/mL Nile Red with 1%–10% v/v methanol. Leave this stained NP at ambient temperature for at least 30 min [20].
27. Ultrasonicate the stained NP again following steps 21–22 above. The stained NP is now ready for use; store at 4 °C.
Notes:
1. Relevant expected characteristics for finished weathered NP can be found in Table 1. Example TEM micrographs of weathered NP are given in Figure 3A–D, alongside pristine nano-polystyrene spheres in Figure 3E. Example dynamic light scattering (DLS) sizing results for weathered NP are shown in Figure 4A–C.
2. The ability to use the NP directly after staining exposure without the need to remove free/unbound Nile Red is unique to solvatochromic dyes. In general, any suitable lipophilic dye (e.g., Rhodamine B) can be used; however, most other dyes would necessitate a free dye removal step, commonly accomplished by dialysis over 72 h or a free dye removal column.
Typical characteristics of in-house fabricated NPs
Table 1. Summary of relevant attributes and yield for the in-house fabricated NPs. Actual results may vary significantly from lab to lab, mostly due to the wide array of possible waste plastic sources.
| Characteristics | Description | Units of measure |
|---|---|---|
| Visual appearance (undyed) | Opaque white to yellow (solid) Translucent white to slightly yellow (suspension in water) | - |
| Visual appearance (stained with Nile Red) | Slightly translucent pink-purple liquid | - |
| Shape | Globular, dendritic, or fibrous | - |
| Hydrodynamic size | 120–350 | nm |
| Polydispersity | 11–25 | % |
| Zeta potential (±1 standard deviation) | +10–13 (±8) | mV |
| Production yield | 1–12 | mg/g bulk pulverized plastic waste |
| Mass yield % | 0.1–1.2 | % |
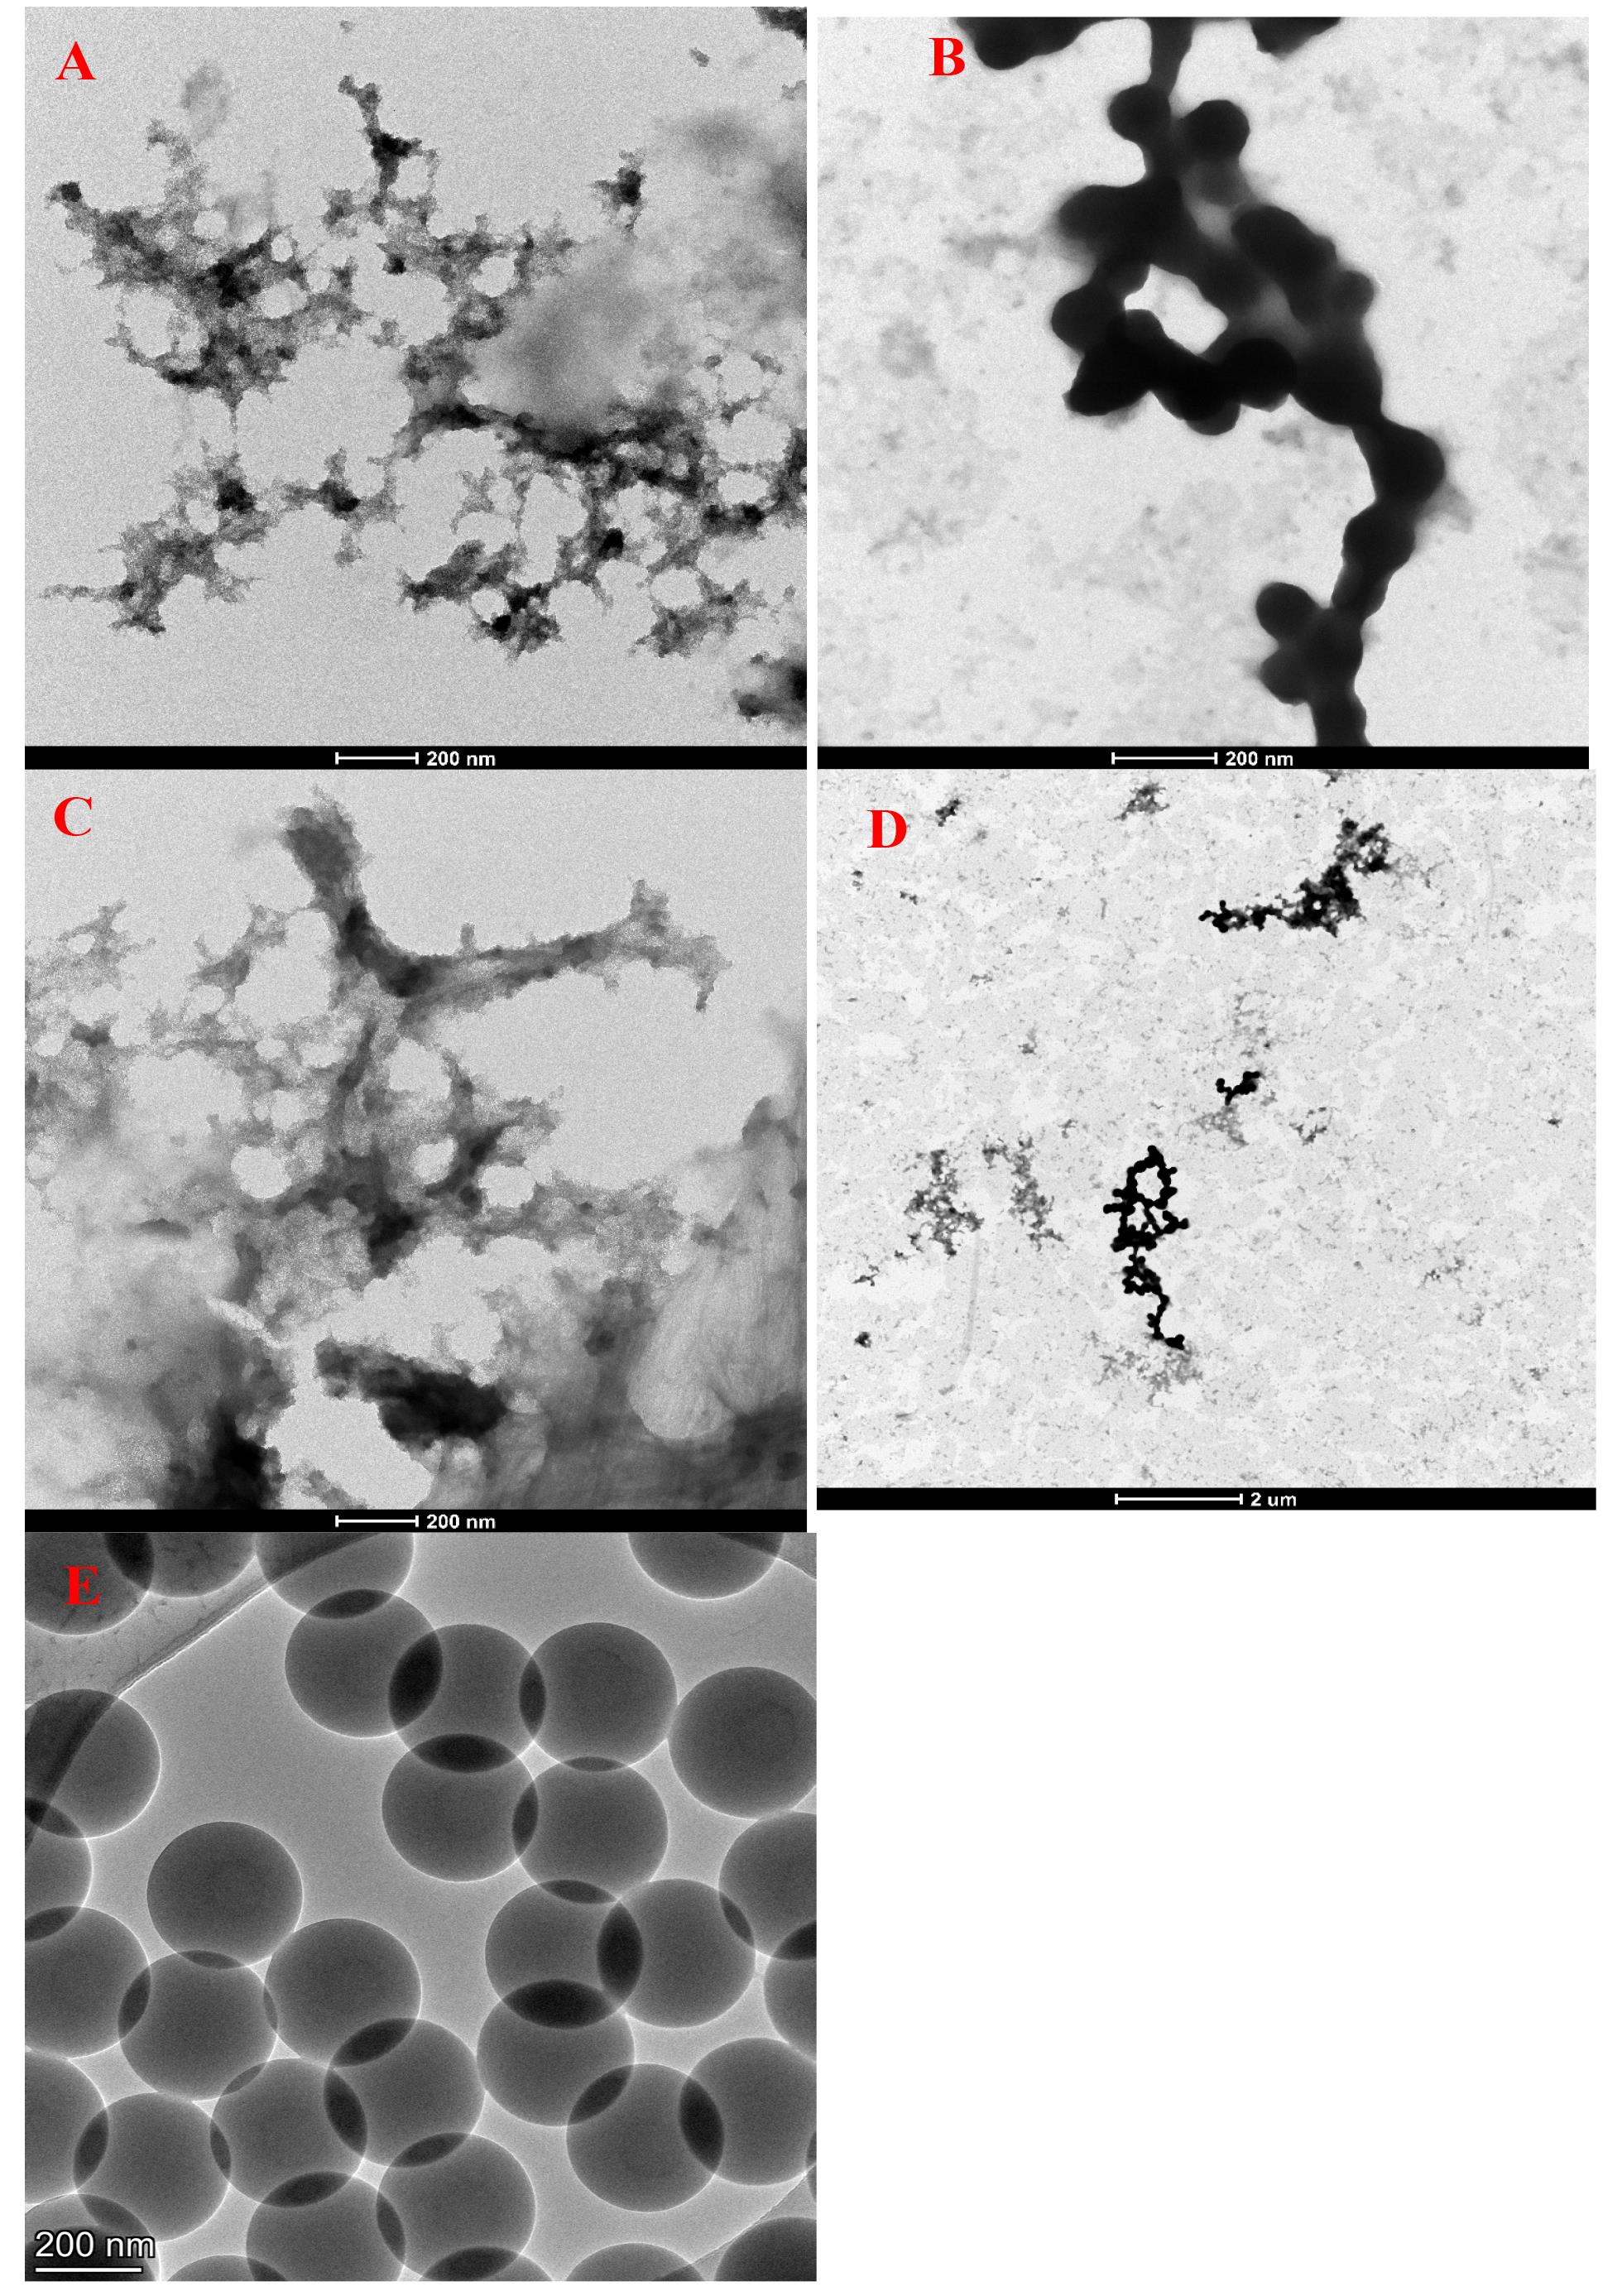
Figure 3. TEM micrographs. (A–D) Mixture of in-house fabricated nanoplastics (NPs) mimicking typical environmental oceanic waste [14,16], comprised of polyethylene (PE) (42% by mass), propylene (PP) (31%), polyethylene terephthalate (PET) (13%), fluorinated ethylene propylene (FEP) (10%), and polystyrene (PS) (4%). (E) TEM micrograph for pristine manufactured 300 nm nominal nano-polystyrene (PS) spheres (product number PS300NM from Magsphere), typically used in most current NP studies. Note the diversity in morphology: (A) dendritic, (B) globular “chains”, (C) fibrous, and (E) perfectly spherical. (D) Low-magnification (11,000×) TEM image showing the coexistence of the shapes found in (A–C). Also, note the extreme contrast in shape between the weathered samples (A–D) and the perfect spheres in (E), which are the most common commercial NP shape available. Samples were all drop-cast (5 µL) on a copper TEM grid (product numbers 01801 and 01824, Ted Pella Inc.) and imaged at 28,000× (A–C and E) or 11,000× (D) magnification, all at 200 kV. Scale bars are 200 nm for (A–C) and (E), and 2 μm for (D).
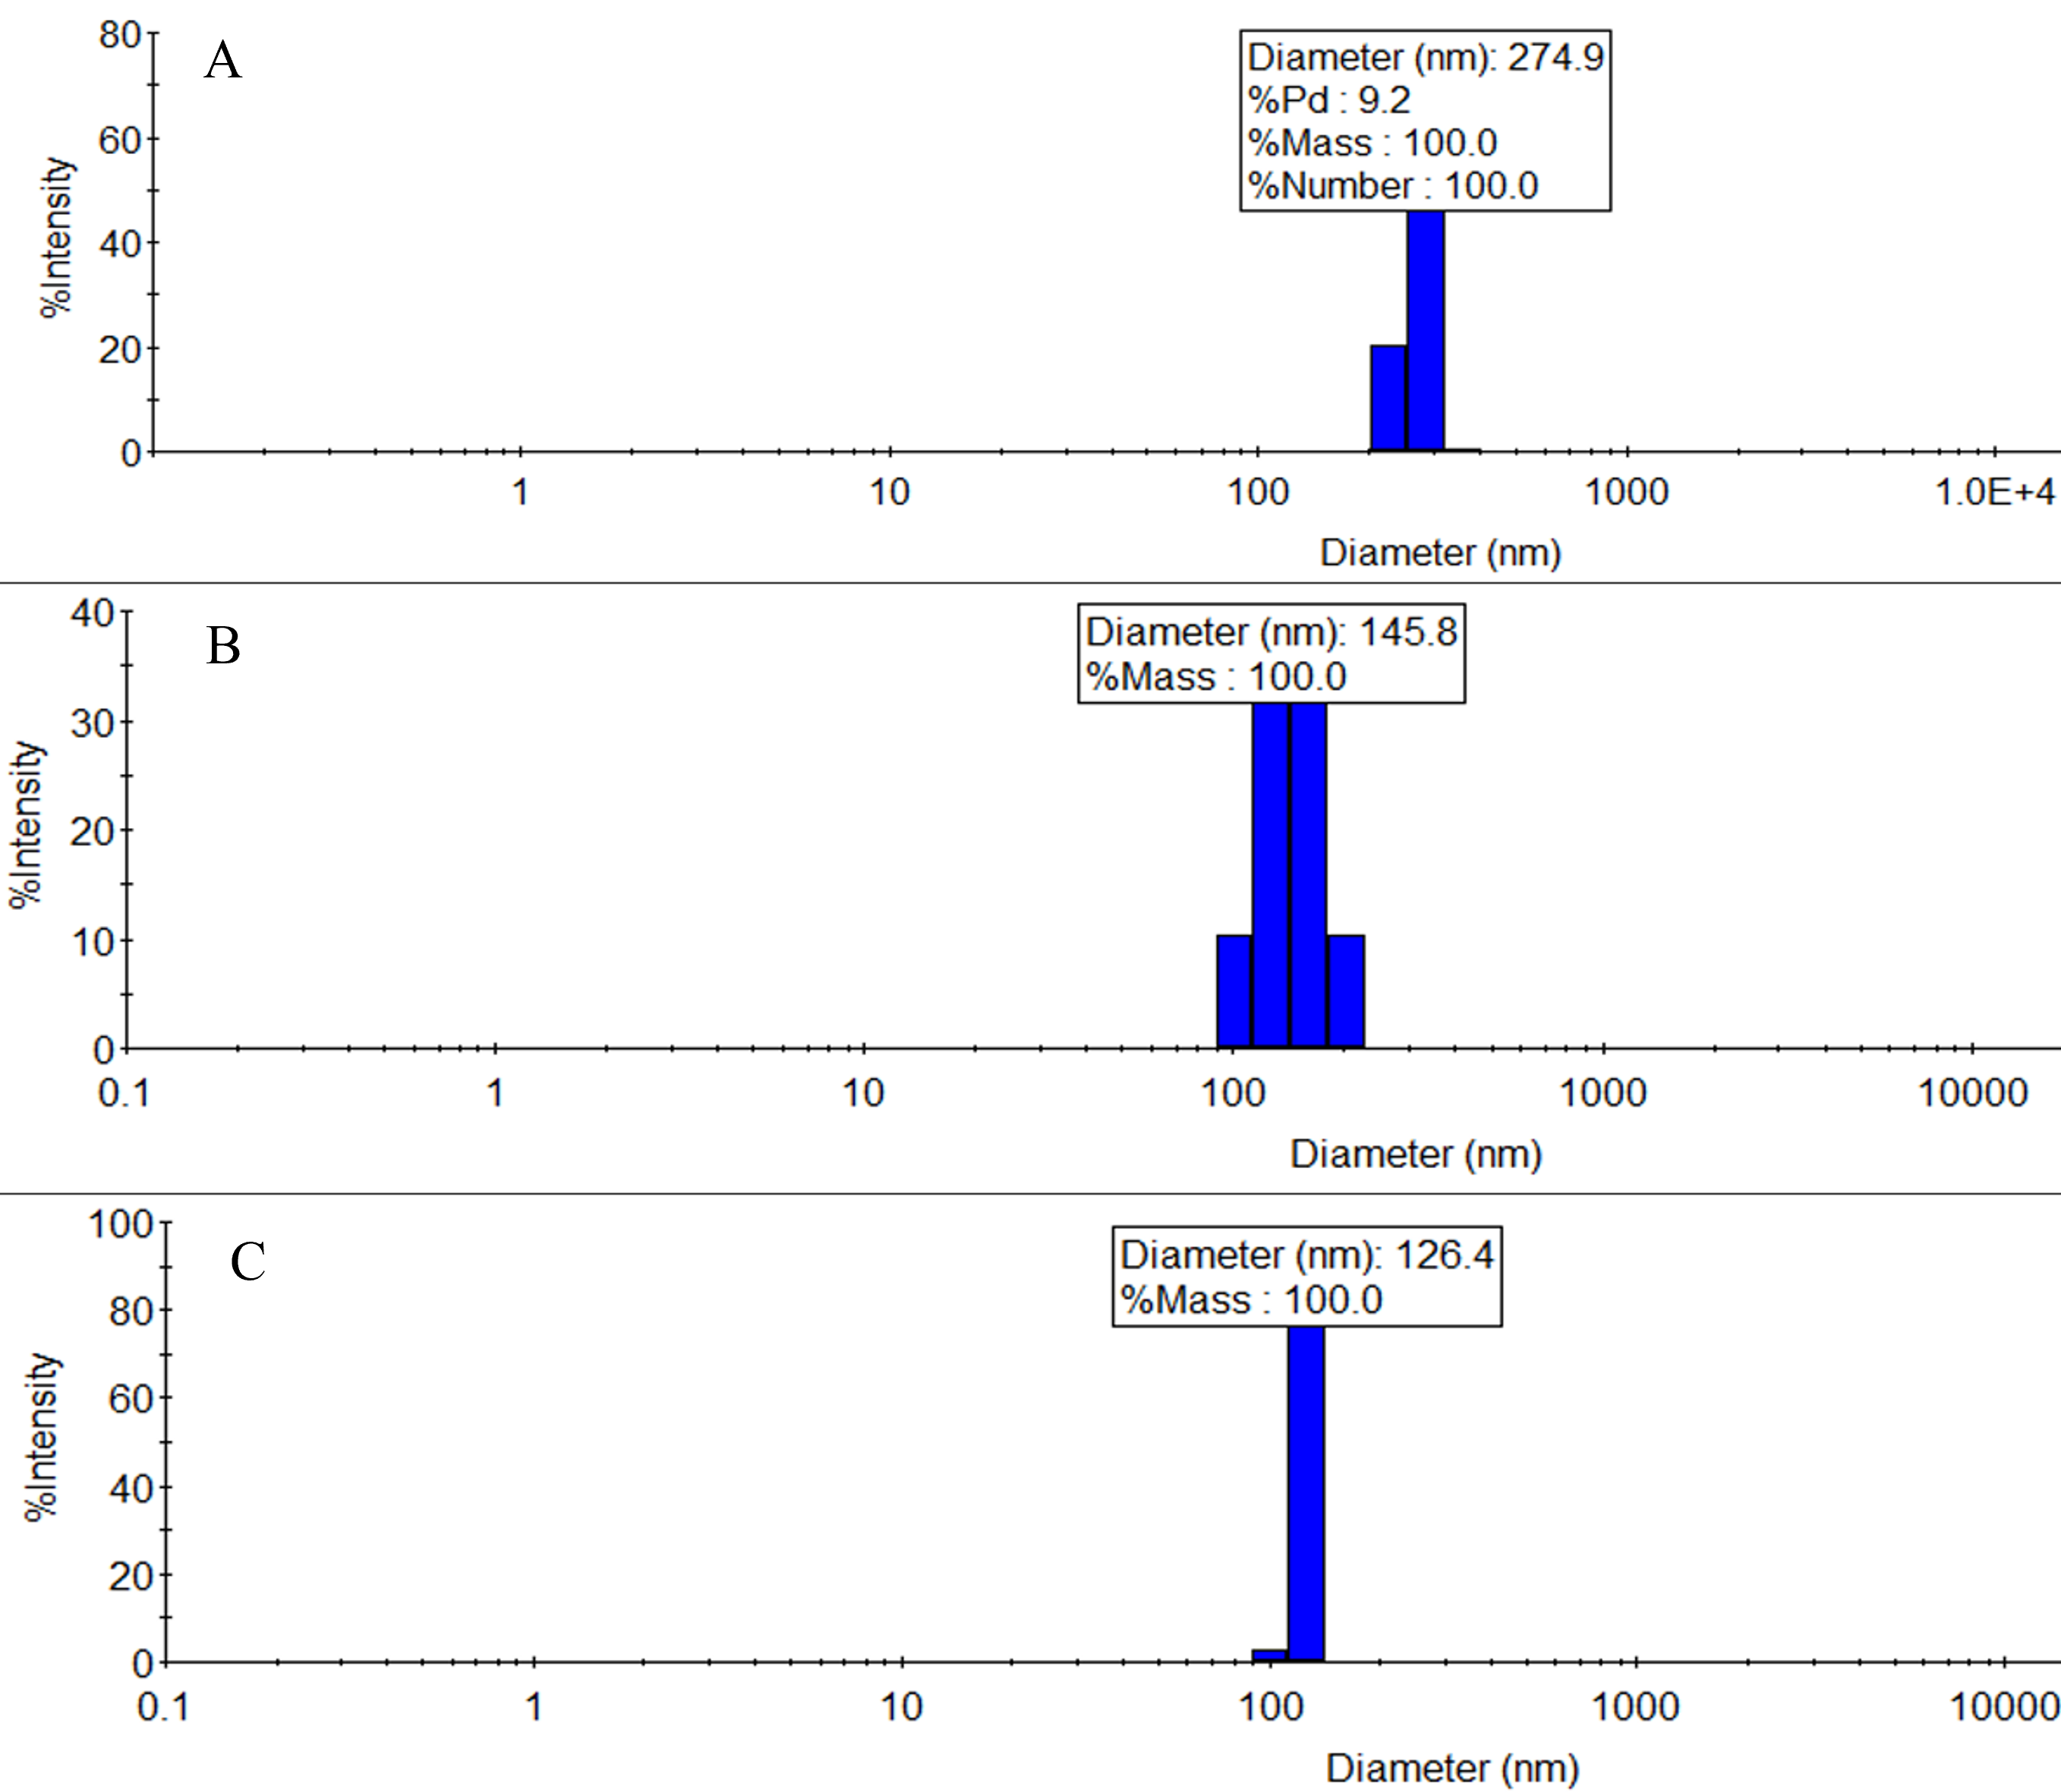
Figure 4. Example raw dynamic light scattering (DLS) results obtained using Wyatt Mobius 305. (A) Oceanic plastic mix [polyethylene (PE) 42%, propylene (PP) 31%, polyethylene terephthalate (PET) 13%, fluorinated ethylene propylene (FEP) 10%, and polystyrene (PS) 4%]. (B, C) Two separate batches of weathered nano-PS. Fractions of polydispersities are (A) 9.2%, (B) 19.4%, and (C) 3.4%. These screenshots have been cropped for clarity and ease of reading.
Part II: Preparation of primary rat lung alveolar epithelial cell monolayers
Materials and reagents
Biological materials
1. Sprague-Dawley rat (125–150 g) (Harlan, catalog number: 737903)
Reagents
1. N-(2-hydroxyethyl)-piperazine-N'-(2-ethanesulfonic acid) hemisodium salt (HEPES) (1 M solution, pH 7.0–7.6) (Sigma-Aldrich, catalog number: H0887)
2. Dulbecco’s modified Eagle's medium/nutrient mixture Ham’s F-12 medium (DMEM/F-12, phenol red-free) (Sigma-Aldrich, catalog number: D6421)
3. Bovine serum albumin (BSA) (Corning, catalog number: 345331)
4. L-glutamine (200 mM solution) (Sigma-Aldrich, catalog number: G7513)
5. Nonessential amino acid (100× solution) (Sigma-Aldrich, catalog number: M7145)
6. Primocin (50 mg/mL) (VWR, catalog number: MSPP-ANTPM1)
7. Rat immunoglobulin G (IgG) (Sigma-Aldrich, catalog number: I4131)
8. Trypan blue (Sigma-Aldrich, catalog number: T8154)
9. Deoxyribonuclease I (DNase I) (Roche, catalog number: 10104159001)
10. Ethylenediaminetetraacetic acid disodium salt dihydrate (EDTA) (0.25 M, pH 9.0) (Sigma-Aldrich, catalog number: E4884)
11. Trypsin inhibitor (Sigma-Aldrich, catalog number: T9128)
12. Euthasol (pentobarbital sodium and phenytoin sodium) (euthanasia solution) (Vetone, catalog number: 009444)
13. Fetal bovine serum (FBS) solution (Hyclone, catalog number: SH30071.03)
14. Penicillin/streptomycin (10,000 units penicillin and 10 mg of streptomycin per milliliter in 0.9% NaCl) (Sigma-Aldrich, catalog number: P0781)
15. Tris base (25 g) (Sigma-Aldrich, catalog number: T1503)
16. Elastase (25.9 mg protein/mL, 5.79 U/mg protein) (Worthington Biochemical, catalog number: ESLS002280)
Solutions
1. 10% FBS solution (see Recipes)
2. Wash media (1 L) (see Recipes)
3. Rat alveolar epithelial cell culture medium (MDS) (1 L) (see Recipes)
4. Solution I (without Ca2+ and Mg2+) (2 L) (see Recipes)
5. Solution II (with Ca2+ and Mg2+) (2 L) (see Recipes)
6. Elastase solution (1.5–3 U/mL) (60 mL/rat) (see Recipes)
7. Trypsin inhibitor solution (10 mL/rat) (see Recipes)
8. Tris base (50 mM, pH 9.5) solution (1 L) (see Recipes)
9. PBS (1 L) (see Recipes)
10. Rat IgG solution (200 mL) (see Recipes)
Recipes
1. 10% FBS solution
Add 10 mL of FBS to 90 mL of distilled water.
2. Wash media (1 L)
DMEM/F-12 medium is supplemented with nonessential amino acid solution (diluted by 100× from stock).
100 μg/mL primocin (diluted by 500× from 50 mg/mL stock).
10 mM HEPES (diluted by 1,000× from 1 M stock), and 2 mM L-glutamine (diluted by 100× from the 200 mM stock).
3. Rat alveolar epithelial cell culture medium (MDS) (1 L)
a. Into 800 mL of DMEM/F-12 medium, add 100 mL of 10% FBS, 10 mL of nonessential amino acid solution (diluted by 100× from stock), 100 μg/mL primocin (diluted by 500× from the 50 mg/mL stock), 10 mM HEPES (diluted by 100× from 1 M stock), 1.25 mg/mL BSA, 2 mM L-glutamine (diluted by 100× from 200 mM stock), and 1 U penicillin/streptomycin (diluted by 1,000× from stock).
b. Adjust the final volume to 1 L.
Note: This defined serum-free medium is called MDSF.
4. Solution I (without Ca2+ and Mg2+) (2 L)
a. Into a 2 L beaker, add 1.9 L of Milli-Q or de-ionized water, followed by 15.9 g of NaCl, 0.8 g of KCl, 0.1 g of NaH2PO4 (monobasic), 0.64 g of Na2HPO4 (dibasic), 5.06 g of HEPES, and 2 g of D-Glucose.
b. Adjust pH to 7.4.
c. Adjust final volume to 2 L with Milli-Q or deionized water.
d. Sterilize using a 0.22 μm filter and store at 4 °C.
e. Warm to 37 °C prior to rat alveolar epithelial cell preparation.
5. Solution II (with Ca2+ and Mg2+) (2 L)
a. Into a 2 L beaker, add 1.9 L of Milli-Q or de-ionized water, followed by 15.52 g of NaCl, 0.772 g of KCl, 0.1 g of NaH2PO4 (monobasic), 0.618 g of Na2HPO4 (dibasic), 4.93 g of HEPES, 2 g of D-glucose, 0.558 g of CaCl2 dihydrate, and 0.638 g of MgSO4 7-hydrate. Adjust pH to 7.4.
b. Adjust the final volume to 2 L with Milli-Q or deionized water.
c. Sterilize using a 0.22 μm filter and store at 4 °C. Warm to 37 °C prior to rat alveolar epithelial cell preparation.
6. Elastase solution (1.5–3 U/mL) (60 mL/rat)
Stock elastase is diluted to yield 1.5–3 U/mL in Solution II. Filter the solution using a 0.22 μm size syringe filter and place the filtered solution in a 37 °C water bath until use.
7. Trypsin inhibitor solution (10 mL/rat)
Into 9.9 mL of Solution I, add 100 mg of BSA, 10 mg of trypsin inhibitor, 10 mg of DNase I, and 100 µL of 0.25 M EDTA.
8. Tris base (50 mM, pH 9.5) solution (1 L)
a. Add 6.057 g of Tris base stock (25 g) into 1 L of distilled water.
b. Sterilize using a 0.22 μm filter and store at 4 °C.
c. Warm in a 37 °C water bath prior to use.
9. PBS (1 L)
a. Add 800 mL of distilled water to a suitable container.
b. Add 8 g of sodium chloride (to make 0.137 M) to the distilled water.
c. Add 0.2 g of potassium chloride (2.7 mM) to the distilled water.
d. Add 1.44 g of sodium phosphate dibasic (10 mM) to the distilled water.
e. Add 0.245 g of potassium phosphate monobasic 0.0018 M to the distilled water.
f. Adjust pH (typically pH ≈ 7.2) using HCl or NaOH solution (~ 1 M).
g. Add distilled water to make the final volume 1 L.
10. Rat IgG solution (200 mL)
Add 100 mg of rat IgG into 200 mL of 50 mM Tris base (pH 9.5); sterilize using a 0.22 μm filter and store at 4 °C. IgG plate is prepared one day prior to rat alveolar epithelial cell preparation as follows:
a. Coat Falcon bacteriological petri dishes with 5 mL of rat IgG solution per 100 cm2; allow the IgG solution to spread. Wrap the Petri dishes with parafilm.
b. Refrigerate the Petri dishes at 4 °C overnight (or until use).
c. On the day of rat alveolar epithelial cell preparation, remove the Petri dishes from 4 °C and place them in the laminar flow hood to allow them to reach room temperature.
d. Wash the plates with 10 mL of sterile PBS.
e. Wash rat IgG plates with 10 mL of wash media.
f. Add 9 mL of wash media per plate (five plates per rat preparation) and place them in a tissue culture incubator at 37 °C with 5% CO2.
Laboratory supplies
1. Polycarbonate Transwell® (tissue culture treated, permeable support of 0.33 cm2 or 6.5 mm diameter), 24-well plate (Costar, catalog number: 3413)
2. Centrifuge tubes, 15 mL (VWR, catalog number: 89039-670)
3. Centrifuge tubes, 50 mL (VWR, catalog number: 89079-494)
4. Bacteriological Petri dish (Falcon, catalog number: 351029)
5. Cell strainers (100 mm) (Falcon, catalog number: 352360)
6. Cell strainers (40 mm) (Falcon, catalog number: 352340)
7. Nylon mesh of 20, 15, and 10 mm (Safar America, catalog number: 03-20/5, 03-15/5, 03-10/5)
Equipment
1. Suture, 2-0 silk (Surgical Specialist, catalog number: SP118)
2. Surgical scissors (VWR, catalog number: 76457-390)
3. Surgical forceps (VWR, catalog number: 82027-438)
4. Hemostats (VWR, catalog number: 82027-418)
5. Small forceps (VWR, catalog number: 82027-440)
6. Small scissors (VWR, catalog number: 76457-398)
7. Rodent ventilator (set to a rate of 40 cycles per minute and a tidal volume of 7 mL) (Harvard Apparatus, model number: 683)
8. Three-way stopcock attached to an 18-gauge blunt needle (VWR, catalog number: KT420163-4503)
9. Perfusion syringe [a 20 mL disposable syringe attached with a 14-gauge catheter needle (blunted)] (VWR, catalog number: BD302830 and BD382268)
10. Tuberculin syringe (1 mL) (Beckton Dickinson, catalog number: 309628) with detachable 25-gauge × 5/8 inch needle (Beckton Dickinson, catalog number: 305122)
11. Feather® double edge carbon steel blades (Ted Pella, catalog number: 121-9)
12. Beaker (400 mL) (VWR, catalog number: 13912-229)
13. Hemocytometer (VWR, catalog number: 15170-263)
14. FormaTM Series II Water-Jacketed CO2 incubator (Thermo Scientific, model number: 3110)
15. Centrifuge (Sorvall, model: Legend RT)
16. Tissue chopper (Ted Pella Inc., catalog number: 10180-220)
17. Microscope (Leica, model number: DML52)
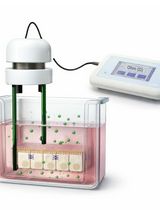
18. Trans epithelial electric resistance (TEER) measurements with STX3 electrodes (EVOM2) (World Precision Instruments, catalog number: 91799)
Procedure
A. Preparation of isolated primary rat lung alveolar epithelial type II cells
1. Anesthetize a Sprague Dawley rat (125–150 g) by injecting intraperitoneally 0.1 mL of Euthasol (stock solution) in a 1 mL tuberculin syringe.
2. Make a small incision using a scalpel blade through the skin in the lower abdomen.
3. Incise abdominal muscles in the midline to open the peritoneal cavity and extend the incision to the neck area, carefully avoiding blood vessels and exposing the tracheal region.
4. Using hemostats, clamp ribs on the right and left side of the incision and open the thoracic cavity by pulling the clamps apart (carefully so as not to break the ribs).
5. Pass a suture under the exposed trachea and make a small horizontal cut between tracheal rings.
6. Insert the tracheal canula, tie the suture tightly, and start the lung inflation cycle with a ventilator rate of 40 and tidal volume of 7 mL.
7. Carefully remove the thymus gland, which is located above the heart.
8. Exsanguinate the rat by cutting the vena cava and abdominal aorta.
9. Gently grab the apex of the heart with a forceps and partially cut off the lower one-third of the heart above the apex.
10. Perfuse the lungs with Solution I in a 20 mL syringe by inserting the 14-gauge catheter (attached to the syringe) into the right ventricle. The perfusion solution should flow freely through the pulmonary artery, and the lungs should become white with ongoing ventilation.
11. Lavage the lungs using a Solution I–filled syringe (20 mL) to almost total lung capacity (10–15 mL each time) 5 times (11 mL in, 4 mL out).
12. Close the tracheal stopcock to air, carefully dissect the lung from the animal with the trachea still attached, and place it in Solution II.
13. Fill the dissected lung with Solution I to total lung capacity (~ 8–10 mL) and drain the fluid from the lung.
14. Fill the lung with elastase solution and drain the fluid.
15. In a 400 mL beaker, fill the dissected lung with elastase solution and place the beaker in a 37 °C water bath for 10 min at slow shaker mode.
16. Fill the lungs again with the elastase solution and incubate for 15 min; repeat this procedure twice.
17. Cut the lungs at the trachea into a beaker with 50 mL of trypsin inhibitor solution.
18. Chop the lungs using the tissue chopper.
19. Pipette the chopped pieces of lung in a 50 mL conical tube.
20. Filter the chopped lung pieces through a 100 mm cell strainer and rinse with Solution II.
21. Filter the lung pieces once with a 40 mm cell stainer, twice with 20 μm nylon mesh, once with 15 μm nylon mesh, and finally with 10 μm nylon mesh.
22. Centrifuge the filtered cell suspension at 300× g for 15 min at 4 °C.
23. Aspirate away the supernatant of the centrifuged cells, resuspend the cell pellet in 5 mL of wash media, and count.
24. Plate the final cell suspension at 1 mL per rat IgG plate (5 plates/rat).
25. Incubate the rat IgG plate with isolated cells for 1 h at 37 °C in the 5% CO2 incubator.
26. Take the rat IgG plates out of the incubator, put them onto a working bench inside the laminar flow hood, pan (i.e., swirl gently in a circular motion horizontally) the dishes ~10 times to suspend non-adherent cells, and pipette only the non-stuck cells into a centrifuge tube.
27. Centrifuge cells obtained from panning the rat IgG plates at 300× g for 12 min at 4 °C.
28. Aspirate away the supernatant of the centrifuged cells and resuspend the cell pellet with MDSF.
29. Resuspend the cell pellet (mostly representing isolated primary rat alveolar epithelial type II cells) in 5 mL of wash media/rat preparation.
30. Count the resuspended cells and adjust the volume of the cell suspension to yield 2 × 10⁶ cells/mL.
Note: For a very detailed protocol paper on the preparation of primary rat alveolar epithelial cells, readers are referred to: Jansing NL, McClendon J, Kage H, Sunohara M, Alvarez JR, Borok Z, Zemans RL. Isolation of Rat and Mouse Alveolar Type II Epithelial Cells. Methods Mol Biol. 2018;1809:69–82. doi: 10.1007/978-1-4939-8570-8_6. PMID: 29987783; PMCID: PMC10323965.
For readers who are new to handling rodents, anesthetizing rodents, and opening rodent chest cavities, refer to the following sources:
Aseptic techniques: Cell culture basics [https://youtu.be/nr1tV_LuqJk]
Handling and restraint of rats (using a lab coat) [https://youtu.be/Jg2vztnKg2M]
Handling a rat [https://youtu.be/kVwtJAbik2c]
Rat anesthesia procedure [https://youtu.be/m5sps2zLA-s]
How to give a subcutaneous injection to a rat: Administration procedure video; SC sites & techniques [https://youtu.be/POm9q0LaeZs]
Intraperitoneal injection in rats [https://youtu.be/_8CwrSLfdpo]
Intraperitoneal route of drug administration in rats [https://youtu.be/exyjtGH-UME]
Rat dissection: Thoracic cavity and circulatory system [https://youtu.be/RcNR3pct3N4]
Rat dissection: Anatomical and physiological examination using rat's anatomy [https://youtu.be/vl1OWY_n1QM]
Rat dissection: Organs and body cavities [https://youtu.be/9q1C-qvtNQU]
Exploring the bronchial tree: Lung dissection [https://youtu.be/COHGT0msexQ]
Alveoli of lung with Dr. Masi [https://youtu.be/vmzJbp2UK_I]
How to isolate cells in three easy steps using MACS MicroBeads [https://youtu.be/JQQlXL0O4uw]
The following three videos deal with the isolation of mouse lung alveolar epithelial cells and can be helpful for beginners to learn cell isolation/culture basics:
How to prepare viable single cell suspensions from mouse lung tissue [https://youtu.be/TJmLGqJVMDM]
Dissociation of mouse lung tissue into a single-cell suspension [https://www.stemcell.com/mouse-lung-dissociation-into-single-cell-suspension.html]
How to prepare a single-cell suspension from mouse lung tissue [https://youtu.be/2YE4AYc6O1g]
B. Plating isolated primary rat alveolar epithelial type II cells onto Transwells
1. Add 0.25 mL of final cell suspension onto the hollow side of the 6.5 mm Transwells (surface area of the filter = 0.33 cm2)
2. Onto the bottom side of the filter (i.e., basolateral side), add 1 mL of culture fluid (MDS).
Note: For 12 mm Transwells (i.e., 1.13 cm2 surface area of the filter), use 0.5 mL of cell suspension for the apical side and 1.5 mL of culture fluid (MDS) onto the basolateral side.
C. Bioelectric measurements of primary cultured rat alveolar epithelial cell monolayers exposed apically to NP and control [i.e., culture fluid (MDS)]
1. After 3–4 days in culture in the 5% CO2 incubator at 37 °C, place the Transwell plates onto the bench of the laminar flow hood.
2. Measure background transepithelial resistance and potential difference for the monolayer designated as background Transwell (i.e., a Transwell filter well bathed with 0.25 mL and 1.0 mL of culture fluid for the apical and basolateral side, respectively) using EVOM2 with adjustable electrodes, STX3.
Note: Electrodes will be dipped in the distilled water, followed by 100% ethanol, and finally in PBS for about 3 min each, shaking off excess fluid at each step of immersion. Put the PBS-equilibrated STX3 electrodes into a blank Transwell; turn on EVOM2 and flip the FUNCTION switch to OHMS. The meter should display 1000Ω. If not, insert the company-provided test resistor (in lieu of electrodes) and adjust “R ADJ” with a small flat-head screwdriver until the meter shows 1000 Ω. Measure the blank well potential difference (PD) by flipping the FUNCTION switch to MILLIVOLTS.
3. For each cell monolayer, measure transepithelial resistance (Rt) using EVOM2 with the FUNCTION switch to OHMS and spontaneous potential difference (PD) with the FUNCTION switch to MILLIVOLTS using EVOM2 with adjustable electrodes, STX3.
4. Measure background transepithelial resistance and potential difference for the monolayer designated as background using EVOM2 with adjustable electrodes, STX3.
5. On every other day from the initial measurements of Rt and PD, bathing fluids for cultured monolayers are changed with fresh culture media as follows (after measuring Rt and PD for all monolayers): Fluids from the apical and basolateral sides are carefully aspirated away (especially the apical side from which it is highly recommended to aspirate from the inner side wall of the filter about 3–4 mm away from the cell monolayer) and 0.25 mL of fresh culture medium (MDS) is slowly added at the inner side wall of the filter, about 4–5 mm above the cell monolayer (i.e., for the apical side of the cell monolayer), and 1.0 mL of fresh culture fluid is added to the bottom of the filter (i.e., basolateral side).
6. Then, return the Transwell culture plate to the incubator.
Note: A publicly available video (https://youtu.be/tczv1BTEbX0) is helpful for beginners to get acquainted with the Rt measuring device, actual measurements, and calculation of Rt.
D. Assessment of bioelectric properties of primary cultured rat alveolar epithelial cell monolayers exposed apically to NPs and control (i.e., culture fluid)
1. Measure on a culture day (about 3–5 days in culture) when cell monolayers exhibit 1.5–2 kΩ/cm2 of Rt or higher. Expose at least three monolayers apically to NPs by pipetting out 0.1 mL of apical fluid and adding back 0.1 mL of 2.5 × 400 μg/mL NPs into the apical fluid and stirring very gently by panning the Transwell plates. Control monolayers will receive 0.1 mL of fresh culture fluid after 0.1 mL is taken out from the apical side.
2. At t = 0 (i.e., right after apical fluid was changed as above), measure Rt and PD of cell monolayers and control monolayers.
3. Return the Transwell plates to the incubator.
4. At t = 30 min, 1 h, 2 h, 4 h, 8 h, 12 h, 24 h, 48 h, and 96 h from the initiation of apical NPs exposure, measure Rt and PD of exposed cell monolayers and control monolayers.
Note: Normalization of each bioelectric measurement can be done in order to appreciate the changes as compared to the value at t=0 of each parameter. In order to assess the overall changes as compared to those in the control, the parameter values can also be fully normalized against those for t=0 of the control parameter as shown below (e.g., Rt(t)):
Normalized experimental Rt(t) = corrected experimental Rt(t)/corrected experimental Rt(t=0)
Normalized control Rt(t) = corrected control Rt(t)/corrected control Rt(t=0)
Fully normalized Rt(t) = Normalized experimental Rt(t)/Normalized control Rt(t).
Data analysis
1. Cell monolayer Rt (as an index for passive ion transport resistance across RAECM) and PD (as an index for how much active ion transport occurs) are corrected with background Rt and PD (averaged values of background measurements determined before and after bioelectric measurements utilizing an empty Transwell filter bathed with culture fluid on both sides) with n=3 or more.
2. Ieq (as an index for active ion transport rate across RAECM) is calculated as corrected PD/Rt for each cell monolayer.
3. Using Excel, generate time courses for Rt, PD, and Ieq.
4. Using Prism, perform statistical analyses (e.g., one-way or two-way analysis of variance) with p<0.05 as significant.
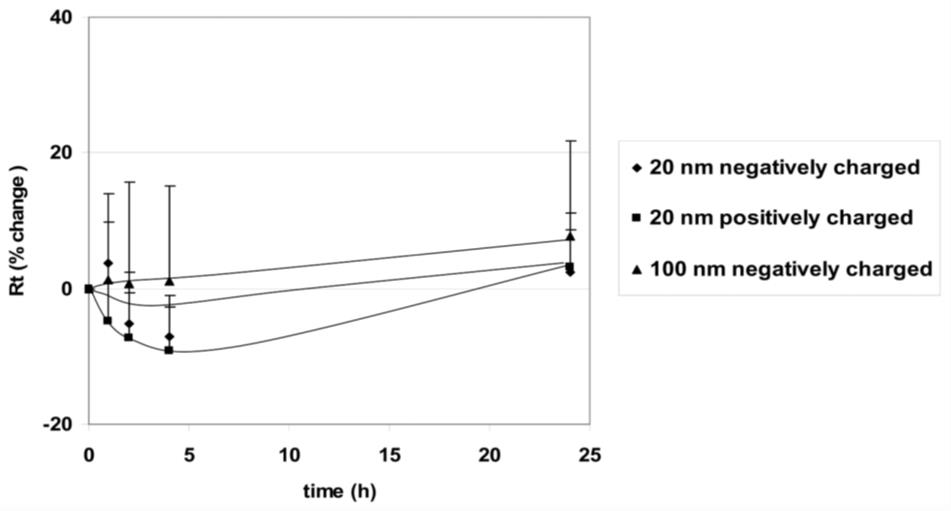
Figure 5. Effects of apical exposure to polystyrene nanoparticles (PNP) (176 μg/mL, 20 nm positively and negatively charged as well as 100 nm negatively charged) on transepithelial resistance (Rt) of rat alveolar epithelial cell monolayer (RAECM) (n = 10–13 for each concentration). Rt of all monolayers prior to apical exposure to PNP (at t = 0) was 3.58 ± 0.11 KΩ.cm2 (n = 47). These three types of PNP, as well as positively charged 120 nm PNP (data not shown), did not cause significant changes in Rt or active ion transport rate (Ieq) (data not shown).
Validation of protocol
This protocol or parts of it has been used and validated in the following research articles:
Yacobi et al. [21]. Nanoparticle effects on rat alveolar epithelial cell monolayer barrier properties. Toxicol In Vitro (Figure 6 in this article was used in the current protocol as Figure 5.)
Kim et al. [22]. Alveolar epithelial cell injury due to zinc oxide nanoparticle exposure. Am J Respir Crit Care Med.
General notes and troubleshooting
1. Please be careful when handling UV, which can damage eyes and skin, and ozone, which is a powerful oxidizer and irritant. Wear appropriate PPE (nitrile gloves, UV-resistant goggles, lab coat at minimum), work in a fume hood, and keep away from any heat sources.
2. From the authors’ experience, a total photoreactor energy dosage of at least 79.2 kWh/m2 at an irradiance of at least 1,100 W/m2, coupled with 120 mg/h of ozone, produces appreciable amounts (typically 10–100 mg per batch, up to 120 mg) of nanoplastics, regardless of bulk plastic source. Thus, they are presented as the critical guidelines for in-house NP generation. It is hypothesized that more resistant plastic species such as polyvinyl chloride (PVC), polytetrafluoroethylene (PTFE), and fluorinated ethylene propylene (FEP), and/or plastics that have not been sufficiently ground, would require a greater irradiance, total energy dosage, ozone exposure, or all three.
3. The DLS results (Figure 4) shown in this protocol are given as references only. The actual size distribution of generated NP will vary depending on many factors, including grind quality, irradiance, ozone flow rate, overall age of the sample, etc., but, in our experience, will usually be in the 40–800 nm range. Furthermore, DLS measures hydrodynamic size, which is generally larger than the “physical” TEM size, and we found that NP will tend to aggregate during the dropcast preparation step for TEM, which can make distinguishing individual particles difficult. Finally, the TEM images are intended to emphasize morphology rather than size differences.
4. Sorasan et al. [16] evaluated the mechanisms of MP/NP generation and how to reliably detect and quantify them. In addition, work by Merdy and coworkers [18] and Parker et al. [19], among others, described nanoplastic production methods, but they often produce pristine, uniform spherical beads [18] or require the use of very expensive specialty equipment (e.g., cryogenic ball mill [20]). These methods, while useful for researchers, do not produce NPs that are as representative of true nano-sized environmental waste as those described by us herein (i.e., our methods focus on maximizing the production throughput of environmentally relevant NPs), alongside measuring biological impact on a barrier in the lung where NPs enter by inhalation.
5. The method published by Sorasan et al. [16] requires sieving of the collected marine plastic waste to <5 mm. This might result in a significant loss of larger plastic specimens. By grinding the source plastic instead of sieving, virtually 100% of the plastic sample can be subjected to the weathering treatment.
6. The method published by Sorasan et al. [16] only uses atmospheric oxygen as an oxidant. Our method uses ozone, a much more powerful oxidizing agent. In doing so, surface chemistry changes on the surface of the NPs due to weathering will be far more likely to be observed and will happen far quicker than relying on O2 alone.
7. The method published by Sorasan et al. [16] uses flow cytometry, among other expensive techniques like total organic carbon (TOC) and laser diffractometry analysis, to quantify the plastic fragments generated. In contrast, our methods produce many more NPs per unit mass of starting material, only requiring simple weighing for quantitation, and such that the residue of nanoplastics is physically visible and obvious even after filtration.
8. The method published by Sorasan et al. [16] reports a relatively low yield of NPs and a much higher yield of large microplastics (MPs, 10–100 µm) in the range of 0.2%–2.5% of initial plastic load. This is perhaps due to the lower surface area of the initial plastic fragments, which were as large as 5 mm. By contrast, the present protocol produces much greater yields of nanoplastics, on the order of 0.1%–1.2% of starting material mass (~10–120 mg of NPs per 10 g of pulverized plastic waste).
9. The method published by Sorasan et al. [16] lacks several important steps, such as fluorescent labeling of the NPs after they are produced, tracking of the NPs, or any biological assays measuring the impact of the NPs.
10. In our current work, the weathered pulverized plastic that could not be filtered out with the 800 nm filter could be reused for further weathering or used for other studies.
11. The lamp light source chosen for photoaging would ideally be designed for “solar simulation,” i.e., the lamp’s output spectrum and irradiance mimics that of sunlight. Typically, mercury, xenon, or mercury-xenon lamps are best suited for this. Furthermore, the lamp power must be high enough to produce the 1,100 W/m2 irradiance requirement. See Figure 6 for an example solar spectrum and Figure 7 for the output spectra of various Newport Instruments solar simulator lamps. Note the spectral peaks at 250–500 nm.
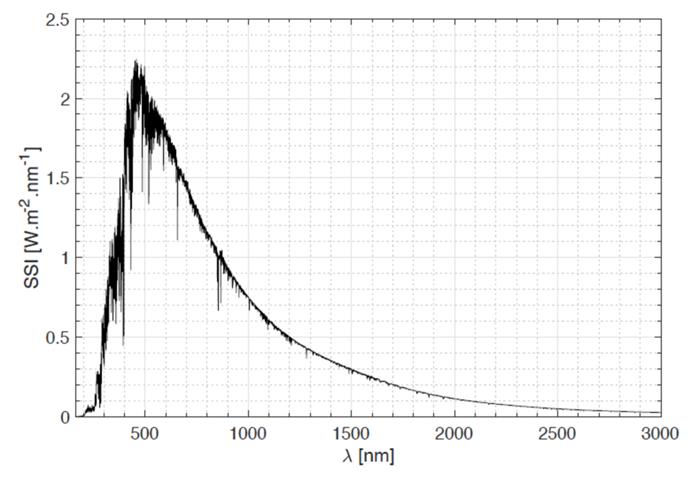
Figure 6. Typical solar reference spectrum. (Source: European Space Agency, https://www.esa.int/ESA_Multimedia/Images/2017/12/Solar_spectrum)
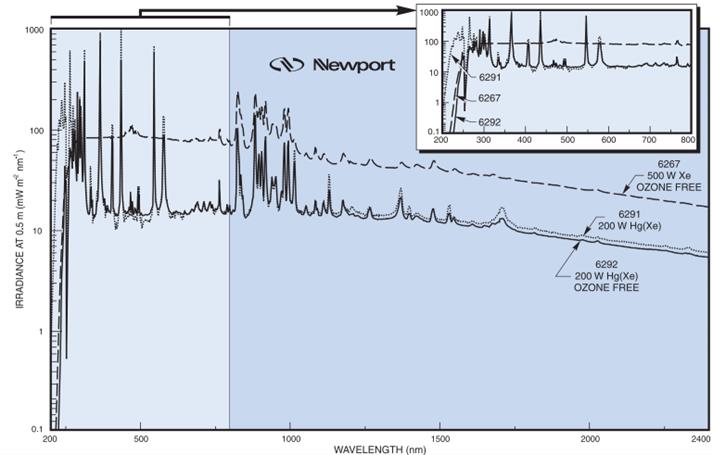
Figure 7. Typical output spectrum for Newport Xe and Hg-Xe solar simulator lamps. (Source: Oriel Product Training manual, https://www.newport.com/medias/sys_master/images/images/hfb/hdf/8797196451870/Light-Sources.pdf)
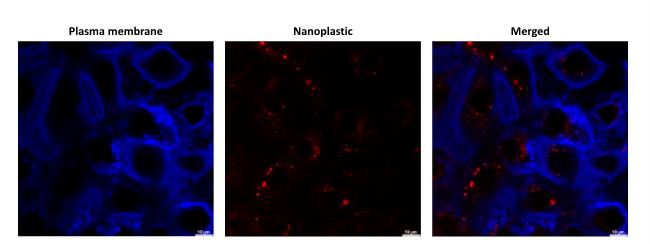
Figure 8. Representative confocal images of Nile Red–labeled nanoplastic (NP) uptake into the primary cultured rat alveolar epithelial cell monolayer (RAECM). On culture day 4, RAECM was exposed apically to Nile Red–labeled polystyrene NP (red) for 48 h. Accumulation of NP in intracellular vesicles was observed in the merged image. Plasma membranes of alveolar epithelial cells were labeled by DyLight 405-conjugated tomato lectin (blue). Scale bars represent 10 µm.
Acknowledgments
This work was supported in part by the Will Rogers Motion Picture Pioneers Foundation, Whittier Foundation, Hastings Foundation, National Science Foundation (CBET-2343747), USC Center of Excellence in NanoBiophysics for DLS instrument usage, and USC Core Center of Excellence in NanoImaging for TEM support. R.C. was the recipient of a USC Ershaghi Center for Energy Transition Fellowship sponsored by the Chevron Corporation. E.D.C. is Hastings Professor at the USC Keck School of Medicine.
Competing interests
Authors declare no conflict of interest.
References
- Enders, K., Lenz, R., Stedmon, C. A. and Nielsen, T. G. (2015). Abundance, size and polymer composition of marine microplastics ≥ 10 μm in the Atlantic Ocean and their modelled vertical distribution. Mar Pollut Bull. 100(1): 70–81. https://doi.org/10.1016/j.marpolbul.2015.09.027
- Lamichhane, G., Acharya, A., Marahatha, R., Modi, B., Paudel, R., Adhikari, A., Raut, B. K., Aryal, S. and Parajuli, N. (2022). Microplastics in environment: global concern, challenges, and controlling measures. Int J Environ Sci Technol. 20(4): 4673–4694. https://doi.org/10.1007/s13762-022-04261-1
- Wong, J. K. H., Lee, K. K., Tang, K. H. D. and Yap, P. S. (2020). Microplastics in the freshwater and terrestrial environments: Prevalence, fates, impacts and sustainable solutions. Sci Total Environ. 719: 137512. https://doi.org/10.1016/j.scitotenv.2020.137512
- Okoffo, E. D. and Thomas, K. V. (2024). Quantitative analysis of nanoplastics in environmental and potable waters by pyrolysis-gas chromatography–mass spectrometry. J Hazard Mater. 464: 133013. https://doi.org/10.1016/j.jhazmat.2023.133013
- Liu, L., Xu, K., Zhang, B., Ye, Y., Zhang, Q. and Jiang, W. (2021). Cellular internalization and release of polystyrene microplastics and nanoplastics. Sci Total Environ. 779: 146523. https://doi.org/10.1016/j.scitotenv.2021.146523
- Chen, K. L. and Bothun, G. D. (2013). Nanoparticles Meet Cell Membranes: Probing Nonspecific Interactions using Model Membranes. Environ Sci Technol. 48(2): 873–880. https://doi.org/10.1021/es403864v
- Li, S. and Malmstadt, N. (2013). Deformation and poration of lipid bilayer membranes by cationic nanoparticles. Soft Matter. 9(20): 4969. https://doi.org/10.1039/c3sm27578g
- Moghadam, B. Y., Hou, W. C., Corredor, C., Westerhoff, P. and Posner, J. D. (2012). Role of Nanoparticle Surface Functionality in the Disruption of Model Cell Membranes. Langmuir. 28(47): 16318–16326. https://doi.org/10.1021/la302654s
- Wiemann, J. T., Shen, Z., Ye, H., Li, Y. and Yu, Y. (2020). Membrane poration, wrinkling, and compression: deformations of lipid vesicles induced by amphiphilic Janus nanoparticles. Nanoscale. 12(39): 20326–20336. https://doi.org/10.1039/d0nr05355d
- Yu, Y. and Granick, S. (2009). Pearling of Lipid Vesicles Induced by Nanoparticles. J Am Chem Soc. 131(40): 14158–14159. https://doi.org/10.1021/ja905900h
- Wang, L., Hartel, N., Ren, K., Graham, N. A. and Malmstadt, N. (2020). Effect of protein corona on nanoparticle–plasma membrane and nanoparticle–biomimetic membrane interactions. Environ Sci: Nano. 7(3): 963–974. https://doi.org/10.1039/d0en00035c
- Hussain, S., Hess, K., Gearhart, J., Geiss, K. and Schlager, J. (2005). In vitro toxicity of nanoparticles in BRL 3A rat liver cells. Toxicol in Vitro. 19(7): 975–983. https://doi.org/10.1016/j.tiv.2005.06.034
- Schraufnagel, D. E. (2020). The health effects of ultrafine particles. Experimental & Molecular Medicine 52(3): 311–317. https://doi.org/10.1038/s12276-020-0403-3
- Alimi, O. S., Claveau-Mallet, D., Kurusu, R. S., Lapointe, M., Bayen, S. and Tufenkji, N. (2022). Weathering pathways and protocols for environmentally relevant microplastics and nanoplastics: What are we missing? J Hazard Mater. 423: 126955. https://doi.org/10.1016/j.jhazmat.2021.126955
- Dierkes, G., Lauschke, T., Becher, S., Schumacher, H., Földi, C. and Ternes, T. (2019). Quantification of microplastics in environmental samples via pressurized liquid extraction and pyrolysis-gas chromatography. Anal Bioanal Chem. 411(26): 6959–6968. https://doi.org/10.1007/s00216-019-02066-9
- Sorasan, C., Edo, C., González-Pleiter, M., Fernández-Piñas, F., Leganés, F., Rodríguez, A. and Rosal, R. (2022). Ageing and fragmentation of marine microplastics. Sci Total Environ. 827: 154438. https://doi.org/10.1016/j.scitotenv.2022.154438
- Chen, W., D’Argenio, D. Z., Sipos, A., Kim, K. J. and Crandall, E. D. (2021). Biokinetic modeling of nanoparticle interactions with lung alveolar epithelial cells: uptake, intracellular processing, and egress. Am J Physiol Regul Integr Comp Physiol. 320(1): R36–R43. https://doi.org/10.1152/ajpregu.00184.2020
- Merdy, P., Delpy, F., Bonneau, A., Villain, S., Iordachescu, L., Vollertsen, J. and Lucas, Y. (2023). Nanoplastic production procedure for scientific purposes: PP, PVC, PE-LD, PE-HD, and PS. Heliyon. 9(8): e18387. https://doi.org/10.1016/j.heliyon.2023.e18387
- Parker, L. A., Höppener, E. M., van Amelrooij, E. F., Henke, S., Kooter, I. M., Grigoriadi, K., Nooijens, M. G. A., Brunner, A. M. and Boersma, A. (2023). Protocol for the production of micro- and nanoplastic test materials. Microplast Nanoplast. 3(1): 1–11. https://doi.org/10.1186/s43591-023-00058-2
- Karakolis, E. G., Nguyen, B., You, J. B., Rochman, C. M. and Sinton, D. (2019). Fluorescent Dyes for Visualizing Microplastic Particles and Fibers in Laboratory-Based Studies. Environ Sci Technol Lett. 6(6): 334–340. https://doi.org/10.1021/acs.estlett.9b00241
- Yacobi, N. R., Phuleria, H. C., Demaio, L., Liang, C. H., Peng, C. A., Sioutas, C., Borok, Z., Kim, K. J. and Crandall, E. D. (2007). Nanoparticle effects on rat alveolar epithelial cell monolayer barrier properties. Toxicol in Vitro. 21(8): 1373–1381. https://doi.org/10.1016/j.tiv.2007.04.003
- Kim, Y. H., Fazlollahi, F., Kennedy, I. M., Yacobi, N. R., Hamm-Alvarez, S. F., Borok, Z., Kim, K. J. and Crandall, E. D. (2010). Alveolar Epithelial Cell Injury Due to Zinc Oxide Nanoparticle Exposure. Am J Respir Crit Care Med. 182(11): 1398–1409. https://doi.org/10.1164/rccm.201002-0185oc
- Yacobi, N. R., Fazllolahi, F., Kim, Y. H., Sipos, A., Borok, Z., Kim, K. J. and Crandall, E. D. (2010). Nanomaterial interactions with and trafficking across the lung alveolar epithelial barrier: implications for health effects of air-pollution particles. Air Qual Atmos Health. 4(1): 65–78. https://doi.org/10.1007/s11869-010-0098-z
Article Information
Publication history
Received: Jan 30, 2025
Accepted: Apr 26, 2025
Available online: May 18, 2025
Published: Jun 5, 2025
Copyright
© 2025 The Author(s); This is an open access article under the CC BY license (https://creativecommons.org/licenses/by/4.0/).
How to cite
Chairil, R., Alvarez, J. R., Sipos, A., Malmstadt, N., Crandall, E. D. and Kim, K. J. (2025). In-house Fabrication of Nanoplastics of Tunable Composition and Application: Assessment of Bioelectric Changes in Primary Rat Lung Alveolar Epithelial Cell Monolayers Exposed to Nanoplastics. Bio-protocol 15(11): e5329. DOI: 10.21769/BioProtoc.5329.
Category
Environmental science > Ecosystem
Cell Biology > Cell-based analysis > Electrophysiological technique
Biological Engineering
Do you have any questions about this protocol?
Post your question to gather feedback from the community. We will also invite the authors of this article to respond.