- Protocols

- Articles and Issues
- For Authors
- About
- Become a Reviewer

A New Approach to Detect and Semi-quantify All Molecular Species and Classes of Anionic Phospholipids Simultaneously in Plant Samples
Published: Vol 15, Iss 8, Apr 20, 2025 DOI: 10.21769/BioProtoc.5282 Views: 1727
Reviewed by: Pooja VermaPooja SaxenaSamik Bhattacharya
Original research article
The authors used this protocol in:
Feb 2024
Advertisement


Protocol Collections
Comprehensive collections of detailed, peer-reviewed protocols focusing on specific topics


Abstract
Membranes are very complex and dynamic structures that are essential for plant cellular functions and whose lipidic composition can be influenced by numerous factors. Anionic phospholipids, which include phosphatidylserine, phosphatidic acid, phosphatidylinositol, and phosphoinositides are key components of these membranes as they are involved in plant cell signaling and as even slight modifications in their quantities may largely impact the cell metabolism. However, the presence of these compounds in low amounts, as well as their poor stability during analysis by mass spectrometry, make their study very complicated. In addition, the precise quantification of all anionic phospholipid species is not possible by lipid separation using thin-layer chromatography followed by the analysis of their fatty acyl chains by gas chromatography. Here, we describe a straightforward strategy for the extraction and semi-quantification of all anionic phospholipid species from plant samples. Our method is based on the derivatization of the anionic phospholipids, and more especially on their methylation using trimethylsilyldiazomethane, followed by analysis by high-performance liquid chromatography coupled with a triple quadrupole mass spectrometer. This approach allows largely improving the sensitivity of the analysis of anionic phospholipids from plant samples, which will help to gain deeper insights into the functions and dynamics of these key parts of plant cellular signaling.
Key features
• Extraction, derivatization, and semi-quantification of anionic phospholipids (PA, PS, PI, PIPs) from plant samples.
• The methylation of anionic phospholipids using trimethylsilyldiazomethane largely improves their stability and therefore the sensitivity of the analysis.
• HPLC-QQQ-MS/MS analysis allows the semi-quantification of all methylated anionic phospholipids with high sensitivity.
• Allows to investigate the diversity and dynamics of anionics phospholipids in a wide range of plant samples (leaves, cultivated cells, membranes, …).
Keywords: Anionic phospholipidsBackground
Anionic phospholipids include phosphatidic acid (PA), phosphatidylserine (PS), and phosphatidylinositol (PI) species, as well as the phosphorylated form of the latter, namely monophosphate phosphoinositide (PIP) and bisphosphate phosphoinositide (PIP2) molecules in plants. These compounds form a structurally diversified class of membrane lipids since a high variety of fatty acyl chains can be found esterified in these different negatively charged phospholipids, making their analysis very challenging. However, anionic phospholipids display key functions in plant cells as they are components of the plasma membrane and are involved in a variety of cellular processes. Notably, anionic phospholipids are essential components of plant membrane signatures, allowing their recognition by specific enzymes; they can also modulate their physicochemical properties (such as charge and curvature) in response to environmental features. These lipids also play important roles in signal transmission as their accumulation is very dynamic and regulated by many enzymes; they can be quickly degraded or metabolized for the production of secondary messengers [1].
While mass spectrometry, through a direct infusion approach or in combination with liquid chromatography, is generally the method of choice for lipidomic analysis, the low abundance of anionic phospholipids as well as their poor stability and ionization efficiency during analysis increase the difficulty of their profiling and quantification, notably from plant samples. Indeed, sensitivity problems as well as low peak resolution are highlighted. For this reason, a multi-step approach is generally used for the analysis of anionic phospholipids by combining the separation of their different classes by preparative thin-layer chromatography and the analysis of their fatty acyl chains by gas chromatography. While this method allows us to understand the diversity in the fatty acyl chains of each class of anionic phospholipids, it does not give a comprehensive view of the diversity of anionic phospholipids in plant samples.
Based on the fact that methylation improves anionic lipid ionization efficiency, we developed a straightforward method for the extraction and semi-quantification of all classes of anionic phospholipids (Table S1) from plant samples by HPLC–MS/MS following their methylation using trimethylsilyldiazomethane [2]. Our results highlight not only the successful application of this method to a large set of plant samples (e.g., leaves, roots, purified membranes, and cultivated cells) but also the great improvement in the sensitivity of anionic phospholipids analyses in comparison with the same lipids analyzed without being methylated. Notably, methylation improved the wide peak shape and therefore enhanced the precision of the analysis. Our method therefore paves the way for the development of straightforward methods allowing the profiling and quantification of anionic phospholipids with high precision and sensitivity, not only from plant samples but also from other biological materials.
Materials and reagents
Biological materials
1. Plant material, dried or fresh: can be leaves, roots, or purified organelles
Reagents
1. MilliQ water (Elga, Purelab Flex)
2. Methanol (MeOH), LC-MS grade (Fisher, catalog number: M/4062/17)
3. Chloroform (CHCl3), analytical reagent grade (Fisher, catalog number: C/4960/17)
4. Hydrochloric acid 37% (HCl) (Sigma-Aldrich, catalog number: 258148)
5. Acetic acid (CH3COOH) (Sigma-Aldrich, catalog number: A6283)
6. Isopropanol (Sigma, catalog number: I9516)
7. Formic acid (Sigma, catalog number 33015)
8. Ammonium formate (NH4CO2) (Sigma, catalog number 70221)
8. 17:0-14:1 PI (Avanti Polar Lipids, catalog number: LM1504)
9. 15:0-18:1 PA (Avanti Polar Lipids, catalog number: 330721)
10. 17:0-14:1 PS (Avanti Polar Lipids, catalog number: LM1304)
11. 17:0-20:4 PIP (Avanti Polar Lipids, catalog number: LM1901)
12. 17:0-20:4 PIP2 (Avanti Polar Lipids, catalog number: LM1905)
13. Trimethylsilyldiazomethane 2M solution in hexane (TMS) (Thermo Scientific, catalog number: 385330250)
14. Nitrogen (N2) (Messer, 5.0)
Solutions
1. Extraction mix (see Recipes)
2. Pre-derivatization mix (see Recipes)
3. Post-derivatization mix (see Recipes)
4. Eluent A (see Recipes)
5. Eluent B (see Recipes)
Recipes
1. Extraction mix
| Reagent | Final concentration | Quantity or Volume |
|---|---|---|
| Methanol | n/a | 484 mL |
| Chloroform | n/a | 242 mL |
| HCl (1 M) | 32.1 mM | 24.2 mL |
| Total | n/a | 750.2 mL |
2. Pre-derivatization mix
| Reagent | Final concentration | Quantity or Volume |
|---|---|---|
| Methanol | n/a | 12 mL |
| Chloroform | n/a | 24 mL |
| HCl (0.01 M) | 2 mM | 9 mL |
| Total | n/a | 45 mL |
3. Post-derivatization mix
| Reagent | Final concentration | Quantity or Volume |
|---|---|---|
| Methanol | n/a | 12 mL |
| Chloroform | n/a | 24 mL |
| H2O | n/a | 9 mL |
| Total | n/a | 45 mL |
4. Eluent A
| Reagent | Final concentration | Quantity or Volume |
|---|---|---|
| Methanol | n/a | 400 mL |
| NH4CO2 50 mM in methanol | 10 mM | 200 mL |
| H2O | n/a | 400 mL |
| Formic acid | 26 mM | 1 mL |
| Total | n/a | 1,001 mL |
5. Eluent B
| Reagent | Final concentration | Quantity or Volume |
|---|---|---|
| Isopropanol | n/a | 800 mL |
| NH4CO2 50 mM in methanol | 10 mM | 200 mL |
| Formic acid | 26 mM | 1 mL |
| Total | n/a | 1,001 mL |
Laboratory supplies
1. Eppendorf tubes, 2 mL (Sarstedt, catalog number: 72.691)
2. Eppendorf tubes, 1.5 mL (Sarstedt, catalog number: 72.706)
3. Stainless steel beads, 5 mm (Qiagen, catalog number 69989)
4. 2 mL HPLC vials (Agilent, catalog number: 5182-0714)
5. 250 μL glass inserts (Agilent, catalog number: 5183-2085)
Equipment
1. Scientific balance, 0.1 mg precision (BEL Engineering, model: ULTRA MARK 210)
2. Cell lyser (QIAGEN, model: TissueLyser II)
3. Vortex Genie 2 (Scientific industries, model: G-560E)
4. Centrifuge operating at room temperature (Thermo Scientific, model: HERAEUS PICO 17)
5. Evaporator (Toutlemonde, model: T52B)
6. Ultrasonic bath (Advantage-lab, model: AL04-06)
7. Column Supelcosil ABZ PLUS C18 10 cm × 2.1 mm, 3 μm (Merck)
8. Ultra-high-performance liquid chromatography (Agilent, model: 1290 Infinity II LC system)
9. Mass spectrometer (Sciex, model: QTrap 6500)
Software and datasets
1. MultiQuant (Sciex, AB Sciex 3.0.3)
2. Analyst (Sciex, AB Sciex 1.6.2)
Procedure
A. Lipid extraction
1. Lipid extraction is performed at room temperature.
2. Weigh approximately 20–30 mg of fresh plant material or 2–3 mg of dried plant material (or equivalent for organelle purification) and transfer it to a 2 mL Eppendorf tube.
3. Add 725 μL of extraction mix (see Recipes) and 175 μL of Milli-Q water.
4. Grind three times for 30 s using a cell lyser after the addition of metal beads.
5. Add 10 ng of each internal standard: PI 17:0-14:1; PA 15:0-18:1; PS 17:0-14:1; PIP 17:0-20:4; and PIP2 17:0-20:4.
6. Add 750 μL of CHCl3 and 170 μL of HCl 2 M.
7. Vortex and centrifuge at 200× g for 5 min.
8. Discard the upper phase and transfer the lower phase into a 2 ml Eppendorf tube.
9. Add 708 μL of the upper phase of pre-derivatization mix (see Recipes).
10. Vortex and centrifuge at 200× g for 3 min.
11. Discard the upper phase.
12. Repeat the wash steps A9–10 on the lower phase.
13. Remove the upper phase and put at -20 °C overnight.
B. Derivatization
1. Derivatization steps are performed at room temperature.
2. Transfer the lower organic phase to a new 2 mL Eppendorf tube, without taking the drop of water that has formed above the organic phase.
3. Add 50 μL of TMS, shake by hand, and wait 10 min at room temperature.
4. Neutralize the reaction by adding 6 μL of acetic acid.
5. Add 700 μL of the upper phase of post-derivatization mix (see Recipes).
6. Vortex and centrifuge at 200× g for 3 min.
7. Discard the upper phase and repeat steps B5–6.
8. Take the lower phase and transfer to a new 1.5 mL Eppendorf tube.
9. Add 100 μL of MeOH/H2O (9:1; v:v) and vortex for at least 5 s.
10. Evaporate under nitrogen until only one drop remains.
11. Add 80 μL of MeOH and sonicate for 1 min in an ultrasound bath.
12. Add 20 μL of Milli-Q water and sonicate for 1 min in an ultrasound bath.
13. Centrifuge at 200× g for 3 min and transfer to a 250 μL restrictor in a 2 mL HPLC vial.
C. LC–MS method
1. Separate the anionic species on an LC 1200 Infinity II system equipped with a SUPELCOSILTM ABZ PLUS, 10 cm × 2.1 mm, 3 μm, Merck column. Set the column temperature to 40 °C, the flow to 0.2 mL/min, and the injection volume to 10 μL. The separation follows the gradient (Table 1).
Table 1. Solvent gradient
| Time (min) | Eluant A (%) | Eluant B (%) | Flow (mL/min) |
|---|---|---|---|
| 0–20 | 55 | 45 | 0.2 |
| 20–40 | 40 | 60 | 0.2 |
| 40–50 | 20 | 80 | 0.2 |
| 50–61 | 0 | 100 | 0.2 |
| 61–68 | 55 | 45 | 0.2 |
2. Subject the HPLC eluate to coupled electrospray ionization in the positive ionization mode and to subsequent tandem MS analysis on a QTrap 6500 mass spectrometer. Optimize settings for this equipment as shown in Table 2 to have a better intensity during fragmentation for each anionic lipid class.
Table 2. Parameters for each anionic lipid class
| Analyte | DP (V) | EP (V) | CE (V) | CXP (V) |
|---|---|---|---|---|
| PA | 10 | 100 | 26 | 19 |
| PS | 10 | 100 | 34 | 24 |
| PI | 10 | 100 | 31 | 25 |
| PIP2 | 10 | 100 | 45 | 32 |
| PIP | 10 | 100 | 32 | 24 |
3. Quantify the different anionic lipid species using the multiple reaction monitoring (MRM) transition information found in Table S2. An example of an MRM chromatogram is shown in Figure 1.
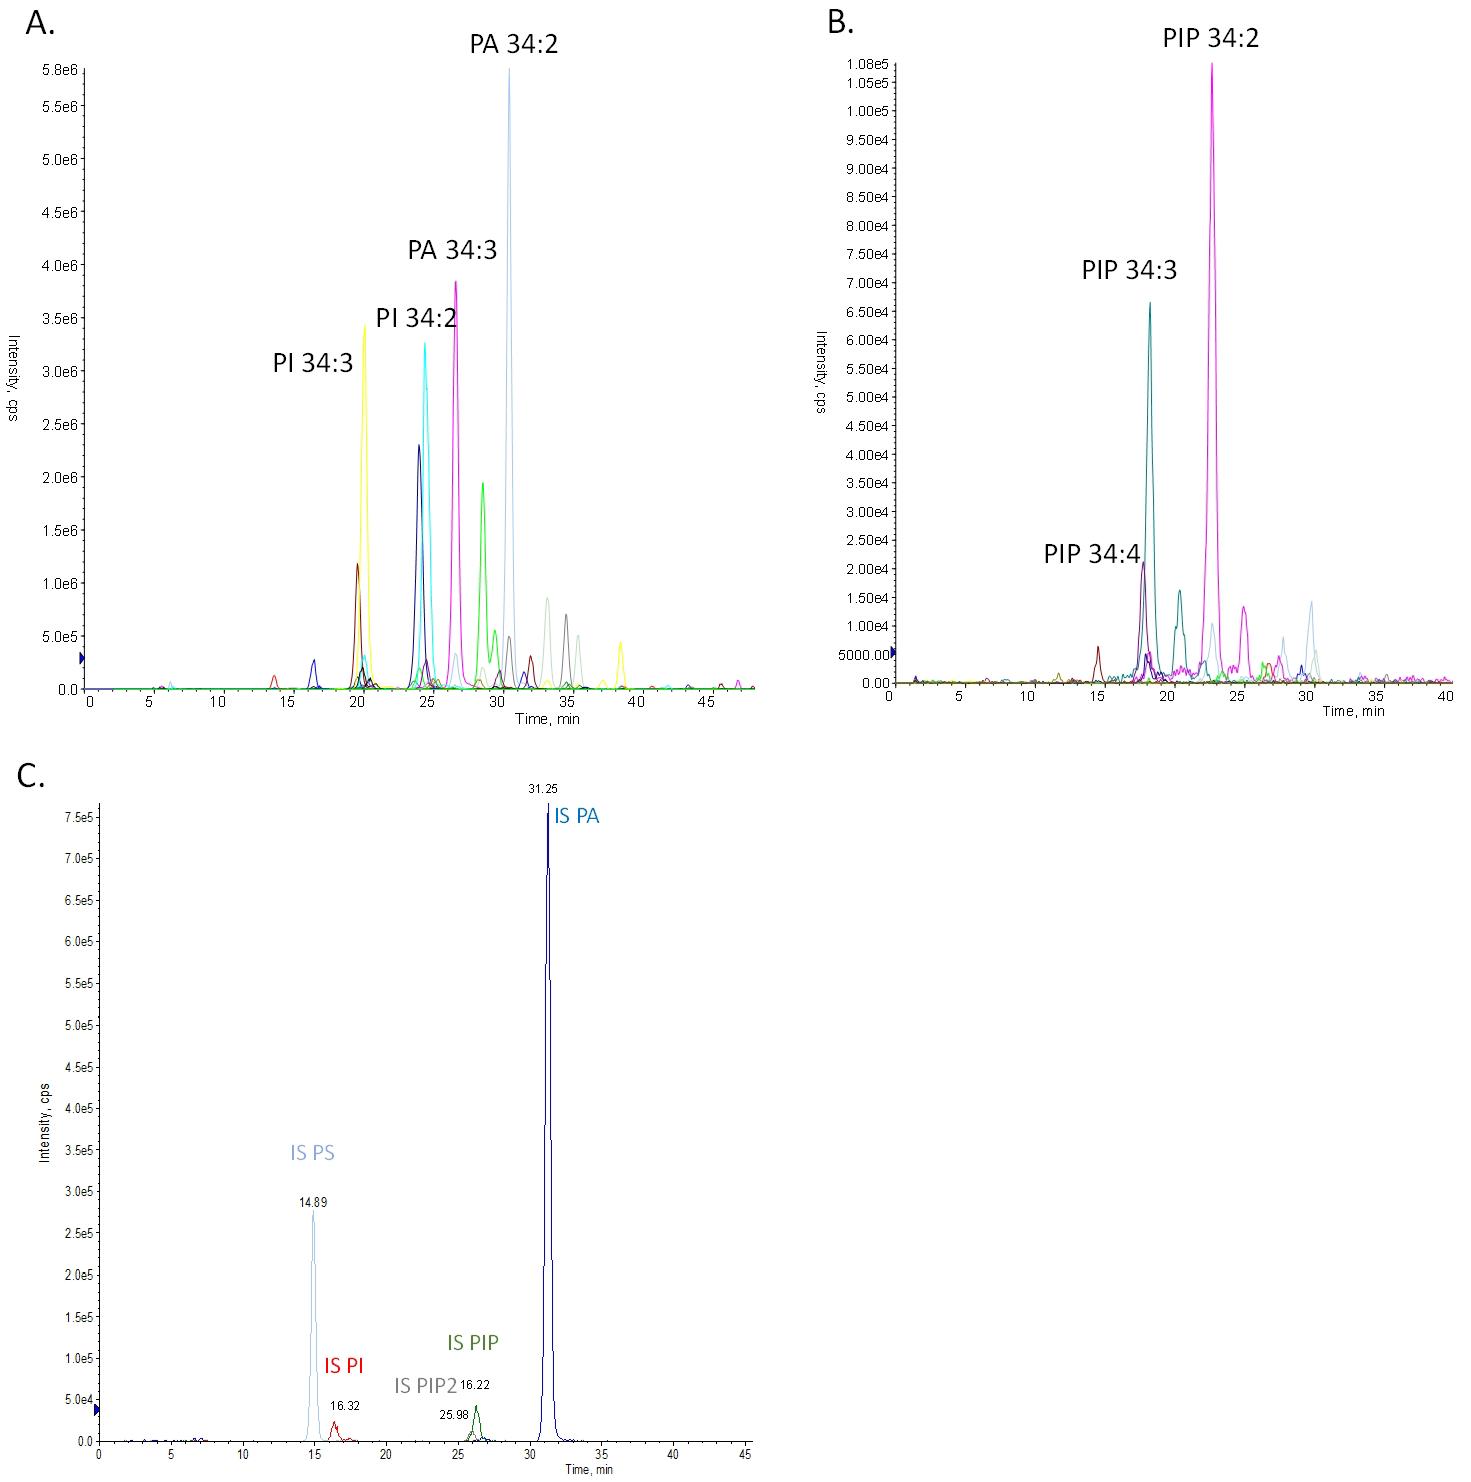
Figure 1. Multiple reaction monitoring (MRM) chromatograms of all search transitions for PA, PS, PI, PIP, and PIP2 lipid species for Arabidopsis thaliana 4-week-old leaves. Each color corresponds to a transition for a specific anionic species. (A) MRM chromatograms of all anionic species. (B) Focus on chromatograms of PIP species. (C) Chromatogram of internal standard transitions for PA, PS, PI, PIP, and PIP2 lipids: PS 17:0-14:1 in clear blue, PI 17:0-14:1 in red, PIP2 17:0-20:4 in gray, PIP 17:0-20:4 in green, and PA 15:0-18:1 in blue. Intensities of the detected signals are expressed in counts per second (cps).
Data analysis
1. Define the integration parameters in MultiQuant.
a. Integration algorithm MQ4.
b. Gaussian smooth width 1.0 points.
c. Noise percentage: 40.0%.
2. Integrate all samples using the MultiQuant method and report the area under the peaks for each MRM.
3. Present the results as a ratio corresponding to the area of molecular lipid species and the area of the corresponding internal standard. The results can be expressed in arbitrary units (A.U.)
Validation of protocol
This protocol or parts of it has been used and validated in the following research articles:
• Genva et al. [2]. A global LC-MS2 -based methodology to identify and quantify anionic phospholipids in plant samples. Plant J. (Figure 8)
• Bahammou et al. [3]. A combined lipidomic and proteomic profiling of Arabidopsis thaliana plasma membrane. Plant J. (Figures 7 and 8)
• Pérez-sancho et al. [4]. Plasmodesmata act as unconventional membrane contact sites regulating inter-cellular molecular exchange in plants. Cell. (Figure 4B)
General notes and troubleshooting
General notes
1. One of the limitations of our method is that the ionization of each class of anionic lipids is not the same. In particular, the ionization of PA is really efficient; the limit of detection of that class of lipids is 0.19 pg [2]. So, the chromatogram shows mainly PA species, even if PA is not the major class in the sample.
2. The phosphate group in PIP and PIP2 species can have different positions on the inositol group, such as PI3P with the phosphate group in the third position on the inositol or PI4P in the fourth position. One of the limitations of our method is that PI3P and PI4P species cannot be differentiated.
3. This protocol takes two days to complete. We recommend carrying out the injections directly after derivatization. The main costs of this protocol are mainly due to the use of the LC–MS system.
Supplementary information
The following supporting information can be downloaded here:
1. Table S1. List of the anionic lipids
2. Table S2. List of MRM transitions. All MRM are made in the positive ionization mode. Q1 corresponds to the mass of the parent ions and Q3 to the mass of the fragment (daughter ion); ID corresponds to the specific transition. IS indicates the internal standard.
Acknowledgments
We thank the Bordeaux-Metabolome platform for lipid analysis (https://www.biomemb.cnrs.fr/en/lipidomic-plateform/) supported by Bordeaux-Metabolome Facility-MetaboHUB (grant no. ANR-11-INBS-0010 to CMB and LF). Manon Genva thanks the National Fund for Scientific Research (FNRS, Belgium, through grant 2022/V 3/5/053-40010130-JG/JN-2724) and the University of Liège for mobility grants. This work was supported by the French National Research Agency (project ANR PRC PlayMobil, grant no. ANR-19-CE20-0016 and project ANR PRC CALIPSO grant no. ANR-18-CE13-0025 to L.F.). This protocol was used in [2].
Competing interests
The authors declare no competing financial interests.
References
- Dubois, G. A. and Jaillais, Y. (2021). Anionic phospholipid gradients: an uncharacterized frontier of the plant endomembrane network. Plant Physiol. 185(3): 577–592. https://doi.org/10.1093/plphys/kiaa056
- Genva, M., Fougère, L., Bahammou, D., Mongrand, S., Boutté, Y. and Fouillen, L. (2024). A global LC–MS2‐based methodology to identify and quantify anionic phospholipids in plant samples. Plant J. 117(3): 956–971. https://doi.org/10.1111/tpj.16525
- Bahammou, D., Recorbet, G., Mamode Cassim, A., Robert, F., Balliau, T., Van Delft, P., Haddad, Y., Mongrand, S., Fouillen, L., Simon‐Plas, F., et al. (2024). A combined lipidomic and proteomic profiling of Arabidopsis thaliana plasma membrane. Plant J. 119(3): 1570–1595. https://doi.org/10.1111/tpj.16810
- Pérez-Sancho, J., Smokvarska, M., Dubois, G., Glavier, M., Sritharan, S., Moraes, T. S., Moreau, H., Dietrich, V., Platre, M. P., Paterlini, A., et al. (2025). Plasmodesmata act as unconventional membrane contact sites regulating intercellular molecular exchange in plants. Cell. 188(4): 958–977.e23. https://doi.org/10.1016/j.cell.2024.11.034
Article Information
Publication history
Received: Dec 13, 2024
Accepted: Mar 3, 2025
Available online: Apr 3, 2025
Published: Apr 20, 2025
Copyright
© 2025 The Author(s); This is an open access article under the CC BY-NC license (https://creativecommons.org/licenses/by-nc/4.0/).
How to cite
Genva, M., Mirande-Bret, C. and Fouillen, L. (2025). A New Approach to Detect and Semi-quantify All Molecular Species and Classes of Anionic Phospholipids Simultaneously in Plant Samples. Bio-protocol 15(8): e5282. DOI: 10.21769/BioProtoc.5282.
Category
Plant Science > Plant biochemistry > Metabolite
Biochemistry > Lipid > Lipid measurement
Do you have any questions about this protocol?
Post your question to gather feedback from the community. We will also invite the authors of this article to respond.