- Protocols

- Articles and Issues
- For Authors
- About
- Become a Reviewer

A Miniaturized Percoll Gradient Method for Isolation of Quiescent Cells of Yeast

(*contributed equally to this work) Published: Vol 15, Iss 8, Apr 20, 2025 DOI: 10.21769/BioProtoc.5279 Views: 1521
Reviewed by: Fernando A Gonzales-ZubiateLucy XieIsmail Tahmaz
Advertisement


Protocol Collections
Comprehensive collections of detailed, peer-reviewed protocols focusing on specific topics


Abstract
Quiescence, the temporary and reversible exit from proliferative growth, is a fundamental biological process. Budding yeast is a preeminent model for studying cellular quiescence owing to its rich experimental toolboxes and evolutionary conservation across eukaryotic pathways and processes that control quiescence. Yeast quiescent cells are reported to be isolated by the continuous linear Percoll gradient method and identified by combining different features such as cell cycle, heat resistance, and cell morphology (single cell). Generally, 10–25 mL of Percoll isotonic solution is first obtained by mixing Percoll with NaCl in 12.5–30 mL centrifugal tubes. Then, the gradient is prepared at high speed for 15–60 min. Finally, approximately 2 × 10⁹ cells are collected, overlaid onto the preformed gradient, and centrifuged to obtain distinct cell fractions. This method requires more reagents and samples and special centrifuges and centrifuge tubes. Besides the cost, it is less favorable for experiments that require high-throughput analyses with a small volume of sample each time. The protocol described here aims to solve those problems by combining the use of 2 mL centrifugal tubes with density marker beads. The protocol also focuses on how to optimize the buoyant density distribution of the density gradient solution such that the density bands better match those of different fraction cells. This will help fully separate quiescent and non-quiescent cells. The protocol can be easily adapted to a wide variety of unicellular microbes with different buoyancy density differentiation during cultivation, such as yeast and bacteria.
Key features
• Minimized Percoll gradient solution volume by using a 2 mL centrifugal tube.
• Reduced material and sample consumption and requirements for centrifuges and tubes.
• Optimized buoyant density distribution of density gradient solution with the emphasis on Percoll concentration and centrifugation parameters by using density marker beads as indicators.
• Easily adaptable to a wide variety of unicellular microbes with different buoyancy density differentiation during cultivation.
Keywords: Unicellular microbeGraphical overview
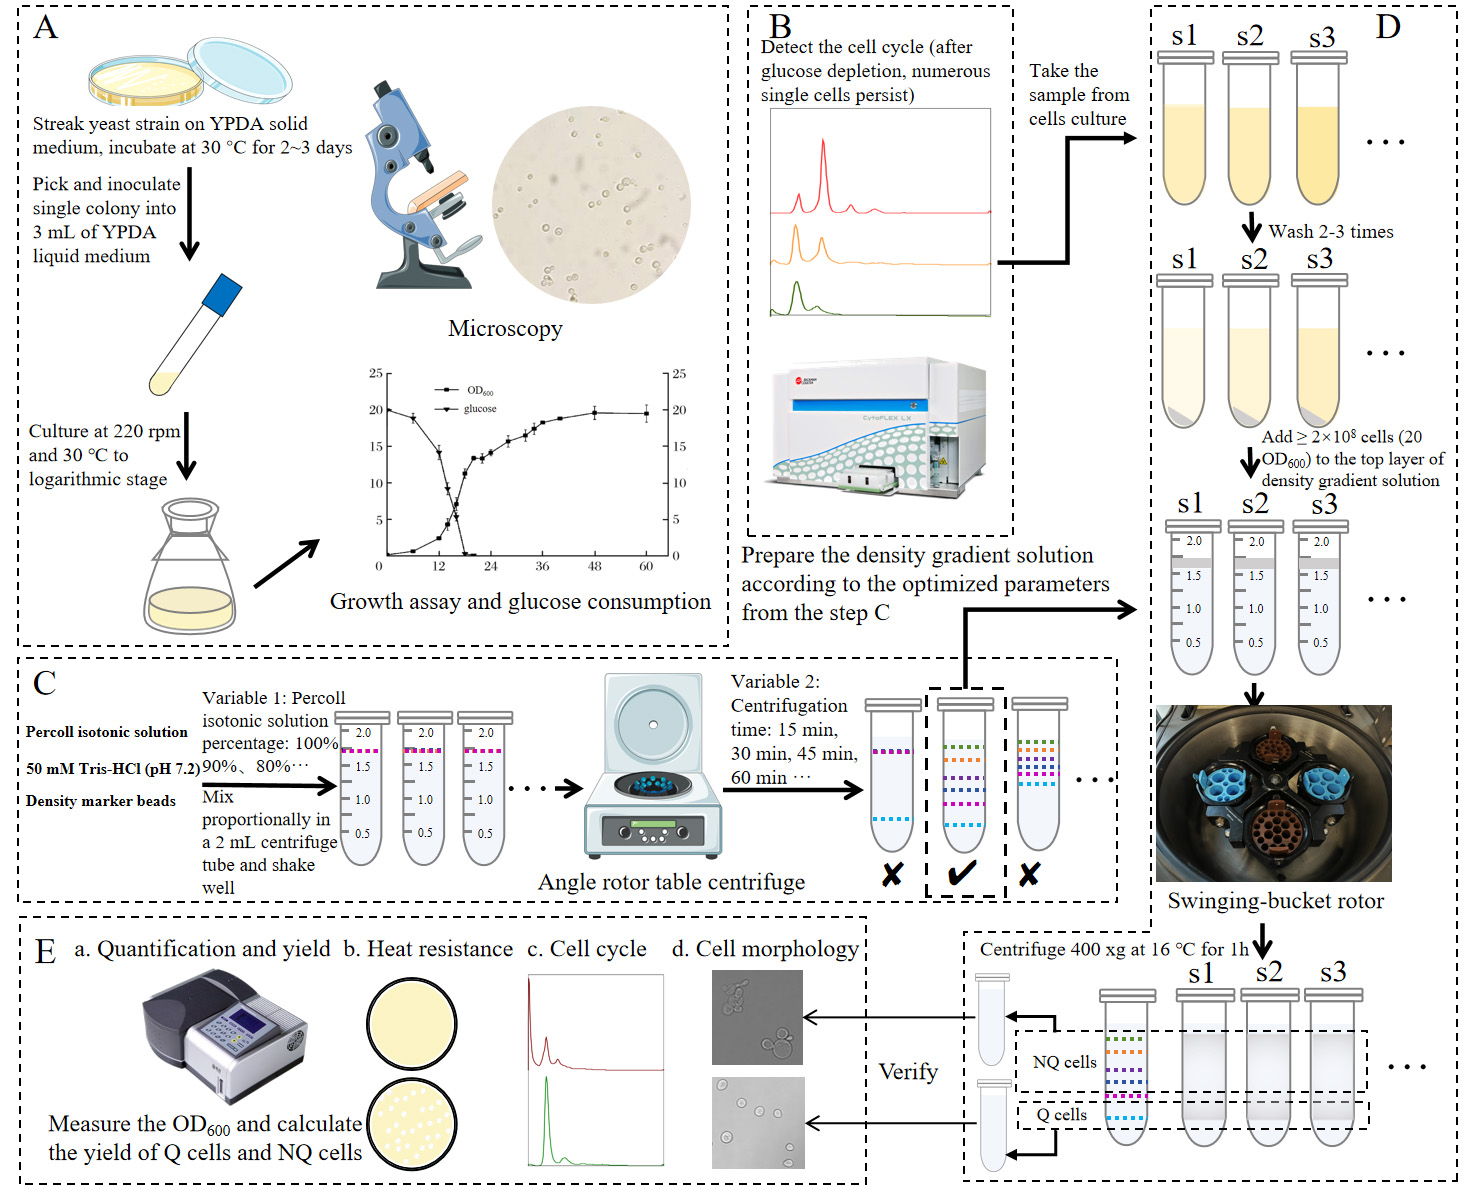
Graphical overview of isolating quiescent cells of yeast using a miniature Percoll gradient method. (A) Strain activation, inoculation, regular sampling, and detection. (B) Cell cycle detection by flow cytometer to determine the time to separate the Q cells. (C) Optimization of Percoll gradient solution preparation to obtain suitable buoyant density distribution in a 2 mL centrifuge tube by using density marker beads. (D) Preparation of density gradient solution and cell suspensions and centrifugation and isolation of Q and NQ cells. (E) Analysis of pre-separation and post-separation cells.
Background
As the temporary and reversible arrest of cell growth, quiescence is a fundamental biological process [1]. The phenomenon of quiescence is commonly present in unicellular microbes, being crucial for their long-term survival under unfavorable conditions [1]. Among them, the budding yeast is a preeminent model system for studying cellular quiescence owing to its rich experimental toolboxes and evolutionary conservation across eukaryotes of pathways and processes that control quiescence [2]. Yeast cell buoyant density has been reported since as early as 1984 [3,4], but its role was determined in 2006 as one of the most important phenotypes of yeast quiescent cells [5]. Heterogeneity within stationary-phase yeast populations was first described by Allen et al. [5]. Two subpopulations were isolated by density centrifugation, and differentiation into quiescent (Q) and non-quiescent (NQ) cells was proposed [5]. Subsequently, the density gradient centrifugation method was followed and used by many other researchers, and more phenotypes of quiescence were reported [6–10]. Generally, 10–25 mL of 90% Percoll solution is obtained by diluting Percoll with 1.5 M NaCl in a 12.5–30 mL centrifugal tube; then, a continuous linear gradient is prepared at high speed for 15–60 min. Finally, approximately 2 × 10⁹ cells (200 OD600) are pelleted, resuspended, overlaid onto the preformed gradient, and centrifuged at 300–400× g for 60 min in a tabletop centrifuge equipped with a swinging bucket rotor. The quiescence phenotypes and corresponding detection methods reported include cell buoyancy density, cell cycle, thermotolerance, cell morphological changes, cell wall thickening, Q phase–related gene detection, cell survival, and synchronous mitotic re-entry capability [5,6,8–10]. In fact, quiescence phenomena are so complex that there is still considerable inconsistency in the methods to identify Q cells among different research groups [1]. Inevitably, it needs multi-faceted or multi-parameter evaluation. Unfortunately, information in those experimental details is not yet adequate, and reporting also lacks standardization [1].
Considering that quiescence phenomena are complex and studies often require multi-sample, multi-timepoint sampling designs, the present isolating method is established to save time and reduce consumable costs by combining a 2 mL centrifugal tube with density marker beads. The key is to optimize the buoyant density distribution of the density gradient solution by investigating the effect of several factors, while also ensuring that the density bands that match Q and NQ cells are formed and fully separated from each other. Further, the cell cycle is selected as the most important and main criterion to determine when quiescent cells emerge and can thus be isolated. With the details fully described here, this protocol would be easily adapted to yeast and other unicellular microbes with similar buoyant cell density range [11,12].
Materials and reagents
Biological materials
1. Yeast strain W303-1A (MATa, ade2, trp1, his3, can1, ura3, leu2), ATCC 208352
Reagents
1. Yeast extract (Sangon Biotech, catalog number: A610961-0500)
2. Peptone A (meat peptone, from bovine) (Sangon Biotech, catalog number: A610213-0500)
3. Agar A (Sangon Biotech, catalog number: A600010-0500)
4. D-(+)-Glucose (Sangon Biotech, catalog number: A501991-0500)
5. Adenine (Sangon Biotech, catalog number: A600013-0100)
6. Ethanol, 99.9% (Tianjin Jiangtian Chemical Technology, catalog number: 19020)
7. Citric acid trisodium dihydrate (C6H5Na3O7·2H2O) (AMRESCO, catalog number: 0101-1KG)
8. Citric acid (C6H8O7) (Sangon Biotech, catalog number: CB0055)
9. SYTOXTM green nucleic acid stain (Thermo Fisher Scientific, catalog number: S7020)
10. RNase A from bovine pancreas (Sangon Biotech, catalog number: B600473-0025)
11. Proteinase K (Transgen, catalog number: GE201-01)
12. PercollTM solution (GE Healthcare, catalog number: 17-0891-09)
13. Sodium chloride (NaCl) (AMRESCO, catalog number: X190 7647-14-5)
14. Tris (Sangon Biotech, catalog number: A600194-0500)
15. Density marker bead (DMB-kit) (Cospheric, catalog number: 5613)
16. DMSO (CALEDON, catalog number: 4100-1-05)
17. Hydrochloric acid (DUKSAN, catalog number: 2065)
Solutions
1. 70% ethanol (see Recipes)
2. Normal saline (see Recipes)
3. 1.5 M NaCl solution (see Recipes)
4. SYTOXTM green working solution (see Recipes)
5. Percoll isotonic solution (see Recipes)
6. YPDA culture medium (see Recipes)
7. Density marker beads (see Recipes)
8. 50 mM sodium citrate buffer (pH 7.2) (see Recipes)
9. 50 mM Tris-HCl (pH 7.5) (see Recipes)
10. RNase A solution (see Recipes)
Recipes
1. 70% ethanol
Dissolve 70 mL of pure ethanol in 30 mL of deionized water. Store at 4 °C.
2. Normal saline
Dissolve 0.9 g of sodium chloride in 100 mL of deionized water, autoclave (121 °C, 20 min), and let cool down. Store at room temperature (RT).
3. 1.5 M NaCl solution
Dissolve 8.8 g of sodium chloride in approximately 80 mL of deionized water. After complete dissolution, the volume is adjusted to 100 mL with additional deionized water. Autoclave (121 °C, 20 min) and let cool down. Store at RT.
4. SYTOXTM green working solution
Dissolve 20 μL of SYTOXTM Green in 980 μL of DMSO. Store at -20 °C.
5. Percoll isotonic solution
100% Percoll, 90 mL
Autoclave (121 °C, 20 min) and let cool down. Store at RT.
Add 10 mL of 1.5 M NaCl solution into 90 mL of Percoll and vortex to mix.
Prepare Percoll isotonic solution just before separating. Long-term storage may cause Percoll particles to bind to salt ions due to gravity, which is not conducive to the generation of the density gradient.
6. YPDA culture medium
Yeast extract 1% (w/v), 10 g
Peptone A 2% (w/v), 20 g
Adenine 0.05% (w/v), 0.5 g
H2O, add up to 950 mL
Prepare solution, autoclave (121 °C, 20 min), and let cool down.
D-(+)-Glucose 2% (w/v), 20 g
H2O, add up to 50 mL
Prepare solution, autoclave (115 °C, 15 min), let cool down, and pour into the above solution.
For solid YPDA, add 1.5% agar (15 g/L).
7. Density marker beads
50 μL each of 1.02 g/L (green), 1.04 g/L (orange), 1.06 g/L (purple), 1.08 g/L (dark blue), 1.09 g/L (pink), and 1.13 g/L (light blue) density marker beads. Vortex to mix.
8. 50 mM sodium citrate buffer (pH 7.2)
Citric acid trisodium dihydrate 50 mM, 14.7 g
H2O, add up to 1,000 mL
Adjust the pH to 7.2 with citric acid
Prepare solution, autoclave (121 °C, 20 min), and let cool down. Store at RT.
9. 50 mM Tris-HCl (pH 7.5)
Tris 50 mM, 6.2 g
H2O, add up to 1,000 mL
Adjust the pH to 7.5 with hydrochloric acid.
Prepare solution, autoclave (121 °C, 20 min), and let cool down. Store at RT.
10. RNase A solution
1.5 M NaCl, 10 μL
50 mM Tris-HCl (pH 7.5), 200 μL
RNase A 10 mg/mL, 10 mg
Ethanol, 500 μL
ddH2O add up to 1 mL. Store at -20 ˚C
Equipment
1. Sterile pipette sets [Nantong Leierxin Experimental Equipment, catalog numbers: LP025 (1 mL), LP024 (200 μL), LP022 (10 μL)]
2. Centrifugal tube [Nantong Leierxin Experimental Equipment, catalog numbers: LP074 (2 mL), LP027 (1.5 mL)]
3. Plastic culture dishes, 85 mm × 15 mm (Nantong Leierxin Experimental Equipment)
4. Laminar airflow (Suzhou Antai Airtech, catalog number: SW-CJ-2FD)
5. Pipette [Eppendorf, catalog numbers: 4027959 (10 μL); 1224923 (20 μL); 4301409 (100 μL); 1599049 (200 μL); H39622F (1,000 μL); 236061z (5,000 μL)]
6. Heating magnetic stirrer (IKA works, catalog number: 07.012755)
7. Precision balance (Mettler Toledo, catalog numbers: AB204-N and PB602-N)
8. Centrifuge (Thermo Scientific, model: Pico 17 with 775003424 angle rotor)
9. Glass test tubes, 17 mm × 185 mm
10. Test tube caps, 21 mm
11. 250 mL Erlenmeyer flask
12. Icebox [Siemens, catalog number: BCD-254(KK25E73TI)]
13. Shaker incubator (GlobalFoundries, catalog number: 3031)
14. Light microscope (Nikon, catalog number: YS100)
15. Spectrophotometer (Pgeneral, catalog number: T6 Xinyue)
16. Biosensors analyzer (Sieman, catalog number: S-10)
17. Autoclave (Shanghai Boxun Medical Biological Instrument, catalog number: YXQ-50G)
18. Flow cytometer (Beckman Coulter, catalog number: CytoFLEX)
19. Flow cytometer (BD, model: BD Aria III)
20. Vortex mixer (Thermo Scientific, catalog number: 88880018)
21. Centrifuge (Hettich Zentrifugen, model: Universal 32R with 1689 angle rotor)
22. Centrifuge (Jouan CR422, catalog number: 11175330 with 11175338 M4 swing-out rotor)
23. Electric incubator (Shanghai Yiheng Scientific Instrument, catalog number: DHP 9082)
24. Laser confocal scanning microscope (LCSM) (Leica, model: Leica Stellaris 8 FALCON)
25. Sterilizing pot (Hirayama, catalog number: HV-85)
Software and datasets
1. FlowJo v10.8.1 https://www.flowjo.com/
2. LASX Office 1.4.7 28921 https://www.leica-microsystems.com/
Note: The above-mentioned software might not be freely accessible. Interested users should reach out to the sales departments of the corresponding companies for acquisition.
Procedure
The following steps correspond to panels A–E of the Graphical overview.
A. Strain activation, inoculation, regular sampling, and detection
1. Streak W303-1A strain from glycerol stock with a disposable loop on YPDA solid medium and grow at 30 °C for 2–3 days.
2. Inoculate a single colony into 3 mL of the YPDA liquid medium in a glass test tube. Grow with agitation at 200 rpm for 16 h at 30 °C.
3. Inoculate the cells into 60 mL of the YPDA liquid medium in a 250 mL Erlenmeyer flask at an initial OD600 of 0.2 and grow with agitation at 200 rpm for 16 h at 30 °C. Take 2 mL of the post-inoculation culture for subsequent cell cycle detection (section B). If cell cycle detection cannot be performed timely, the cultures should be stored at -20 °C. Normally, storing at -20 °C will not affect cell cycle detection and it will allow the cell to be taken out and fixed when convenient.
4. Measure the OD600 of the cells in culture and residual glucose content at regular intervals, for example, every 6 h. In fact, it is preferred that time interval varies with strain, cultivation condition, and growth stage.
Note: OD600 is measured using a spectrophotometer in a cuvette; glucose content is measured by a Biosensors analyzer. If necessary, the sample prepared can be diluted with water. Generally, 1 OD600 corresponds to approximately 1 × 10⁷ cells.
5. Examine the cells under a standard light microscope with 10× eyepiece and 40× objective lens at regular intervals and confirm that there is no bacterial contamination in the culture. If bacteria are detected, remove the cultures and repeat steps A1–A4. Observe the proportion of single cells simultaneously.
Note: Microscopic monitoring can help determine bacterial contaminants, yeast cell amount, morphology, budding, growth phase, etc., in real-time, quickly and conveniently. Generally, yeast is easily distinguished from bacteria because of their distinct morphology and motility. In addition, bacterial contamination is often accompanied by abnormal culture odors and colors and also an abnormally increased OD600. For more accurate confirmation, methods such as solid plate culture can be employed if necessary. Quiescent cells only occur after entering the stationary phase, which is characterized by a significant increase in single-cell amount, typically at least 50%, and up to 90% or more.
B. Cell cycle detection by flow cytometer to determine the time to separate Q cells
1. When glucose is depleted and the proportion of single cells increases significantly upon microscopy, take each sample of approximately 3 × 10⁶ cells (0.3 OD600) in centrifugal tubes for cell cycle detection at regular intervals (every 6 or 12 h).
Note: The 0 h cell culture sample serves as the control sample for cell cycle analysis.
2. Ethanol fixation of cells
a. Pellet cells by centrifugation at 6,200× g for 5 min at RT with a tabletop centrifuge and remove the supernatant.
b. Resuspend cells in 200 μL of 50 mM sodium citrate buffer (pH 7.2) and then vortex to mix. Pellet cells according to step B2a. Repeat to remove the culture medium.
c. Add 200 μL of 70% ethanol to pelleted cells and vortex to mix.
d. Store 200 μL of resuspension cells at -20 ˚C in a freezer for at least 2 h.
Pause point: Properly sealed, cells can be left indefinitely at -20 ˚C before processing.
3. Rehydration of fixed cells
a. Pellet cells by centrifugation at 11,000× g for 10 min at RT and remove the supernatant.
b. Resuspend cells in 200 μL of 50 mM sodium citrate buffer (pH 7.2) and then vortex to mix. Incubate for 10 min at RT.
c. Repeat steps B3a and B3b until removing 70% ethanol by decanting or pipetting.
d. Pellet cells according to step B3a and resuspend pelleted cells in 100 μL of 50 mM sodium citrate buffer (pH 7.2). Vortex to mix.
Pause point: Rehydrated cells are stable for weeks to months at 4 ˚C.
4. Cellular staining
a. Add 1 μL of 10 mg/mL SYTOXTM working solution and 1 μL of 10 mg/mL RNase A solution to rehydrated cells and then vortex to mix.
b. Incubate for at least 1 h at 37 ˚C in the dark.
c. Add 1 μL of 20 mg/mL Proteinase K and then vortex to mix.
d. Incubate the proteinase K digest for at least 1 h at 55 ˚C in the dark.
5. Analyze 30,000 cells per sample on the flow cytometer using 488 nm excitation and collecting fluorescent emission with filters at 525/40 nm. Use FlowJo software for data collection and analysis. Adjust voltage to center the G1/G0 intensity peak at 75.
6. When the G0/G1 peak in the flow cytometry histogram is similar to or slightly higher than the G2 peak, it indicates the active production of Q cells and the optimal time to begin isolating Q cells.
C. Optimization of Percoll gradient solution preparation to obtain suitable buoyant density distribution in a 2 mL centrifuge tube using density marker beads
1. Optimize the Percoll isotonic solution percentage
a. Add the Percoll isotonic solution and 50 mM Tris-HCl (pH 7.5) to a final volume of 1.67 mL in a 2 mL centrifuge tube with different percentages [Percoll isotonic solution percentage: 100%, 90%, 80%, ..., e.g., when the Percoll isotonic solution percentage is 90%, add 1.34 mL of Percoll isotonic solution and 0.33 mL of 50 mM Tris-HCl (pH 7.5)]. Vortex for 10 s to mix.
b. Add 30 μL of density marker beads and vortex for 10 s to mix.
c. Spin 2 mL centrifuge tubes equipped with different Percoll isotonic solution percentages in an angle rotor table centrifuge at 20,000× g for 15 min at RT.
2. Optimize centrifugation time: Prepare four tubes using the Percoll isotonic solution percentage with the most uniform density marker bead band distribution according to step C1a. Centrifuge each at 20,000× g for 15, 30, 45, and 60 min, respectively.
3. Select the Percoll isotonic solution percentage and centrifugation time resulting in the most uniform density marker beads for subsequent experiments.
Note: Centrifugal speed is another parameter that should also be optimized. The centrifugal speed of the desktop centrifuge used in this protocol is near its upper limit and has been proven to provide adequate separation, so further optimization of the centrifugal speed is omitted. However, it is still advised for different strains, centrifuges, and other conditions.
D. Preparation of density gradient solution and cell suspensions and centrifugation and isolation of Q and NQ cells
1. Prepare the density gradient solution according to the optimal protocol obtained in section C (excluding step C1b).
2. Cells preparation
a. Measure the OD600 by spectrophotometry in a cuvette of the culture and take a sample greater than approximately 2 × 10⁸ cells (20 OD600) in centrifugal tubes. Pellet cells according to step B2a.
Note: The samples to be separated should be separated immediately and should not be stored.
b. Resuspend cells in 200 μL of 50 mM Tris-HCl (pH 7.5) and then vortex to mix. Pellet cells according to step B2a. Repeat until removing the culture medium.
c. Resuspend approximately 2 × 10⁸ pelleted cells (20 OD600) in 50 mM Tris-HCl (pH 7.5) to a final volume of 30 μL. Store the remaining cells at 4 °C for future analysis.
Note: If the volume of the cell resuspension for separation is not 30 μL, adjust the volume of 50 mM Tris-HCl (pH 7.5) to maintain the percentage of the Percoll isotonic solution when preparing the density gradient.
3. Centrifuge to separate the cell resuspension
a. Carefully pipette the cell resuspension onto the density gradient solution by placing the pipette at the side of the 2 mL centrifuge tube.
b. Centrifuge the samples from step D3a and the centrifuge tube containing density marker beads with the same Percoll isotonic solution percentage from section C in a swing-bucket centrifuge at 400× g for 1 h at 16 °C.
4. Collection of Q cells and NQ cells
a. Carefully remove cells from different density layers in 2 mL centrifuge tubes, collecting the upper NQ and the lower Q fraction cells, which correspond to the coverage area of density marker beads with a density below 1.09 g/L and the area covered by the density marker bead with a density of 1.13 g/L, respectively.
b. Dilute the collected Q and NQ cells with sterile deionized H2O and then vortex to mix.
c. Pellet cells according to step B2a. Repeat until removing the density gradient solution by decanting or pipetting.
Critical: Avoid salt-containing buffers during washing to avoid Percoll rebinding with ions, which could recreate a density gradient and prevent cell sedimentation at the tube bottom.
d. Resuspend the collected cells with 1–2 mL of 50 mM Tris-HCl (pH 7.5) and store at 4 °C.
Pause point: Properly sealed, collected cell resuspension can be left at 4 ˚C for 2 weeks.
E. Analysis of pre-separation and post-separation cells
E1. Quantification and yield
Measure the OD600 by spectrophotometry in a cuvette and calculate the yield of Q and NQ cells.
E2. Heat resistance
1. Take approximately 3 × 10⁶ cells (0.3 OD600) from each of the pre-separation and post-separation samples. Pellet cells according to step B2a.
2. Resuspend pelleted cells in normal saline to a final volume of 300 μL.
3. Plating colony-forming units (CFU)
a. Take 200 μL of cell resuspension in step E2 and dilute in 2 mL of normal saline. Plate 200 μL of this dilution onto several YPDA solid mediums.
Note: The specific number of YPDA solid media to be spread should be adjusted according to the experimental setup. It is essential to obtain at least three replicate CFU results with high reproducibility.
b. Heat treatment: incubate plates at 55 °C for 1 h and then transfer to culture at 30 °C for 2 days. Non-heat treatment: Culture at 30 °C for 2 days. Have at least three sets of data for each group.
c. Count the number of colonies.
Note: This dilution is designed to plate approximately 200–400 cells when cultured at 30 °C and may need to be adjusted based on variations between spectrophotometers and strains.
4. Spotting cells
a. Serially dilute the cell resuspension 10-fold five times using normal saline and then spot 2 μL of each of the six concentrations on YPDA plates.
b. Culture according to step E2.3b.
c. Capture digital images of the YPDA plates.
E3. Cell cycle determination
Take approximately 3 × 10⁶ cells (0.3 OD600) from each of the pre-separation cells, Q cells, and NQ cells. Detect cell cycle according to steps B2–B5.
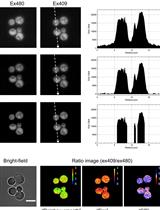
E4. Differential interference contrast (DIC) imaging by laser confocal scanning microscope (LCSM)
1. Take approximately 6 × 10⁶ cells (0.6 OD600) from each of the pre-separation cells, Q cells, and NQ cells. Pellet cells according to step B2a.
2. Resuspend pelleted cells in normal saline to a final volume of 100 μL.
3. Take 10 μL of cell resuspension and use DIC with a 10× eyepiece and 63× NA 1.40 oil objective lens on the LCSM.
Note: To observe cell morphology, you can use various methods. A standard light microscope allows real-time assessment but has poor image capture. Phase-contrast microscopy offers better observation and image capture, while LCSM enables simultaneous DIC and fluorescence imaging.
Data analysis
A. Cell cycle detection by flow cytometer to determine the time to separate the Q cells
After approximately 12 h of fermentation, glucose is depleted. Use SYTOXTM green staining to assess the cell cycle in W303-1A cells at regular intervals (Figure 1, analyzed by FlowJo v10.8.1). The initial fluorescence intensity of the G0/G1 peak was low at Day 0. The G0/G1 peak intensity increased with fermentation, indicating an observable transition to the G0/G1 phase. After approximately two days of fermentation, the G0/G1 peak in the flow cytometry histogram is slightly higher than the G2 peak, and it is appropriate to initiate the Q cell separation procedure. By Day 7, the population is enriched with Q cells. Data presented in this protocol are from Day 7 culture to compare Q and NQ cells.
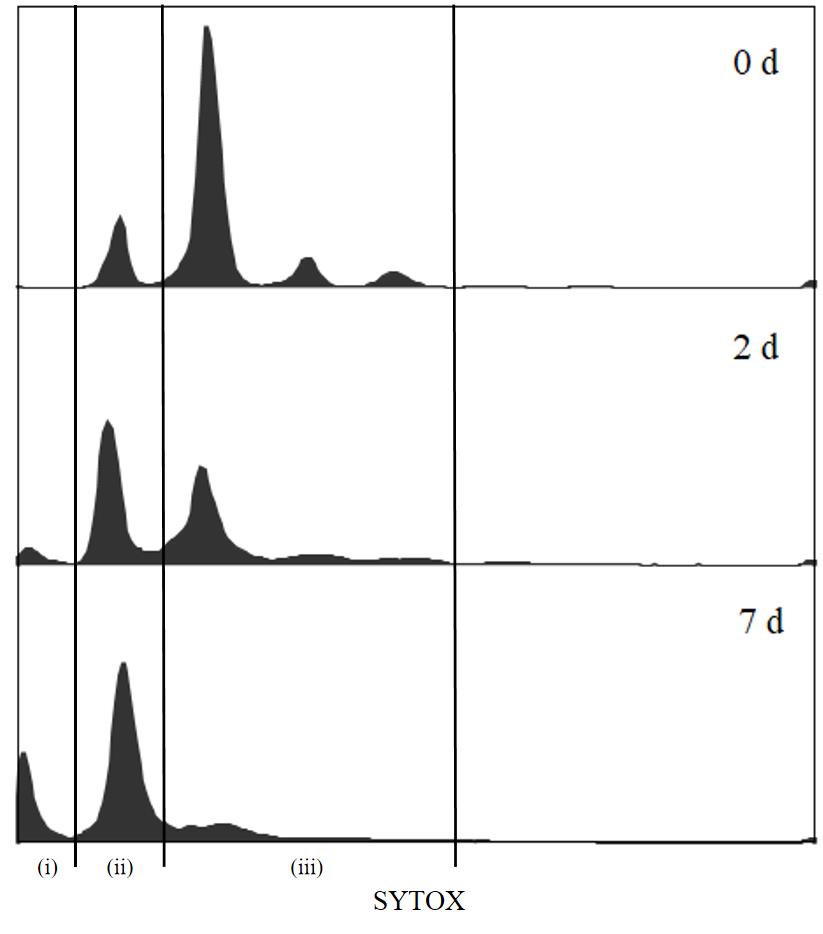
Figure 1. Flow cytometry histogram of DNA from cell culture during fermentation. (i) Fragmented DNA from dead cell accumulates; (ii) G0/G1 phase; (iii) S/G2/M phase.
Note: Fragmented DNA from dead cells accumulates on the left edge of these profiles.
B. Q cell isolation by continuous density gradient
1. According to the results of Section C, it is posited that when the Percoll isotonic solution percentage is 90% and is centrifuged at 20,000× g for 60 min, the density marker bead bands are most evenly distributed (Figure 2). Consequently, select these parameters to prepare the Percoll density solution for the subsequent density gradient centrifugation of the cell culture.
2. At Day 7, with an OD600 of cell culture of approximately 14.5, harvest approximately 1.4 mL of cell culture and resuspend with Tris-HCl as outlined in step D2.
3. The samples separated according to step D3 are shown in Figure 3. The Q cells are located in the area covered by the density marker bead corresponding to 1.13 g/L; the NQ cells are located in the area covered by density beads with a density less than 1.09 g/L.
4. Collect to obtain approximately 1.54 × 10⁸ Q cells (15.4 OD600), which accounts for 77.0% of the separated cells, and approximately 2.62 × 10⁷ NQ cells (2.62 OD600), which accounts for 13.1% of the separated cells.
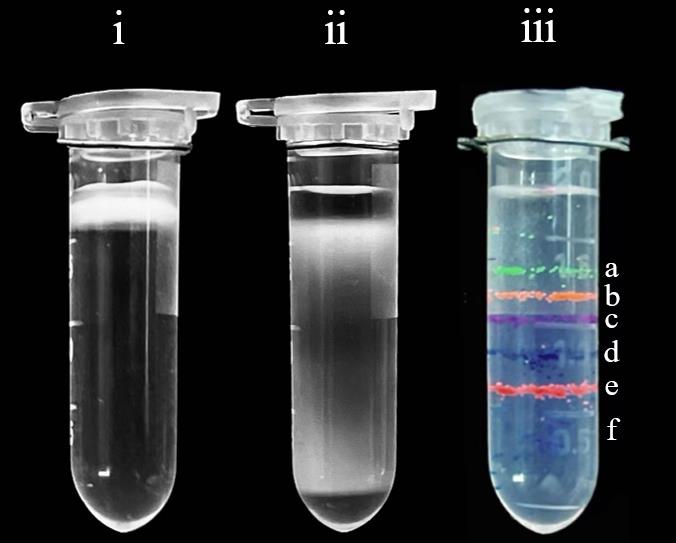
Figure 2. Continuous density gradient centrifugation of i) pre-separation, ii) post-separation, and iii) density marker beads. Density marker beads: a, green 1.02 g/L; b, orange 1.04 g/L; c, purple 1.06 g/L; d, dark blue 1.08 g/L; e, pink 1.09 g/L; f, light blue 1.13 g/L.
C. Analysis of separated cells
C1. Heat resistance
Q cells have superior heat tolerance than NQ cells.
1. The CFU results confirmed that Q cells possess good thermotolerance. After heat treatment, the survival percentages of pre-separated cells, Q cells, and NQ cells were approximately 53.6%, 79.6%, and 3.1%, respectively (Figure 3).
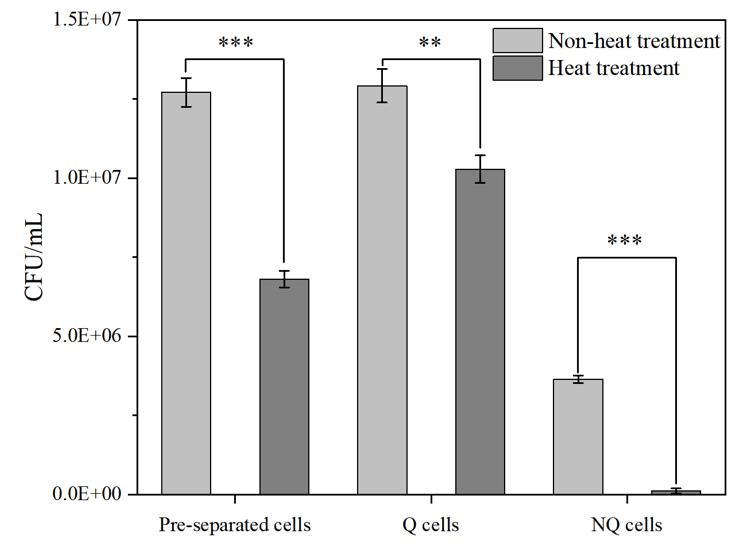
Figure 3. CFU assay of pre-separated cells, NQ cells, and Q cells under non-heat and heat treatment. Data are presented as means ± SD (n = 3, independent samples t-test, asterisks (*) indicate significance levels as described above: *P < 0.05, **P < 0.01, **P < 0.001).
2. The spotting results confirmed that all samples grew similarly at 30 °C, but Q cells grew significantly better than NQ cells after heat treatment (Figure 4; images were cropped to remove empty space but no other image adjustments were performed).
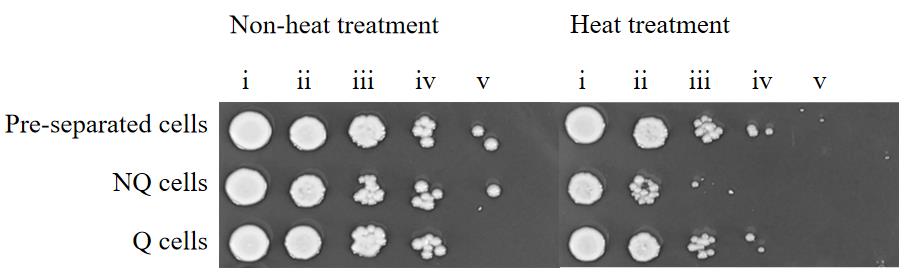
Figure 4. Spot test of pre-separated cell, NQ cell, and Q cell thermotolerance. Labels i–v correspond to 0-, 10-, 100-, 1,000-, and 10,000-fold dilution of the cell resuspension in step E2.2, respectively.
C2. Cell cycle determination
Using SYTOXTM green staining to determine the cell cycle in W303-1A cells after separation (Figure 5, analyzed by FlowJo v10.8.1), Q cells have an observable higher fluorescence intensity in the G0/G1 peak than that of NQ cells.
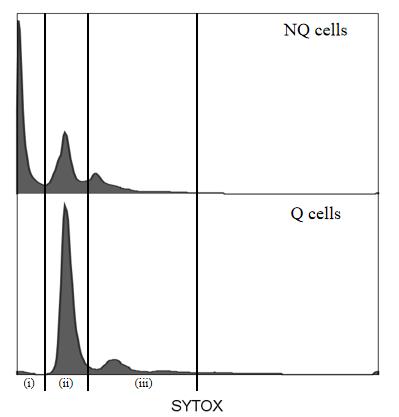
Figure 5. Flow cytometry histogram of DNA from cell culture after separation. (i) Fragmented DNA from dead cell accumulates; (ii) G0/G1 phase; (iii) S/G2/M phase.
C3. DIC imaging by laser confocal scanning microscope (LCSM)
Q cells should all be small, round, and shiny, whereas the NQ fraction should contain larger cells, many budded cells, and cell fragments (Figure 6, analyzed by LASX Office 1.4.7 28921).
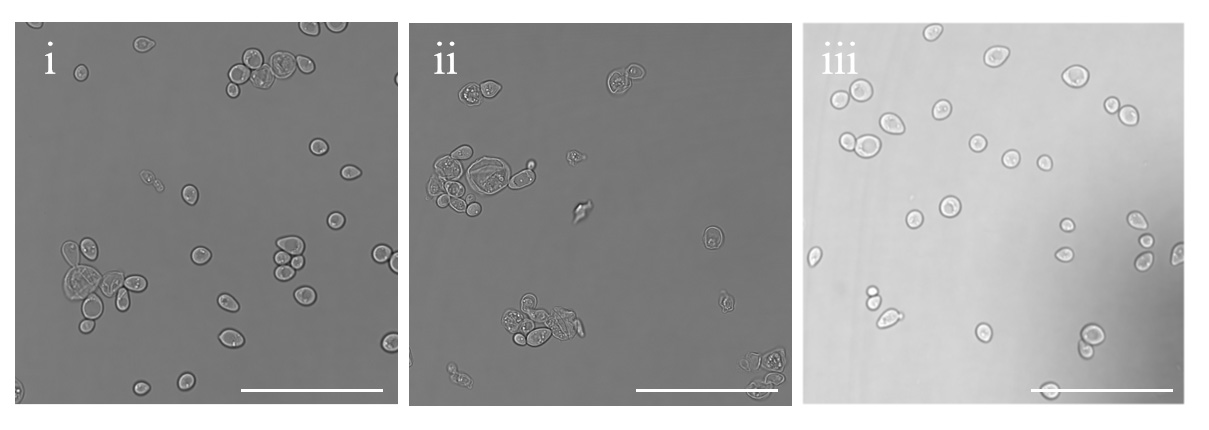
Figure 6. Laser confocal DIC microscopy. i) Pre-separated cells; ii) NQ cells; and iii) Q cells. Scale bar: 50 μm.
Validation of protocol
Verification of the protocol has been shown in Figures 1–6 in the Data analysis section by using Saccharomyces cerevisiae strain W303-1A. Figure 1 shows cell cycle detection by flow cytometer to determine the time to separate the Q cells, and Figure 2 shows optimization of Percoll gradient solution preparation to obtain suitable buoyant density distribution in a 2 mL centrifuge tube using density marker beads and preparation of density gradient solution and cell suspensions, centrifugation, and isolation of Q and NQ cells. Figures 3–6 further demonstrate the typical characteristics of the separated quiescent cells by heat resistance analysis (Figures 3 and 4), cell cycle analysis (Figure 5), and DIC imaging by laser confocal scanning microscope (Figure 6).
Although data presented in Data analysis section are mainly from Day 7 culture to compare Q and NQ cells, in fact, this protocol is validated across the entire fermentation period. Further 24 and 48 h cultures are used as an example for before and after the appearance of quiescent cells, respectively. The cell cycle of a 24 h culture is shown to be similar to that of 0 d culture (shown in Figure 1), which indicates that there are no obvious quiescent cells. Following sections C and D for density gradient separation, the 24 h culture cells were shown to be distributed in the region with cell densities ranging from 1.02 g/L to 1.09 g/L [shown in Figure 2 (iii) a–e] in a 2 mL centrifuge tube. This phenomenon confirms that quiescent cells had not yet been generated as expected. However, while the cell cycle of the 48 h culture has been detected to be different from that of 0 d culture (shown in Figure 1), sections C, D, and E of 48 h culture process enable the isolation and validation of Q-cell populations; separation based on density gradient centrifugation result in a lower-density layer corresponding to NQ cells and a higher-density layer corresponding to Q cells (shown in Figures 7–9).
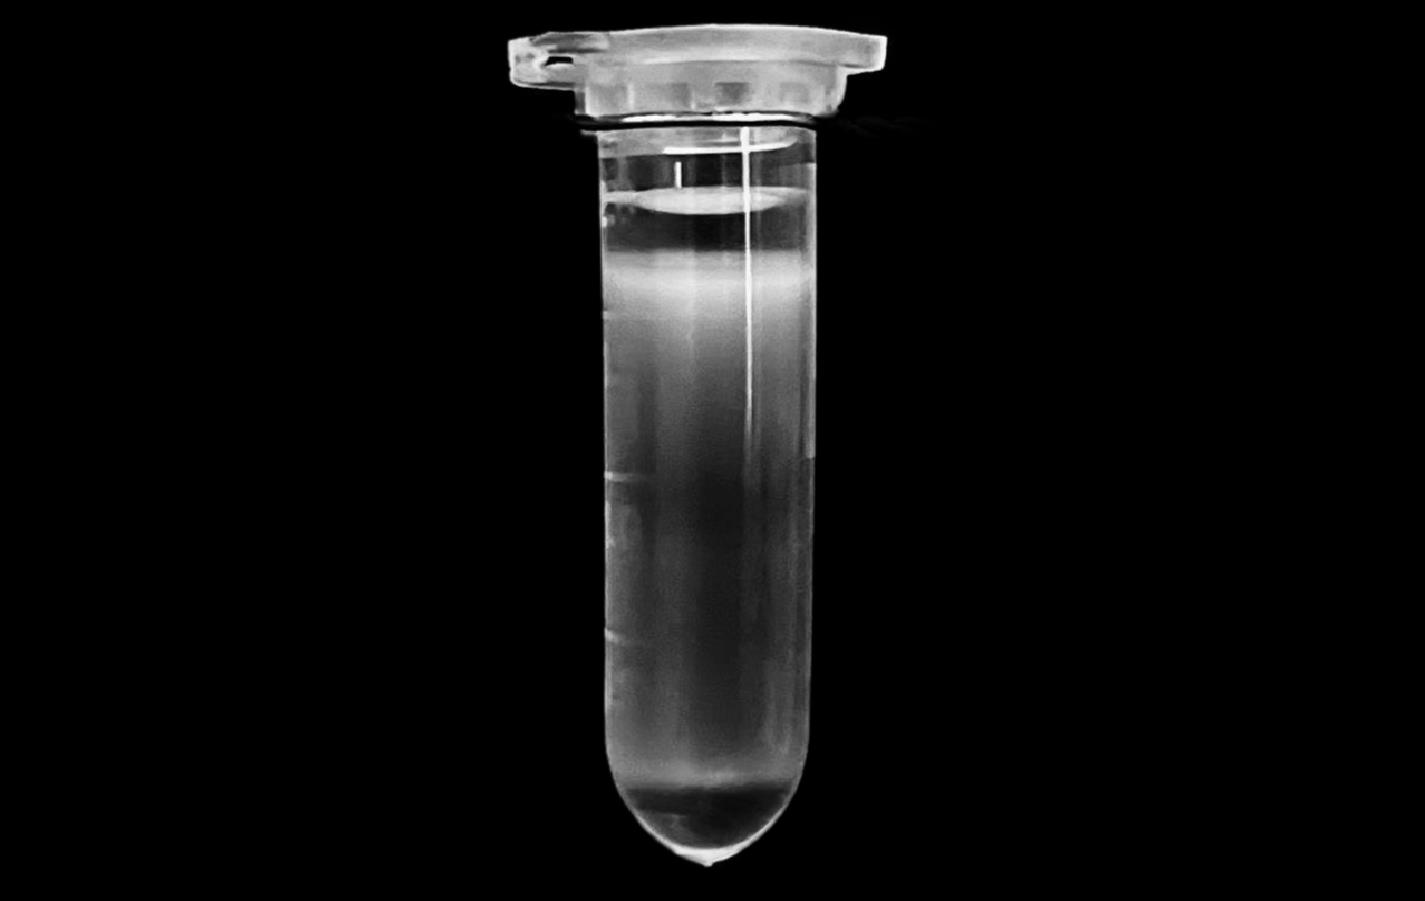
Figure 7. Continuous density gradient centrifugation of post-separation at 48 h
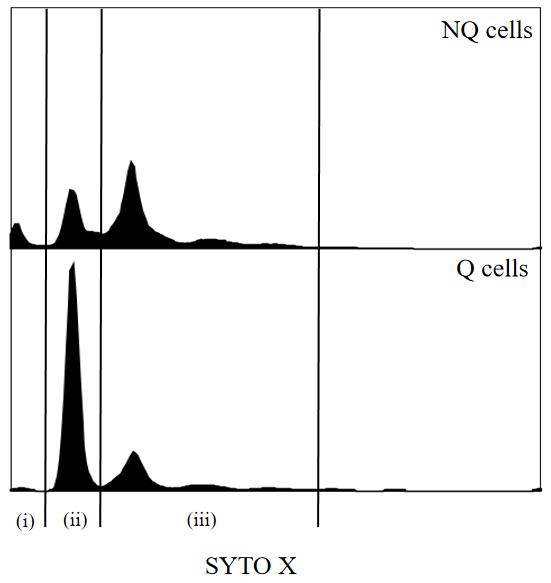
Figure 8. Flow cytometry histogram of DNA from cell culture after separation at 48 h. (i) Fragmented DNA from dead cell accumulates; (ii) G0/G1 phase; (iii) S/G2/M phase.
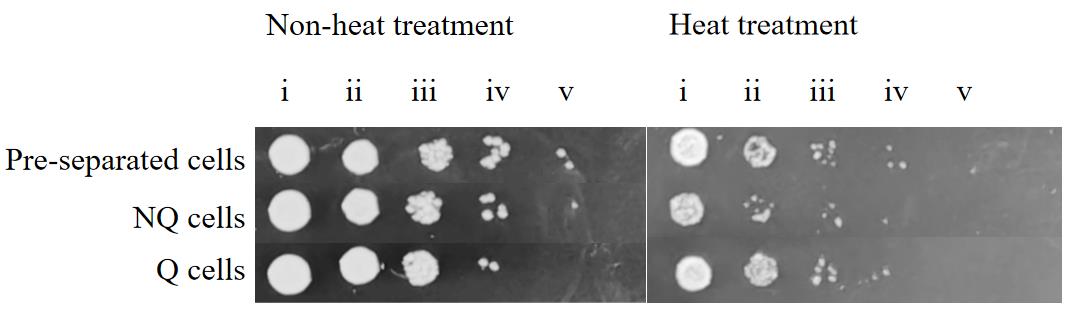
Figure 9. Spot test of pre-separated at 48 h, NQ, and Q cell thermotolerance. Labels i–v correspond to 0-, 10-, 100-, 1,000-, and 10,000-fold dilution of the cell resuspension in step E2.2, respectively.
General notes and troubleshooting
General notes
1. In general, this protocol can be adapted to any unicellular microbes with buoyancy density differentiation during cultivation. You just need to modify the preparation of the density gradient solution to make its buoyancy density distribution match those of microbes. Besides the Percoll concentration and centrifugation speed and duration time, other factors (e.g., temperature) also influence density distribution [3,13]. Thus, the protocol varies according to microbial species, cell density, and cultivation.
2. Quiescence is so complex that its occurrence is influenced by many factors, and its phenotypes are diverse [14]. Inevitably, multi-faceted or multi-parameter evaluation is required. Here, we use heat resistance, cell cycle, and DIC as the main methods to further ensure whether the separated cells are quiescent or not. We consider these methods sufficient to distinguish Q from NQ cells, but out of caution, more indicators may be chosen for further assessment when facing other strains and culture conditions.
3. After sampling, separate the broth as soon as possible to avoid cell state alterations. If separation has to be delayed, cell culture should be centrifuged and the supernatant removed, before resuspending the cell culture in 50 mM Tris-HCl (pH 7.5) or normal saline and storing at 4 °C for subsequent separation.
Acknowledgments
This work was supported by Tianjin Key Technology R&D Program (18YFZCNC01240), Key Topics of the 2023 Tianjin Higher Education Postgraduate Education Reform Research Plan Project (TJYGZ47), and 2023 Tianjin University Graduate School Graduate Innovative Talent Training Project (YCX2023015).
Competing interests
The authors declare no competing interests.
References
- Opalek, M., Tutaj, H., Pirog, A., Smug, B. J., Rutkowska, J. and Wloch-Salamon, D. (2023). A Systematic Review on Quiescent State Research Approaches in S. cerevisiae. Cells. 12(12): 1608. https://doi.org/10.3390/cells12121608
- Sun, S. and Gresham, D. (2021). Cellular quiescence in budding yeast. Yeast. 38(1): 12–29. https://doi.org/10.1002/yea.3545
- Baldwin, W. W. and Kubitschek, H. E. (1984). Buoyant density variation during the cell cycle of Saccharomyces cerevisiae. J Bacteriol. 158(2): 701–704. https://doi.org/10.1128/jb.158.2.701-704.1984
- Bryan, A. K., Goranov, A., Amon, A. and Manalis, S. R. (2009). Measurement of mass, density, and volume during the cell cycle of yeast. Proc Natl Acad Sci USA. 107(3): 999–1004. https://doi.org/10.1073/pnas.0901851107
- Allen, C., Büttner, S., Aragon, A. D., Thomas, J. A., Meirelles, O., Jaetao, J. E., Benn, D., Ruby, S. W., Veenhuis, M., Madeo, F., et al. (2006). Isolation of quiescent and nonquiescent cells from yeast stationary-phase cultures. J Cell Biol. 174(1): 89–100. https://doi.org/10.1083/jcb.200604072
- Kumar, R. and Srivastava, S. (2016). Quantitative proteomic comparison of stationary/G0 phase cells and tetrads in budding yeast. Sci Rep. 6(1): e1038/srep32031. https://doi.org/10.1038/srep32031
- Li, L., Lu, Y., Qin, L. X., Bar-Joseph, Z., Werner-Washburne, M. and Breeden, L. L. (2009). Budding YeastSSD1-VRegulates Transcript Levels of Many Longevity Genes and Extends Chronological Life Span in Purified Quiescent Cells. Mol Biol Cell. 20(17): 3851–3864. https://doi.org/10.1091/mbc.e09-04-0347
- Li, L., Miles, S. and Breeden, L. L. (2015). A Genetic Screen for Saccharomyces cerevisiae Mutants That Fail to Enter Quiescence. G3 Genes|Genomes|Genetics. 5(8): 1783–1795. https://doi.org/10.1534/g3.115.019091
- Li, L., Miles, S., Melville, Z., Prasad, A., Bradley, G. and Breeden, L. L. (2013). Key events during the transition from rapid growth to quiescence in budding yeast require posttranscriptional regulators. Mol Biol Cell. 24(23): 3697–3709. https://doi.org/10.1091/mbc.e13-05-0241
- Spain, M. M., Swygert, S. G. and Tsukiyama, T. (2018). Preparation and Analysis of Saccharomyces cerevisiae Quiescent Cells. In: Cellular Quiescence. 125–135. https://doi.org/10.1007/978-1-4939-7371-2_9
- Dwek, R. D., Kobrin, L. H., Grossman, N. and Ron, E. Z. (1980). Synchronization of cell division in microorganisms by percoll gradients. Bacteriol. 44(1): 17–21. https://doi.org/10.1128/jb.144.1.17-21.1980
- Kubitschek, H. E., Baldwin, W. W., Schroeter, S. J. and Graetzer, R. (1984). Independence of buoyant cell density and growth rate in Escherichia coli. J Bacteriol. 158(1): 296–299. https://doi.org/10.1128/jb.158.1.296-299.1984
- Pertoft, H. (2000). Fractionation of cells and subcellular particles with Percoll. J Biochem Bioph Methods. 44: 1–30. https://doi.org/10.1016/s0165-022x(00)00066-x
- Mohammad, K., Baratang Junio, J. A., Tafakori, T., Orfanos, E. and Titorenko, V. I. (2020). Mechanisms that Link Chronological Aging to Cellular Quiescence in Budding Yeast. Int J Mol Sci. 21(13): 4717. https://doi.org/10.3390/ijms21134717
Article Information
Publication history
Received: Oct 2, 2024
Accepted: Mar 4, 2025
Available online: Mar 31, 2025
Published: Apr 20, 2025
Copyright
© 2025 The Author(s); This is an open access article under the CC BY-NC license (https://creativecommons.org/licenses/by-nc/4.0/).
How to cite
Zu, C., Dong, J., Zhang, Y., Zhang, Y., Huang, Z. and Zou, S. (2025). A Miniaturized Percoll Gradient Method for Isolation of Quiescent Cells of Yeast. Bio-protocol 15(8): e5279. DOI: 10.21769/BioProtoc.5279.
Category
Microbiology > in vivo model > Fungi
Cell Biology > Cell viability > Cell survival
Do you have any questions about this protocol?
Post your question to gather feedback from the community. We will also invite the authors of this article to respond.