- Protocols

- Articles and Issues
- For Authors
- About
- Become a Reviewer

High-Performance Liquid Chromatography Quantification of Glyphosate, Aminomethylphosphonic Acid, and Ascorbate in Culture Medium and Microalgal Cells

Published: Vol 15, Iss 7, Apr 5, 2025 DOI: 10.21769/BioProtoc.5263 Views: 1358
Reviewed by: Noelia ForesiPhilipp A.M. SchmidpeterWalmik Karbhari Gaikwad
Original research article
The authors used this protocol in:
Jun 2020
Advertisement


Protocol Collections
Comprehensive collections of detailed, peer-reviewed protocols focusing on specific topics


Abstract
Glyphosate (GLY) is a widely used herbicide that can induce oxidative stress in microalgae and other non-target organisms. The quantification of GLY in surface water is a difficult task, especially in trace-level concentrations, due to its high polarity and susceptibility to biotic and abiotic degradation. Several analytical methods have been developed for GLY quantification. Most of them use high-performance liquid chromatography (HPLC) coupled with detection by mass spectrometry (MS) and include a derivatization step to decrease the polarity of the herbicide to improve detection. This protocol describes an adaptation of an existing protocol for the quantification of GLY and its metabolite aminomethylphosphonic acid (AMPA) in a water-based microalgae culture medium using ultra-high-pressure liquid chromatography (UHPLC) coupled with fluorescence detection (FLR). The principal advantage of this protocol compared with other analytical methods that employ HPLC–MS is its low cost and accessibility since it does not require an MS detector nor radioactively labeled analytical standards. Ascorbic acid (AH-) is one of the most important hydrosoluble non-enzymatic antioxidants in eukaryotic cells and plays a key role in many metabolic pathways of critical importance in plants and algae. In this protocol, we also describe an adaptation of a previously published protocol to quantify AH- in blood samples to be used in microalgal cells exposed to GLY and GLY-based herbicides. The sample preparation procedure for this last protocol is fast, easy, and does not require expensive equipment. It uses an HPLC system coupled with an electrochemical detector (EC) for AH- quantification but may be adapted to be used with a UV-Vis detector.
Key features
• These protocols employ HPLC or UHPLC. The end user should be proficient with this technique and be able to optimize chromatographic parameters as necessary.
• The GLY and AMPA quantification protocol, designed upon the method developed by Nedelkoska [1], expands its use for water-based cell culture media.
• The protocol used for AH-, designed upon the method developed by Kutnink [2], has been modified to be used in microalgae cells.
• The quantification of AH- employs HPLC coupled with an electrochemical detector but could be modified for its use with a UV-VIS detector.
Keywords: GlyphosateGraphical overview
Glyphosate (GLY), aminomethylphosphonic acid (AMPA), and L-ascorbic acid (AH-) extraction and/or derivatization. (A) Cell harvest procedure. (B) Extraction and derivatization of GLY and AMPA in cell culture medium. (C) Extraction of AH- from microalgal cells. BBM: Bold’s basal medium. HPLC: High-performance liquid chromatography. FLR: Fluorescent detector. EC: Electrochemical detector. FMOC-Cl: 9-fluorenilmethyl chloroformate. MPA: Metaphosphoric acid.
Background
In this article, we describe two analytical protocols for the quantification of glyphosate (GLY) and ascorbic acid (AH-) in microalgal cultures exposed to an analytical standard or a GLY-based herbicide. The first protocol described here is based on a method originally published in 2004 [1] that has been adapted to quantify GLY and its metabolite aminomethylphosphonic acid (AMPA) in a water-based culture medium. Several modifications have been made to the original method to adapt it to the equipment available in our laboratory. The main differences are related to the type of chromatographic column and mobile phase used and the derivatization step. In our protocol, several key steps of the derivatization process were identified and optimized to improve efficiency, including carefully controlling the pH of the derivatization reaction and the order in which the reagents are added. The total run time of the analysis was also improved as compared to the original method using a UHPLC system. The use of a fluorescence (FLR) detector allows this protocol to have reduced costs as it is a relatively common detector found in most standard HPLC systems. This is also the key disadvantage of our protocol because FLR detection requires a clean sample to successfully quantify the derivatized analytes. However, this method is suitable for the analysis of both GLY and AMPA in drinking and superficial water samples and has been successfully implemented for the quantification of these analytes in water-based culture media.
The second protocol described here is used to quantify ascorbate ion (AH-) in microalgae cells. Different spectrophotometric, fluorescent, and chromatographic methods exist, which allow the determination of appreciable amounts of this antioxidant [3]. However, few methods allow direct and simultaneous detection of several chemical species. HPLC detection using different types of detection (electrochemical, fluorescent, etc.) establishes a rapid, sensitive, selective, and reproducible method for the detection of AH- [4]. Electrochemical detection (EC) is an attractive alternative method for the detection of electroactive species because of its inherent advantages of simplicity, ease of access to miniaturization, high sensitivity, and relatively low cost. EC typically works in amperometric or coulometric mode and can be coupled with HPLC to provide high sensitivity to electroactive species [5]. The protocol described here adapts one originally published in 1987 [2] to be used with microalgal cells. It is a very simple and fast method that does not require complex processing of samples. Its main advantage (and disadvantage) is the requirement of an electrochemical detector; however, it may be replaced by a UV-VIS detector, provided that samples are thoroughly cleaned up before injection in the chromatographic system, because the pigments in microalgal and plant cells interfere with UV-VIS detectors, affecting the detection and quantification levels of this method.
Materials and reagents
Biological materials
1. Chlorella vulgaris CPCC90 (UTCC90) (Canadian Phycological Culture Centre, catalog number: CPCC90)
Reagents
GLY and AMPA analysis
1. Glyphosate analytical standard (AccuStandard, catalog number: P-015NB, CAS: 1071-83-06)
2. Aminomethyl phosphonic acid (AMPA) analytical standard (Sigma-Aldrich, catalog number: 324817, CAS: 1066-51-9)
3. Potassium dihydrogen phosphate (KH2PO4) for analysis EMSURE® ISO (Supelco, catalog number: 1.04873, CAS: 7778-77-0)
4. Sodium tetraborate decahydrate (Na2B4O7·10H2O) for analysis ACS (Supelco, catalog number: 106308, CAS: 1303-96-4)
5. 9-Fluorenilmethyl chloroformate (FMOC-Cl), 99% (Sigma-Aldrich, catalog number: 23184, CAS: 28920-43-6)
6. Sodium hydroxide (NaOH), ACS reagent 97%, pellets (Sigma-Aldrich, catalog number: 221465, CAS: 1310-73-2)
7. Acetonitrile isocratic grade for liquid chromatography LiChrosolv® (Supelco, catalog number: 100029, CAS: 75-05-8)
8. Methanol isocratic grade for liquid chromatography LiChrosolv® (Supelco, catalog number: 106018, CAS: 67-56-1)
9. Ethyl acetate ACS grade (Merck, catalog number: 109623, CAS: 141-78-6)
10. Hydrochloric acid fuming (HCl), 37% for analysis ACS (Supelco, catalog number: 100317, CAS: 7647-01-0)
11. Orthophosphoric acid (H3PO4), 85% for analysis ACS (Supelco, catalog number: 100573, CAS: 7664-38-2)
12. Type 1 ultrapure water [6], resistivity 18 MΩ/cm at 25 °C)
AH- analysis
1. Metaphosphoric acid (MPA) ACS reagent, chips, 33.5%–36.5% (Sigma-Aldrich, catalog number: 239275, CAS: 37267-86-0)
2. Type 1 ultrapure water [6], resistivity 18 MΩ/cm at 25 °C
3. L-ascorbic acid, 99% (Sigma-Aldrich, catalog number: A92902, CAS: 50-81-7)
Solutions
For GLY and AMPA quantification (see Recipes)
1. GLY stock solution
2. GLY intermediate solution 1 (GLYI1)
3. GLY intermediate solution 2 (GLYI2)
4. GLY intermediate solution 3 (GLYI3)
5. AMPA stock solution
6. AMPA intermediate solution 1 (AMPAI1)
7. AMPA intermediate solution 2 (AMPAI2)
8. AMPA intermediate solution 3 (AMPAI3)
9. GLY calibration curve (GLY 1; GLY 2; GLY 3)
10. AMPA calibration curve (AMPA 1; AMPA 2; AMPA 3)
11. FMOC-Cl stock solution
12. FMOC-Cl working solution
13. Sodium tetraborate decahydrate (Na2B4O7·10H2O) buffer 0.125 M pH 9
14. 3 M HCl
15. KH2PO4 buffer solution 50 mM pH 5.5
16. NaOH 10% w/v
17. H3PO4 4% v/v
For AH- quantification (see Recipes)
1. MPA 10% w/v
2. MPA 0.8% w/v
3. L-ascorbic acid stock solution (1 mg/mL or 1 mM in MPA 10%)
4. L-ascorbic acid working solution (1 μg/mL or 10 μM in MPA 10%)
Recipes
For GLY and AMPA quantification
1. GLY stock solution (1 mg/mL) (10 mL)
Note: Stock solutions must be stored in plastic tubes, covered with aluminum foil.
| Reagent | Quantity | Final concentration | Shelf life/storage conditions |
|---|---|---|---|
| GLY analytical standard | 10 mg | 1 mg/mL | 6 months/4 °C |
| Ultrapure water | 10 mL | ||
| Total | 10 mL |
2. GLYI1 (1 mL)
Note: The intermediate solutions must be stored in plastic tubes, covered with aluminum foil.
| Reagent | Quantity | Final concentration | Shelf life/storage conditions |
|---|---|---|---|
| GLY stock solution | 10 μL | 10 μg/mL | 48 h/4 °C |
| Ultrapure water | 990 μL | ||
| Total | 1,000 μL |
3. GLYI2 (1 mL)
Note: The intermediate solutions must be stored in plastic tubes, covered with aluminum foil.
| Reagent | Quantity | Final concentration | Shelf life/storage conditions |
|---|---|---|---|
| GLYI1 | 10 μL | 100 ng/mL | 48 h/4 °C |
| Ultrapure water | 990 μL | ||
| Total | 1,000 μL |
4. GLYI3 (2.5 mL)
Note: The stock solutions must be stored in plastic tubes, covered with aluminum foil.
| Reagent | Quantity | Final concentration | Shelf life/storage conditions |
|---|---|---|---|
| GLYI2 | 500 μL | 20 ng/mL | 48 h/4 °C |
| Ultrapure water | 2,000 μL | ||
| Total | 2,500 μL |
5. AMPA stock solution (1 mg/mL) (10 mL)
Note: The stock solutions must be stored in plastic tubes, covered with aluminum foil.
| Reagent | Quantity | Final concentration | Shelf life/storage conditions |
|---|---|---|---|
| AMPA analytical standard | 10 mg | 1 mg/mL | 6 months/4 °C |
| Ultrapure water | 10 mL | ||
| Total | 10 mL |
6. AMPAI1 (1 mL)
Note: The intermediate solutions must be stored in plastic tubes, covered with aluminum foil.
| Reagent | Quantity | Final concentration | Shelf life/storage conditions |
|---|---|---|---|
| AMPA stock solution | 10 μL | 10 μg/mL | 48 h/4 °C |
| Ultrapure water | 990 μL | ||
| Total | 1,000 μL |
7. AMPAI2 (1 mL)
Note: The intermediate solution must be stored in a plastic tube, covered with aluminum foil.
| Reagent | Quantity | Final concentration | Shelf life/storage conditions |
|---|---|---|---|
| AMPAI1 | 10 μL | 100 ng/mL | 48 h/4 °C |
| Ultrapure water | 990 μL | ||
| Total | 1,000 μL |
8. AMPAI3 (2.5 mL)
Note: The intermediate solution must be stored in a plastic tube, covered with aluminum foil.
| Reagent | Quantity | Final concentration | Shelf life/storage conditions |
|---|---|---|---|
| AMPAI2 | 500 μL | 20 ng/mL | 48 h/4 °C |
| Ultrapure water | 2,000 μL | ||
| Total | 2,500 μL |
9. GLY calibration curve
Note: The standard solutions for the calibration curve should be prepared in duplicate and processed on the same day as the samples. Standards of higher concentration (up to 50 ng/mL) may be prepared if necessary.
| Standard solution | Reagent | Quantity | Final concentration | Shelf life/storage conditions |
|---|---|---|---|---|
| GLY 1 | GLYI3 | 50 μL | 1 ng/mL | 48 h/4 °C |
| Ultrapure water | 950 μL | |||
| Total | 1,000 μL | |||
| GLY 2 | GLYI3 | 250 μL | 5 ng/mL | 48 h/4 °C |
| Ultrapure water | 750 μL | |||
| Total | 1,000 μL | |||
| GLY 3 | GLYI3 | 500 μL | 10 ng/mL | 48 h/4 °C |
| Ultrapure water | 500 μL | |||
| Total | 1,000 μL |
10. AMPA calibration curve
Note: The standard solutions for the calibration curve should be prepared in duplicate and processed on the same day as the samples. Standards of higher concentration (up to 50 ng/mL) may be prepared if necessary.
| Standard | Reagent | Quantity | Final concentration | Shelf life/storage conditions |
|---|---|---|---|---|
| AMPA 1 | AMPAI3 | 125 μL | 2.5 ng/mL | 48 h/4 °C |
| Ultrapure water | 875 μL | |||
| Total | 1,000 μL | |||
| AMPA 2 | AMPAI3 | 250 μL | 5 ng/mL | 48 h/4 °C |
| Ultrapure water | 750 μL | |||
| Total | 1,000 μL | |||
| AMPA 3 | AMPAI3 | 500 μL | 10 ng/mL | 48 h/4 °C |
| Ultrapure water | 500 μL | |||
| Total | 1,000 μL |
11. FMOC-Cl stock solution (50 mL)
Note: The solution must be stored in a plastic tube covered with aluminum foil.
| Reagent | Quantity | Final concentration | Shelf life/storage conditions |
|---|---|---|---|
| FMOC-Cl 99% | 0.115 g | 2.3 g/mL | 3 months/4 °C |
| Acetonitrile | 50 mL | ||
| Total | 50 mL | n/a |
12. FMOC-Cl working solution (50 mL)
Note: The solution must be stored in a plastic tube covered with aluminum foil.
| Reagent | Quantity | Final concentration | Shelf life/storage conditions |
|---|---|---|---|
| FMOC stock solution | 5 mL | 230 mg/L | 3 months/4 °C |
| Acetonitrile | 45 mL | ||
| Total | 50 mL | n/a |
13. Na2B4O7·10H2O buffer solution 0.125 M pH 9 (120 mL)
Note: The solution can be gently heated under constant stirring to dissolve the reagent completely. If precipitation is observed after some storage time, this procedure may be repeated to redissolve the precipitate. This is a very strong buffer solution; it is recommended to use 3 M HCl or another strong acid to adjust to a pH 9. The final pH of this buffer solution after preparation should be between 10 and 12.
| Reagent | Quantity | Final concentration | Shelf life/storage conditions |
|---|---|---|---|
| Na2B4O7·10H2O | 5.720 g | 0.125 M | 6 months/ambient temperature in an amber flask |
| Ultrapure water | Quantity sufficient | ||
| Total | 120 mL | n/a |
14. 3 M HCl solution (50 mL)
| Reagent | Quantity | Final concentration | Shelf life/storage conditions |
|---|---|---|---|
| HCl | 12.5 mL | 3 M | 1 year/ambient temperature in an amber flask |
| Ultrapure water | 37.5 mL | ||
| Total | 50 mL | n/a |
15. KH2PO4 buffer solution 50 mM pH 5.5 (250 mL)
Note: It is recommended to use NaOH 10% w/v (see Recipe 16) to take this buffer to pH 5.5. This solution should be immediately filtered using a 0.22 μm nylon plain filter disc after preparation.
| Reagent | Quantity | Final concentration | Shelf life/storage conditions |
|---|---|---|---|
| KH2PO4 | 1.7011 g | 50 mM | 1 week/4 °C in an amber flask |
| Ultrapure water | 250 mL | ||
| Total | 250 mL | n/a |
16. NaOH 10% w/v solution (100 mL)
| Reagent | Quantity | Final concentration | Shelf life/storage conditions |
|---|---|---|---|
| NaOH 97% | 10 g | 10% w/v | 1 year/ambient temperature in an amber flask |
| Ultrapure water | 100 mL | ||
| Total | 100 mL |
17. H3PO4 4% v/v solution (100 mL)
| Reagent | Quantity | Final concentration | Shelf life/storage conditions |
|---|---|---|---|
| H3PO4 85% | 4 mL | 4% v/v | 1 year/ambient temperature in an amber flask |
| Ultrapure water | 96 mL | ||
| Total | 100 mL | n/a |
For AH- quantification
1. MPA 10% w/v (25 mL)
| Reagent | Quantity | Final concentration | Shelf life/storage conditions |
|---|---|---|---|
| MPA ACS reagent 33.5%–36.5% | 2.5 g | 10% w/v | 3 months/4 °C in an amber flask |
| Ultrapure water | 25 mL | ||
| Total | 25 mL | n/a |
2. MPA 0.8% w/v (200 mL)
Note: This solution should be immediately filtered using a 0.22 μm nylon plain filter disc after preparation.
| Reagent | Quantity | Final concentration | Shelf life/storage conditions |
|---|---|---|---|
| MPA 10% w/v | 16 mL | 0.8% w/v | 1 week/4 °C in an amber flask |
| Ultrapure water | 184 mL | ||
| Total | 200 mL | n/a |
3. L-ascorbic acid stock solution (1 mL)
Note: The standard stock solution should be prepared on the same day as the samples.
| Reagent | Quantity | Final concentration | Shelf life/storage conditions |
|---|---|---|---|
| L-ascorbic acid 99% | 1 mg | 1 mg/mL | 24 h/4 °C |
| Ultrapure water | 1 mL | ||
| Total | 1 mL | n/a |
4. L-ascorbic acid working solution
Note: The standard working solution should be prepared on the same day as the samples.
| Reagent | Quantity | Final concentration | Shelf life/storage conditions |
|---|---|---|---|
| L-ascorbic acid stock solution | 0.2 mL | 0.1 mg/mL | 24 h/4 °C |
| MPA 0.8% w/v | 0.8 mL | ||
| Total | 1 mL | n/a |
Laboratory supplies
For GLY and AMPA quantification
1. Conical polypropylene centrifuge tubes with plastic screw cap, 15 mL, 120 mm × 17 mm (Sarstedt, catalog number: 62.554.009)
2. Aluminum foil
3. Microtip 2–200 μL (ABDOS, catalog number: P10101)
4. Microtip 100–1,000 μL (ABDOS, catalog number: P10102)
5. Microtip 1–5 mL (ABDOS, catalog number: P10144)
6. 1 mL disposable syringes, sterile (Neojet, catalog number: 12122)
7. Acrodisc® nylon syringe filters, 13 mm, 0.2 μm (Waters, catalog number: WAT200524)
8. 9 mm, Amber, screw-top vial, 12 × 32 mm with cap and pre-slit PTFE/Silicone septa (Waters, catalog number: 186000847C)
9. MAGNA® Nylon, supported plain filter disc, 0.22 μm (Osmonics Inc., catalog number: R02SP04700)
10. Chromatographic column ZORBAX Eclipse Plus C18, rapid resolution HD, 2.1 × 50 mm (1.8 μm) (Agilent, catalog number: 959757-902)
For AH- analysis
1. Microtip 2–200 μL (ABDOS, catalog number: P10101)
2. Microtip 100–1,000 μL (ABDOS, catalog number: P10102)
3. Microtip 1–5 mL (ABDOS, catalog number: P10144)
4. Spinwin® polypropylene microcentrifuge tubes, 1.5 mL (Tarsons, catalog number: 500010)
5. Nanosep® centrifugal devices 0.2 μm Bio-Inert (Pall Corporation, catalog number: ODM02C34)
6. 1 mL disposable syringes, sterile (Neojet, catalog number: 12122)
7. MAGNA® nylon, supported plain filter disc, 0.22 μm (Osmonics Inc., catalog number: R02SP04700)
8. Chromatographic column Supelcosil LC-18 3.3 cm × 4.6 mm (3 μm) (Supelco, catalog number: 58977)
9. Silica (quartz) UV-VIS spectrophotometer cuvette, 10 mm light path (Hellma, catalog number: Z600210-1EA)
Equipment
1. Refrigerated microcentrifuge (Eppendorff, model: 5415R)
2. Vortex (Willmington NC, model: 18405)
3. Automatic pipettes (1–10 μL; 2–20 μL; 20–200 μL; 100–1,000 μL; 1–5 mL) (Gilson, model: Pipetman)
4. Barnstead E-Pure water purification system (Thermo Scientific, model: D4642-33)
5. Sonicator (Branson, model: Sonifier 450)
6. HPLC with electrochemical detector (Perkin Elmer, model: Binary LC Pump 250, integrator 1022; manual injector loop 20 μL), electrochemical detector (ESA, detector model: Coulochem II; analytical cell model: 5011; guard cell model: 5020)
7. UHPLC with fluorometric detector (Waters, model: Acquity UPLC System)
8. High-precision analytical scale (Mettler, model: H6T)
9. Spectrophotometer (Beckman-Coulter, model: DU7400)
Software and datasets
1. Empower Pro (version 2154, 2005). Proprietary software from Waters Corporation. Used for equipment control and results analysis for Waters Acquity® UPLC. Used for peak area integration. It may be replaced by any software associated with an HPLC/UHPLC that has automatic or manual peak integration capabilities
2. Microsoft Excel 365 (version 2410, 2024). It may be replaced by LibreOffice or another free and open-source datasheet software
3. BioRender (https://www.biorender.com/). The following figures were created using BioRender: Graphical overview, Ostera, J. (2025) https://BioRender.com/k98g299
Procedure
We describe below the procedure to separate the culture medium from the microalgal cells and quantify the contents of GLY, AMPA, and AH-. We have divided the procedure into two parts to make it easier to understand. The first part comprises the derivatization and quantification of GLY and AMPA in aqueous culture medium using UPLC-FLR and the second part describes the extraction and quantification of AH- in microalgal cells using HPLC-EC.
A. Cell harvest
1. Transfer a sample volume containing at least 2 mL of microalgal culture spiked with GLY or GLY-based herbicide to a microcentrifuge tube and centrifuge at 9,300× g for 10 min at 4 °C.
2. Transfer the supernatant free of cells to a new microcentrifuge tube and store at -20 °C until processing (up to 3 months).
3. The pellet containing the harvested cells should be stored at -80 °C up to 1 month before processing.
B. GLY and AMPA derivatization
1. Transfer 1 mL of reagent blank, standard, or the supernatant taken in step A2 to a clean 15 mL centrifuge polypropylene conical tube covered in aluminum foil. A reagent blank contains all the solutions necessary to derivatize GLY or AMPA except the sample or standard. In this section of the protocol, a reagent blank should contain only the borate buffer, type 1 ultrapure water, and FMOC working solution in the proportions specified in steps B1, B2, and B3.
2. Add 2 mL of borate buffer solution and vortex to maximum speed for 15 s.
Critical: Check that the pH of the reaction mixture is at least 9 units before proceeding. If the pH of the reaction mixture is below 9, there could be a problem with the borate buffer solution. See Recipes above for more information.
3. Add 1 mL of FMOC-Cl working solution and vortex to maximum speed for 15 s.
Critical: Derivatization reagent solution must be added last to the reaction mixture; otherwise, degradation of the derivatization reagent may occur, and the efficiency of the reaction will be adversely affected.
4. Allow the reaction to occur at room temperature in the dark for 3 h.
5. Add 0.6 mL of 2% v/v H3PO4 and vortex to maximum speed for 15 s to stop the derivatization reaction.
Critical: To successfully stop the derivatization reaction, the pH of the reaction mixture after the addition of the acid must be between 8 and 8.75.
6. Add 1 mL of ethyl acetate and vortex for at least 1 min. Let the sample stand until the organic and aqueous phases are clearly visible. Pipette the organic phase and discard.
7. Repeat step B6 three times, adding 1 mL of ethyl acetate each time.
8. Take the resulting aqueous phase from step B7 with a 1 mL disposable syringe and filter through a 0.22 μm syringe filter into a 9 mm HPLC amber vial.
9. Store derivatized and filtered samples, blanks, or standards taken in step B8 at 4 °C for 24 h before injection in the HPLC system.
Note: Standards and reagent blanks (containing all reagents except sample or standards) must be processed alongside the samples using the same procedure detailed in steps B1–8. It is recommended to process at least three reagent blanks per batch of samples to be analyzed.
C. GLY and AMPA quantification
1. UHPLC system conditioning
a. Condition the chromatographic system with a 60:40 mixture of water:acetonitrile for at least 10 min at a flow rate of 0.3 mL/min. This conditioning should finish with a mixture of 76:24 water:acetonitrile.
b. Finish the system conditioning using a 76:24 mixture of KH2PO4 buffer solution 50 mM pH 5.5:acetonitrile for at least 15 min at 0.3 mL/min.
2. UHPLC system parameter configuration
Table 1 shows the UHPLC system parameter configuration for the quantification of GLY and AMPA.
Table 1. UHPLC system parameters for quantification of GLY and AMPA
| Injection volume (μL) | Flow (mL/min) | Total run time (min) | Excitation wavelength (nm) | Emission wavelength (nm) |
| 10 | 0.3 (0–3 min) | 12 | 266 | 315 |
| 0.5 (4–12 min) | 266 | 315 |
3. Injection sequence: It is recommended to always inject a reagent blank to check for baseline and general UPLC system stability before starting the injection sequence. Table 2 shows a suggested injection order for this method.
Table 2. Suggested order and number of injections of blanks, standards, and samples for the quantification of GLY and AMPA
| Type of injection | Order of injection | N° of injections |
|---|---|---|
| GLY 3 | 1 | 2 |
| AMPA 3 | 2 | 2 |
| Reagent blank | 3 | 1 |
| GLY 1 | 4 | 1 |
| GLY 2 | 5 | 1 |
| GLY 3 | 6 | 1 |
| AMPA 1 | 7 | 1 |
| AMPA 2 | 8 | 1 |
| AMPA 3 | 9 | 1 |
| Sample(s) | 10 | 2 |
| GLY 2 | 11 | 1 |
| AMPA 2 | 12 | 1 |
| Reagent blank | 13 | 1 |
c. The order and number of injections shown in Table 2 can be modified if the retention times of the analytes are inconsistent.
d. When analyzing a large batch of samples, it is recommended to inject a standard of intermediate concentration after every five samples to check for modifications in the retention times of the analytes.
4. Peak integration
a. Identify the retention times of GLY and AMPA in the standards injected. This step can be accomplished by comparing standards of different concentrations and identifying those peaks that increase their area with concentration.
b. Manually integrate the peaks of GLY and AMPA through the baseline or set your program of choice to do it automatically.
c. Register the area of peaks of reagent blanks, standards, and samples to construct the calibration curve. You must subtract the area of peaks present in reagent blanks from those of standards before constructing the calibration curve. Make sure that the area of peaks in the reagent blank (if present) is also subtracted from the area of the samples. This will account for any spurious signals present in the reaction mixture that may match the retention times of GLY and/or AMPA in standards and samples.
Figure 1 shows a typical chromatogram of GLY and AMPA standards injected under the conditions described in Table 1.
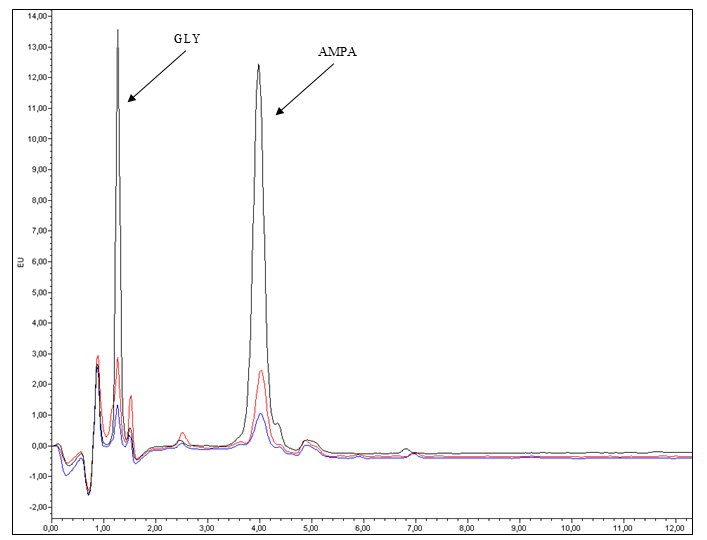
Figure 1. Chromatograms of GLY and AMPA standards analyzed by UPLC-FLR. The blue line represents 5 μg/L standards of GLY and AMPA; the red line represents 10 μg/L standards of GLY and AMPA; and the black line represents 50 μg/L standards of GLY and AMPA.
D. AH- extraction
1. Resuspend the pellet obtained in step A3 in 300 μL of MPA 10% w/v in a polypropylene microcentrifuge tube.
2. Sonicate the samples for 1 min with a duty cycle of 20% and 40 units of output.
3. Centrifuge samples at 9,300× g for 10 min at 4 °C in a refrigerated microcentrifuge.
4. Transfer the supernatant obtained in step D3 to a new microcentrifuge tube.
5. Take 200 μL of the supernatant and add 200 μL of MPA 0.8% w/v (1:2 dilution) in a new microcentrifuge tube.
6. Transfer the dilution to a 0.2 μm Nanosep® centrifugal device and centrifuge at 9,300× g for 2 min.
7. Transfer the filtered dilution to a 9 mm amber HPLC vial previous to the autosampler or manual injection.
E. AH- quantification
1. HPLC system conditioning
a. Condition the chromatographic system with a 60:40 mixture of methanol:water for at least 10 min at 1 mL/min. The objective of this conditioning step is to have the system completely flushed with a mobile phase containing 100% water.
b. Finish system conditioning using 100% MPA 0.8% w/v for at least 15 min at 1 mL/min.
2. HPLC system configuration: Table 3 shows the HPLC system parameters for the quantification of AH-.
Table 3. HPLC system parameters for quantification of AH-
| Injection volume (μL) | Flow (mL/min) | Total run time (min) | EC detector oxidation potential (V) | EC detector current (μA) |
| 20 | 1 | 5 | 0.6 | 10 |
Note: Using these chromatographic parameters, the estimated retention time of AH- is 0.5 min.
3. Injection sequence
It is recommended to inject first the reagent blank to check for baseline and general HPLC system stability, then the L-ascorbic acid working solution, and finally the sample(s). The reagent blank in this case should contain only 0.8% w/v MPA acid and ultrapure water in a 1:1 proportion.
4. Peak integration
a. Identify the retention times of AH- using the standard.
b. Manually integrate the peaks of AH- through the baseline or set your program of choice to do it automatically.
c. Register the area of relevant peaks in reagent blanks, standards, and samples.
Figure 2 shows a typical AH- chromatogram corresponding to a 10 μg/mL working solution injected under the conditions shown in Table 3.
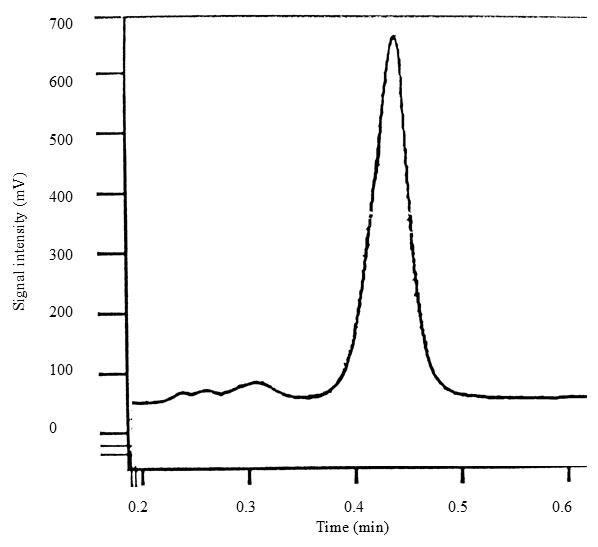
Figure 2. Chromatogram of a 10 μg/mL L-ascorbic acid working solution analyzed by HPLC–EC. The retention time of AH- is approximately 0.5 min.
5. L-ascorbic acid working solution titration: Measure the absorbance of the L-ascorbic acid working solution injected into the HPLC system using a quartz cuvette at a wavelength length of 265 nm using a UV-Vis spectrophotometer.
Data analysis
GLY and AMPA analysis
Transfer the data registered in step D4 to a spreadsheet to build the calibration curves for GLY and AMPA.
Subtract the peak area of GLY and/or AMPA in the reagent blank (if applicable) from those of the standards and sample(s) before constructing the calibration curve.
The calibration curve will relate the peak area obtained with the GLY and AMPA standard concentration.
This quantification method has good linearity (R2 ≥ 0.98) up to a concentration of 50 ng/mL; the resulting calibration curve should not deviate significantly from this value. We recommend processing at least two independent standards of each concentration to build the calibration curve.
Obtain the equation of the curve by applying linear regression and calculate the concentration of GLY and/or AMPA in the samples. If the peak area of the sample is out of the linear range of the calibration curve, then the samples should be diluted before derivatizing.
AH- analysis
Using the absorbance measured in step E5, calculate the molarity of L-ascorbic working solution (ϵ = 14.3 mM-1·cm-1) using the Lambert-Beer law as follows:
A265nm = ϵ × C × l
where A265nm is the absorbance of the L-ascorbic acid working solution measured at 265 nm, ϵ is the extinction coefficient, C is the concentration of the L-ascorbic acid working solution, and l is the pathlength of the quartz cuvette used for measurement (usually 1 cm). In this case, the calculated concentration will be expressed in mM and can be related to the peak area of the standard.
Subtract the peak area of AH- obtained in the reagent blank (if applicable) to that of the standard and sample, in order to correct for any impurities present in the solutions that could be coeluting with AH-.
Calculate the concentration of AH- in the samples by comparing the AH- peak area of the sample to that of the standard. Remember to account for any dilutions applied during sample processing when calculating the AH- concentration in the sample.
The amount of AH- in samples can be expressed as nmol/104 cells, nmol/mg protein, or nmol/mg fresh weight, depending on the information available and/or personal preference. Other concentration units can be used, depending on the results obtained and/or personal preference.
Validation of protocol
Validation data for the protocol for quantification of GLY and AMPA using HPLC-FLR had been previously published [7,8] but was not readily available. We have adapted the most relevant data previously available with the permission of the authors for inclusion in this article.
Figure 3 shows the linear range of the analytical method for quantification of GLY and AMPA, between 0.5 and 50 μg/L.
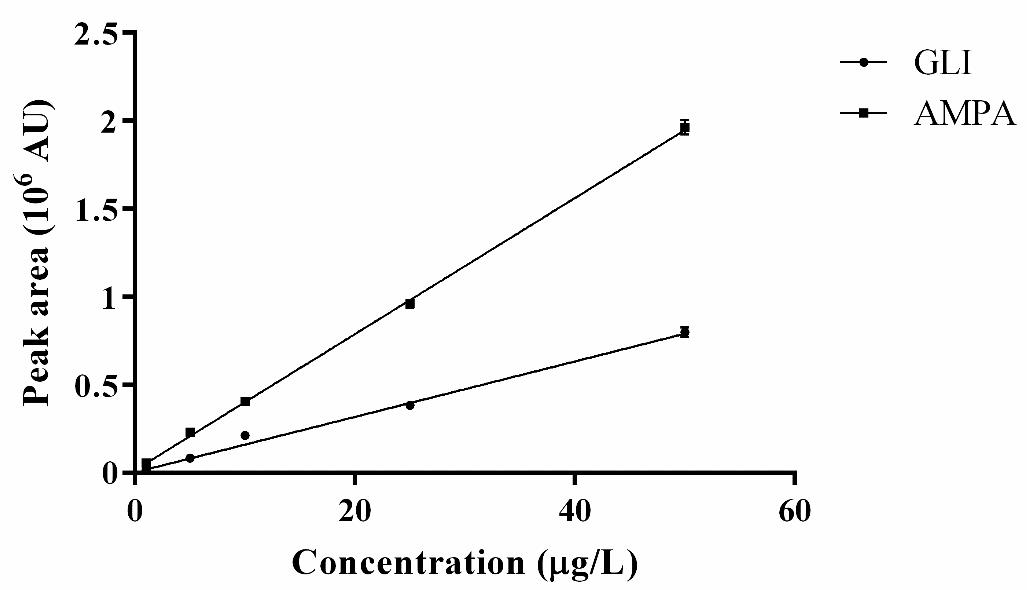
Figure 3. Linear range of the analytical method for quantification of GLY and AMPA in culture medium. (●) GLY; (■) AMPA. Data obtained from the analysis of at least three independently derivatized standards of each concentration. Results expressed as mean ± SD. R2 = 0.99 for both analytes (p < 0.05). AU: arbitrary units.
The linear regression method was used to calculate the limit of detection (LOD) and limit of quantitation (LOQ) for GLY and AMPA according to [9]. Table 4 shows these results.
Table 4. Limit of detection (LOD) and quantitation (LOQ) for GLY and AMPA
| LOD (μg/L) | LOQ (μg/L) | |
|---|---|---|
| GLY | 0.2 | 0.5 |
| AMPA | 1.1 | 2.2 |
Table 5 shows the precision of the method for the analysis of GLY and AMPA expressed as %CV and calculated according to [9], in the linear range of 0.5–50 μg/L, for each analyte.
Table 5. Precision of the method for GLY and AMPA analysis in the linear range
| Concentration (μg/L) | % CV GLY | % CV AMPA |
|---|---|---|
| 0.5 | 11.5 | - |
| 1.0 | 3.7 | 10.2 |
| 2.5 | 1.2 | 2.9 |
| 5.0 | 3.0 | 10.4 |
| 10 | 2.0 | 1.5 |
| 25 | 4.1 | 2.5 |
| 50 | 3.4 | 2.0 |
General notes and troubleshooting
General notes
The protocols described in this article both require a basic knowledge of HPLC and its fundamental procedures. It is recommended to follow the guidelines established in your laboratory for the correct use and maintenance of this type of equipment.
All liquid chromatography systems are very sensitive to the introduction of particles and air into the system. Make sure all solutions, solvents, and liquids that will be entering the HPLC are thoroughly filtered and degassed, in case your equipment does not include an incorporated degasser unit. Since the filtration process tends to produce bubbling, one way to eliminate any bubbles remaining after filtering is by using a sonicator bath.
It is also very important to correctly design the conditioning programs that will be used to prime the HPLC systems for analysis. The mobile phase used for the quantification of GLY and AMPA contains a saline buffer. Make sure to flush the system free of buffer solution before washing with solvents to prevent precipitation of ions in the system and/or column.
Troubleshooting
No peaks of GLY or AMPA observed after injection
This problem is usually related to an incomplete derivatization reaction. The most important factors affecting this step are the initial and final pH of the mixture reaction. Therefore, the recommended course of action is to first check the pH of the borate buffer solution before adding it to the reaction mixture. It should always be between 9 and 9.2. If this is not the case, then the derivatization reaction should be repeated. It is not possible to adjust the pH of the reaction mixture once all reagents have been added. The addition of a base such as NaOH can adversely affect the sample and derivatization agent.
Another possible cause of this problem is the final pH of the reaction mixture after the addition of H3PO4. In this case, you must ensure the pH of the mixture is under 9 units, ideally close to 8.5 units, after adding the acid. You may check this using universal pH paper or a pH meter. If this is not the case, first make sure the mixture is thoroughly mixed by vortexing for another 30 s. If the pH is still 9, you may add up to 0.5 mL of acid to the mixture to reach the final pH.
A particularly insidious and hard-to-diagnose cause for this issue is an incorrect loading order during the derivatization step of GLY and AMPA. It is crucial that FMOC-Cl is added last; otherwise, it can react with the borate buffer and consume itself before the reaction is complete. This derivatization reaction is highly inefficient; the proportions of FMOC-Cl:GLY or FMOC:AMPA should be at least 3,000:1 in order to get consistent results.
Inconsistent baseline when measuring analytes
In this case, it is recommended to extend the running time of the conditioning step with a mobile phase until a consistent baseline is observed. Possible causes for this problem include particles and/or air in the column or system, in which case it is recommended to flush the system of mobile phase, purge the pump to eliminate any air remaining, and wash thoroughly with 100% methanol. Remember to first wash with ultrapure and filtered water if you have been using a buffer solution in the mobile phase, to avoid ion precipitation in the system.
Acknowledgments
These protocols were financed by grants from the University of Buenos Aires (UBACyT 20020170100199BA), CONICET (PIP 11220170100539CO) and Agencia para la Promoción Científica y Desarrollo tecnológico (ANPCyT PID 0032/2011) and were first described in Ostera [10], DOI: https://doi.org/10.1016/j.chemosphere.2020.125955.
The authors wish to thank Leonardo Ulises Spairani for his contributions to laboratory work and data analysis.
We also wish to thank the assistance and guidance of Dr. Juan Santiago Adán Areán for the elaboration of the graphical abstract.
Competing interests
All authors declare that there are no conflicts of interest of any category for the present publication.
Ethical considerations
All authors declare that there are no ethical considerations relevant to the protocols described in the present publication.
References
- Nedelkoska, T. and Low, G. C. (2004). High-performance liquid chromatographic determination of glyphosate in water and plant material after pre-column derivatisation with 9-fluorenylmethyl chloroformate. Anal Chim Acta. 511(1): 145–153. https://doi.org/10.1016/j.aca.2004.01.027
- Kutnink, M. A., Hawkes, W. C., Schaus, E. E. and Omaye, S. T. (1987). An internal standard method for the unattended high-performance liquid chromatographic analysis of ascorbic acid in blood components. Anal Biochem. 166(2): 424–430. https://doi.org/10.1016/0003-2697(87)90594-x
- Piccoli, G., Fiorani, M., Biagiarelli, B., Palma, F., Potenza, L., Amicucci, A. and Stocchi, V. (1994). Simultaneous high-performance capillary electrophoretic determination of reduced and oxidized glutathione in red blood cells in the femtomole range. J Chromatogr A. 676(1): 239–246. https://doi.org/10.1016/0021-9673(94)80465-6
- Nováková, L., Solich, P. and Solichová, D. (2008). HPLC methods for simultaneous determination of ascorbic and dehydroascorbic acids. TrAC, Trends Anal Chem. 27(10): 942–958. https://doi.org/10.1016/j.trac.2008.08.006
- Gazdik, Z., Zitka, O., Petrlova, J., Adam, V., Zehnalek, J., Horna, A., Reznicek, V., Beklova, M. and Kizek, R. (2008). Determination of Vitamin C (Ascorbic Acid) Using High Performance Liquid Chromatography Coupled with Electrochemical Detection. Sensors. 8(11): 7097–7112. https://doi.org/10.3390/s8117097
- ASTM International. (2018). Standard specification for reagent water (D1193-6). https://doi.org/10.1520/D1193-06R18
- Ostera, J. M., Bonetto, J. G., Spairani, L. U. and Olmos, V. (2015). Experimental design applied to method development for quantifying glyphosate and AMPA in water. Acta Toxicológica Argentina, Vol 23 (Supplement). ISSN 0327-9286.
- Ostera, J. M., Bonetto, J. G., Olmos, V. and Villaamil Lepori, E. C. (2015). Optimización de un método analítico por HPLC para la cuantificación de glifosato y AMPA en aguas de consumo humano. LX Reunión de la Sociedad Argentina de Investigación Clínica (SAIC).
- United States Food and Drug Administration. (2021). Q2(R1) Validation of Analytical Procedures: Text and Methodology Guidance for Industry.
- Ostera, J. M., Malanga, G. and Puntarulo, S. (2020). Assessment of oxidative balance in hydrophilic cellular environment in Chlorella vulgaris exposed to glyphosate. Chemosphere. 248: 125955. https://doi.org/10.1016/j.chemosphere.2020.125955
Article Information
Publication history
Received: Dec 17, 2024
Accepted: Feb 25, 2025
Available online: Mar 20, 2025
Published: Apr 5, 2025
Copyright
© 2025 The Author(s); This is an open access article under the CC BY-NC license (https://creativecommons.org/licenses/by-nc/4.0/).
How to cite
Ostera, J. M., Olmos, V., Puntarulo, S., Bonetto, J. G. and Malanga, G. (2025). High-Performance Liquid Chromatography Quantification of Glyphosate, Aminomethylphosphonic Acid, and Ascorbate in Culture Medium and Microalgal Cells. Bio-protocol 15(7): e5263. DOI: 10.21769/BioProtoc.5263.
Category
Plant Science > Plant biochemistry > Other compound
Biochemistry > Other compound > Ascorbate
Do you have any questions about this protocol?
Post your question to gather feedback from the community. We will also invite the authors of this article to respond.