- Protocols

- Articles and Issues
- For Authors
- About
- Become a Reviewer

Enzymatic Starch Quantification in Developing Flower Primordia of Sweet Cherry

Published: Vol 15, Iss 7, Apr 5, 2025 DOI: 10.21769/BioProtoc.5256 Views: 1897
Reviewed by: Demosthenis ChronisAnonymous reviewer(s)
Advertisement


Protocol Collections
Comprehensive collections of detailed, peer-reviewed protocols focusing on specific topics


Related protocols
Abstract
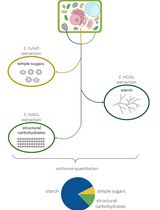
Starch is a carbohydrate widely used in the plant kingdom as a fuel for different physiological processes. While different techniques are available for the quantification of starch stored in seeds and bark tissues, they have hardly been used to quantify starch content in developing flower buds, where starch has been reported to accumulate in different reproductive organs. Here, we detail a quantitative enzymatic method to measure starch concentration in developing flower primordia in sweet cherry (Prunus avium L.). First, starch is enzymatically hydrolyzed to D-glucose, which was then quantified by an enzyme-coupled assay involving hexokinase (HK) and glucose-6-phosphate dehydrogenase (G6PD) and spectrophotometric quantification of NADH absorbance at 340 nm. This method is a sensitive, rapid, and affordable protocol specifically optimized for tiny flower buds with low starch content. The technique is revealed to successfully determine starch content in non-freshly harvested samples—frozen and stored at -20 °C or stored in fixatives—allowing a temporal separation of sampling and quantification and making the protocol suitable for high-throughput experimental designs in different fields of plant research.
Key features
• Sensitive protocol to quantify starch content in developing flower primordia of sweet cherry.
• Starch quantification based on enzymatic hydrolysis of starch and spectrophotometric quantification of NADH absorbance at 340 nm using the hexokinase and glucose-6-phosphate dehydrogenase coupled assay.
• Accurately detects starch in very small samples with low starch concentrations in both fixed and frozen plant material.
Keywords: Starch enzymatic assayBackground
Starch is a carbohydrate widely produced in plants and composed of homopolymers of glucose, consisting mainly of two glucans, amylopectin and amylose [1]. In woody plant species, starch is the main storage carbohydrate [2], which accumulates in dedicated plant organs, covering the long-term glucan needs that fuel different processes such as germination or regrowth after certain periods of dormancy [3]. In addition, starch sustains the development of different plant reproductive tissues [4]. Various waves of amylogenesis and amylolysis have been reported during stamen and anther development [4–7] and during pollen tube growth within the style and the ovary [8,9]. Although the physiological and developmental functions of starch accumulation in reproductive organs are not fully understood, it has been suggested to support the development of reproductive organs and the male and female germline during flower development, the heterotopic growth of pollen tubes during the progamic phase, and the development of the embryo and seed after fertilization [4,8,10] and underpin the likelihood of a flower to become a fruit [11,12].
Different methodologies have been used to quantify starch content, such as high-performance liquid chromatography, gas chromatography, hydrolysis with perchloric or sulfuric acids, and enzymatic methods ([13] and references therein). Although these methods have been applied on leaves, roots, shoots, or bark tissues, they have not been used in developing flower buds harboring one to several tiny flower primordia, probably due to their small size and low starch concentration. Instead, starch quantification in these small reproductive structures has been performed using histochemical microscopy techniques coupled with a specific image analysis system, which can only provide relative values of starch content [14,15]. The enzymatic hydrolysis of starch coupled with the spectrophotometric assay of hexokinase activity, originally used to quantify starch content in fresh leaves [16,17] and later optimized for fresh small flower organs of Arabidopsis [4], has been further optimized in this work to quantify starch content in small developing reproductive organs of cultivated woody plant species like sweet cherry (Prunus avium L.).
Our main objective was to optimize the enzymatic methodology to quantify starch concentration in small developing flower primordia with low starch concentrations. For this purpose, starch was gelatinized and enzymatically digested by amylase and amyloglucosidase into D-glucose. Next, a coupled hexokinase/glucose-6-phosphate dehydrogenase (HK/G6PD) enzyme assay was used to convert D-glucose into a stoichiometric amount of gluconate-6-phosphate and NADH. NADH was finally measured using a microplate reader, as it absorbs UV light at 340 nm. To make it useful for plant research applications where samples are routinely processed for histochemistry, this method is optimized for samples stored in fixative or frozen at -20 °C. This alternative enables developmental time-series sampling and long-term preservation for high-throughput sample processing and measurements. Thus, this protocol has the advantages of being simple, sensitive, and quick, not using harmful reagents, requiring reasonable labor, and not requiring specific laboratory equipment other than a UV spectrophotometer. The protocol has proven to be sensitive to very low sample weights (less than 1 mg) and low starch concentration (less than 0.18 mg/g of frozen or fixed sample), and the same results were obtained with both frozen and fixed samples.
The development of this enzymatic approach, applied for the first time to a fruit species, enables the quantification of starch in very small samples, such as reproductive structures. Previously, starch in these structures could only be assessed through histochemistry combined with image analysis, which allowed for the determination of relative content but not total quantification. Additionally, this method is equally effective with both frozen and fixed material, significantly extending the storage time of the samples.
Materials and reagents
Plant material
1. Flower buds from sweet cherry (Prunus avium L.) cultivar Earlise
a. Preserved in Carnoy’s fixative [samples are submerged into 96% ETOH/acetic acid glacial (3:1) for 24 h and then stored in 80% ETOH at 4 °C]
b. Preserved directly frozen at -20 °C
Reagents
1. 80% and 96% (v/v) ethanol (ETOH) (PanReac, catalog number: 141085)
2. Distilled water (dH2O) (Ecomatic, Wasserlab)
3. Ultrapure water (Ultramatic, Wasserlab)
4. Acetic acid glacial (Sigma, catalog number: 695092-2.5L)
5. Sodium acetate anhydrous (Sigma, catalog number: W302406)
6. Amyloglucosidase (Roche, catalog number: 11202332001)
7. Alpha-amylase (Roche, catalog number: 11202332001)
8. 4-(2-Hydroxyethyl)piperazine-1-ethanesulfonic acid (HEPES) (Sigma, catalog number: H3375)
9. Hexokinase (Roche, catalog number: 11426362001)
10. ATP (Merck, catalog number: A2383-1G)
11. NAD+ (Roche, catalog number: 10127965001)
12. MgCl2 (Sigma, catalog number: M8266-100G)
13. Glucose 6-phosphate dehydrogenase (G6PD) (Roche, catalog number: 10165875001)
14. D-glucose (Sigma, catalog number: G8273-100G)
15. Lugol’s iodine solution (Sigma, catalog number: 32922)
16. Sodium hydroxide (NaOH) (Sigma, catalog number: S5881)
17. Hydrochloric acid (HCl) (Sigma, catalog number: 258148)
Solutions
1. 200 mM sodium acetate buffer (pH 4.8) (see Recipes)
2. 100 mM HEPES (pH 7.5) (see Recipes)
3. 100 mM ATP (see Recipes)
4. 100 mM NAD+ (see Recipes)
5. 100 mM MgCl2 (see Recipes)
6. Digestion mix (see Recipes)
7. Glucose assay mix (see Recipes)
8. Glucose stock solution 2.5 mM (see Recipes)
Recipes
1. 200 mM sodium acetate buffer (pH 4.8)
a. Solution A: Acetic acid glacial (MW 60.05 g/mol, d= 1.049 g/mL) 200 mM: 1.15 g in 100 mL of dH2O.
b. Solution B: Sodium acetate anhydrous (MW 82.03 g/mol) 200 mM: 1.64 g in 100 mL of dH2O.
c. Mix 20 mL of solution A, 30 mL of solution B, and 50 mL of dH2O.
2. 100 mM HEPES (pH 7.5)
a. Add 2.383 g of HEPES (MW 238.3 g/mol) to 80 mL of dH2O.
b. Adjust pH to ~7.5 using NaOH and HCl.
c. Complete with dH2O to 100 mL.
3. 100 mM ATP
Add 100 mg of ATP to 1.81 mL of ultrapure H2O.
4. 100 mM NAD+
Add 1 g of NAD+ to 15 mL of dH2O.
5. 100 mM MgCl2
Add 9.521 g of MgCl2 to 1,000 mL of dH2O.
6. Digestion mix
200 mM sodium acetate buffer, amyloglucosidase (6.3 U/mL), and alpha-amylase (50 U/mL). Example for 6 mL (40 samples × 150 µL each):
| Reagent | Quantity/Volume |
|---|---|
| Amyloglucosidase | 6.3 mg |
| Alpha-amylase | 30 µL |
| Sodium acetate buffer | 5,963.7 µL |
7. Glucose assay mix
100 mM HEPES pH 7.5, 1 mM MgCl2, 1 mM ATP, 1 mM NAD+, and hexokinase (6 U/mL). Example for 15 mL (96 samples × 150 µL each):
Note: Prepare extra solution when using a multipipette as it discards at least two dispensing volumes.
| Reagent | Volume |
|---|---|
| MgCl2 | 150 µL |
| ATP | 150 µL |
| NAD+ | 150 µL |
| Hexokinase | 60 µL |
| HEPES | 14,490 µL |
8. Glucose stock solution 2.5 mM
Add 0.045 g of D-glucose to 100 mL of dH2O.
Laboratory supplies
1. Microtubes 0.6 and 1.5 mL
2. Screw-capped microtubes 1.5 mL
3. Pipette tips (2–20, 20–200, and 100–1,000 µL)
4. Combi tips (0.1 and 10 mL)
5. 96-well microplates (Greiner, UV-STAR, catalog number: 655801)
Equipment
1. Thermoblock (Daihan Scientific, model: MaXtable H20)
2. Microcentrifuge (Beckman Coulter, model: Microfuge 16)
3. Analytical balance (Sartorius, model: Secura225-1S)
4. Pipettes (Gilson) (2–20, 20–200, and 100–1,000 µL)
5. Multipipette (Eppendorf, model: Multipette E3)
6. Incubator (Memment GmbH & Co., model: IN11)
7. Microtiter plate reader (Agilent, model: BioTek Epoch)
8. TissueLyser (Qiagen, model: TissueLyser II)
Procedure
A. Plant material preparation
1. Dissect flower buds (Figure 1A) by removing bud scales (Figure 1B) so individual flower primordia (Figure 1C, D) are recovered.
Note: If working with frozen samples, thaw in the refrigerator (4 °C) the day before dissection.
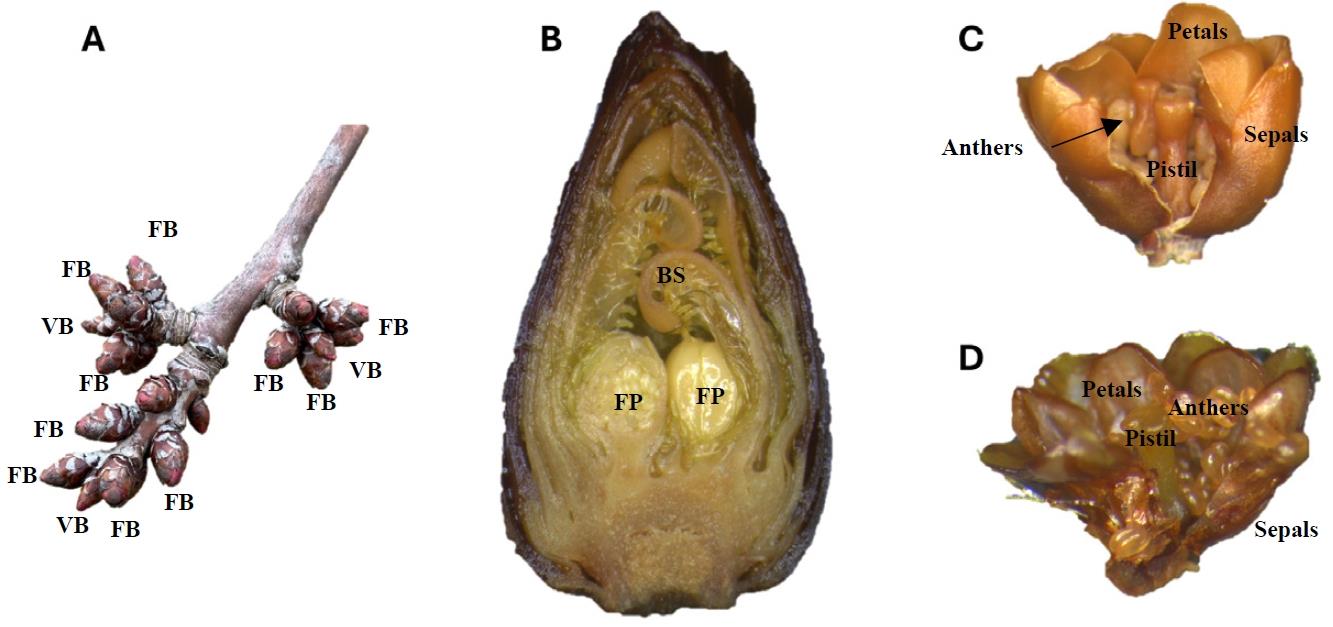
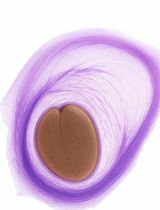
Figure 1. Flower buds and flower primordia from sweet cherry during winter dormancy. (A) Flower buds (FB) around the apical vegetative buds (VB) in a shoot. (B) Longitudinal section of a flower bud showing two flower primordia (FP) protected by bud scales (BS). (C) A fixed flower primordium and (D) a frozen flower primordium showing developing reproductive organs: sepals, petals, anthers, and pistil.
2. Weigh the flower primordia (a minimum weight of 1 mg is recommended). Record the weight; this will be the Sample weight.
Note: When working with fixed samples, the flower primordium should be quickly dried on tissue paper by gently dabbing it against the tissue before weighing it to remove excess fixative.
3. Place the flower primordia in a microcentrifuge tube and add 600 µL of 80% ETOH.
4. Assign an ID to each sample.
B. Homogenization and removal of dissolved sugars and contaminants
1. Heat the samples at 80 °C for 2 min in a thermoblock.
2. Add a TissueLyser metal ball to each microcentrifuge tube and grind the samples in the TissueLyser for 10 min at 30 m/s.
3. Remove the metal ball using a magnet.
Note: Use a minimum volume of 80% ETOH to recover any particles adhering to the ball before removing it.
4. Centrifuge the samples at 3,500× g for 10 min at room temperature and thoroughly discard the supernatant.
Note: Make sure no particulate material is discarded with the supernatant.
5. Add 600 µL of 80% ETOH and homogenize.
6. Repeat steps B1, B4, and B5 twice to ensure total sugar removal.
7. Centrifuge the samples at 3,500× g for 10 min at room temperature, thoroughly discard the supernatant, and let the pellet dry by inverting the tubes.
Note: Make sure that the ETOH has completely evaporated from the sample before continuing with the next step.
8. Resuspend the pellet by adding 400 µL of dH2O (write down the volume; this will be the Resuspension volume).
9. Samples can be stored at this point at -20 °C for short-term storage (a few weeks) or -80 °C for long-term storage (several months).
C. Starch gelatinization and enzymatic hydrolysis
1. Transfer 400 µL of the sample to a screw-capped microcentrifuge tube.
Note: Ensure that samples are uniformly resuspended before transferring.
2. Heat the samples at 95 °C for 15 min in a thermoblock.
3. Allow the samples to cool to room temperature and spin briefly for 5–10 s.
4. Mix the samples well by pipetting and transfer 150 µL to each of two 1.5 mL microcentrifuge tubes (write down the volume; this will be the Digested sample volume). To the first tube, add 150 µL of digestion mix. To the second, the undigested control, add 150 µL of sodium acetate buffer (write down the volume; this volume will be the Digestion volume for each treatment).
5. Incubate the samples for 4 h at 37 °C.
Note: To check the efficiency of digestion, aliquots of control and digested samples can be stained with Lugol’s iodine solution, adding a drop to each tube. Control samples should show typical starch staining, while the digested samples should not stain (Figure 2).
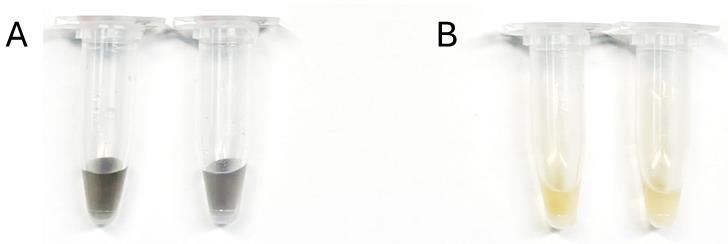
Figure 2. Efficiency test of the starch digestion using Lugol’s iodine staining. (A) Undigested control samples in which the Lugol’s stain reacts with the starch in the sample, changing to the typical dark brown/purple color. (B) Fully digested samples in which the absence of starch results in a yellowish coloration after Lugol’s staining.
6. Centrifuge the samples at 13,000× g for 10 min at room temperature to remove particulate matter and recover the supernatant. The supernatant contains the glucose released by the enzymatic hydrolysis of starch.
7. Samples can be stored at this point at -20 °C for short-term storage or -80 °C for long-term storage.
D. Spectrophotometric assay of HK/G6PD activity
1. In each well of the plate, add 50 µL of sample (write down the volume, this will be the Sample volume in assay) and 150 µL of glucose assay.
Note: Depending on the variability of starch content between biological replicates, adjust the number of replicates to a minimum of three.
2. Read the absorbance in the spectrophotometer at 340 nm (OD 340).
3. Add 1 µL of G6PD to each well.
4. Mix on an orbital shaker for 1 min.
5. Read the absorbance again in the spectrophotometer at 340 nm after a constant value is reached (it should not take more than 10–15 min).
6. The final absorbance value of each sample (ΔOD 340) is the difference between the last reading (step D5) and the first reading (step D2).
7. To obtain the net absorbance value of each sample (ΔOD 340e), subtract the final absorbance value of the control sample (ΔOD 340 control sample) from the final absorbance value of the digested sample (ΔOD 340 digested sample).
E. Glucose standard curve
1. Prepare 1,500 µL of each glucose concentration in the calibration series (Table 1).
Table 1. Calibration series of glucose concentration
| Glucose concentration (mM) | Glucose stock solution (µL) | dH2O (µL) |
|---|---|---|
| 0 | 0 | 1,500 |
| 0.1 | 60 | 1,440 |
| 0.2 | 120 | 1,380 |
| 0.3 | 180 | 1,320 |
| 0.4 | 240 | 1,260 |
| 0.5 | 300 | 1,200 |
| 0.6 | 360 | 1,140 |
| 0.8 | 480 | 1,020 |
| 1 | 600 | 900 |
| 1.5 | 900 | 600 |
2. Repeat steps D1–D6 but replacing samples for each glucose concentration.
Note: We recommend using at least three replicates.
Data analysis
Glucose quantification was performed using an enzyme-coupled assay. In this assay, HK catalyzed the phosphorylation of glucose to glucose-6-phosphate (G6P) using ATP as a phosphate donor. Subsequently, G6PD catalyzed the oxidation of G6P to 6-phosphogluconate, concurrently reducing an equimolar amount of NAD+ to NADH. NADH, unlike NAD+, absorbs light at a wavelength of 340 nm, allowing its quantification via spectrophotometric analysis. Therefore, from this absorbance reading, we were able to calculate the concentration of glucose (equimolar amount) and then the concentration of starch using the mass of the glucosyl residue in starch.
It is important that absorbance reads fall within the linear absorbance range of the spectrophotometer. For too-low values, increase the Sample volume in the glucose assay or decrease the Resuspension volume to increase the reading. For too-high values, reduce the Sample volume in the glucose assay or increase the Resuspension volume to reduce the reading.
At this point of the protocol, we have written down the different weights and volumes noted in the protocol (Sample weight, Resuspension volume, Digested sample volume, Digestion volume, and Sample volume in assay), obtained a ΔOD 340e for each sample, and extracted the slope and intercept parameters (Figure 3) from the fitted linear regression of our glucose standard curve. Thus, the starch concentration can be estimated by the equations described below.
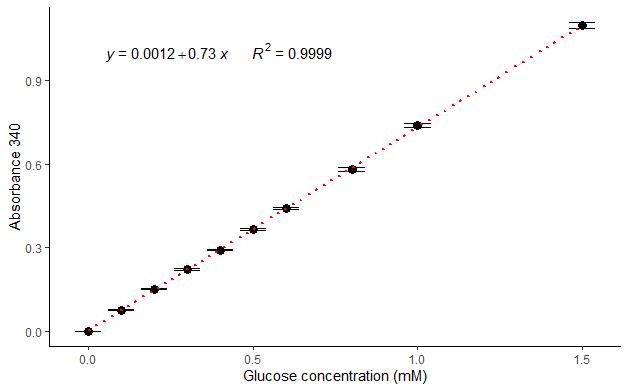
Figure 3. Representative glucose standard curve. Each point represents the average of three technical replicates. Error bars represent standard deviations. The slope (0.73) and the intercept (0.0012) are extracted from the linear regression (equation and red dotted line). The R2 coefficient (0.9999) was calculated by the least squares method.
Starch concentration determination
1. Glucose concentration in Sample volume in assay [µmol/µL]:
(1)
Mi: Glucose concentration in Sample volume in assay [µmol/µL], which is the same concentration as in the Digestion volume
ΔOD 340e: Absorbance value obtained for the sample
Slope of standard curve: Slope extracted from the linear regression fit on the glucose standard curve
: Conversion factor from mM (corresponding to glucose concentration in the standard curve) to M, i.e., to µmol/µL
Sample volume in assay: Volume of sample added to the plate (step D1)
2. Glucose concentration in Digested sample volume [µmol/µL]:
(2)
Mii: Glucose concentration in Digested sample volume [µmol/µL]
Mi: Glucose concentration of Digestion volume [µmol/µL]
Digested sample volume: Volume of sample added for digestion (step C4)
Digestion volume: Total volume of digestion (step C4)
3. Total glucose in the starch suspension [µmol]:
(3)
ni: Total glucose in the starch suspension [µmol]
Mii: Glucose concentration in Volume of digested sample [µmol/µL]
Resuspension volume: Volume of sample after resuspension (step B8)
4. Content of glucose in starch per Sample weight [µmol/g of frozen or fixed sample]:
(4)
Ni: Content of glucose in starch per original Sample weight [µmol/g]
ni: Total glucose in starch suspension [µmol]
Sample weight: Weight of the frozen or fixed sample (step A2)
5. Starch content [mg/g Sample weight]:
(5)
mi: Starch content in the original Sample weight [mg/g sample weight]
Ni: Content of glucose in starch [µmol/g sample weight]
162: Molecular mass of glucosyl
Validation of protocol
To validate the protocol, we used a developmental time series of flower buds from sweet cherry (Prunus avium L.). Flower buds of the cultivar Earlise were collected throughout the winter/early spring of 2023–2024 on five dates (November 22, December 20, January 24, February 20, and March 12). Four biological replicates per sample date were stored in two different ways: frozen at -20 °C and preserved in Carnoy's fixative. Thus, a total of 40 samples (10 treatments) were analyzed. A 96-well plate layout of the experiment is illustrated in Figure 4.
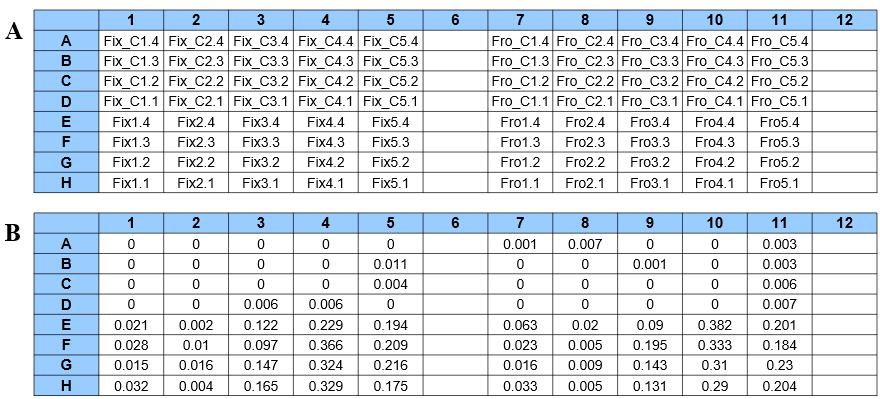
Figure 4. 96-well plate layout. (A) Layout of a representative 96-well plate designed for the experiment. (B) Representative ΔOD measurements at 340 nm for glucose standards and samples. Prefix “Fix” refers to samples preserved in Carnoy’s fixative; prefix “Fro” refers to frozen samples; “Fix_C” and “Fro_C” refer to controls of fixed and frozen samples, respectively.
Representative results
Starch concentrations were estimated for each sample of developing flower primordia. Starch content ranged from 0.178 to 16.193 mg/g of Sample weight. To our knowledge, this is the first quantitative enzymatic measurement of starch content in flower primordia of any fruit tree. A similar methodology was conducted in flower organs (sepal, petal, and stamen) of the model species Arabidopsis thaliana, and lower starch concentrations were obtained, ranging from 0.2 to 1.7 mg/g of fresh weight [4]. The higher content obtained here might reflect species-specific differences or discrepancies in developmental stages.
To test whether the storage method affected the quantitative measurement of starch content, a two-way ANOVA test was performed (Table 2). Storage had no significant effect (p = 0.325), meaning that preserving samples frozen or in fixative had no effect on starch concentration as determined by this methodology. Thus, these results open up new applications for this protocol in some fields of plant research, such as that of sexual plant reproduction, where samples are routinely preserved in fixatives for histological characterization.
Table 2. 2-way ANOVA test. Coefficients for degrees of freedom (Df), sum of squares (Sum Sq), mean square (Mean Sq), F value, and p-value for the main effects storage and date, the interaction storage/date, and the residuals.
| Df | Sum Sq | Mean Sq | F value | p-value (>F) | |
|---|---|---|---|---|---|
| Storage | 1 | 0.4 | 0.35 | 0.134 | 0.717 |
| Date | 4 | 808.6 | 202.16 | 77.256 | 2.34e-15 *** |
| Storage/Date | 4 | 1.4 | 0.35 | 0.134 | 0.969 |
| Residuals | 30 | 78.5 | 2.62 |
Interestingly, there was a significant effect of the date of sampling (p = 2.34-15), meaning that there were differences in starch concentration in flower primordia over the dormancy period. The pattern of starch accumulation and degradation obtained (Figure 5), with a gradual increase in starch content during winter until reaching a maximum followed by a sudden and strong decrease prior to bud break, is similar to the pattern we observed using histochemical semi-quantitative analysis of starch accumulation in the pistil of flower primordia [10].
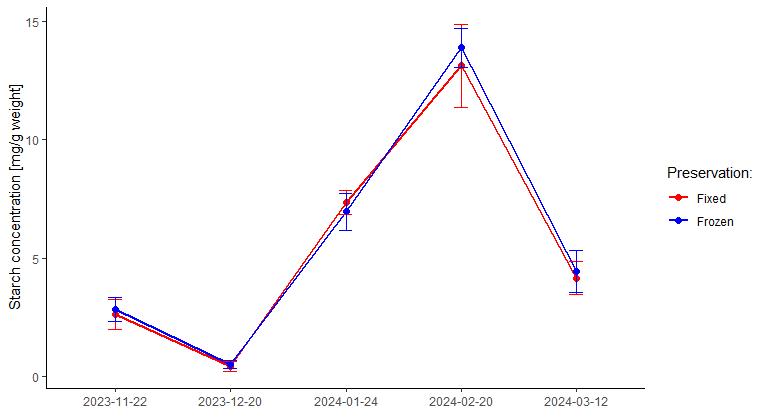
Figure 5. Enzymatic quantification of starch in developing flower primordia of sweet cherry. Samples were harvested throughout the dormancy period and frozen or preserved in fixative prior to quantification. Error bars represent standard errors.
In summary, this protocol makes it possible to quantitatively measure the starch content in small flower primordia of a stone fruit tree.
The protocol is highly sensitive, allowing the quantification of starch in samples weighing less than 1 mg and containing as little as 0.178 mg of starch per gram of sample.
By allowing the measurement of starch content in samples preserved in Carnoy’s fixative, the protocol can be applied to different fields of plant research where samples are routinely preserved in fixative. By allowing a temporal separation between sampling and measurement, the protocol can be used in high-throughput experimental designs (e.g., intensive sampling and preservation in fixative for long periods).
The results on starch dynamics during the dormancy period confirm the pattern previously observed by our research group using a semi-quantitative histological methodology, which strongly supports the validity of this new methodology.
Acknowledgments
This work was funded by the R&D&I project PID2020-115473RR-I00 financed by MICIU/AEI/10.13039/501100011033 and the Government of Aragón – European Social Fund, ‘The ESF invests in your future’ [Consolidated Group A12–17R].
Competing interests
The authors declare no competing interests.
References
- Streb, S. and Zeeman, S. C. (2012). Starch Metabolism in Arabidopsis. Arabidopsis Book. 10: e0160. https://doi.org/10.1199/tab.0160
- Chapin, F. S., Schulze, E. and Mooney, H. A. (1990). The Ecology and Economics of Storage in Plants. Annu Rev Ecol Syst. 21(1): 423–447. https://doi.org/10.1146/annurev.es.21.110190.002231
- Smith, A. M. (2012). Starch in the Arabidopsis plant. Starch - Starke. 64(6): 421–434. https://doi.org/10.1002/star.201100163
- Hedhly, A., Vogler, H., Schmid, M. W., Pazmino, D., Gagliardini, V., Santelia, D. and Grossniklaus, U. (2016). Starch Turnover and Metabolism during Flower and Early Embryo Development. Plant Physiol. 172(4): 2388–2402. https://doi.org/10.1104/pp.16.00916
- Clément, C., Chavant, L., Burrus, M. and Audran, J. (1994). Anther starch variations in Lilium during pollen development. Sex Plant Reprod. 7(6): 347–356. https://doi.org/10.1007/bf00230513
- Julian, C., Rodrigo, J. and Herrero, M. (2011). Stamen development and winter dormancy in apricot (Prunus armeniaca). Ann Bot. 108(4): 617–625. https://doi.org/10.1093/aob/mcr056
- Fadón, E., Herrero, M. and Rodrigo, J. (2019). Anther and pollen development in sweet cherry (Prunus avium L.) in relation to winter dormancy. Protoplasma. 256(3): 733–744. https://doi.org/10.1007/s00709-018-01332-4
- Rodrigo, J. and Herrero, M. (1998). Influence of intraovular reserves on ovule fate in apricot (Prunus armeniaca L.). Sex Plant Reprod. 11(2): 86–93. https://doi.org/10.1007/s004970050124
- Alcaraz, M. L., Hormaza, J. I. and Rodrigo, J. (2013). Pistil Starch Reserves at Anthesis Correlate with Final Flower Fate in Avocado (Persea americana). PLoS One. 8(10): e78467. https://doi.org/10.1371/journal.pone.0078467
- Fadón, E., Herrero, M. and Rodrigo, J. (2018). Dormant Flower Buds Actively Accumulate Starch over Winter in Sweet Cherry. Front Plant Sci. 9: e00171. https://doi.org/10.3389/fpls.2018.00171
- Rodrigo, J., Hormaza, J. I. and Herrero, M. (2000). Ovary starch reserves and flower development in apricot (Prunus armeniaca). Physiol Plant. 108(1): 35–41. https://doi.org/10.1034/j.1399-3054.2000.108001035.x
- Rodrigo, J., Herrero, M. and Hormaza, J. (2009). Pistil traits and flower fate in apricot (Prunus armeniaca). Ann Appl Biol. 154(3): 365–375. https://doi.org/10.1111/j.1744-7348.2008.00305.x
- Chow, P. S. and Landhausser, S. M. (2004). A method for routine measurements of total sugar and starch content in woody plant tissues. Tree Physiol. 24(10): 1129–1136. https://doi.org/10.1093/treephys/24.10.1129
- Rodrigo, J., Rivas, E. and Herrero, M. (1997). Starch determination in plant tissues using a computerized image analysis system. Physiol Plant. 99(1): 105–110. https://doi.org/10.1034/j.1399-3054.1997.990115.x
- Fadon, E. and Rodrigo, J. (2019). Combining Histochemical Staining and Image Analysis to Quantify Starch in the Ovary Primordia of Sweet Cherry during Winter Dormancy. J Visualized Exp. 145: e3791/58524. https://doi.org/10.3791/58524
- Smith, A. M. and Zeeman, S. C. (2006). Quantification of starch in plant tissues. Nat Protoc. 1(3): 1342–1345. https://doi.org/10.1038/nprot.2006.232
- Hostettler, C., Kölling, K., Santelia, D., Streb, S., Kötting, O. and Zeeman, S. C. (2011). Analysis of Starch Metabolism in Chloroplasts. Methods Mol Biol. 775: 387–410. https://doi.org/10.1007/978-1-61779-237-3_21
Article Information
Publication history
Received: Nov 22, 2024
Accepted: Feb 20, 2025
Available online: Mar 12, 2025
Published: Apr 5, 2025
Copyright
© 2025 The Author(s); This is an open access article under the CC BY-NC license (https://creativecommons.org/licenses/by-nc/4.0/).
How to cite
Santolaria, N., Fadón, E., Rodrigo, J. and Hedhly, A. (2025). Enzymatic Starch Quantification in Developing Flower Primordia of Sweet Cherry. Bio-protocol 15(7): e5256. DOI: 10.21769/BioProtoc.5256.
Category
Plant Science > Plant physiology > Plant growth
Plant Science > Plant biochemistry > Carbohydrate
Do you have any questions about this protocol?
Post your question to gather feedback from the community. We will also invite the authors of this article to respond.