- Protocols

- Articles and Issues
- For Authors
- About
- Become a Reviewer

Puromycin Proximity Ligation Assay (Puro-PLA) to Assess Local Translation in Axons From Human Neurons
Published: Vol 15, Iss 5, Mar 5, 2025 DOI: 10.21769/BioProtoc.5224 Views: 3874
Reviewed by: Marion HoggYusuke TominaJosé M. Dias
Original research article
The authors used this protocol in:

Apr 2024


Protocol Collections
Comprehensive collections of detailed, peer-reviewed protocols focusing on specific topics


Related protocols
Abstract
Local mRNA translation in axons is crucial for the maintenance of neuronal function and homeostasis, particularly in processes such as axon guidance and synaptic plasticity, due to the long distance from axon terminals to the soma. Recent studies have shown that RNA granules can hitchhike on the surface of motile lysosomal vesicles, facilitating their transport within the axon. Accordingly, disruption of lysosomal vesicle trafficking in the axon, achieved by knocking out the lysosome–kinesin adaptor BLOC-one-related complex (BORC), decreases the levels of a subset of mRNAs in the axon. This depletion impairs the local translation of mitochondrial and ribosomal proteins, leading to mitochondrial dysfunction and axonal degeneration. Various techniques have been developed to visualize translation in cells, including translating RNA imaging by coat protein knock-off (TRICK), SunTag, and metabolic labeling using the fluorescent non-canonical amino acid tagging (FUNCAT) systems. Here, we describe a sensitive technique to detect newly synthesized proteins at subcellular resolution, the puromycin proximity ligation assay (Puro-PLA). Puromycin, a tRNA analog, incorporates into nascent polypeptide chains and can be detected with an anti-puromycin antibody. Coupling this method with the proximity ligation assay (PLA) allows for precise visualization of newly synthesized target proteins. In this article, we describe a step-by-step protocol for performing Puro-PLA in human induced pluripotent stem cell (iPSC)-derived neuronal cultures (i3Neurons), offering a powerful tool to study local protein synthesis in the axon. This tool can also be applied to rodent neurons in primary culture, enabling the investigation of axonal protein synthesis across species and disease models.
Key features
• Establishment of quantitative local translation assay in axons of human iPSC-derived neurons.
• Microscopy-based direct visualization of local translation events in neurons.
• Puro-PLA is a sensitive method for detecting new protein synthesis occurring within minutes in neurons, enabling precise temporal analysis of translation dynamics.
Keywords: Human i3NeuronsGraphical overview
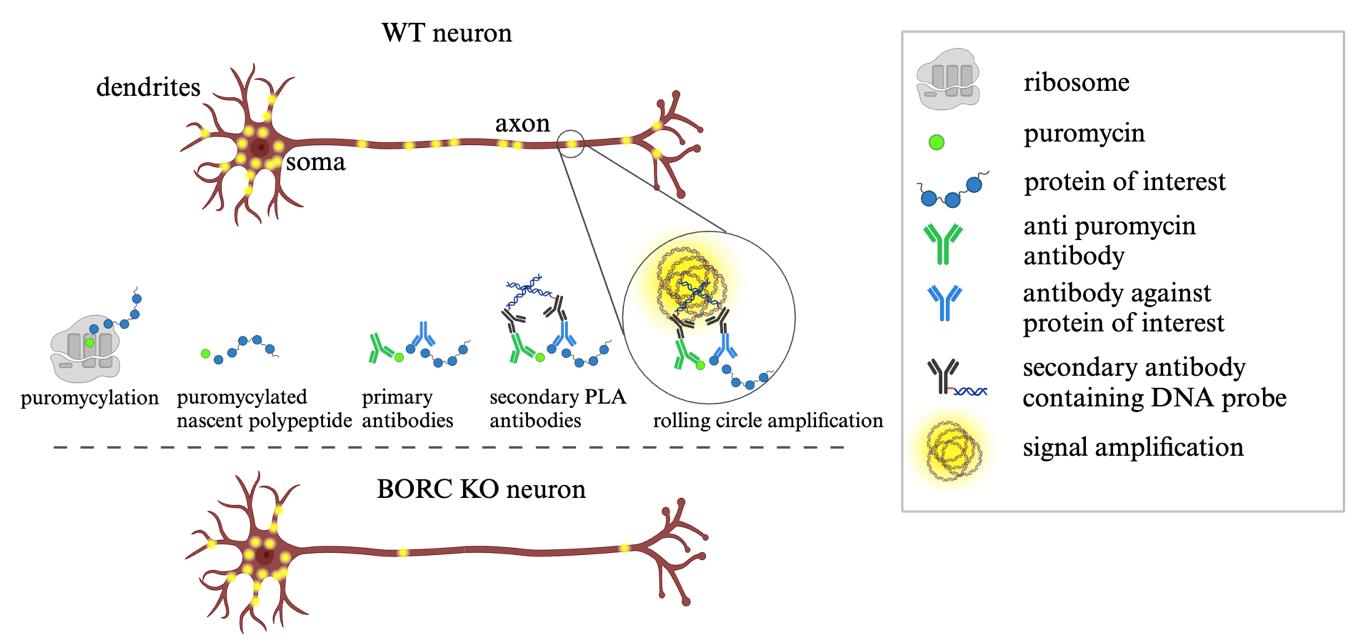
Schematic representation of puromycin proximity ligation assay (Puro-PLA) steps. Steps involved in performing Puro-PLA reaction in wildtype (WT) and BORC knock-out (KO) neurons. WT axons exhibit abundant puromycin-labeled translation sites, represented as yellow fluorescent dots along the axon, indicating active protein synthesis. In contrast, the axon of BORC KO neurons displays fewer fluorescent dots, reflecting reduced local translation due to impaired transport of RNA granules in association with lysosomal vesicles.
Background
Neurons are highly polarized cells with long neurites, particularly axons, that transmit signals over long distances. To maintain the functionality of axon terminals, the transport of axonal mRNAs and their local translation are essential. Local translation of mRNAs in axons enables a rapid, on-demand supply of proteins, offering a more efficient alternative to the slower transport of proteins from the soma. Disruptions in axonal mRNA transport and local translation have been implicated in the pathogenesis of neurodegenerative diseases like amyotrophic lateral sclerosis (ALS), frontotemporal dementia (FTD), and Alzheimer's disease (AD) [1–3]. The visualization of mRNA translation events is therefore extremely relevant and widely used to monitor local translation with both spatial and temporal resolution across different cell types. Various techniques have been developed for this purpose, including translating RNA imaging by coat protein knock-off (TRICK) [4], SunTag [5], SUnSET [6], BONCAT [7], SILAC [8], and puromycin proximity ligation assay (Puro-PLA) [9,10]. The Puro-PLA technique enables the visualization of individual molecules being translated within 10 min from the addition of puromycin. This short time minimizes the number of events, resulting in reduced background noise and facilitating the quantification of single particles. Once added, the puromycin gets incorporated into the nascent peptides, causing them to be displaced from the ribosome. This causes the premature termination of nascent proteins and labels them with puromycin residues [11]. The puromycin and the protein of interest can then be recognized by specific primary antibodies. A pair of secondary antibodies containing DNA probes then binds to the primary antibodies and amplifies the signal (Graphical overview). The Puro-PLA technique is highly sensitive, allowing for the detection of low-abundance proteins. Additionally, it offers high specificity by relying on proximity ligation of protein-specific antibodies and puromycin, further reducing background interference. This method can be performed in fixed cells, allowing researchers to study protein translation in its native cellular context, particularly focusing on specific subcellular locations, such as axons. However, the success of Puro-PLA is contingent upon the availability of high-quality antibodies that specifically recognize the target proteins. Additionally, while the technique demonstrates high specificity, there remains a risk of nonspecific interactions, which could lead to false positives if the assay is not properly optimized. The use of negative controls is an effective strategy to minimize this risk. Puro-PLA has been used to study activity-dependent local translation in dendrites and local synthesis of presynaptic proteins like Bassoon in axons [10]. We used this technique to demonstrate that impaired transport of mRNAs into the axon leads to reduced protein translation and axonal dystrophy [12]. Here, we describe a step-by-step protocol for the detection of RPS7 protein translation in the axons of wildtype (WT) and BORCS5 knock-out (KO) human induced pluripotent stem cell (iPSC)-derived neurons. This protocol can be adapted for the detection of other targets in different types of neurons.
Materials and reagents
Biological materials
1. Human induced pluripotent stem cells (iPSCs) expressing doxycycline-inducible neurogenin 2 (NGN2) [13]
Reagents
1. Essential 8TM Flex Medium kit (E8Flex) (Thermo Fisher Scientific, catalog number: A2858501)
2. Y-27632 dihydrochloride (ROCK inhibitor) (Selleckchem, catalog number: S1049)
3. Accutase (Stem Cell Technologies, catalog number: 07920)
4. Corning Matrigel hESC-qualified matrix, LDEV-free, 5 mL (Matrigel) (Corning, catalog number: 354277)
5. Penicillin/Streptomycin (Quality Biological, catalog number: 120-095-721)
6. DMEM/F12 (Thermo Fisher Scientific, Gibco, catalog number: 11330032)
7. KnockOut DMEM/F12 medium (Thermo Fisher Scientific, Gibco, catalog number: 12660012)
8. MEM non-essential amino acids solution (100×) (MEM-NEAA) (Thermo Fisher Scientific, Gibco, catalog number: 11140050)
9. Non-essential amino acids (NEAA) (Thermo Fisher Scientific, Gibco, catalog number: 11140050)
10. GlutaMAX (Thermo Fisher Scientific, Gibco, catalog number: 35050061)
11. N2A supplement (Thermo Fisher Scientific, Gibco, catalog number: 17502048)
12. Doxycycline (Millipore Sigma, catalog number: D9891)
13. BrainPhys medium (Stem Cell Technology, catalog number: 5790)
14. Human/Mouse/Rat BDNF recombinant protein (BDNF) (PeproTech, Thermo Fisher Scientific, catalog number: 450-02)
15. Human NT-3 recombinant protein (NT-3) (PeproTech, Thermo Fisher Scientific, catalog number: 450-03)
16. B-27TM supplement, serum-free (Thermo Fisher Scientific, Gibco, catalog number: 17504044)
17. Laminin mouse protein, natural (Thermo Fisher Scientific, Gibco, catalog number: 23017015)
18. Poly-L-lysine hydrobromide (Millipore Sigma, catalog number: P2636)
19. Laminin (Roche, Millipore Sigma, catalog number: 11243217001)
20. Paraformaldehyde (PFA) 32% aqueous solution EM grade (Electron Microscopy Sciences, catalog number: 15714-S)
21. Saponin from Quillaja sp. (Millipore Sigma, catalog number: S4521)
22. Bovine serum albumin (BSA), fraction V, fatty acid-free for tissue culture (Gold Biotechnology, catalog number: A-421-250)
23. DAPI Fluoromount-G (Electron Microscopy Sciences, catalog number: 17984-24)
24. Duolink® In Situ Detection Reagents Red kit (Sigma-Aldrich, catalog number: DUO92008)
25. Duolink® blocking solution (Sigma-Aldrich, catalog number: DUO82007)
26. Duolink® in situ PLA probe anti-rabbit PLUS (Sigma-Aldrich, catalog number: DUO92002)
27. Duolink® in situ PLA probe anti-mouse MINUS (Sigma-Aldrich, catalog number: DUO92004)
28. DNA ligase (Sigma-Aldrich, catalog number: DUO82027)
29. Ligation buffer (Sigma-Aldrich, catalog number: DUO82009)
30. DNA polymerase (Sigma-Aldrich, catalog number: DUO82028)
31. Amplification buffer (Sigma-Aldrich, catalog number: DUO82011)
32. Chicken anti-MAP2 antibody (Abcam, catalog number: ab5392)
33. Mouse anti-puromycin antibody, clone 12D10 (Millipore Sigma, catalog number: MABE343)
34. Rabbit anti-RPS7 antibody (MyBioSource, catalog number: MBS9405134)
35. Alexa Fluor 647-conjugated goat anti-chicken IgY (Thermo Fisher Scientific, catalog number: A-21449)
36. Puromycin dihydrochloride (puromycin) (Millipore Sigma, catalog number: P9620-10ML)
37. Water for injection (WFI H2O) for cell culture (Fisher Scientific, Gibco, catalog number: A1287301)
38. Corning 10× phosphate-buffered saline (PBS) (Corning, catalog number: 46-013-CM)
39. Sodium tetraborate decahydrate (Millipore Sigma, catalog number: S9640)
40. Boric acid (Millipore Sigma, catalog number: B6768)
41. HEPES (1 M) (Thermo Fisher Scientific, Gibco, catalog number: 15630080)
42. HBSS (10×) (Thermo Fisher Scientific, Gibco, catalog number: 14185052)
Solutions
1. 1× PBS (see Recipes)
2. Fixative (4% PFA) (see Recipes)
3. Borate buffer pH 8.5 (see Recipes)
4. Poly-L-lysine hydrobromide coating solution) (see Recipes)
5. HANKS solution (see Recipes)
6. Laminin coating solution (see Recipes)
7. BSA solution (see Recipes)
8. BDNF 1,000× (see Recipes)
9. NT-3 1,000× (see Recipes)
10. Doxycycline 1,000× solution (see Recipes)
11. Immunofluorescence blocking buffer (see Recipes)
12. Complete BrainPhys (see Recipes)
13. Induction medium (see Recipes)
14. Complete induction medium (see Recipes)
15. E8 Flex medium (see Recipes)
16. Complete E8 Flex medium (see Recipes)
Recipes
1. 1× PBS
| Reagent | Final concentration | Amount |
|---|---|---|
| 10× PBS | 1× | 100 mL |
| WFI H2O | n/a | 900 mL |
| Total | n/a | 1,000 mL |
2. Fixative (4% PFA)
| Reagent | Final concentration | Amount |
|---|---|---|
| Paraformaldehyde 32% | 4% | 6.25 mL |
| 1× PBS | n/a | 43.75 mL |
| Total | n/a | 50 mL |
3. Borate buffer pH 8.5
| Reagent | Final concentration | Amount |
|---|---|---|
| Sodium tetraborate decahydrate | 100 mM | 38.14 g |
| Boric acid | 100 mM | 6.18 g |
| WFI H2O | n/a | To 1,000 mL |
| HCl | n/a | To pH of 8.5 |
| Total | n/a | 1,000 mL |
Note: Add the sodium tetraborate decahydrate to 800 mL of water and dissolve using a magnetic stirrer at high speed on a heated plate at 37 °C. Once dissolved, add the boric acid and continue stirring until dissolved. Bring the pH to 8.5 with HCl. Use a graduated cylinder to bring the volume to 1,000 mL and filter-sterilize the solution with a 0.22 µm filter size. Do not autoclave, as precipitates may form.
4. Poly-L-lysine hydrobromide coating solution
| Reagent | Final concentration | Amount |
|---|---|---|
| Poly-L-lysine hydrobromide | 0.25 mg/mL | 100 mg |
| Borate buffer | n/a | To 400 mL |
| Total | n/a | 400 mL |
Note: Dissolve the Poly-L-lysine hydrobromide in sterile borate buffer under sterile conditions. Do not filter this solution, as filtering may reduce the Poly-L-lysine hydrobromide concentration.
5. HANKS solution
| Reagent | Final concentration | Amount |
|---|---|---|
| HEPES (1 M) | 10 mM | 5 mL |
| HBSS (10×) | 1× | 50 mL |
| WFI H2O | n/a | 445 mL |
| Total | n/a | 500 mL |
Note: Once mixed, filter-sterilize the solution with a 0.22 µm filter size. Do not autoclave as precipitates may form.
6. Laminin coating solution
| Reagent | Final concentration | Amount |
|---|---|---|
| Laminin | 10 µg/mL | 1 mg |
| HANKS solution | n/a | To 100 mL |
| Total | n/a | 100 mL |
Note: Dissolve the laminin in sterile HANKS solution under sterile conditions. Do not filter this solution, as filtering may reduce the laminin concentration.
7. BSA solution
| Reagent | Final concentration | Amount |
|---|---|---|
| BSA | 0.1% | 50 mg |
| 1× PBS | n/a | To 50 mL |
| Total | n/a | 50 mL |
Note: Once mixed, filter-sterilize the solution with a 0.22 µm filter.
8. BDNF 1,000×
| Reagent | Final concentration | Amount |
|---|---|---|
| BDNF | 10 µg/mL | 10 µg |
| BSA solution | n/a | To 1 mL |
| Total | n/a | 1 mL |
9. NT-3 1,000×
| Reagent | Final concentration | Amount |
|---|---|---|
| NT-3 | 10 µg/mL | 10 µg |
| BSA solution | n/a | To 1 mL |
| Total | n/a | 1 mL |
10. Doxycycline 1,000× solution
| Reagent | Final concentration | Amount |
|---|---|---|
| Doxycycline | 2 mg/mL | 20 mg |
| 1× PBS | n/a | To 10 mL |
| Total | n/a | 10 mL |
11. Immunofluorescence blocking buffer
| Reagent | Final concentration | Amount |
|---|---|---|
| Saponin | 0.1% | 0.1 g |
| BSA reagent | 1% | 1 g |
| 1× PBS | n/a | To 100 mL |
| Total | n/a | 100 mL |
12. Complete BrainPhys
Supplement 50 mL of BrainPhys medium with 50 µL of BDNF 1,000×, 50 µL of NT-3 1,000×, 50 µL of laminin mouse protein, 1 mL of B-27, 500 µL of Penicillin/Streptomycin, and 50 µL of doxycycline 1,000× solution. Store the medium bottle at 4 °C.
13. Induction medium
Supplement 500 mL of DMEM/F12 (1:1) with 5 mL of MEM-NEAA, 5 mL of N2A supplement, 5 mL of GlutaMAX, and 5 mL of Penicillin/Streptomycin. Store the medium bottle at 4 °C.
14. Complete induction medium
Supplement 50 mL of induction medium with 50 µL of ROCK inhibitor and 50 µL of doxycycline. Store the medium at 4 °C for up to one week.
15. E8 Flex medium
Supplement 500 mL of E8Flex with 5 mL of Penicillin/Streptomycin and 5 mL of E8Flex supplement (50×). Store the medium bottle at 4 °C.
16. Complete E8 Flex medium
Supplement 50 mL of E8 Flex medium with 50 µL of ROCK inhibitor. Store the medium at 4 °C for up to one week.
Laboratory supplies
1. 12-mm circular cover glass (Electron Microscopy Sciences, catalog number: 72230-01)
2. Glass slides (Daigger, catalog number: EF15975B)
3. BD Falcon 15 mL centrifuge tube
4. Falcon 50 mL centrifuge tube (Corning, catalog number: 352098)
5. Falcon 15 mL centrifuge tube (Corning, catalog number: 352097)
6. Falcon 24-well clear flat bottom cell culture plate (Corning, catalog number: 253047)
7. Falcon 100 mm TC-treated cell culture dish (Corning, catalog number: 353003)
8. Bemis Parafilm M PM996 (Fisher Scientific, catalog number: 13-374-10)
Equipment
1. LSM 880 inverted confocal microscope with Plan-Apochromat 63× objective (NA = 1.4) (Carl Zeiss)
2. CO2 incubator (Thermo Scientific, model: 3310)
3. Water bath (Thermo Scientific, Labline water bath, model: 2345)
4. Centrifuge (Eppendorf, model: 5702)
Software and datasets
1. Fiji (https://fiji.sc/). The software is free to use.
2. BioRender (https://www.biorender.com/). The following figures were created using BioRender: Graphical overview: BioRender.com/k71x377; Figures 1–3: BioRender.com/x11i230
Procedure
A. Human iPSC culture
1. Coating plates with Matrigel
a. To prepare Matrigel coating medium, use 800 µL of cold KnockOut DMEM/F12 medium (straight from the 4 °C refrigerator, do not prewarm) to dissolve the 500 µL frozen Matrigel aliquot on ice. Add the dissolved Matrigel to 50 mL of cold KnockOut DMEM/F12 medium. Perform this step quickly and without prewarming any solution.
Critical: Matrigel polymerizes quickly if it is exposed to room temperature. Once dissolved in KnockOut DMEM/F12 medium, keep it stored at 4 °C for up to ten days.
b. Add 8 mL of Matrigel coating medium to a 10 cm tissue culture plate and allow it to coat for at least 1 h and up to overnight at 37 °C. Coated plates can be stored at 37 °C inside the incubator for three to five days.
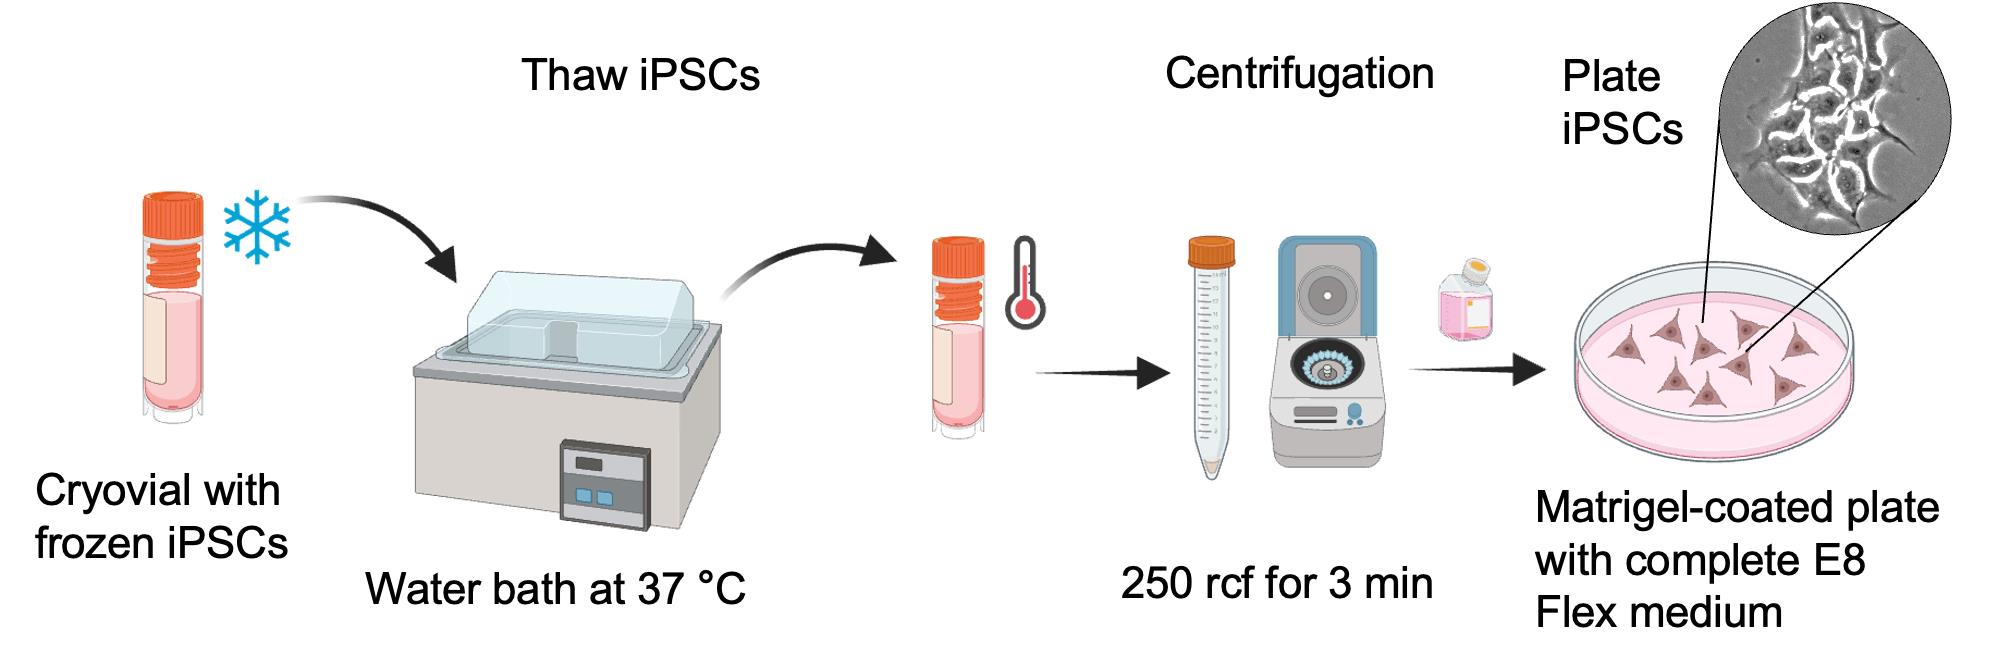
Figure 1. Schematic representation of thawing and plating of frozen induced pluripotent stem cells (iPSCs)
2. Thawing iPSCs
a. Prepare E8Flex medium and complete E8Flex medium (see Recipes).
b. Warm up the complete E8Flex medium using a water bath or a dry bead bath kept at 37 °C.
c. Remove the Matrigel coating medium from the 10 cm tissue culture plate. Add 10 mL of warm complete E8Flex medium to the plate. The plate is now ready to be used for the seeding of iPSCs.
d. Thaw a frozen vial of iPSCs using a water bath at 37 °C for a few minutes (Figure 1).
e. Add 1 mL of complete E8Flex medium to the cells and transfer them into a 15 mL conical tube.
f. Centrifuge the cells at 250 rcf for 3 min.
g. Remove the supernatant containing the freezing medium and resuspend the cells with 1 mL of complete E8Flex medium.
h. Count the cells using an automated cell counter (alternatively, use a hemocytometer).
i. Calculate the cell density and add 1 million cells in a 10 cm plate containing complete E8Flex medium.
j. Incubate at 37 °C in a 5% CO2 and 95% air incubator.
k. After 24 h, the cells will start dividing and forming small islands. At this point, the complete E8Flex medium can be replaced with E8Flex medium. Replace the medium with new warm E8Flex medium every other day until the cells reach 80% confluency.
B. Human iPSC-to-i3Neuron induction
1. Preparing plates and induction medium
a. Prepare a Matrigel-coated plate as described in step A1.
b. Prepare induction medium and complete induction medium (see Recipes).
c. Warm up the complete induction medium using a water bath or a dry bead bath kept at 37 °C.
d. Replace the Matrigel-coating medium with 10 mL of warm complete induction medium. The plate is now ready to be used for the induction of iPSCs.
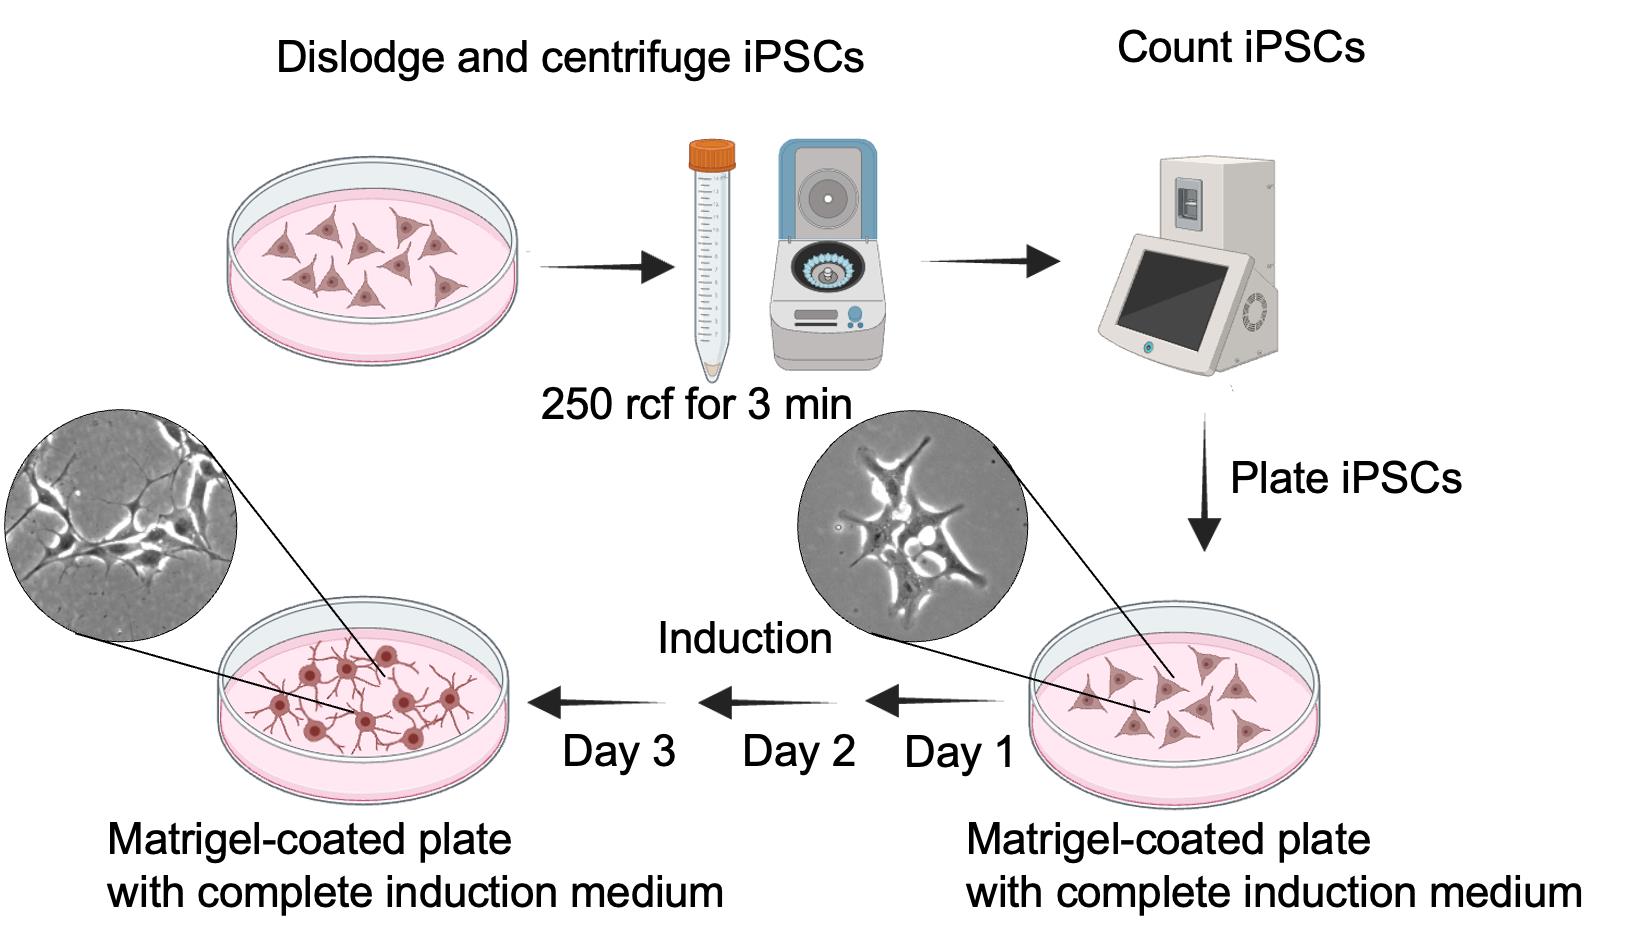
Figure 2. Schematic representation of induced pluripotent stem cell (iPSC) induction and differentiation into i3Neurons
2. Plating iPSCs for induction into i3Neuron
a. Take the 80% confluent iPSC plate and remove the medium (Figure 2).
b. Wash the cells by adding 5 mL of sterile 1× PBS.
c. Remove the 1× PBS and add 1 mL of Accutase.
d. Keep the plate in the incubator for 3 min.
e. Add 1 mL of complete induction medium and lift the cells by gentle pipetting.
f. Transfer the cells to a 15 mL conical tube.
g. Centrifuge the cells at 250 rcf for 3 min.
h. Remove the supernatant containing the Accutase and resuspend the cell pellet using 1 mL of complete induction medium.
i. Count the cells using an automated cell counter (alternatively, use a hemocytometer).
j. Calculate the cell concentration and plate 800,000 cells in the Matrigel-coated 10 cm culture plate containing the complete induction medium.
k. Incubate at 37 °C in a 5% CO2 and 95% air incubator.
l. Replace the medium with warm fresh complete induction medium on days 2 and 3. The total induction time, including cell seeding, is three days. On the fourth day, the cells can be lifted for the next step.
C. i3Neuron culture
1. Preparing plates containing coated cover glass and complete BrainPhys
a. Using sterile forceps, place a sterile round cover glass in each well of a 24-well plate.
b. Add 1 mL of Poly-L-lysine hydrobromide coating solution in each well and incubate overnight at 37 °C.
Note: After a few hours, gently press the cover glass down to the bottom of the well using a sterile 1 mL pipette tip. This step ensures that the cover glass is fully submerged in the coating solution and firmly placed at the bottom of the plate.
c. Wash each cover glass three times with sterile water.
d. Add laminin coating solution to each well and incubate for 45 min at 37 °C.
e. Wash each cover glass three times with sterile water.
f. Add 1 mL of complete BrainPhys medium to each well. The plate is now ready for neuron plating.
g. Warm up the complete BrainPhys medium in a 37 °C water bath or bead bath before use.
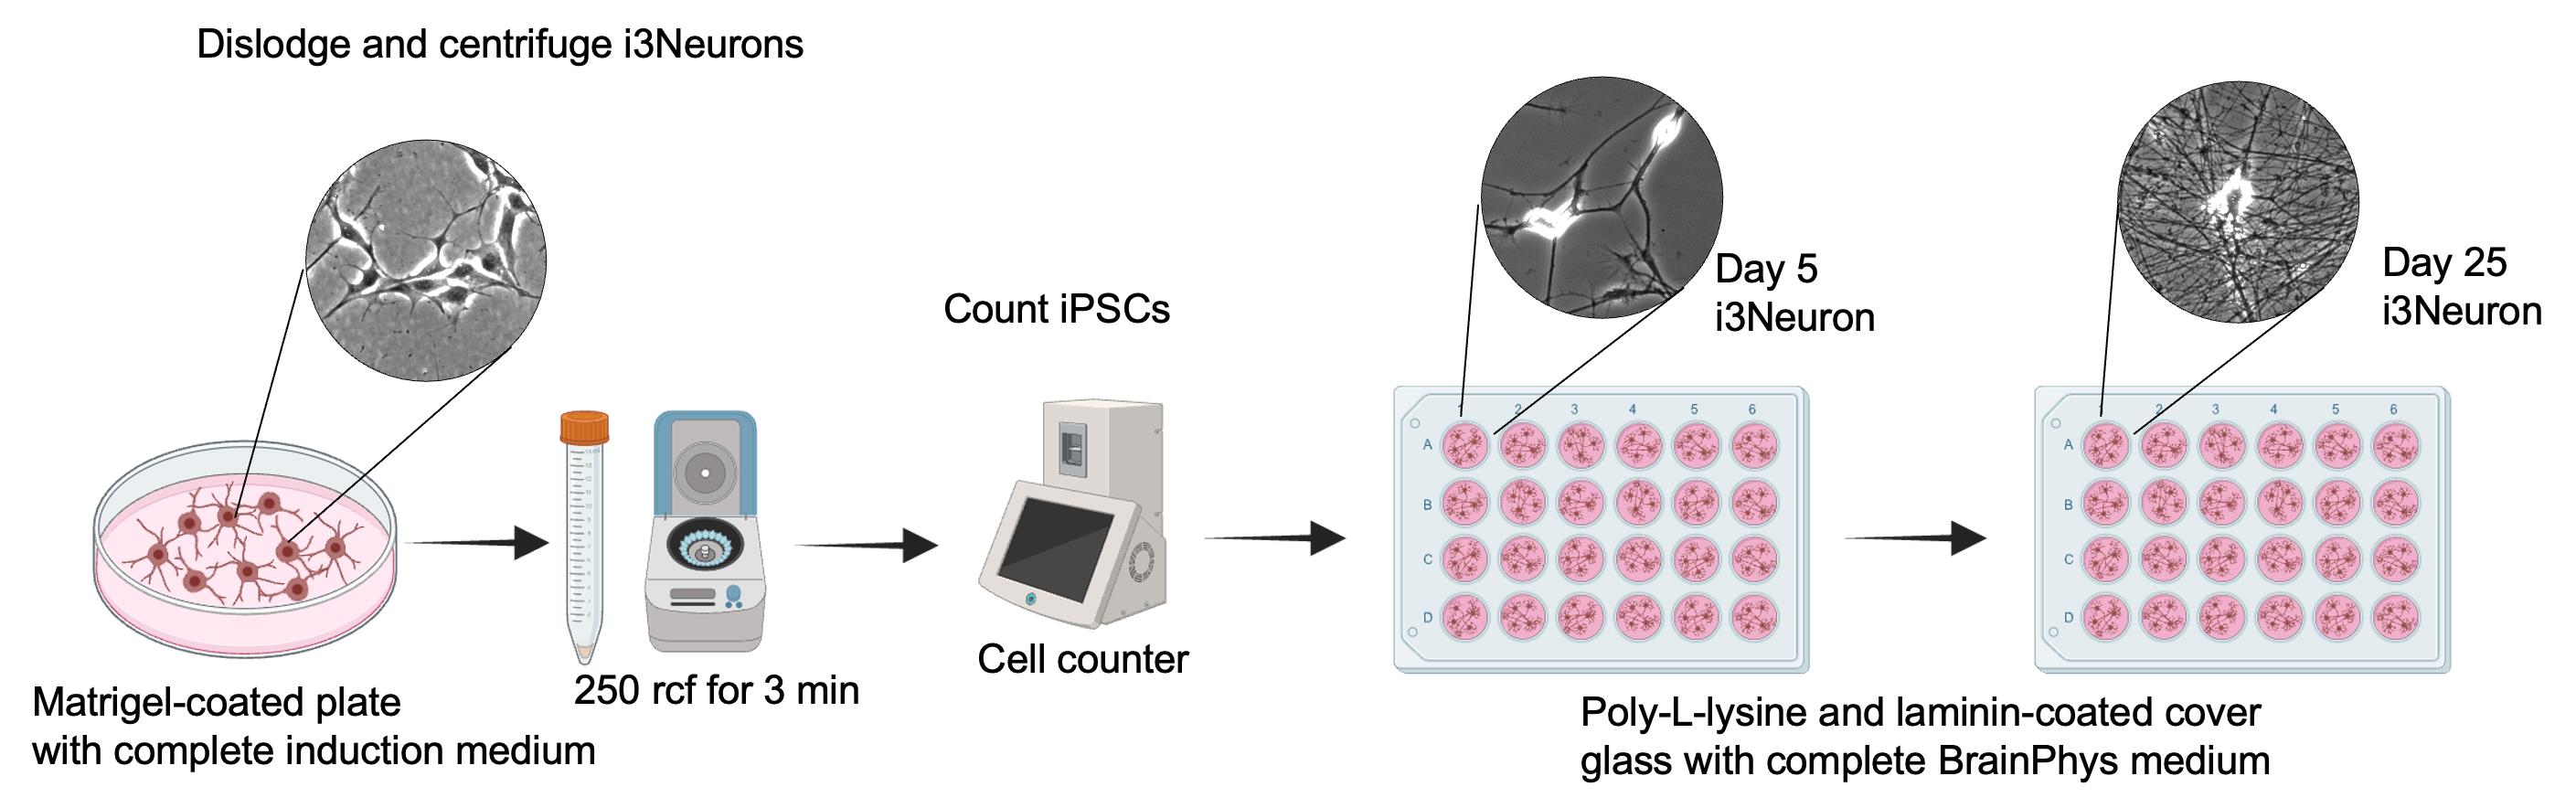
Figure 3. Schematic representation of plating and maintenance of i3Neurons
2. Plating i3Neurons
a. Remove the complete induction medium from the induced iPSCs (Figure 3).
b. Wash the cells by adding 5 mL of sterile 1× PBS.
c. Remove the 1× PBS and add 1 mL of Accutase.
d. Place the plate in the incubator for 3 min.
e. Add 1 mL of complete BrainPhys medium and gently pipette to lift the cells.
f. Transfer the cells to a 15 mL conical tube.
g. Centrifuge the cells at 250 rcf for 3 min.
h. Carefully remove the supernatant containing Accutase and resuspend the cell pellet in 1 mL of complete BrainPhys medium.
i. Count the cells and then plate 20,000 cells per well in the 24-well plate containing the coated coverslips and complete BrainPhys medium.
j. Incubate at 37 °C in a 5% CO2 and 95% air incubator.
k. Replace half of the medium every three days with fresh, prewarmed complete BrainPhys medium. Gently apply the medium along the wall of the well.
Note: As axons extend and form a delicate, intricate network, they become susceptible to damage from fast medium exchanges. Use gentle pipetting for medium replacement to avoid lifting neurons from the cover glass. Do not use vacuum aspiration.
l. Continue performing half-medium changes with complete BrainPhys medium until the day of the experiment.
D. Puromycin proximity ligation assay (Puro-PLA)
1. Puromycin labeling of i3Neuron
a. Use a 25-day-old culture of i3Neuron grown on coverslips.
b. Prepare 2 µM puromycin-containing neuronal medium as follows: add 20 µL of puromycin from 1 mM stock to 10 mL of complete BrainPhys medium.
Note: This volume is sufficient for eight cover glasses. Adjust the medium volume as needed. Prepare the puromycin-containing neuronal medium fresh as extended storage of puromycin may reduce activity.
c. Warm up the puromycin-containing neuronal medium to 37 °C.
d. Remove the existing medium from the wells and add 1 mL of complete BrainPhys medium containing 2 µM puromycin to each well.
e. Incubate the neurons for 10 min in a 5% CO2 incubator at 37 °C.
f. Immediately wash the neurons once with ice-cold 1× PBS.
g. Add 1 mL of fixative (4% PFA) kept at room temperature and incubate for 20 min at room temperature (22–25 °C).
h. Wash the neurons three times with 1× PBS, then proceed with Puro-PLA labeling.
Note: As a negative control, keep one set of WT i3Neurons without puromycin treatment. Another possible negative control is to treat the cells with anisomycin, an inhibitor of protein synthesis.
2. Transfer of cover glasses onto Parafilm
a. Cut a piece of Parafilm to fit the lid of a 24-well plate.
b. Mark the lid according to the experimental setup.
c. Tightly attach the Parafilm to the surface of the lid (Figure 4).
d. Carefully remove each cover glass, one at a time, from the 24-well plate and place it onto the Parafilm-covered lid with the neuron side facing up. Add 50 µL of 1× PBS on each cover glass to prevent the sample from drying out.
Note: Placing the cover glass on top of Parafilm minimizes the risk of neuron detachment during washing and handling. It is particularly important to use a small buffer volume (100 µL) for washing, as detachment is more likely to occur in a well with a larger volume of solution. The hydrophobic nature of Parafilm also helps to keep the solution confined to the cover glass.
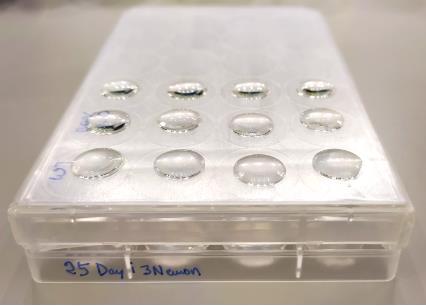
Figure 4. Photograph of cover glasses placed on a parafilm-wrapped 24-well plate lid
3. Blocking and primary antibody incubation
a. Use the Duolink® In Situ Detection Reagents Red kit to detect the PLA signal.
Note: The following protocol is adapted from the manufacturer’s instructions.
b. Vortex the Duolink® blocking solution to ensure it is well mixed.
c. Gently remove the 1× PBS from the coverslip by pipetting. The neurons are facing up.
d. Apply 50 µL of Duolink® blocking solution to each coverslip.
e. Incubate the neurons for 30 min in a humidified chamber at 37 °C.
Note: To create a humidified incubation chamber, place wet tissue paper inside a flat plastic container with a lid and keep it in a 37 °C incubator. This setup prevents evaporation due to heat. Use this humidified chamber for all subsequent incubation steps.
f. Prepare the primary antibodies by diluting them in Duolink® antibody diluent.
Note: Dilute primary antibodies according to the manufacturer’s recommendation for immunofluorescence. Use a 1:500 dilution of mouse anti-puromycin antibody and 1:100 dilution of rabbit anti-RPS7 antibody.
g. Gently remove the Duolink® blocking solution from the coverslip by pipetting.
h. Add 50 µL of the diluted primary antibody mixture onto each coverslip and incubate for 30 min at 37 °C in the humidified chamber.
4. PLA probe incubation
a. Prepare the PLA probe mix by vortexing the probes, then dilute them 1:5 in Duolink® antibody diluent as follows: for each coverslip, prepare a total reaction volume of 40 µL by combining 8 µL of PLA probe anti-mouse MINUS, 8 µL of PLA probe anti-rabbit PLUS, and 24 µL of Duolink® antibody diluent.
Note: 40 µL is the minimum volume required to cover one coverslip. Scale up the reaction volume according to the experimental setup. Here, we have used anti-rabbit and anti-mouse PLA probes. Alternatively, there are two other Duolink PLA probes available: anti-human (DUO92020 and DUO92021) and anti-goat (DUO92003, DUO92006) that can be used depending on the experimental setup.
b. Carefully remove the primary antibodies by gently aspirating from the edge of the cover glass.
c. Wash the coverslips twice by gently adding 100 µL of wash buffer A dropwise from the top, allowing each wash to incubate for 5 min at room temperature.
Note: Avoid drying the cover glass to minimize background signal.
d. Add 40 µL of the diluted PLA probe solution to each coverslip and incubate for 1 h at 37 °C in a humidified chamber.
5. Ligation of PLA probes
a. Prepare the 1× ligation buffer by diluting the 5× Duolink® Ligation buffer in molecular-grade water. For each coverslip, prepare a 40 µL reaction volume by mixing 8 µL of 5× Duolink® ligation buffer with 32 µL of molecular-grade water.
Note: 40 µL is the minimum volume required to cover one coverslip. Scale up the reaction volume based on the experimental setup. Ensure the ligation buffer is fully thawed and mixed well before use.
b. Carefully remove the PLA probe solution by gently aspirating from the edge of the coverslip.
c. Wash the coverslips twice by gently adding 100 µL of wash buffer A dropwise from the top, allowing each wash to incubate for 5 min at room temperature.
d. During the wash steps, place the ligase enzyme tube on a freezer block at -20 °C to keep it chilled.
e. Prepare the ligation mix immediately before application by adding ligase to the prepared 1× ligation buffer. For a 40 µL reaction volume, add 1 µL of ligase enzyme to 39 µL of 1× ligation buffer and then mix gently.
Note: It is crucial to add the ligase immediately before adding the ligation mix to the coverslip to ensure optimal enzyme activity.
f. Carefully remove the wash buffer A from the sample by aspirating from the edge of the coverslip.
g. Add 40 µL of the prepared ligation mixture to each coverslip.
h. Incubate for 30 min at 37 °C in a humidified chamber.
6. Amplification of PLA probes
a. Prepare the amplification buffer by diluting 5× Duolink® amplification buffer in molecular-grade water as follows: for each coverslip, prepare 40 µL reaction volume by mixing 8 µL of 5× Duolink® amplification buffer with 32 µL of molecular-grade water.
Note: 40 µL is the minimum volume required to cover each coverslip. Scale up the reaction volume according to the experimental setup. Ensure the amplification buffer is fully thawed and mixed before use and protect it from light, as it is light-sensitive.
b. Carefully remove the ligation mixture by aspirating from the edge of the coverslip.
c. Wash the coverslips twice by gently adding 100 µL of wash buffer A dropwise from the top, allowing each wash to incubate for 5 min at room temperature.
d. During the wash steps, place the polymerase enzyme tube on a freezer block at -20 °C.
e. Prepare the amplification solution by adding the polymerase enzyme to the previously prepared 1× amplification buffer as follows: for a 40 µL reaction volume, add 0.5 µL of polymerase enzyme to 39.5 µL of 1× amplification buffer and then mix gently.
Note: Add the polymerase immediately before applying the amplification solution to the coverslip to ensure enzyme activity.
f. Carefully remove the wash buffer A from the sample by aspirating from the edge of the coverslip.
g. Add 40 µL of the prepared amplification solution to each coverslip.
h. Incubate for 100 min at 37 °C in a humidified chamber.
i. After incubation, gently remove the amplification solution by aspirating from the edge of the coverslip.
j. Wash the coverslips twice by gently adding 100 µL of wash buffer B dropwise from the top, allowing each wash to incubate for 5 min at room temperature.
k. Perform a final wash with 0.01× wash buffer B for 1 min at room temperature.
E. Immunofluorescence staining after PLA
1. Immunofluorescence staining
a. Gently remove the wash buffer B from the sample by aspirating from the edge of the coverslip.
b. Re-fix the sample by adding 50 µL of fixative for 10 min at room temperature (22–25 °C).
c. Gently remove the fixative from the sample by aspirating from the edge of the coverslip.
d. Wash the coverslip three times with 100 µL of 1× PBS.
e. Add 50 µL of immunofluorescence blocking buffer and incubate for 10 min.
f. During this time, prepare a 1:500 dilution of chicken anti-MAP2 primary antibody in immunofluorescence blocking buffer.
g. After the 10 min incubation time, gently remove the immunofluorescence blocking buffer and add 50 µL of primary antibody/blocking buffer mixture per coverslip.
Note: Any primary antibody may be used as preferred, following the recommended dilution. However, to avoid cross-reactivity with the antibodies used in step D3f, a different species is required. In this protocol, we used antibodies raised in mouse and rabbit for the Puro-PLA; therefore, we selected a chicken antibody for the immunofluorescence.
h. Incubate for 30 min at 37 °C in a humidified chamber.
Note: Alternatively, primary antibody incubation can be performed overnight if required for specific antibodies.
i. Carefully aspirate the primary antibody/blocking buffer mixture and wash the coverslip three times with 100 µL of immunofluorescence blocking buffer.
j. Prepare a 1:500 dilution of anti-chicken Alexa Fluor 647 conjugated secondary antibody in immunofluorescence blocking buffer and add 50 µL per coverslip.
Note: Any secondary antibody may be used as preferred, following the recommended dilution, except those within the red fluorescent spectrum, which was used to detect the PLA signal.
k. Incubate for 30 min at 37 °C in a humidified chamber.
l. Wash the coverslip three times with 100 µL of immunofluorescence blocking buffer.
m. Perform a final wash with 100 µL of 1× PBS.
n. Prepare a clean slide with 7 µL of DAPI Fluoromount-G mounting media.
o. Carefully lift the coverslip using fine forceps and gently remove excess liquid by lightly touching the edge of the coverslip to an absorbent tissue.
p. Quickly place the coverslip onto the drop of mounting medium on the slide, neuron side down.
q. Place the slide with the mounted sample in a dark, flat box to protect from the light.
r. Allow the sample to dry and the mounting medium to solidify for 4 h to overnight at room temperature.
Note: For long-term storage, store mounted slides at 4 °C.
s. Image the mounted sample using a confocal microscope.
F. Image acquisition, analysis, and quantification using ImageJ/Fiji
1. Image capture: Use a confocal microscope (e.g., Zeiss LSM 880) equipped with a Plan-Apochromat 63× objective lens (NA = 1.4) to image the samples. Capture multiple optical sections and build Z-stacks to obtain images across the entire thickness of the cell. Collect approximately seven sections, spaced ~0.25 µm apart.
Note: Any confocal microscope with a 40× or 63× objective can be used for imaging. The image will include three color channels: DAPI (excitation at 405 nm), PLA signal fluorophore, and MAP2 (stained with Alexa Fluor 647, excitation at 647 nm).
2. Image Processing in Fiji: Open the captured image in Fiji (ImageJ) and collapse all the sections by selecting Image > Stacks > Z Project. In the dialog panel that appears, select “Max Intensity” for projection type, then click OK. This step will generate a new image with a single Z-stack containing the three color channels: DAPI, PLA, and MAP2. In Figure 5, only the MAP2 channel is displayed, showing more intense staining of the soma and dendrites. Axons appear faint in the background. Note that the “z” dimension is no longer visible, as the layers have been collapsed into a single plane.
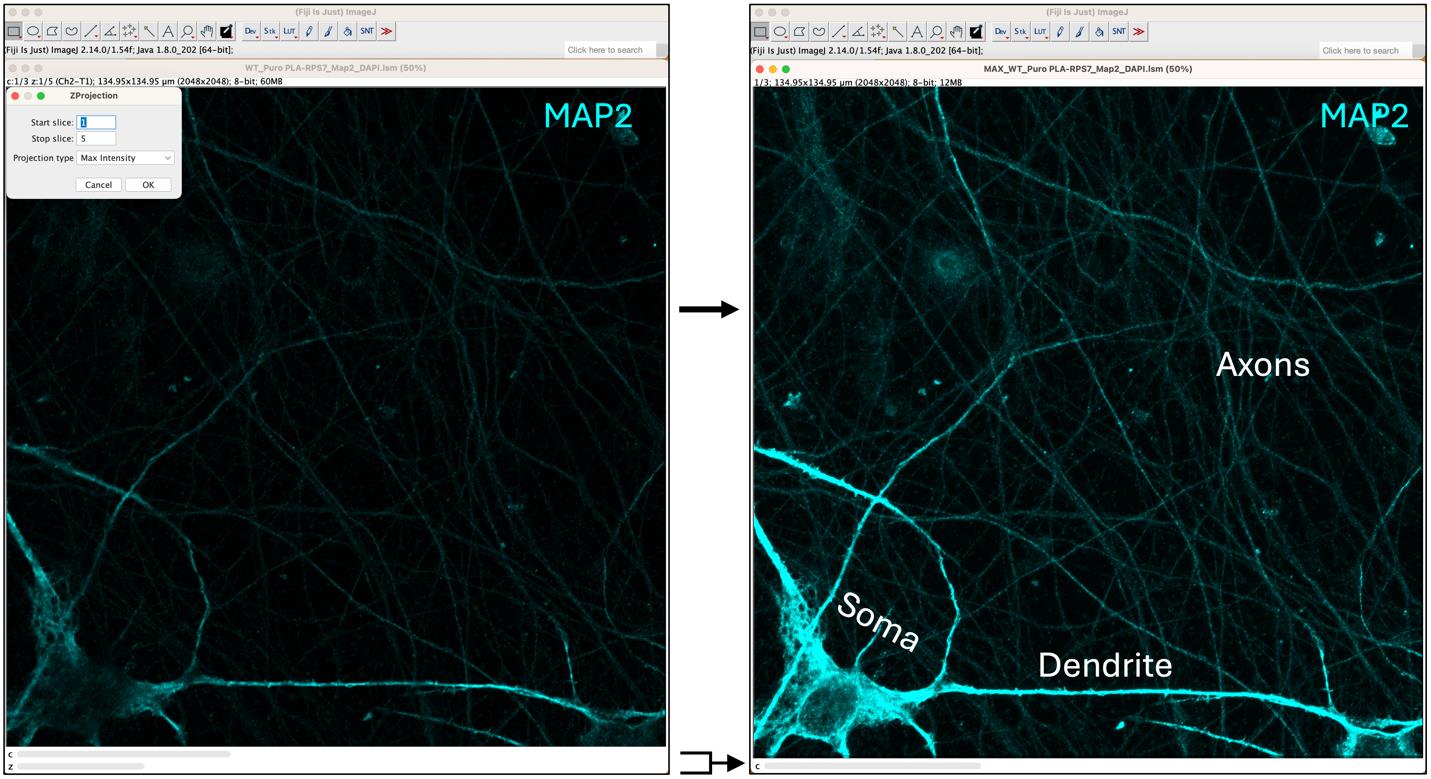
Figure 5. Maximum intensity projection of captured images. The left panel displays the captured image, showing only the MAP2 channel. In the top-left corner, the ZProjection panel is used to generate the maximum intensity projection, which is shown on the right. The soma, dendrite, and axons are indicated.
To separate the three color channels, go to Image > Color > Split Channels. This will create three individual images, one for each channel. Select and close the DAPI channel (Figure 6) to focus on the PLA and MAP2 signals.
Note: The MAP2 antibody primarily stains the soma and dendrites. Axons will appear in the image as a fainter signal.
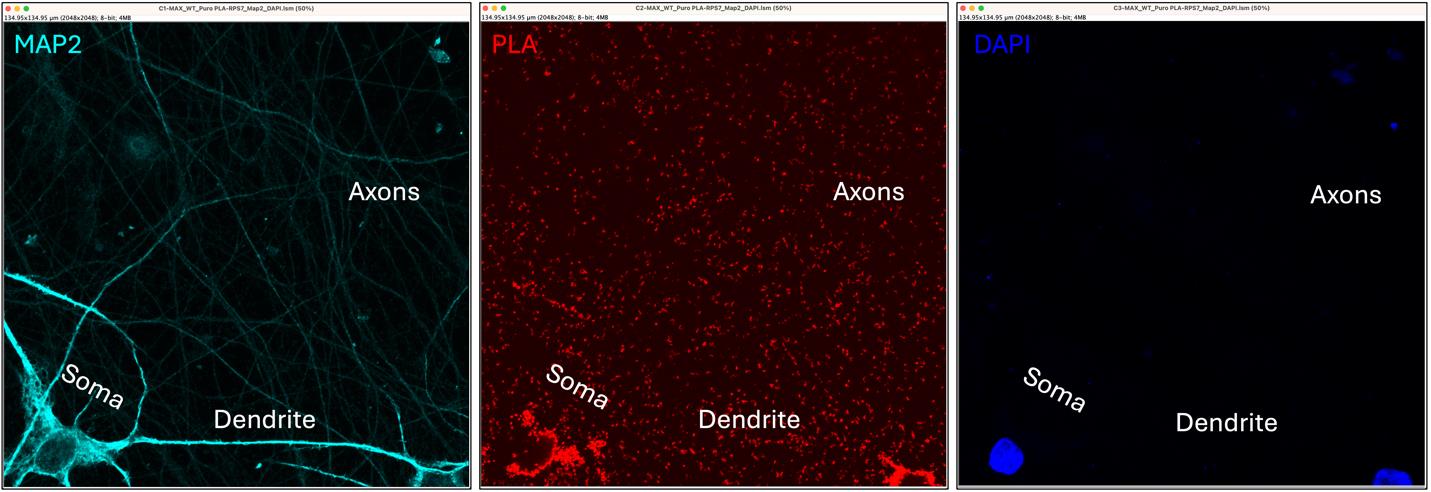
Figure 6. Single channels for the selected image. The three panels separately display the MAP2 staining (dendrite and soma in cyan), the proximity ligation assay (PLA) signal (red), and DAPI (nuclei in blue). The soma, dendrite, and axons are also indicated.
3. Use the Rectangle tool from the toolbar and draw a 50 × 50 nm square in the MAP2 channel picture. Right-click within the square and select Duplicate. This will create a new image containing only the selected area (Figure 7).
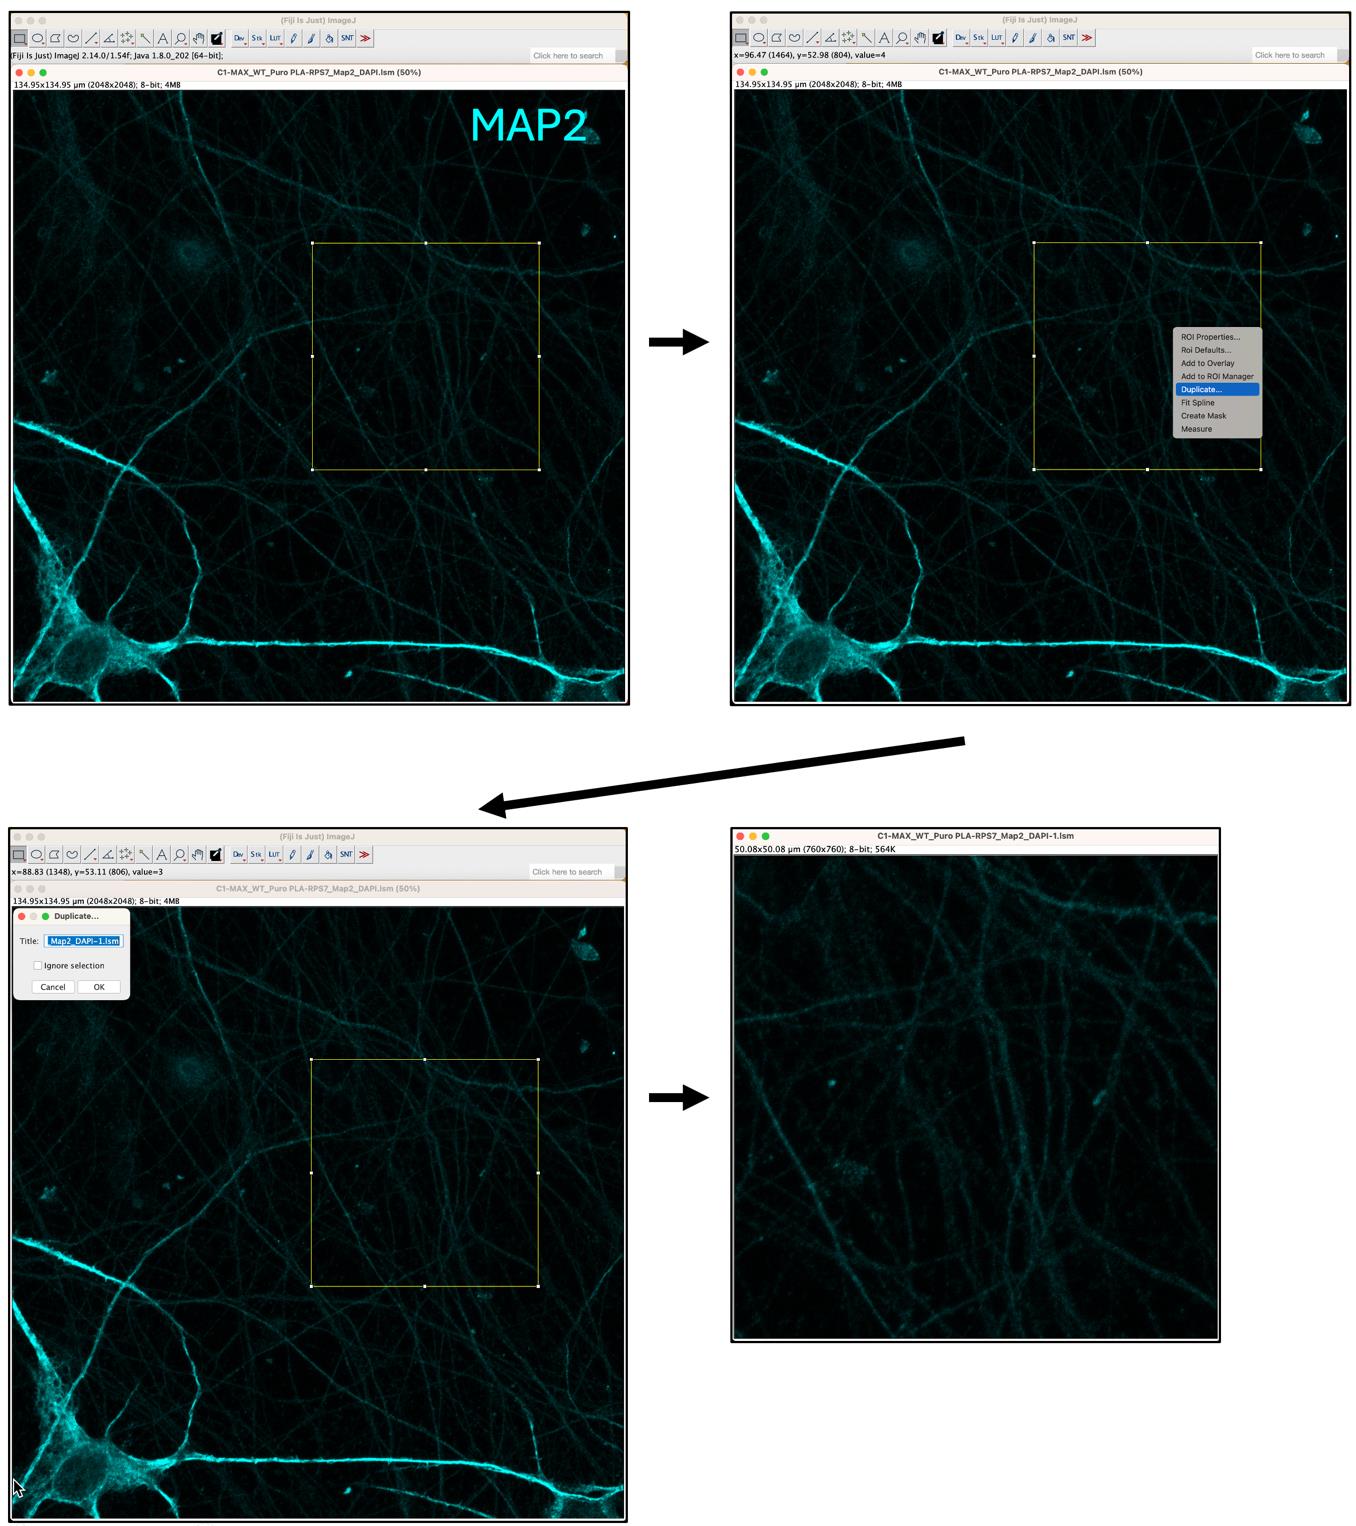
Figure 7. Selection and duplication of area of interest. The top-left panel shows neurons stained with MAP2 (cyan). The Rectangle tool is used to select the area of interest (top-right panel), followed by the duplication of the selected area (lower two panels).
4. First, select the duplicated MAP2 image. Adjust brightness and contrast by selecting Image > Adjust > Brightness/Contrast. Then click Auto to apply automatic adjustments. To smooth the image, go to Process > Smooth. This will help enhance the visibility of finer details in the image (Figure 8).
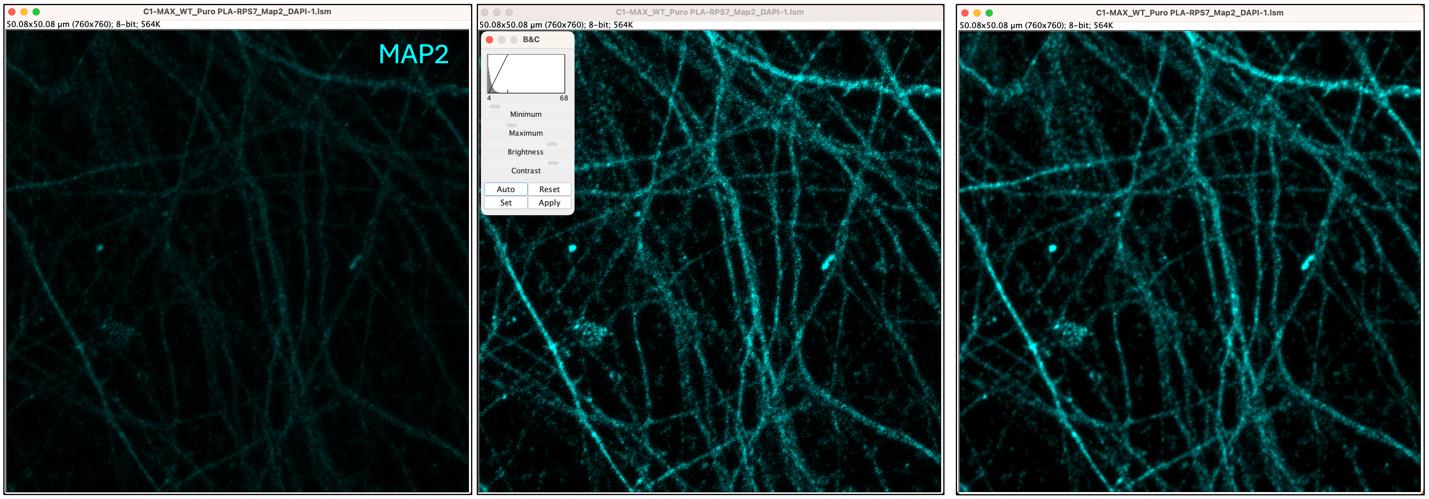
Figure 8. Intensity and Smooth processing of axonal area of interest. The axonal area of interest (left panel) is processed to adjust the brightness and contrast (central panel) and to apply smoothing (right panel).
5. Create an axonal mask using threshold adjustment: With the duplicated MAP2 image selected, go to Image > Adjust > Threshold. In the threshold panel, check Dark Background and then click Auto to automatically set threshold values. This step generates a mask of the axonal area, highlighting regions based on the MAP2 signal present in the axons (Figure 9).
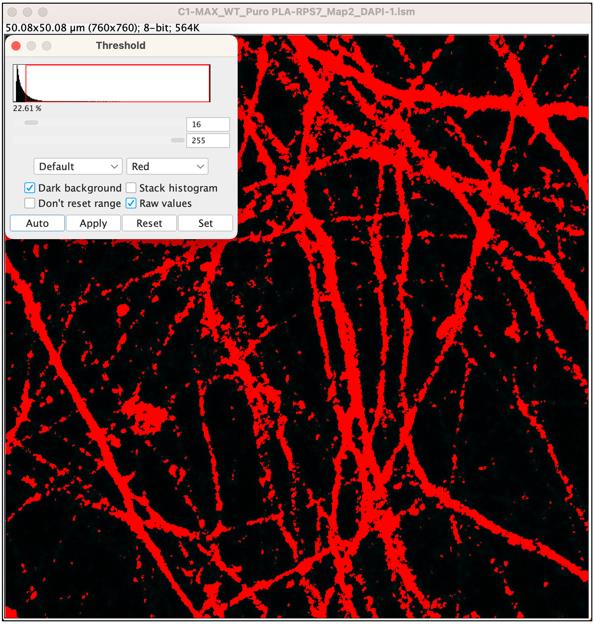
Figure 9. Threshold of axonal area. An axonal mask is created by automatically adjusting the Threshold.
6. Select Analyze > Set Measurements > Area; Limit to threshold; Display label (Figure 10). (Note: This configuration only needs to be performed once to establish the measurements that will be used in the analysis.) After setting the threshold, select Analyze > Measure. A new panel will appear displaying the results (Figure 10). The “Area” value represents the area covered by the MAP2 signal. Please save this value on your Excel table.
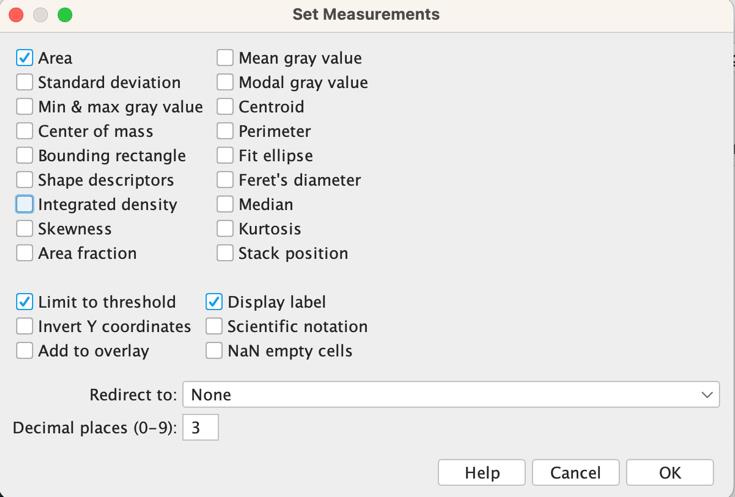
Figure 10. Settings for measurement and results table. The desired values to be displayed are selected from the Set Measurements panel as shown in the figure. The generated measurements are displayed in the lower panel.
7. Now select the PLA picture and navigate to Edit > Selection > Restore Selection to select the identical square at the same coordinates used for the MAP2 channel. Next, proceed to Duplicate this second channel (right-click) (Figure 11).
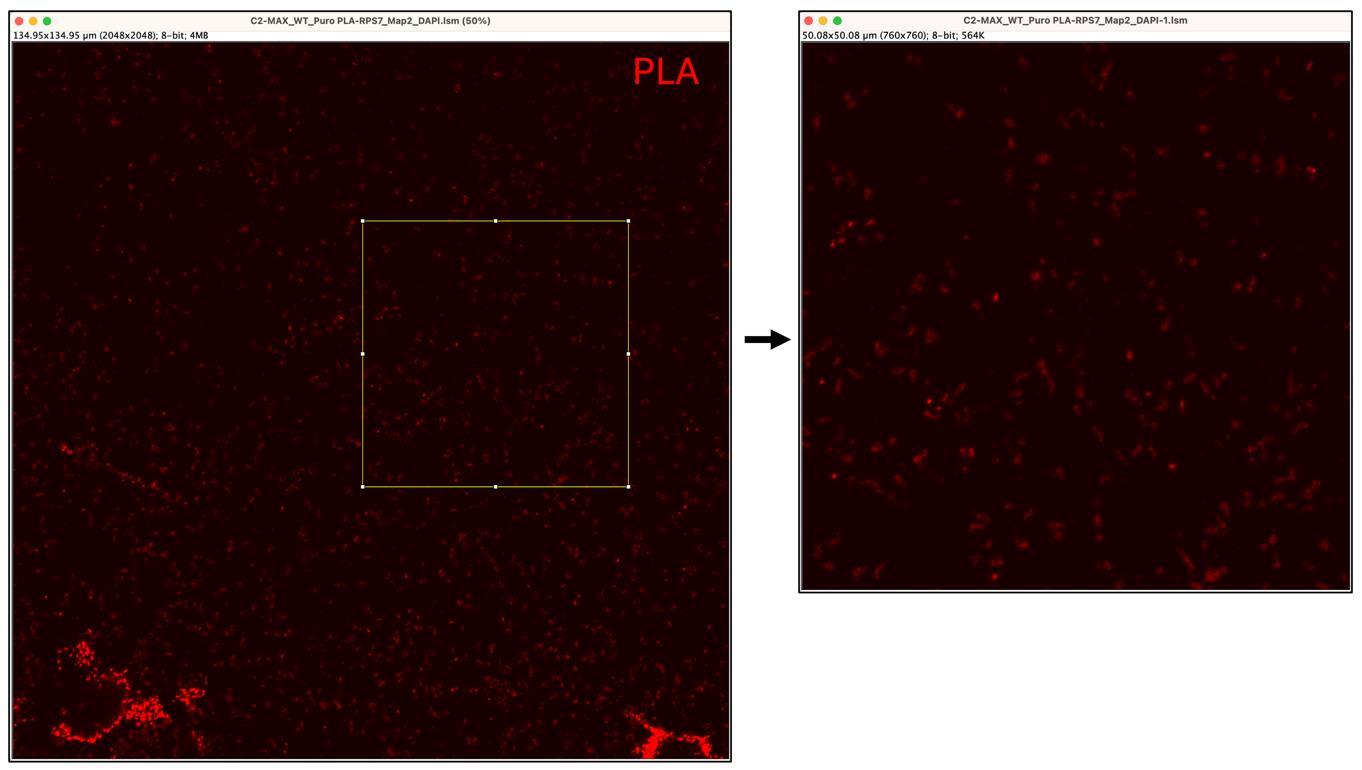
Figure 11. Selection and duplication of area of interest. The left panel shows the proximity ligation assay (PLA) signal (red). The Rectangle tool is used to select the area of interest, followed by the duplication of the selected area (right panel).
8. Select Process > Smooth > Image > Adjust > Threshold. A panel will appear. Select Dark Background and click Auto. Then, select Analyze > Analyze Particles. You may need to adjust the Size setting for your PLA signal. In this example, we will measure only particles larger than 20 µm2, as smaller particles may be background noise (Figure 12). A new panel will appear displaying the results. The Count value indicates the number of PLA reactions detected. Please save this value on your Excel table.
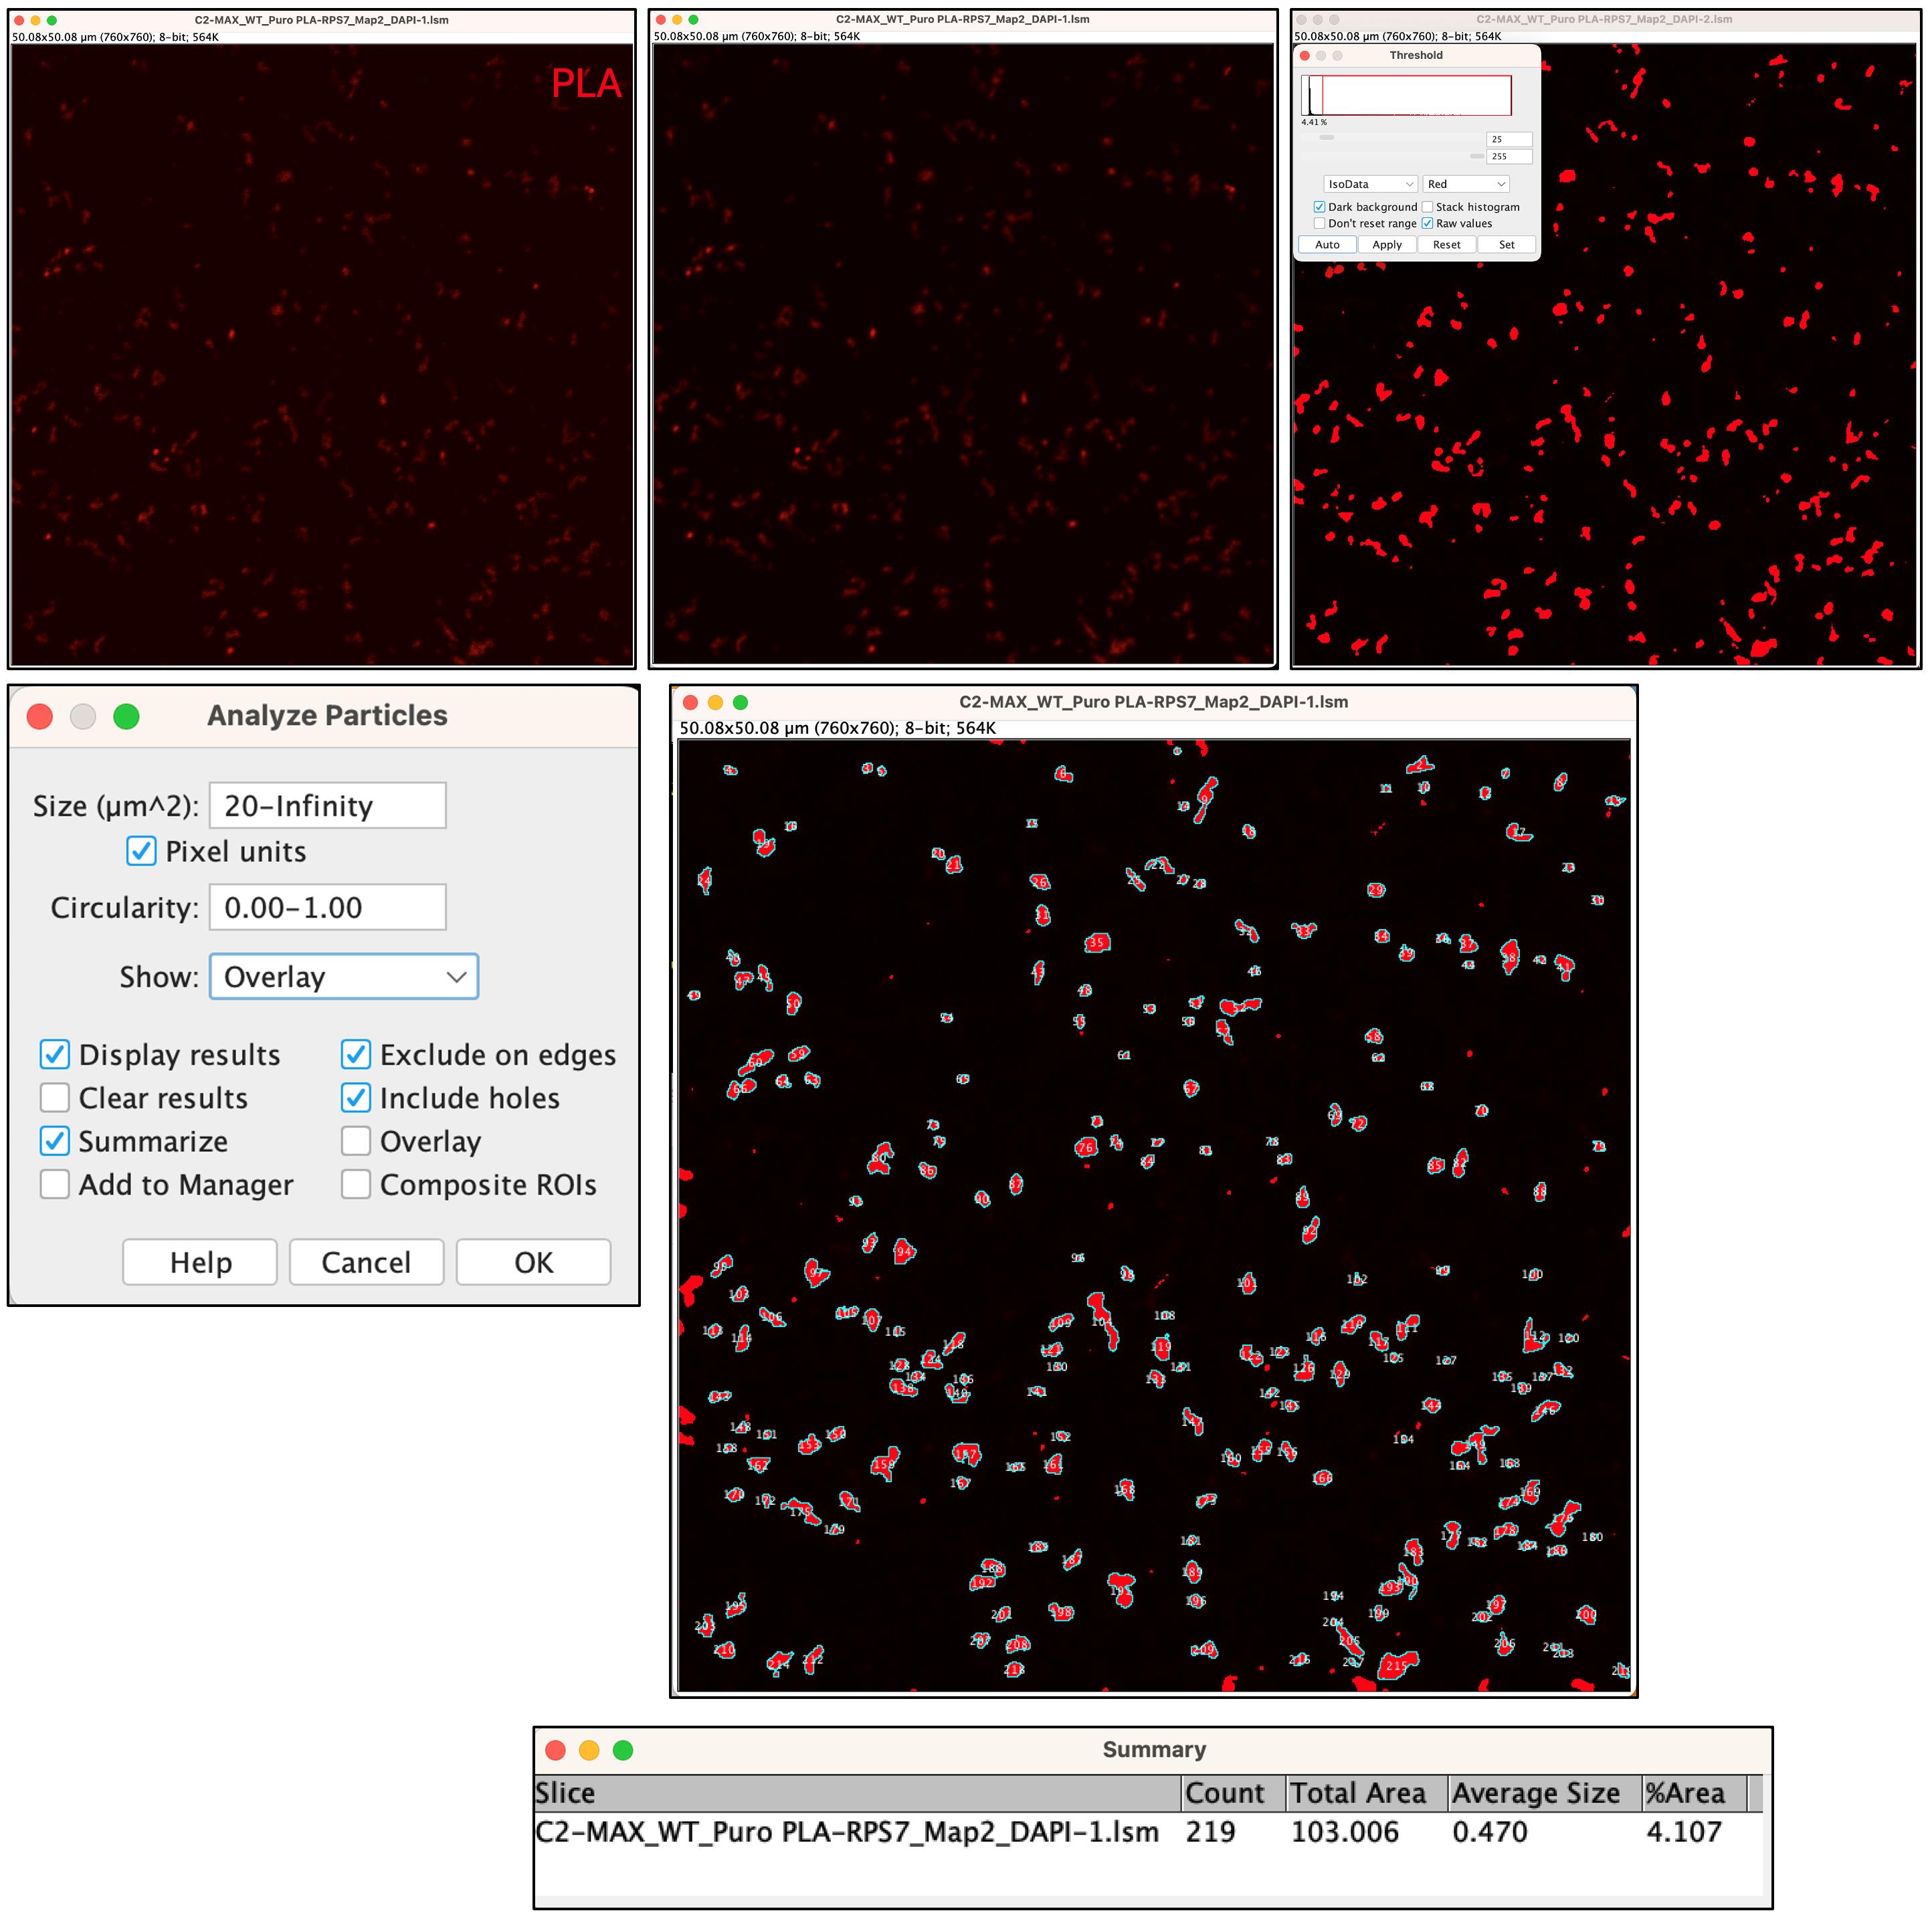
Figure 12. Threshold of proximity ligation assay (PLA) panel and particles count. The area of interest (top left panel) showing the PLA signal (red) is processed to apply smoothing (top central panel), and a mask is created by automatically adjusting the Threshold (top right panel). The PLA puncta are then counted using Analyze Particles. The selected particles are shown in the larger central panel. The results appear as a Summary displayed in the lower panel.
9. Compared to the axonal field of WT neurons, axons from BORCS5 KO neurons present a reduced number of PLA particles with a PLA/Area reduction of more than 50% (Figure 13).
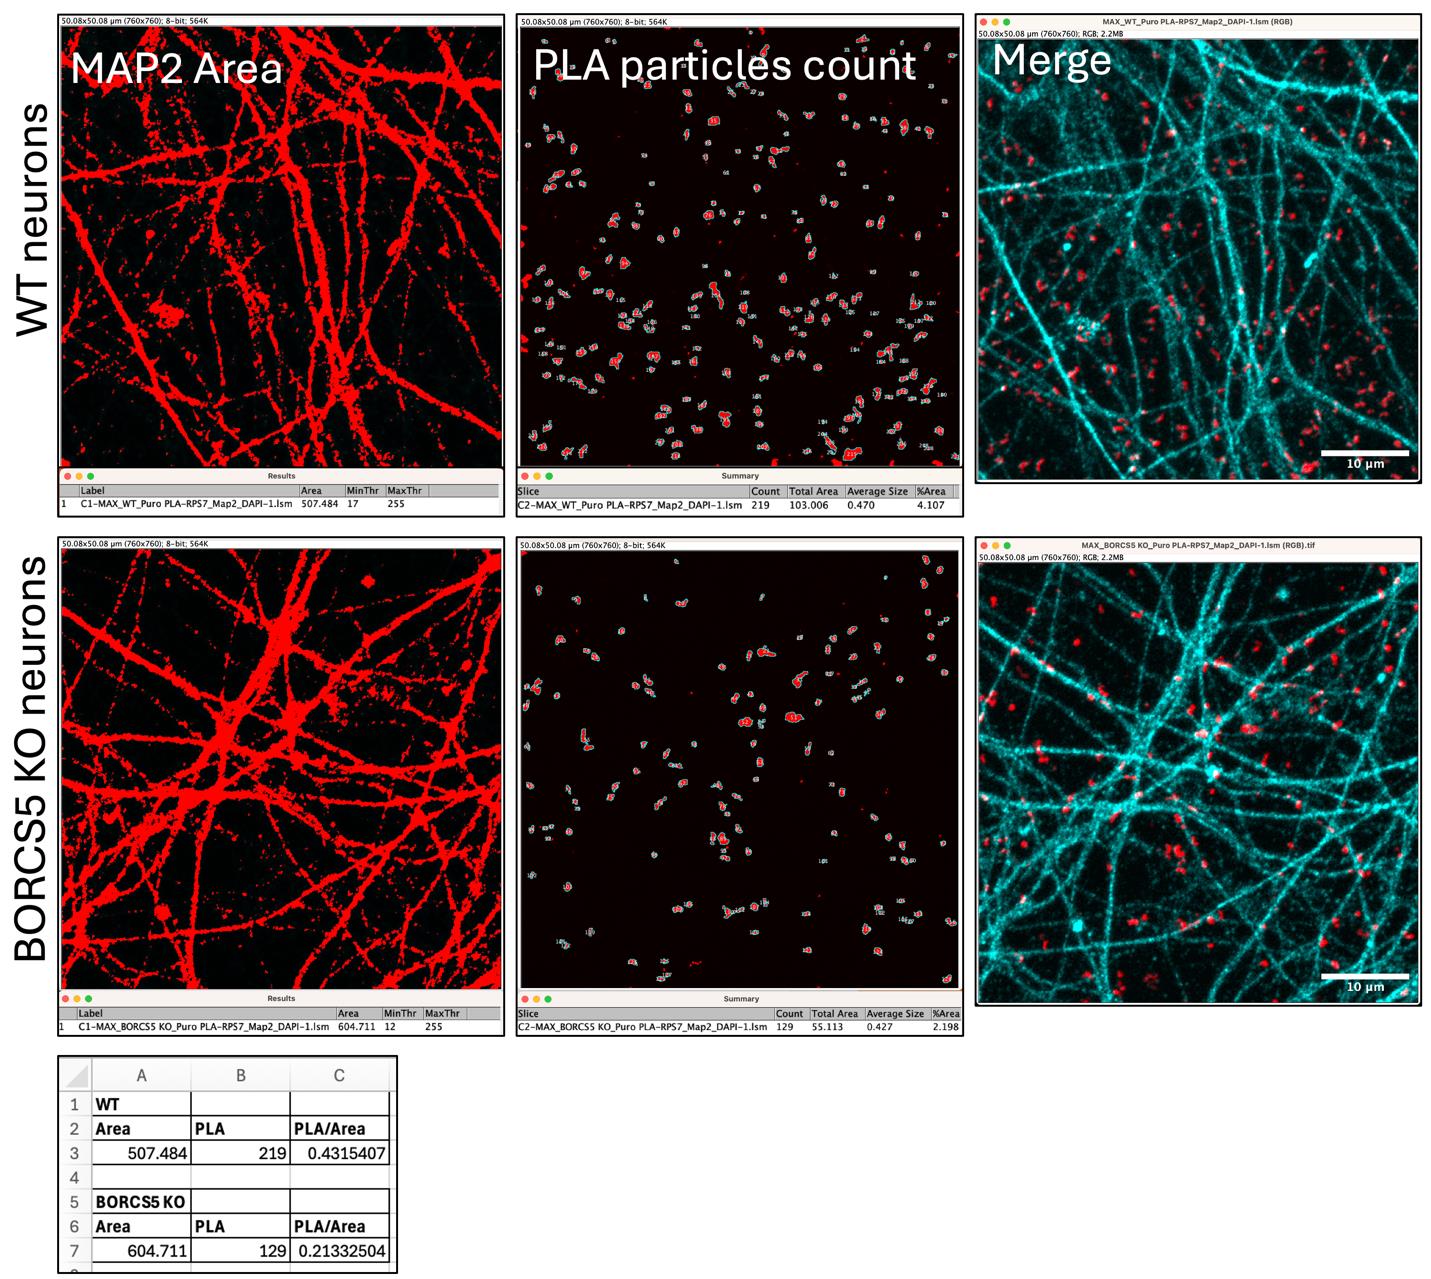
Figure 13. Wildtype (WT) vs. BORCS5 knock-out (KO) neurons. The MAP2-stained area (left panels), proximity ligation assay (PLA)-counted particles (central panels), and the merged image (right panels) are shown for representative WT neurons (top panels) and BORCS5 KO neurons (bottom panels). Both the MAP2 area and the number of PLA particles are recorded in the Excel file (lowest panel).
Data analysis
Repeat the experiment three times. Collect at least seven images for each experiment. Once you have gathered your area and PLA values, calculate the ratio of PLA to area using the formula PLA/Area. After obtaining all your PLA/area values, normalize them by dividing each value by the average PLA/area of all your WT or other control samples. To assess statistical significance when comparing multiple samples, perform a one-way ANOVA followed by Tukey’s multiple comparisons test. For comparisons between two samples, use an unpaired two-tailed Student’s t-test.
Regarding the analysis of negative control data: If the negative control shows a high number of PLA dots, it indicates nonspecific antibody binding, and the experiment should be discarded. However, if the negative control exhibits very few dots, calculate the percentage of PLA signal in the negative control, as this represents the minimal background for the experiment. Subtract this background signal count from the experimental counts to obtain the true signal count in the experimental data.
Note: An alternate approach to PLA dot measurement would be to create a mask of the axonal area based on a low MAP2 threshold, as mentioned before, and apply the same mask for counting only the PLA dots that are located inside the axonal mask.
Validation of protocol
This protocol has been used and published in the following research article:
• De Pace et al. [12]. Messenger RNA transport on lysosomal vesicles maintains axonal mitochondrial homeostasis and prevents axonal degeneration. Nat Neurosci (Figure 5).
General notes and troubleshooting
General notes
1. A limitation of this protocol lies in the availability of specific antibodies for the protein of interest. A few other verified antibodies for this protocol are: rabbit anti-TOMM20 antibody (Proteintech, catalog number: 11802-1-AP), rabbit anti-COX IV (3E11) antibody (Cell Signaling, catalog number: 4850), rabbit anti-RPL24 (Proteintech, catalog number: 17082-1-AP), rabbit anti-RPS27A (MyBioSource, catalog number: MBS7103451).
2. The temperature of the wash buffer can affect the background signal. Make sure the wash buffer is at room temperature.
3. The ligation and amplification temperatures are critical for the success of the protocol. Make sure all steps are performed at the appropriate temperature.
4. To set up a Puro-PLA assay, it is ideal to include two negative controls. The first negative control involves keeping one set of WT i3Neurons without puromycin treatment, which will help determine the minimal background signal (if any) arising from nonspecific mouse anti-puromycin antibody binding to the anti-mouse PLA probe. The second negative control consists of treating the cells with 40 µM anisomycin, a protein synthesis inhibitor, for 30 min before adding puromycin to the medium.
Troubleshooting
| Issue | Suggested solution |
| Background signal is too high | • Decrease the concentration of the primary antibodies. • Increase the time of incubation with blocking solution. • Increase the number of washes by one. • Make sure the wash buffer is at room temperature. |
| Absent or low signal | • Ensure that optimal antibody binding conditions are met. For instance, some antibodies are compatible only with methanol fixation. • Ensure that no excess wash solution remains on the sample, as residual buffer can dilute the antibodies further and potentially decrease ligase and polymerase activity. • If the proteins are low abundance, the signal may be weak. In such cases, the “amplification of PLA probes” step can be extended to overnight. • This technique detects newly synthesized proteins that have undergone a certain length of peptide synthesis within 10 min from puromycin addition. Since protein synthesis proceeds from the N-terminus to the C-terminus, antibodies recognizing the N-terminal region generate better signals compared to those targeting the C-terminal. Therefore, selecting primary antibodies that recognize the N-terminus is recommended for optimal signal detection. Alternatively, puromycin labeling of i3Neurons could be extended for longer than 10 min; however, this will need optimization, since longer incubation time may lead to a higher background signal. |
Acknowledgments
The work was funded by the Intramural Program of the NICHD (ZIA HD001607).
The protocol was used in the article De Pace et al. [12] (DOI:10.1038/s41593-024-01619-1).
Competing interests
The authors declare no competing interests.
References
- Gamarra, M., de la Cruz, A., Blanco-Urrejola, M. and Baleriola, J. (2021). Local Translation in Nervous System Pathologies. Front Integr Neurosci. 15: 689208.
- Lu, J. X., Wang, Y., Zhang, Y. J., Shen, M. F., Li, H. Y., Yu, Z. Q. and Chen, G. (2021). Axonal mRNA localization and local translation in neurodegenerative disease. Neural Regen Res. 16(10): 1950–1957.
- Nagano, S. and Araki, T. (2021). Axonal Transport and Local Translation of mRNA in Neurodegenerative Diseases. Front Mol Neurosci. 14: 697973.
- Halstead, J. M., Lionnet, T., Wilbertz, J. H., Wippich, F., Ephrussi, A., Singer, R. H. and Chao, J. A. (2015). Translation. An RNA biosensor for imaging the first round of translation from single cells to living animals. Science. 347(6228): 1367–1671.
- Tanenbaum, M. E., Gilbert, L. A., Qi, L. S., Weissman, J. S. and Vale, R. D. (2014). A protein-tagging system for signal amplification in gene expression and fluorescence imaging. Cell. 159(3): 635–646.
- Schmidt, E. K., Clavarino, G., Ceppi, M. and Pierre, P. (2009). SUnSET, a nonradioactive method to monitor protein synthesis. Nat Methods. 6(4): 275–277.
- Dieterich, D. C., Link, A. J., Graumann, J., Tirrell, D. A. and Schuman, E. M. (2006). Selective identification of newly synthesized proteins in mammalian cells using bioorthogonal noncanonical amino acid tagging (BONCAT). Proc Natl Acad Sci USA. 103(25): 9482–9487.
- Ong, S. E., Blagoev, B., Kratchmarova, I., Kristensen, D. B., Steen, H., Pandey, A. and Mann, M. (2002). Stable isotope labeling by amino acids in cell culture, SILAC, as a simple and accurate approach to expression proteomics. Mol Cell Proteomics. 1(5): 376–386.
- Chin, A. and Lecuyer, E. (2021). Puromycin Labeling Coupled with Proximity Ligation Assays to Define Sites of mRNA Translation in Drosophila Embryos and Human Cells. Methods Mol Biol. 2381: 267–284.
- tom Dieck, S., Kochen, L., Hanus, C., Heumuller, M., Bartnik, I., Nassim-Assir, B., Merk, K., Mosler, T., Garg, S., Bunse, S., et al. (2015). Direct visualization of newly synthesized target proteins in situ. Nat Methods. 12(5): 411–414.
- Aviner, R. (2020). The science of puromycin: From studies of ribosome function to applications in biotechnology. Comput Struct Biotechnol J. 18: 1074–1083.
- De Pace, R., Ghosh, S., Ryan, V. H., Sohn, M., Jarnik, M., Rezvan Sangsari, P., Morgan, N. Y., Dale, R. K., Ward, M. E. and Bonifacino, J. S. (2024). Messenger RNA transport on lysosomal vesicles maintains axonal mitochondrial homeostasis and prevents axonal degeneration. Nat Neurosci. 27(6): 1087–1102.
- Fernandopulle, M. S., Prestil, R., Grunseich, C., Wang, C., Gan, L. and Ward, M. E. (2018). Transcription Factor-Mediated Differentiation of Human iPSCs into Neurons. Curr Protoc Cell Biol. 79(1): e51.
Article Information
Publication history
Received: Nov 22, 2024
Accepted: Jan 17, 2025
Available online: Feb 11, 2025
Published: Mar 5, 2025
Copyright
© 2025 The Author(s); This is an open access article under the CC BY-NC license (https://creativecommons.org/licenses/by-nc/4.0/).
How to cite
De Pace, R., Bonifacino, J. S. and Ghosh, S. (2025). Puromycin Proximity Ligation Assay (Puro-PLA) to Assess Local Translation in Axons From Human Neurons. Bio-protocol 15(5): e5224. DOI: 10.21769/BioProtoc.5224.
Category
Neuroscience > Cellular mechanisms
Cell Biology > Cell imaging > Confocal microscopy
Do you have any questions about this protocol?
Post your question to gather feedback from the community. We will also invite the authors of this article to respond.