- Protocols

- Articles and Issues
- For Authors
- About
- Become a Reviewer

Differentiation, Maintenance, and Contraction Profiling of Human Induced Pluripotent Stem Cell–Derived Cardiomyocytes
Published: Vol 15, Iss 5, Mar 5, 2025 DOI: 10.21769/BioProtoc.5222 Views: 4003
Reviewed by: Philipp WörsdörferWilliam C. W. ChenSamantha Haller
Original research article
The authors used this protocol in:
Oct 2022
Advertisement


Protocol Collections
Comprehensive collections of detailed, peer-reviewed protocols focusing on specific topics


Abstract
The development of patient-derived cardiac disease models has advanced rapidly due to the progress of human-induced pluripotent stem cell (hiPSC) technologies. Many protocols detail individual parts of the entire workflow, from handling hiPSCs and differentiating them into cardiomyocytes to live contraction imaging via widefield/phase-contrast and fluorescence microscopy. Here, we propose a streamlined protocol that guides users through hiPSC culture, differentiation, expansion, and functional imaging of hiPSC cardiomyocytes. First, hiPSC maintenance and handling procedures are outlined. Differentiation occurs over a two-week period, followed by selective expansion to increase the yield of hiPSC cardiomyocytes. Comprehensive characterization and quantification enable detailed contraction profiling of these cells. Designed to be low-cost, this protocol is suited for applications in drug discovery, screening, and clinical testing of patient-specific phenotypes. The addition of cardiomyocyte expansion and automated analysis distinguishes our protocol from current approaches.
Key features
• Protocol for the maintenance, differentiation, and expansion of hiPSC cardiomyocytes.
• Detailed guidance for characterization and functional imaging of hiPSC cardiomyocytes.
• Streamlined workflow integrating state-of-the-art protocols streamlined into a cost-effective approach.
• A complete timeline from hiPSC culture to contraction imaging achievable in as little as three weeks.
Keywords: hiPSCBackground
In recent years, human-induced pluripotent stem cells (hiPSCs) have become a widely accepted alternative for studying disease and toxicity, offering patient-specific models that mirror the original cells, thereby allowing for drug testing or examination of genetic mutations without direct patient involvement. In cardiovascular research, the use of hiPSC-derived cardiomyocytes has enabled patient-specific treatment advancements. Though still maturing, hiPSC cardiomyocytes are able to spontaneously contract and respond to pacing with electrodes or optogenetic guidance using channelrhodopsins. By utilizing state-of-the-art genetic engineering using CRISPR-Cas9 systems, it is possible to create isogenic iPSC lines that have the patient’s genetic background, further improving our understanding of cardiac disease and progression. 3D cardiac engineering is another field that is quickly progressing, with the possibilities of generating regenerative cardiac patches and 3D-engineered heart tissue. Advantages of this method include upscaling of cardiomyocyte differentiation and automated analysis. Disadvantages are the lack of maturation steps (e.g., electrical pacing) or guided differentiation to atrial cardiomyocytes via the addition of retinoic acid.
This protocol utilizes state-of-the-art techniques regarding hiPSC maintenance and hiPSC cardiomyocyte differentiation and maintenance [1–3]. This protocol describes the generation of assay-ready differentiated hiPSC cardiomyocytes in 15 days, including the expansion of cardiomyocytes afterward. As previously reported by Maas et al. [2], cardiomyocytes can be manipulated into the cell cycle by subjecting them to WNT pathway inhibition and a loss of cell-cell contact early in differentiation. This process allows the upscaling of otherwise non-dividing cells. We also provide a workflow for our in-house automated analysis software that can be used to quantify contractions using brightfield or calcium transient fluorescence recordings.
We optimized the protocol using two in-house hiPSC cell lines: a healthy control cell line and a hypertrophic cardiomyopathy cell line. The performance of differentiated hiPSC cardiomyocytes was compared to that of an industrial standard (Ncyte cardiomyocytes, Ncardia).
Materials and reagents
Biological materials
1. hiPSC (recommended cell line listed on hPSCreg: LUMCi028-A (RRID:CVCL_ZA25)
Reagents
1. Matrigel® hESC-qualified matrix (Corning, catalog number: 354277)
2. mTeSRTM plus (StemCell Technologies, catalog number: 100-0276)
3. ReLeSRTM dissociation reagent (StemCell Technologies, catalog number: 100-0483)
4. DMEM/F12 (Gibco, catalog number: 11554546)
5. Y-27672 (referred to as ROCK inhibitor, 10 mM) (Tocris, catalog number: 1254)
6. PBS (Sigma-Aldrich, catalog number: D8537)
7. DMSO (Sigma-Aldrich, catalog number: 41640)
8. HyClone fetal bovine serum (Cytiva, catalog number: SH30071.02E)
9. Accutase (StemCell Technologies, catalog number: 07920)
10. Trypan blue (Thermo Fisher, catalog number: 15250061)
11. B27 (50×) (Gibco, catalog number: A3582801)
12. B27 minus insulin (50×) (Gibco, catalog number: A1895601)
13. CHIR-99021 (5 mM) (Sigma-Aldrich, catalog number: SML1046)
14. BMP-4 (20 mg/mL) (Sigma-Aldrich, catalog number: SRP3016)
15. Activin-A (20 mg/mL) (Sigma-Aldrich, catalog number: SRP3003)
16. Wnt-C59 (2 mM) (SelleckChem, catalog number: S7037)
17. DL-lactate solution (60% w/w) (Sigma-Aldrich, catalog number: L4263)
18. StableCellTM RPMI-1640 (Sigma-Aldrich, catalog number: R2405)
19. RPMI-1640 minus glucose (Gibco, catalog number: 11879020)
20. Fibronectin (1 mg/mL) (Corning, catalog number: 354008)
21. TrypLETM Select enzyme (10×) (Gibco, catalog number: A1217701)
22. KnockOutTM (KO) serum replacement (Gibco, catalog number: 10828028)
23. RevitaCell supplement (100×) (Gibco, catalog number: A2644501)
24. Pluronic F-127 (10% w/v) (Sigma-Aldrich, catalog number: P2443)
25. Cal-520 AM (2.5 mM) (AAT Bioquest, catalog number: 21130)
Solutions
1. hiPS freezing medium (see Recipes)
2. Differentiation medium A (see Recipes)
3. Differentiation medium B (see Recipes)
4. Maintenance medium (see Recipes)
5. Selection medium (see Recipes)
6. Replating medium (see Recipes)
7. CM freezing medium (see Recipes)
8. CM thawing medium (see Recipes)
9. Imaging medium (see Recipes)
Recipes
1. hiPSC freezing medium
*Note: Volumes indicated are for one cryovial.
| Reagent | Final concentration | Quantity or Volume |
|---|---|---|
| mTeSR Plus | 50% | 550 μL |
| Hyclone fetal bovine serum | 40% | 440 μL |
| DMSO | 10% | 110 μL |
| ROCK inhibitor (10 mM) | 10 μM | 1.1 μL |
| Total* | ~1,100 μL |
2. Differentiation medium A
*Note: Volumes indicated are for one well of a standard six-well plate.
| Reagent | Final concentration | Quantity or Volume |
|---|---|---|
| RPMI-1640 | n/a | 1,954 μL |
| B27 minus insulin (50×) | 1× | 40 μL |
| CHIR-99021 (5 mM) | 5 μM | 2 μL |
| BMP4 (20 μg/mL) | 20 ng/mL | 2 μL |
| Activin-A (20 μg/mL) | 20 ng/mL | 2 μL |
| Total* | 2 mL |
3. Differentiation medium B
*Note: Volumes indicated are for one well of a standard six-well plate.
| Reagent | Final concentration | Quantity or Volume |
|---|---|---|
| RPMI-1640 | n/a | 1958 μL |
| B27 minus insulin (50×) | 1× | 40 μL |
| Wnt-C59 (2 mM) | 2 μM | 2 μL |
| Total* | 2 mL |
4. Maintenance medium
*Note: Volumes indicated are for one well of a standard six-well plate.
| Reagent | Final concentration | Quantity or Volume |
|---|---|---|
| RPMI-1640 | n/a | 1,960 μL |
| B27 (50×) | 1× | 40 μL |
| Total* | 2 mL |
5. Selection medium
*Note: Volumes indicated are for one well of a standard six-well plate.
#Note: 60% (w/w) of DL-lactate equates to a concentration of approximately 7.014 M.
| Reagent | Final concentration | Quantity or Volume |
|---|---|---|
| RPMI-1640 minus glucose | n/a | 1,958 μL |
| B27 (50×) | 1× | 40 μL |
| DL-lactate (60% w/w)# | 4 mM | 1.1 μL |
| Total* | ~2 mL |
6. Replating medium
*Note: Volumes indicated are for one standard well of a six-well plate.
| Reagent | Final concentration | Quantity or Volume |
|---|---|---|
| RPMI-1640 | n/a | 1,758 μL |
| B27 (50×) | 1× | 40 μL |
| KO serum replacement | 10% | 200 μL |
| ROCK inhibitor (10 mM) | 10 μM | 2 μL |
| Total* | 2 mL |
7. CM freezing medium
*Note: Volumes indicated are for one cryovial.
| Reagent | Final concentration | Quantity or Volume |
|---|---|---|
| RPMI-1640 | n/a | 779 μL |
| B27 (50×) | 1× | 20 μL |
| KO serum replacement | 10% | 100 μL |
| ROCK inhibitor (10 mM) | 10 μM | 1 μL |
| DMSO | 10% | 100 μL |
| Total* | 1 mL |
8. CM thawing medium
*Note: Volumes indicated are for one standard well of a six-well plate.
| Reagent | Final concentration | Quantity or Volume |
|---|---|---|
| RPMI-1640 | n/a | 1,758 μL |
| B27 (50×) | 1× | 40 μL |
| RevitaCell supplement (100×) | 1× | 20 μL |
| ROCK inhibitor (10 mM) | 10 μM | 2 μL |
| Total* | 2 mL |
9. Imaging medium
*Note: Volumes indicated are for one standard well of a six-well plate.
| Reagent | Final concentration | Quantity or Volume |
|---|---|---|
| RPMI-1640 | n/a | 1,936 μL |
| B27 (50×) | 1× | 40 μL |
| F-127 (10% w/v) | 0.1% | 20 μL |
| Cal-520 (2.5 mM) | 5 μM | 4 μL |
| Total* | 2 mL |
Laboratory supplies
1. 6-well plates (Greiner Bio-One, catalog number: 10536952)
2. 15 mL tubes (Corning, catalog number: 430791)
3. 50 mL tubes (Greiner Bio-One, catalog number: 227261)
4. 1.5 mL safe-lock tubes (Eppendorf, catalog number: 0030120086)
5. Cryovial tubes (Thermo Fisher, catalog number: 368632)
6. Pipettes (2, 20, 200, 1,000 μL) (Gilson, catalog number: F167360)
7. Filtered pipette tips (10, 20, 200, 1,000 μL) (Greiner Bio-One, catalog numbers: 771363, 773363, 775363, 778363)
8. Pipette controller (Fisher Scientific, catalog number: 03-840-312)
9. 5, 10 mL filtered serological pipettes (Greiner Bio-One, catalog numbers: 606180, 607180)
Equipment
1. Countess 3 automated cell counter (Invitrogen, catalog number: AMQAX2000)
2. Inverted microscope with fluorescence and widefield/phase-contrast (e.g., Ti-Eclipse inverted microscope, Nikon, catalog number: SM100606-MG1)
3. Heated stage top incubator with CO2 + air (e.g., Tokai hit stage top incubator, Tokai Hit, catalog number: ZILCSD-HL)
4. Microscope camera (Photometrics, model: Coolsnap HQ2)
5. Centrifuge for 15–50 mL tubes (e.g., Eppendorf 5810R, Eppendorf, catalog number: EP022628168)
Software and datasets
1. Microscope imaging software, e.g., MetaMorph (version 7.8.0.0)
2. ImageJ (version 1.53t)
3. MATLAB (version R2022A, license required)
4. All data and code have been deposited to GitHub: https://github.com/msnelders1/CardiomyocyteContractionAnalysis (Access date, October 24, 2024)
Procedure
We describe below the step-by-step procedure for maintaining hiPSC cells in culture, differentiating the hiPSC into hiPSC cardiomyocytes, maintaining the hiPSC cardiomyocytes, and finally imaging and quantifying the cardiomyocyte contractions. Volumes are shown for one cryovial of cells. In this protocol, hiPSCs are cryopreserved in colonies instead of single cells to improve viability and preserve pluripotency after thawing. As such, the number of cells needed for seeding is not stated unless single cells are directly required. If needed for specific protocols other than those listed here, hiPSCs can be dissociated as single cells (refer to section C).
A. Thawing hiPSC
1. Per cryovial, prepare all wells of the 6-well plate with Matrigel; dilute 0.5 mg of Matrigel in 6 mL of cold DMEM/F12, and add 1 mL per well.
2. Incubate the Matrigel-coated plate for at least 1 h at room temperature. Plates can be stored at 7 °C for up to two weeks.
3. Prepare the required volumes for three wells at room temperature: 7 mL of mTeSR Plus + 10 μM ROCK inhibitor, and 4 mL of DMEM/F12 + 10 μM ROCK inhibitor. Cells will be seeded at three densities in three wells: the smallest dilution for cryopreservation, the second dilution for passaging, and the highest dilution as backup. The remaining three wells can be used for passaging later on.
4. Retrieve the cryovial from the liquid nitrogen storage. Thaw up to two vials at a time, keeping the other vials on ice, if needed.
5. Unscrew the vial cap a quarter turn within the flow cabinet and then re-tighten it to release pressure from long-term storage before thawing.
6. Warm the vial in a water bath at 37 °C until a small lump of ice remains.
7. Rinse the outside of the vial with ethanol before placing the vials in the flow cabinet.
8. Transfer cells from the vial to a 15 mL centrifuge tube using a P1000 pipette.
9. Rinse the contents of the vial with 1 mL of DMEM/F12+ROCK and transfer the 1 mL to the 15 mL centrifuge tube dropwise.
10. Dropwise, add 3 mL of DMEM/F12+ROCK using a 5 mL pipette (dropwise addition avoids osmotic shock).
11. Centrifuge cells at 200× g for 5 min.
12. Discard the supernatant.
13. Remove Matrigel coating solution from the prepared plates.
14. Resuspend cells in 2 mL of mTeSR Plus + ROCK and seed accordingly; recommended dilutions are 1:2, 1:4, and 1:8 (for single cells, this may range from 0.5 to 1.5 × 10⁶ cells/well).
15. Place cells in an incubator overnight.
16. The next day, replace the medium with 2 mL of room-temperature mTeSR Plus.
17. Maintain cells by replacing the medium every other day or over the weekend (in this case, double the volume of medium used).
18. When cells reach 70% confluency (see Figure 1), split cells either as colonies (section B) for regular maintenance and differentiation or as single cells (section C) for assays not listed in this protocol. See General note 2.
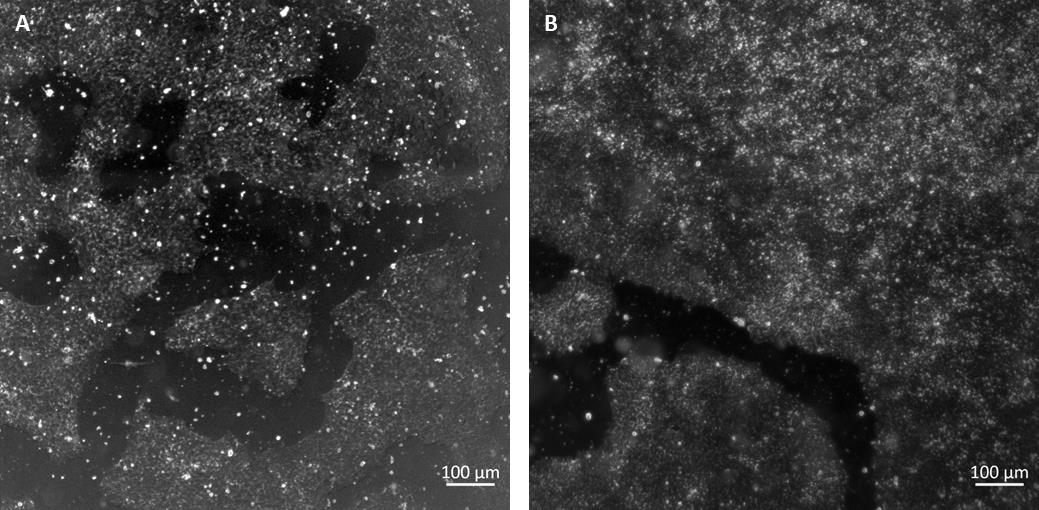
Figure 1. Examples of maximum confluency of human-induced pluripotent stem cells (hiPSCs). (A) 70% confluency for passaging. (B) 90% confluency for cryopreservation/differentiation. Black areas are background, white areas are cell colonies.
B. Passaging hiPSC (as aggregates)
1. Examine the confluency of the hiPSC; cells should not cover more than ~70% of the surface area for routine passaging. (Exceeding that may induce spontaneous differentiation.)
2. Either use the previously unused wells for passaging or coat a new 6-well plate with Matrigel; dilute 0.5 mg of Matrigel in 6 mL of cold DMEM/F12 and add 1 mL per well. Incubate for 1 h at room temperature.
3. Aspirate medium from cells.
4. Add 1 mL of ReLeSR to cells using a P1000 pipette and keep the pipette tip in place for reuse.
5. Tilt the plate until the entire surface area is covered; then, aspirate the ReLeSR with the same pipette tip, discarding the tip along with the ReLeSR.
6. Incubate for 3 min at room temperature.
Note: Longer incubation times will dislodge differentiated cells.
7. To dislodge cells, firmly pipette 1 mL of mTeSR Plus across the center of the well (Figure 2). Repeat across the edges in a circular motion to dislodge any remaining cells. Avoid excessive pipetting to prevent aggregate size reduction, which may induce spontaneous differentiation. The optimal size of cell aggregates after dissociation is between 50 and 200 μm.
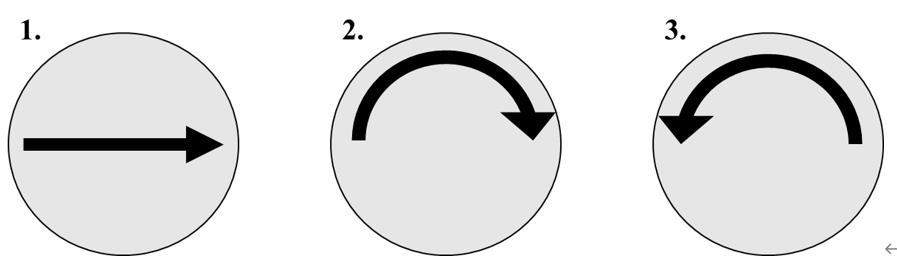
Figure 2. Dissociating human-induced pluripotent stem cells (hiPSCs) in three motions across the well. (1) medium is dispensed across the middle of the well. (2) The same medium is dispensed again, clock-wise across the edge of the well. (3) The same medium is now dispensed anti-clockwise across the edge of the well.
8. Seed cells in a new 6-well plate to the required density (this may range from 1:4 to 1:12).
9. Add 2 mL of mTeSR Plus medium to the wells for 48 h incubation or 4 mL for 72 h incubation.
10. Mix well by swirling and confirm an even distribution across the well.
C. Passaging hiPSC (as single cells, optional)
1. Examine the confluency of the hiPSC; cells should not cover more than ~70% of the surface area for routine passaging (see Figure 1). Exceeding that may induce spontaneous differentiation over longer periods.
2. Either use the previously unused wells for passaging or coat a new 6-well plate with Matrigel; dilute 0.5 mg of Matrigel in 6 mL of cold DMEM/F12 and add 1 mL per well. Incubate for 1 h at room temperature.
3. Prepare mTeSR Plus + 10 μM ROCK inhibitor (2 mL + 2 mL/well) and DMEM/F12 + 10 μM ROCK inhibitor (4 mL).
4. Aspirate the medium from cells.
5. Wash once with prewarmed room-temperature PBS.
6. Add 0.5 mL of Accutase per well (cover the entire bottom of the well).
7. Incubate for 5 min at 37 °C.
8. Dislodge cells by gently tapping the side of the plate. Confirm full dissociation under a microscope.
9. Add 3.5 mL of DMEM/F12 + ROCK and transfer to a 15 mL tube.
10. Centrifuge cells at 200× g for 5 min.
11. Discard supernatant and resuspend in 1–5 mL of mTeSR + ROCK.
12. In a 1.5 mL tube, mix 15 μL of trypan blue with 15 μL of cell solution, load into a counting chamber, and determine cell count.
13. Calculate the required number of cells for resuspension in 2 mL based on assay requirements and resuspend accordingly. As an example for differentiation (reaching 90% confluency three days after seeding; see Figure 1), cells can be seeded at a density range of 1–2.5 × 10⁶ cells/well. Density may differ per cell type and should be tested empirically.
14. Aspirate the newly coated 6-well plate and add cells.
D. Freezing hiPSC
1. Examine the confluency of the hiPSC; this should be ~90% for freezing (see Figure 1).
2. Prepare 1 mL of DMEM/F12 + 10 μM ROCK inhibitor.
3. Freshly prepare 1.1 mL hiPSC freezing medium (see Recipes).
4. Aspirate the medium from cells.
5. Add 1 mL of ReLeSR to cells, tilt the plate to cover the surface with ReLeSR, aspirate it with the same pipette tip, and then discard.
6. Incubate for 3 min at room temperature.
7. Tilt the plate and add 1 mL of DMEM/F12+ROCK across the edge of the well, dislodging cells (refer to step B7).
8. Transfer cells to a 15 mL centrifuge tube.
9. Centrifuge cells at 200× g for 5 min.
10. Aspirate the supernatant.
11. Add 1 mL of freezing medium. Resuspend cells up to two times.
12. Transfer cells to a cryovial and store in a cryopreservation vessel at -80 °C overnight for up to one week.
13. Transfer cells to liquid nitrogen storage.
E. Differentiation of hiPSC cardiomyocytes
1. Day -3
Passage hiPSC so that confluency will be >80% at Day 0 (refer to section B/C). If needed, seed a range of densities to ensure optimal confluency.
2. Day 0
a. Examine the confluency of the hiPSC. Make sure confluency is >80%.
b. Replace the medium with 2 mL of freshly prepared differentiation medium A (see Recipes) + 5 μM CHIR-99021 + 20 ng/mL BMP4 + 20 ng/mL Activin-A. See General note 4.
c. Incubate for two days.
3. Day 2
a. Replace the medium with 2 mL of freshly prepared differentiation medium B (see Recipes) + 2 μM Wnt-C59. See General note 4.
b. Incubate for two days.
4. Day 4
a. Replace the medium with 2 mL of maintenance medium (see Recipes). See General note 4.
b. Refresh medium every 2–3 days.
Note: Spontaneous beating may occur from day 6 onward.
5. Day 9
a. Replace medium with 2 mL of freshly prepared selection medium (see Recipes).
Note: DL-lactate is a viscous solution and is stored at 2–8 °C. A small portion can be transferred to a 15 mL tube and briefly warmed up before pipetting to reduce some of its viscosity.
b. Incubate for two days.
6. Day 11
Continue with replating hiPSC cardiomyocytes (see section F).
F. Replating hiPSC cardiomyocytes
1. Prepare fibronectin-coated plates or flasks: add 1 mL of 10 μg/mL fibronectin in PBS to a well in a 6-well plate. Store plates at 2–7 °C for up to two weeks. Store dissolved fibronectin at -20 °C for up to a year.
2. Wash cells with PBS.
3. Add 500 μL of TrypLE Select (10×) to each well. Make sure the entire well is covered.
4. Incubate at 37 °C for 5–15 min. Every 5 min, confirm complete cell detachment by gently tapping the plate. Avoid pipetting. If necessary, repeat step F3, but do not exceed 30 min.
5. Add 2 mL of freshly prepared replating medium (see Recipes) using a 5 mL pipette. See General note 4.
6. Transfer cells to a 50 mL centrifuge tube.
7. Add 1 mL of replating medium into the well to retrieve any remaining cells. Transfer to the 50 mL tube.
8. Centrifuge cells at 200× g for 5 min and discard the supernatant.
9. Discard the fibronectin solution from coated plates and resuspend cells in replating medium.
a. For newly differentiated cells for expansion, resuspend one well of a 6-well plate in 1,500 μL of replating medium, transfer 100 μL to each new well of a 6-well plate, and use the remaining 900 μL for cryopreservation (adding 100 μL of DMSO).
b. For routine replating of differentiated cells, seed all cells of a single well to a new well of a 6-well plate. Incubate overnight. See General note 5.
10. Replace the medium the next day to either:
a. Maintain cells by replacing medium every other day or over the weekend.
b. Start expansion (Section G).
G. hiPSC cardiomyocyte expansion
1. Replace medium with 2 mL of freshly prepared maintenance medium (see Recipes) + 2 μM CHIR-99021. See General note 4.
2. Incubate for 2–3 days. Check confluency daily.
3. For further expansion, repeat the replating and expansion steps before reaching ~50% confluency.
Note: Expansion is based on the addition of CHIR-99021 and lack of cell–cell contact. The latter requires careful examination of the expansion progress on a daily basis.
H. hiPSC cardiomyocyte freezing
1. Wash cells with PBS.
2. Add 500 μL of 10× TrypLE Select (10×) to each well. Make sure the entire well is covered.
3. Incubate at 37 °C for 5–15 min.
4. Confirm cell detachment by tapping the plate. Avoid pipetting. If necessary, repeat step H3, but do not exceed 30 min.
5. Add 2 mL of replating medium using a 5 mL pipette. See General note 4.
6. Transfer cells to a 50 mL centrifuge tube.
7. Add 1 mL of replating medium into the well to retrieve any remaining cells. Transfer to the 50 mL tube.
8. Centrifuge cells at 200× g for 3 min and discard the supernatant.
9. Take a sample for cell counting: 15 μL of cell suspension + 15 μL of trypan blue. We typically freeze ~1–2 × 10⁶ cells per vial.
10. Resuspend in CM freezing medium (see Recipes). See General note 4.
11. Transfer to cryovials and store at -80 °C overnight (up to one week). Transfer cells to liquid nitrogen storage.
I. hiPSC cardiomyocyte thawing
1. Prepare fibronectin-coated plates or flasks with 10 μg/mL fibronectin in PBS.
2. Prepare 10 mL of freshly made CM thawing medium (see Recipes). See General note 4.
3. Retrieve the cryovials from the liquid nitrogen storage, unscrew the cap a quarter within a flow cabinet, and then tighten. This ensures that pressure build-up from long-term storage is released before thawing.
4. Warm cryovials in a water bath at 37 °C until only a small lump of ice remains.
5. Rinse the outside of the vial with ethanol and place in the flow cabinet.
6. Transfer cells from the vial to a 50 mL centrifuge tube using a P1000 pipette.
7. Rinse the contents of the vial with 1 mL of prewarmed thawing medium and dropwise transfer the 1 mL to the 50 mL centrifuge tube.
8. Dropwise add 3 mL of thawing medium using a 5 mL pipette.
9. Centrifuge cells at 200× g for 3 min and discard the supernatant.
10. Discard the fibronectin from the coated plates.
11. Resuspend cells in thawing medium and seed accordingly; for expansion, 1:10–1:20 depending on what dilution cells were frozen in (roughly 0.5–1.0 × 10⁵ cells/well). For routine passaging, seed to full confluency (1 × 10⁶ cells/well).
12. Place cells in an incubator overnight.
13. The next day, replace the medium with prewarmed cardiomyocyte maintenance medium.
14. Replate cells three days after thawing (see section F).
J. hiPSC cardiomyocyte live contraction imaging
1. Maintain hiPSC cardiomyocytes in culture for at least two days after replating.
2. Freshly prepare imaging medium (see Recipes). See General note 4.
3. Replace the medium with imaging medium.
4. Incubate for 30–60 min.
5. Wash cells once with maintenance medium (see Recipes). See General note 4.
6. Add maintenance medium and start imaging within 60 min:
a. Recommended pixel size: 0.33 μm/pixel.
b. Recommended recording speed: 25 frames per second or higher.
c. Fluorescent imaging captures the calcium flux.
d. Widefield/phase-contrast imaging is used to capture the movement of cells (example image shown in Figure 3).
Notes:
1. Ensure proper pixel size and recording speed. Some microscopes may not include these details in metadata.
2. Analysis software can yield absolute pressure values (Pa/s) if cells are grown on a substrate with a known shear modulus. Plastic dishes yield arbitrary units (AU).
3. Recordings are recommended to be taken at 0.33 μm/pixel and 25 frames per second or higher. Due to the nature of the data analysis used in this protocol, record at 50 frames per second or smaller pixel size.
4. Cal-520 signal may decrease over time. Recording the fluorescent signals takes precedence over widefield/phase-contrast imaging.
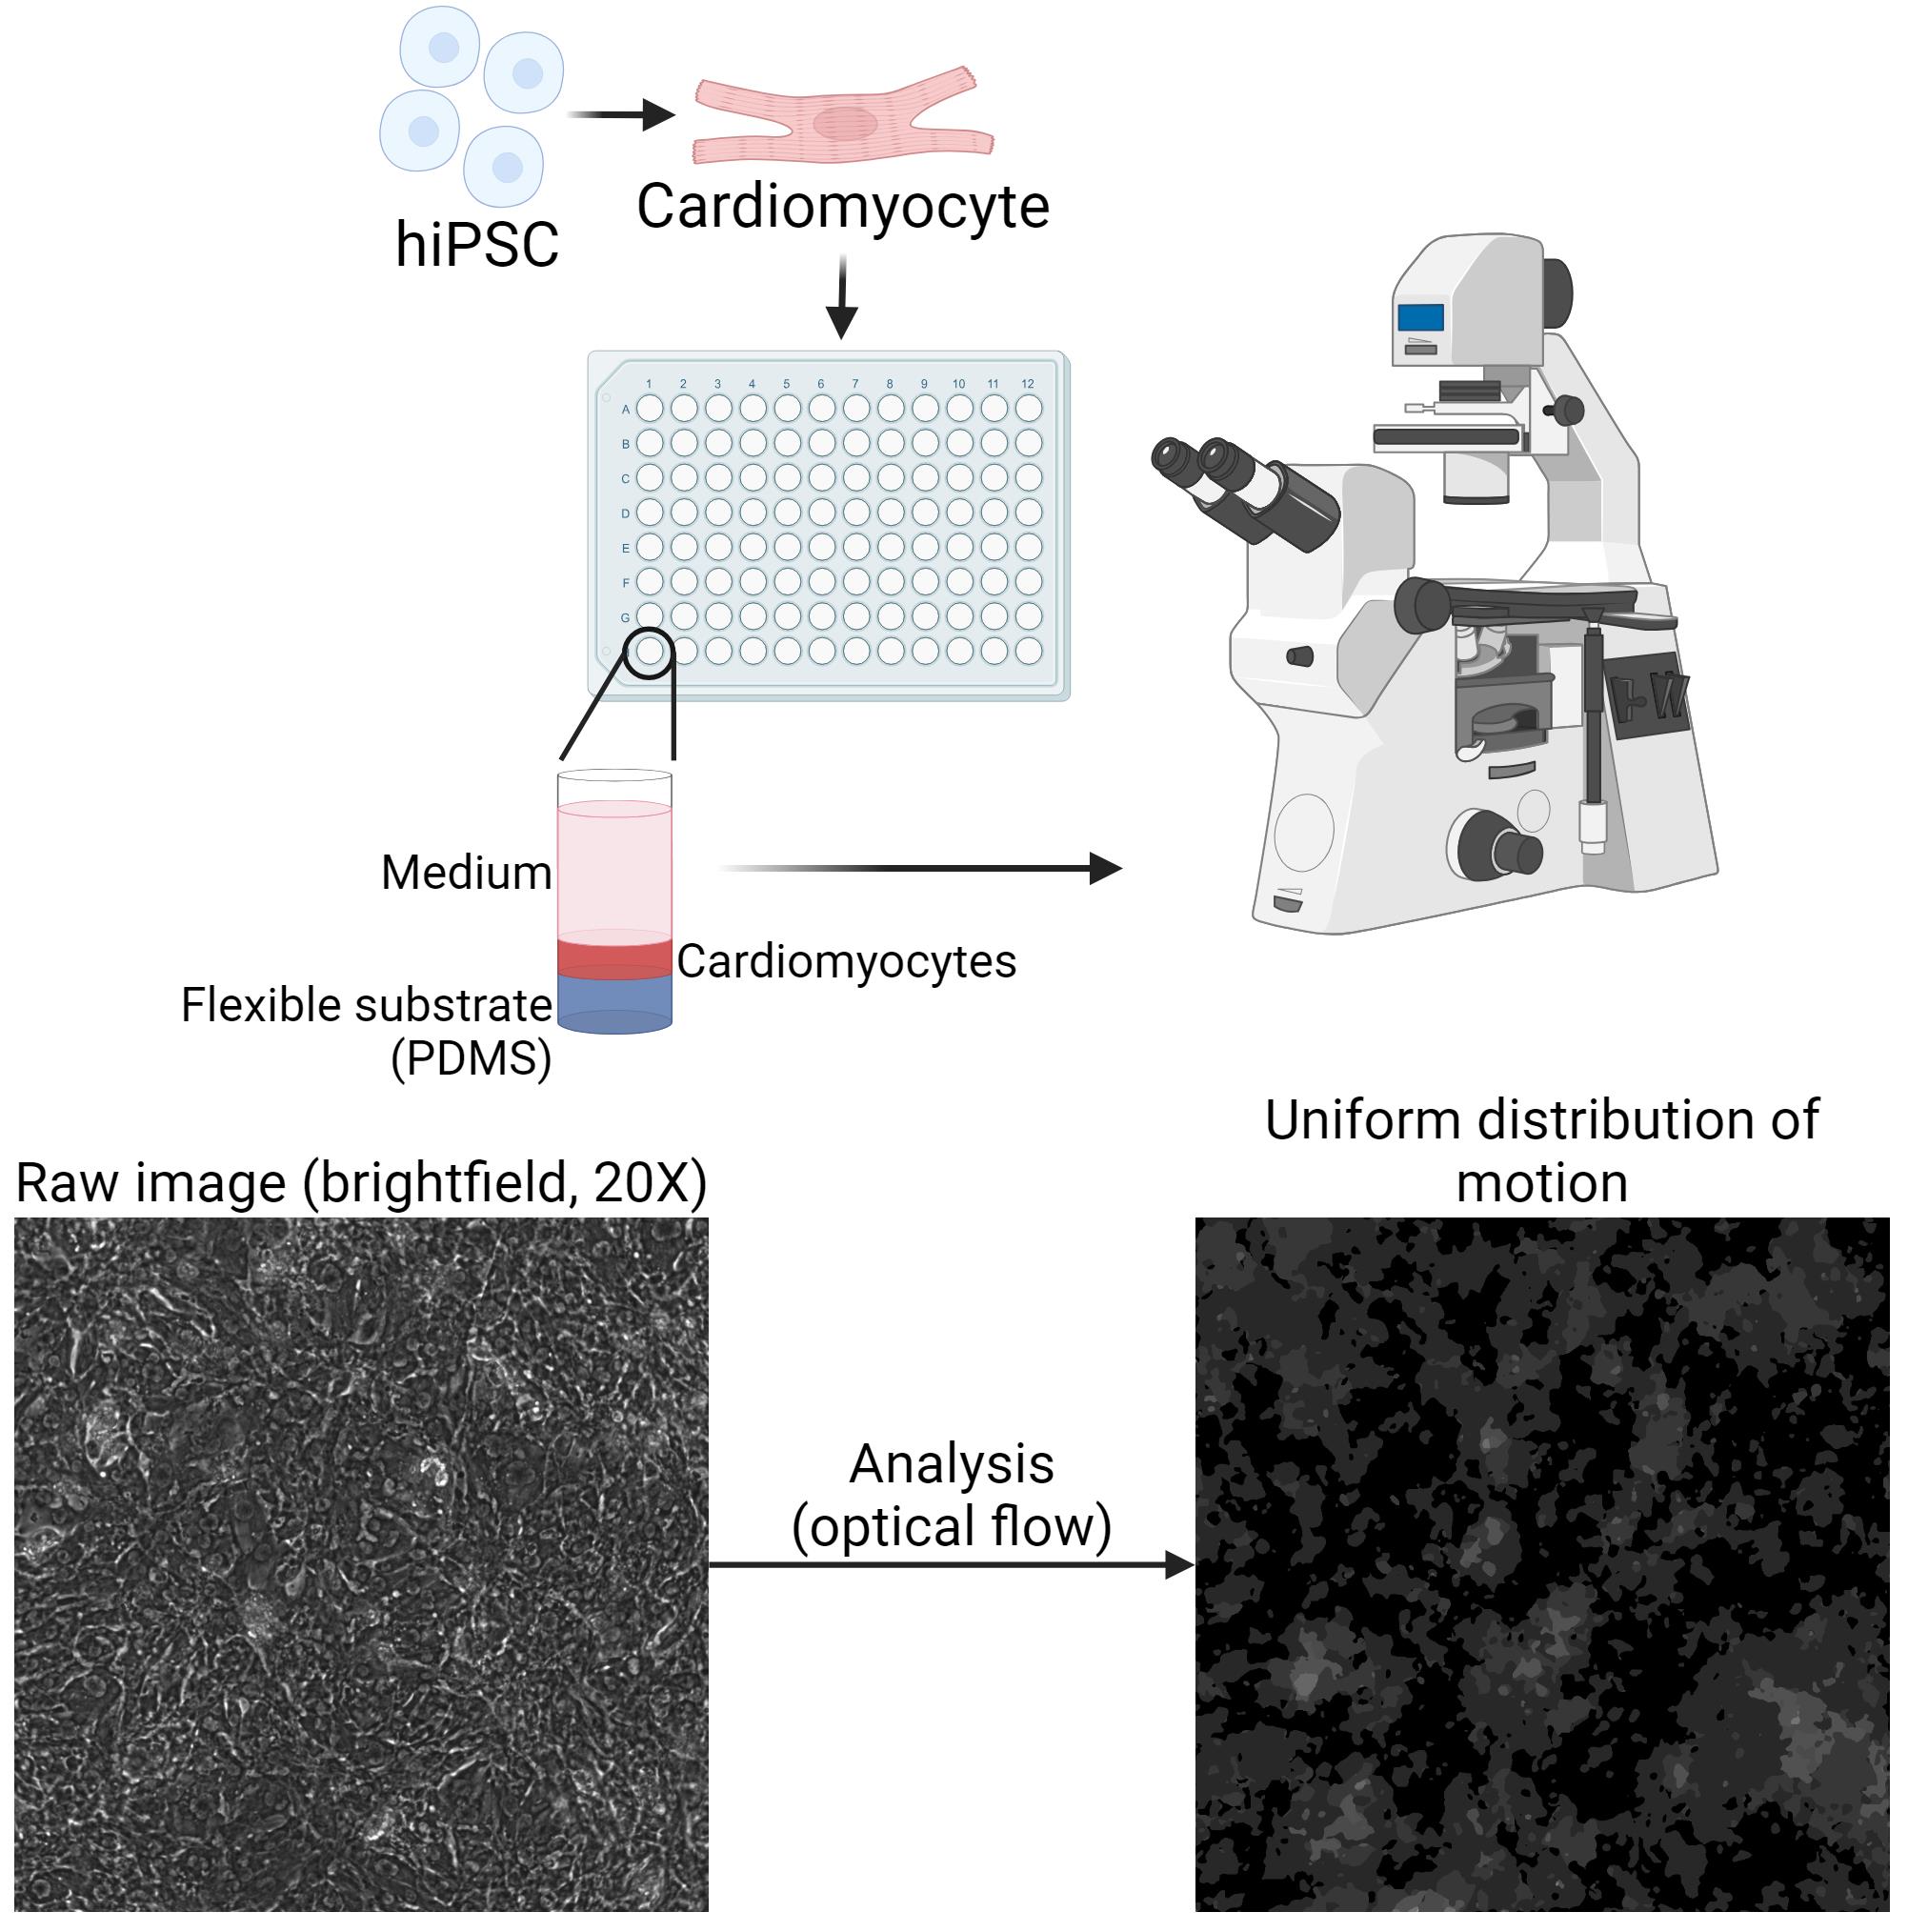
Figure 3. Imaging setup and recording requirements. hiPSC are differentiated into hiPSC-cardiomyocytes and seeded onto a well containing a PDMS substrate. Microscopic recordings are made and processed through our optical flow-based analysis. The resulting flow vectors should show a uniform distribution of motion across the entire field of view.
Data analysis
Recordings should have at least five full contraction cycles per recording. At smaller fields of view, multiple recordings at different locations in the same well can improve accuracy. At least three biological replicates are recommended for reliable results.
The following describes the analysis of the widefield/phase-contrast recordings, as developed previously [3].
1. Start ImageJ.
2. Open ImageProcessing.ijm.
3. Click Run or, in the menu bar, select Run > Run.
4. A window should appear. Fill in the window as required (Figure 4):
a. Image directory: The folder that contains the recordings to be processed.
b. Overwrite: Whether already processed images need to be processed again.
c. Show Images: Whether the processing of images should be shown (enabling will increase processing time).
d. InputType: What type of images are to be processed (currently supported formats are .tif and .avi extension).
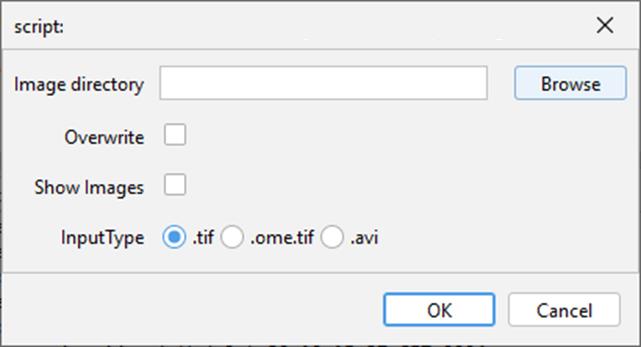
Figure 4. ImageJ input parameters window
5. Clicking OK will start image processing. A log will keep you informed of the progress.
6. After processing, two new files will be created; filename_processed.tif will contain the vector fields used to determine movement. This can be used to evaluate the reliability of the analysis. Filename_processed.csv contains the raw movement data in text format, which will be used for subsequent analysis in MATLAB.
7. Start MATLAB.
8. Open BatchOpticFlowV3.m.
9. Run the script by clicking the green Run arrow.
10. The script will show a menu. Fill in accordingly (Figure 5):
a. Pixel size (μm): Fill in the pixel size of the recordings, as defined by the microscope and lens combination used (in μm).
Note: Some microscopes include this in the metadata of the images, although these might not always be accurate.
b. Shear modulus (kPa): In the case of growing cells on a flexible substrate such as PDMS or hydrogel, fill in the shear modulus of said substrate. This is used to calculate the absolute pressure differentials per second in the recording.
Note: In case cells are grown on plastic, leave this at 15. Treat the resulting pressure changes as AU.
c. Frames per second: Fill in the recording speed that was used.
Note: Some microscopes include this in the metadata of the images, although these might not always be accurate.
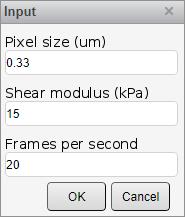
Figure 5. MATLAB input parameters window
11. Proceed by clicking OK.
12. Browse to the folder containing the filename_processed.tif files provided by the ImageJ macro.
13. Clicking OK will start the analysis. Depending on the number of recordings, this may take some time.
14. A new window will be shown. Here, each recording can be checked individually for peak detection (Figure 6).
a. Graph: Shows two peaks per contraction cycle; a dark-blue peak signifying the contraction phase, and a light-blue peak signifying the relaxation phase.
b. Switch peaks: Necessary when the analysis selects the first peak of a cycle as relaxation instead of contraction.
c. Threshold: Y-axis threshold that determines the cutoff point for peak detection.
d. kPa: Can be used to change the substrate stiffness per recording.
e. Exclude data: Exclude a recording for downstream analysis.
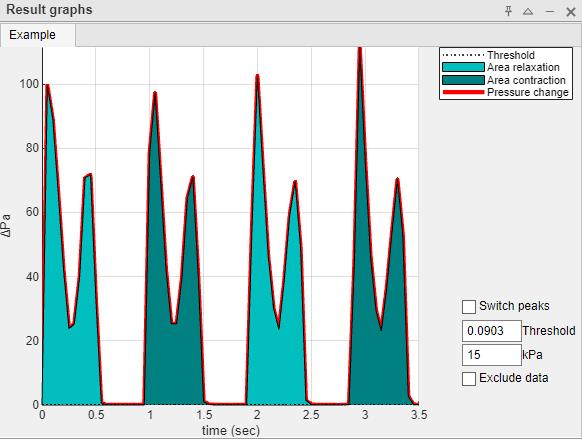
Figure 6. Graphical representation of each recording with incorrect peak detection. An incorrect peak detection may show two peaks merged as one. Correction may involve increasing the threshold.
15. In the above example, the two peaks (contraction and relaxation) are identified as a single peak (single color). This can be corrected by setting the threshold to 25.4, which will separate the peaks as intended (Figure 7).
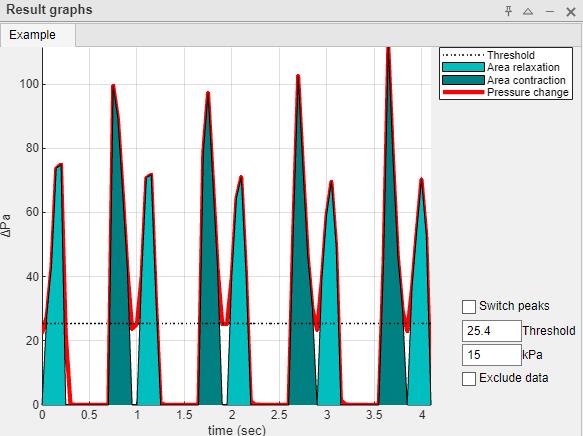
Figure 7. Graphical representation of each recording with corrected peak detection. Pressure changes are correctly graphed into two peaks. Dark teal depicts the area during contraction and light teal the area during relaxation.
16. Go through all the recordings by selecting the tabs on the top of the window, changing the threshold where needed, and switching peaks or excluding data where needed.
17. Close the window to proceed with the analysis.
18. Select whether extra graphs should be exported; these graphs show the contractions as differential pressure (filename_graphDP.tif) and normalized cumulative absolute pressures (filename_graphNCP.tif).
19. The following window is a summary of all the data. The Group column can be changed to separate recordings. These results can be found in results.csv in the folder.
20. The results include the following parameters:
a. File: The filename of the recording.
b. Movie: The name of the movie extracted from the filename.
c. Excluded: Whether this recording was excluded from analysis.
d. Threshold: Used in setting the peak detection in the analysis.
e. ShearMod (kPa): Used to determine pressure values (based on shear modulus formula).
f. Beats per minute (bpm): How many contraction/relaxation cycles per minute. Provides the most information.
g. Beat duration (s): How long one contraction/relaxation/rest cycle lasts.
h. Contraction time (s): Time cells are contracting.
i. Relaxation time (s): Time cells are relaxing.
j. Time ratio: Ratio between h) and i). Usually this lies above 1.0 due to contraction happening faster than relaxation.
k. Time between contraction and relaxation (s): Period between the contracting and relaxing phases.
l. Time between beats (s): Average time between the end of a relaxation phase and the following cycle’s contraction phase (i.e., resting phase).
m. Max between beats (s): Maximum time during resting phases. Provides useful info regarding arrhythmia.
n. StDev between beats (s): The standard deviation of times during resting phase. Provides useful info regarding arrhythmia.
o. Mean contraction pressure (\DeltaPa): Mean pressure during contraction peaks (AU if cells are grown on plastic). Provides the most information.
p. Mean relaxation pressure (\DeltaPa): Mean pressure during relaxation peaks (AU if cells are grown on plastic). Provides the most information.
q. Mean pressure per frame (\DeltaPa): Mean pressure during both contraction and relaxation peaks (AU if cells are grown on plastic).
r. Max contraction pressure (\DeltaPa): Max pressure during contraction peaks (AU if cells are grown on plastic).
s. Max relaxation pressure (\DeltaPa): Max pressure during relaxation peaks (AU if cells are grown on plastic).
t. Max pressure ratio: Ratio between r and s. Usually above 1.0 due to contraction happening quicker.
u. Max contraction slope (dP/dt): The mean upward slope of the contraction peak.
v. Max relaxation slope (dP/dt): The mean downward slope of the relaxation peak.
w. Average total contraction pressure (Pa): Average contraction pressure over all frames (AU if cells are grown on plastic).
x. Average total relaxation pressure (Pa): Average relaxation pressure over all frames (AU if cells are grown on plastic).
y. Area ratio: Ratio between w and x. Usually above 1.0 due to contraction happening quicker.
Analysis of calcium transients can be done using the Calcium_V2.m MATLAB file. The dF/F0 method is used to calculate transient parameters [4] as follows:
1. Run the Calcium_V2.m file and fill in the form (Figure 8):
a. Frames per second: The recording speed of the image.
b. Debug mode: Provides additional graphs that may help interpret the correction and outcome of the results.
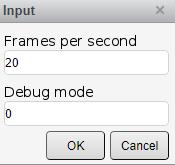
Figure 8. Calcium transient analysis input parameter window
2. Select the folder containing only the calcium transient recordings.
3. The log should show whether signal decay could be corrected for each recording.
4. The results are put in the CalciumResults.csv file in the selected folder, containing the following parameters:
a. File: Name of the file analyzed.
b. DF/F0 Max (AU): The average of each peak’s maximum signal intensity.
c. DF/F0 Mean (AU): The average of each peak’s mean signal intensity.
d. Peak Duration (s): The average duration of each transient, in seconds.
e. Peak Frequency (s): Peak to peak duration of transients, in seconds.
Validation of protocol
hiPSC cardiomyocytes show spontaneous contractility
This protocol was fine-tuned for two in-house hiPSC lines; a cell line derived from a healthy donor (control), and cells carrying a mutation in MYBPC3 clinically presented as causing hypertrophic cardiomyopathy (HCM). The efficiency of differentiation was evaluated by comparing the in-house cell lines with commercially available Ncyte cardiomyocytes (Ncyte), a standardized hiPSC cardiomyocyte line. A timeline of the protocol is shown in Figure 9A. Morphology of cells and structural changes were followed every other day, as shown in Figure 9B. Fluorescent staining showed comparable sarcomere buildup (Figure 9C). Overall, differentiation efficiency was estimated to be >90% based on the presence/absence of sarcomere staining within cells.
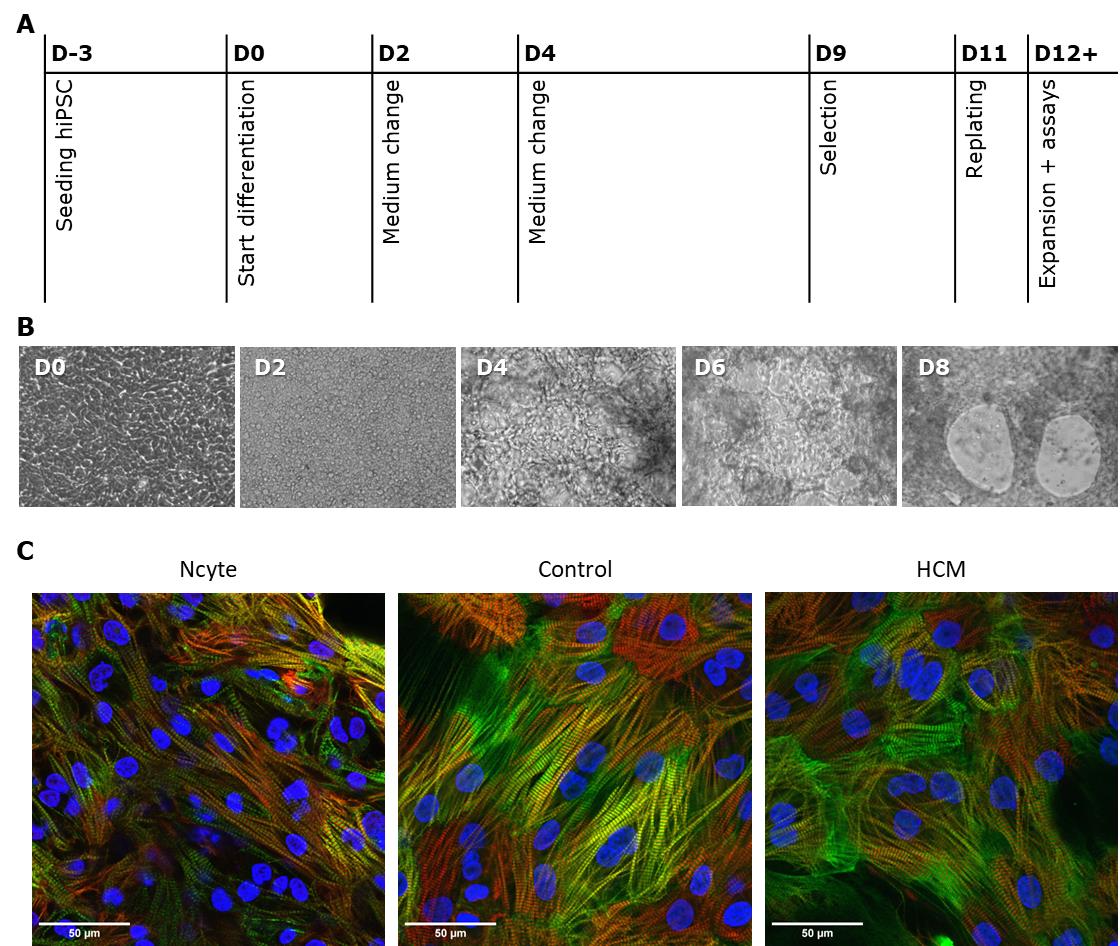
Figure 9. Overview of the differentiation process. (A) Step-by-step representation, showing the procedures in days (D0–D8) during differentiation. (B) Example brightfield images of control cells throughout differentiation at 20× amplification. (C) Example fluorescent staining of cardiac sarcomere markers MYBPC3 (red), cTnI (green), and nucleus (blue).
Expanded hiPSC cardiomyocytes show purity and remain durable in long-term culture
The performance of the cardiomyocytes was examined after 17 days of differentiation. Cells were seeded onto a PDMS slide with tunable stiffness. Brightfield recordings were made of the contracting iPSC-cardiomyocytes and quantified as published before [3]. The resulting contraction profiles are shown in Figure 10. Here, we can see that the Ncyte cells show two replicates that were contracting at a slower rate, as determined by the number of contraction cycles during a 10 s interval.
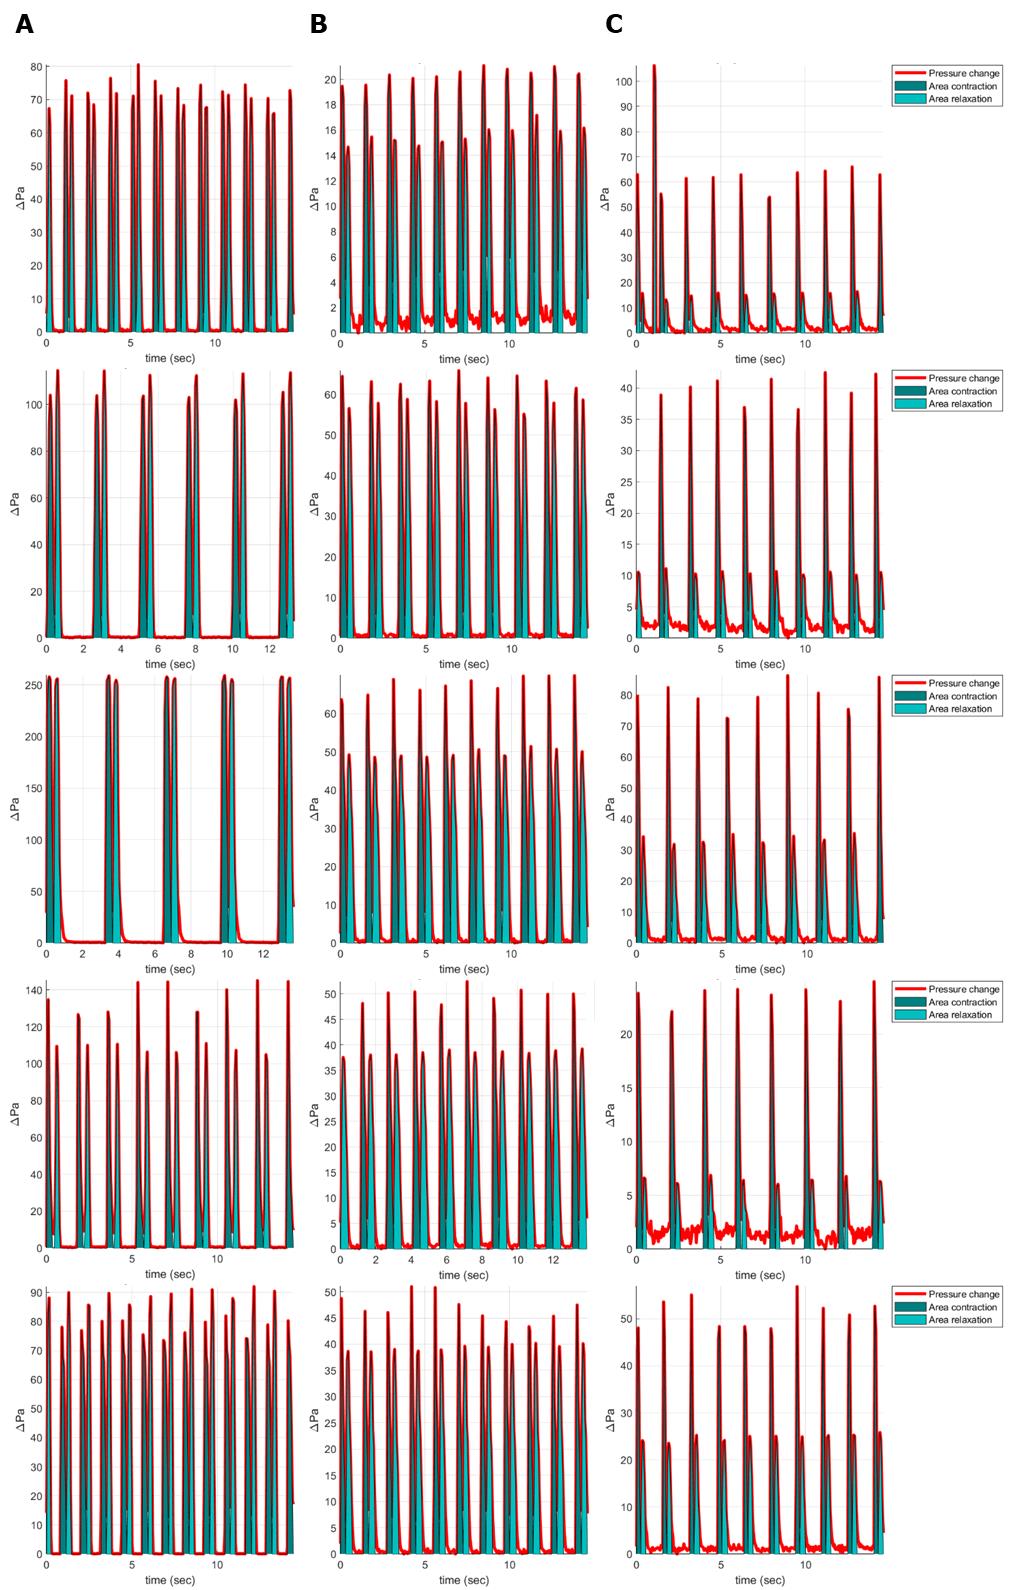
Figure 10. Contraction profiles of hiPSC cardiomyocytes as previewed in MATLAB. (A) Ncyte samples. (B) Control samples. (C) HCM samples. n = 1 from five technical replicates.
The resulting data shows that our differentiated iPSC-cardiomyocyte lines were contracting at a comparable rate as the Ncyte cardiomyocytes (Figure 11A). Unexpectedly, Ncyte cells show larger variation between samples. Likewise, the same is observed in the contraction and relaxation pressure changes (Figure 11B). Our differentiated iPSC-cardiomyocyte lines show consistent data with low standard deviation. In HCM cells, a lower pressure change was measured during relaxation compared to control (Figure 11C), which is characteristic of the specific MYBPC3 mutation.
Calcium signals were comparable between both differentiated cell lines (Figure 11D), although again with high variation in the Ncyte cells, similar to the brightfield data.
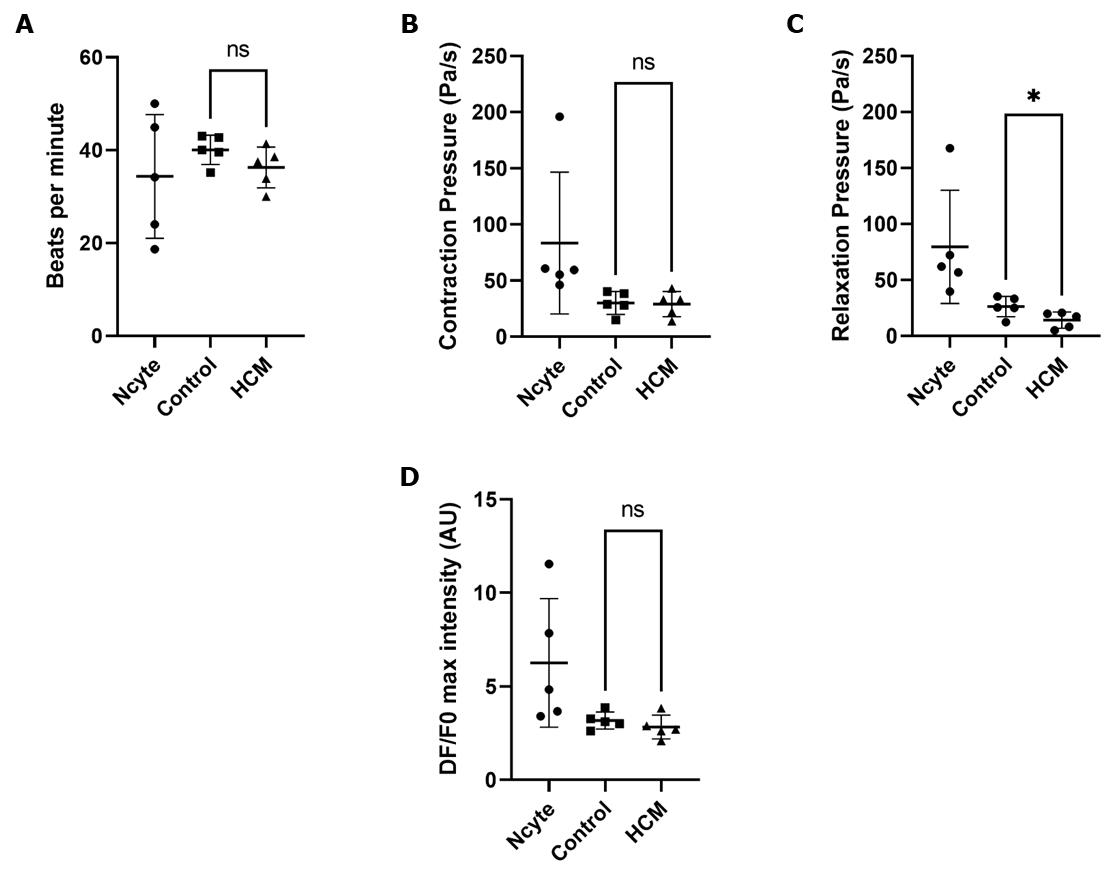
Figure 11. Functional analysis of brightfield recordings of cardiomyocyte contractility. ( A) Beating rates of the cardiomyocytes. (B) Contraction pressure change over time. (C) Relaxation pressure change over time. (d) Max peak intensity of the calcium transient fluorescence signal. Bars represent mean ± SD. n = 1 from five technical replicates. An unpaired t-test was performed on HCM vs. control. ns, not significant; *, p < 0.05.
General notes and troubleshooting
General notes
1. In this protocol, hiPSCs are cultured under sterile conditions such that no antibiotics are needed. Use of sterile equipment as well as working in a sterile environment are required. This includes avoiding working in a flow cabinet that has been recently used to culture other cells, avoiding cross-contamination. hiPSC cardiomyocytes do allow the use of antibiotics such as penicillin/streptomycin.
2. hiPSCs can be used for assays approximately two weeks after thawing or after three passages. It is recommended to freeze one well of hiPSCs as soon as they reach >70% confluency to keep the number of passages in storage low, as well as keeping at least two vials in storage to avoid loss of cells or genomic instability as a result of continued passaging.
3. It is important to acknowledge that (mature) cardiomyocytes leave the cell cycle and may become multinucleated. Differentiation efficiency may range from 10%–90% depending on the condition of the hiPSCs at the start of differentiation, making it imperative to maintain a cell bank of differentiated lines at key points during the differentiation process (starting Day 7 and after each expansion cycle) to avoid loss of cells and time. Before starting differentiation, make sure cell confluency is at least 80% and check morphology under an inverted microscope (hiPSCs should show distinct sharp lines around the cell borders). Avoid overgrown patches where the centers of the colonies are densely overgrown. In such a case, replate the hiPSCs in smaller aggregates by repeated pipetting of the resuspended colonies. Inspect the size of the aggregates in solution under a microscope.
4. RPMI-1640 + 1× B27 and RPMI-1640 + 1× B27-insulin can be prepared separately and stored at 2–7 °C for up to a month.
5. Cardiomyocytes are able to form a strong extracellular matrix. We found that over longer culturing periods, cardiomyocytes become increasingly more difficult to dissociate. We therefore recommend replating cardiomyocytes every two weeks.
Troubleshooting
Problem 1: hiPSCs do not show the typical morphology after thawing.
Possible cause: hiPSCs are not pluripotent.
Solution: Check pluripotency markers and haplotype cells regularly (every ~20 passages). To remove most of the differentiated cells, passage cells with ReLeSR several times. Differentiated cells adhere strongly to the plastic, while hiPSC will dissociate.
Problem 2: hiPSCs are not differentiating.
Possible cause: hiPSCs are in suboptimal condition for differentiation.
Solution: Start differentiation two weeks after thawing. Avoid confluency over 70% before differentiation. Vary the amount of CHIR-99021 between 4 and 8 μM and the amount of WNT-C95 between 3 and 7 μM. Seed at various densities to determine the optimum for your cells.
Problem 3: hiPSC cardiomyocytes are not contracting.
Possible cause: Incomplete differentiation of hiPSC cardiomyocytes. Other cell types may be present, affecting action potential propagation. Not enough cell–cell contact between hiPSCs and cardiomyocytes.
Solution: Repeat the cardiomyocyte selection (see step E5). Perform cell sorting using JAK2 as a surface marker [5]. Replate the cells so that full confluency is reached. (Electrical) Pacing may improve contractility.
Acknowledgments
This project was funded by the PPP Allowance made available by Health~Holland, Top Sector Life Sciences & Health, to stimulate public-private partnerships (HeartCHIP II, project grant number EMCLSH19005). The data analysis has been described and validated previously [3]. The authors would like to thank Brigitta Laksono for providing images of hiPSC cultures.
Competing interests
There are no competing interests.
Ethical considerations
Transgene-free hiPSCs were generated from skin fibroblasts from a hypertrophic cardiomyopathy patient and from a healthy donor, according to a protocol approved by the institutional Medical Ethics Committee; written informed consent was obtained.
References
- Mummery, C. L., Zhang, J., Ng, E. S., Elliott, D. A., Elefanty, A. G. and Kamp, T. J. (2012). Differentiation of Human Embryonic Stem Cells and Induced Pluripotent Stem Cells to Cardiomyocytes. Circ Res. 111(3): 344–358.
- Maas, R. G., Lee, S., Harakalova, M., Snijders Blok, C. J., Goodyer, W. R., Hjortnaes, J., Doevendans, P. A., Van Laake, L. W., van der Velden, J., Asselbergs, F. W., et al. (2021). Massive expansion and cryopreservation of functional human induced pluripotent stem cell-derived cardiomyocytes. STAR Protoc. 2(1): 100334.
- Snelders, M., Koedijk, I. H., Schirmer, J., Mulleners, O., van Leeuwen, J., de Wagenaar, N. P., Bartulos, O., Voskamp, P., Braam, S., Guttenberg, Z., et al. (2022). Contraction pressure analysis using optical imaging in normal and MYBPC3-mutated hiPSC-derived cardiomyocytes grown on matrices with tunable stiffness. Biomater Biosyst. 8: 100068.
- Paudel, S., Yue, M., Nalamalapu, R. and Saha, M. S. (2024). Deciphering the Calcium Code: A Review of Calcium Activity Analysis Methods Employed to Identify Meaningful Activity in Early Neural Development. Biomolecules. 14(1): 138.
- Liew, L. C., Poh, B. M., An, O., Ho, B. X., Lim, C. Y. Y., Pang, J. K. S., Beh, L. Y., Yang, H. H. and Soh, B. S. (2023). JAK2 as a surface marker for enrichment of human pluripotent stem cells-derived ventricular cardiomyocytes. Stem Cell Res Ther. 14(1): 367.
Article Information
Publication history
Received: Nov 6, 2024
Accepted: Jan 6, 2025
Available online: Feb 13, 2025
Published: Mar 5, 2025
Copyright
© 2025 The Author(s); This is an open access article under the CC BY-NC license (https://creativecommons.org/licenses/by-nc/4.0/).
How to cite
Snelders, M., van der Pluijm, I. and Essers, J. (2025). Differentiation, Maintenance, and Contraction Profiling of Human Induced Pluripotent Stem Cell–Derived Cardiomyocytes. Bio-protocol 15(5): e5222. DOI: 10.21769/BioProtoc.5222.
Category
Stem Cell > Pluripotent stem cell > Cell differentiation
Cell Biology > Cell isolation and culture > Cell differentiation
Do you have any questions about this protocol?
Post your question to gather feedback from the community. We will also invite the authors of this article to respond.