- Protocols

- Articles and Issues
- For Authors
- About
- Become a Reviewer

Real-time IncuCyte® Assay for the Dynamic Assessment of Live and Dead Cells in 2D Cultures
Published: Vol 15, Iss 3, Feb 5, 2025 DOI: 10.21769/BioProtoc.5210 Views: 3466
Reviewed by: Ralph Thomas BoettcherShun Yu Jasemine YangAnonymous reviewer(s)
Original research article
The authors used this protocol in:
Oct 2023
Advertisement


Protocol Collections
Comprehensive collections of detailed, peer-reviewed protocols focusing on specific topics


Related protocols
Abstract
Cell viability and cytotoxicity assays are commonly used to investigate protein function and to evaluate drug efficacy in cancer and other disease models. Cytotoxicity is the measure of dead or damaged cells and is often quantified using assays based on cellular characteristics such as membrane integrity or mitochondrial metabolism. However, these assays are typically limited to endpoint analysis and lack emulation of physiological conditions. The IncuCyte Live and Dead Cell assay described here leverages common cell permeability methodologies but uses fluorescence microscopy channels to image both live and dead cells over time and phase microscopy channels to measure confluency. Cytotox green reagent is a cell membrane–impermeable dye that can only be taken up by cells with poor cell membrane integrity. NucLight rapid red dye is a cell membrane–permeable nuclear dye that can be taken up by all cells. Based on dye uptake and fluorescence intensity, the IncuCyte software can be used to analyze images for live and dead cell detection and quantification. Phase microscopy is used to determine confluency and can be further quantified using the IncuCyte software. We provide an application of this assay, using it to calculate IC50 and EC50 values for the assessment of drug efficacy.
Key features
• Quantify live and dead cells over time.
• Determine drug IC50 and/or EC50 in 2D cell cultures.
• This protocol requires the instrument IncuCyte® S3 (or SX5) Live-Cell Analysis system and corresponding software.
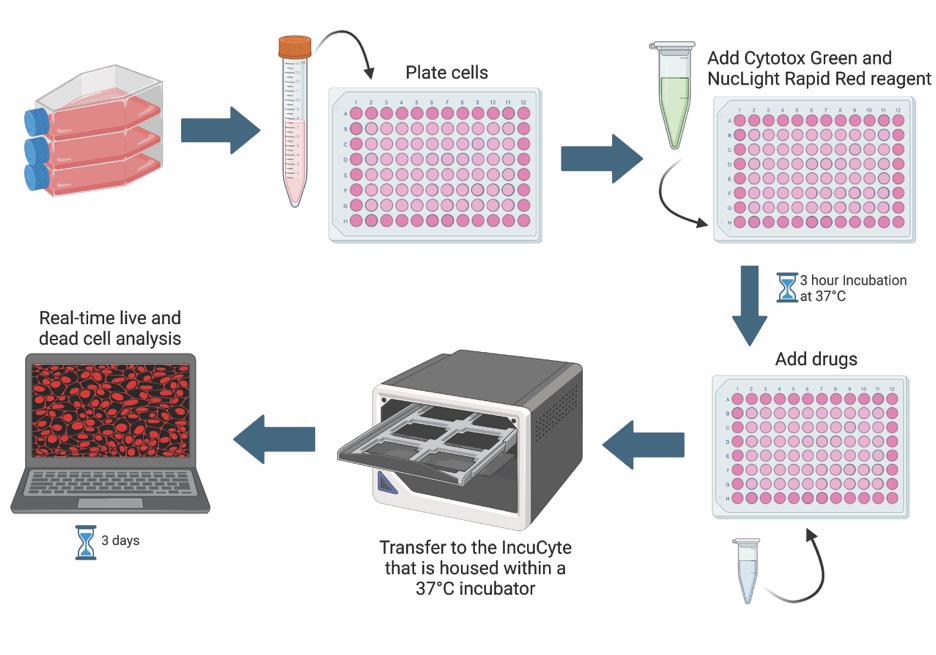
Keywords: IncuCyteGraphical overview
Background
Under normal physiological conditions, many cell types undergo turnover to help maintain a balance between cell death and cell survival. However, in cancer contexts, there is an imbalance that favors cell survival or proliferation over cell death. Cancer cell death is an important area of cancer research, especially in drug discovery [1]. High-throughput, sensitive, and robust assays are necessary for screening, testing, and comparing the effectiveness of candidate drugs [1]. The effectiveness of drugs is commonly measured by the half-maximal inhibitory concentration (IC50) or the half-maximal effective concentration (EC50) [2]. The IC50 is the concentration at which half of the measured response is inhibited, while the EC50 is the concentration at which half of the maximum response is induced [2]. One way of measuring drug effectiveness in cancer models is by determining how well a drug induces cytotoxicity [1]. Cytotoxicity can be evaluated via various indirect measures of cell death including cell permeability (trypan blue dye exclusion assay), metabolism (tetrazolium reduction assay), protease activity, ATP detection, and many more [3,4]. In addition to these assays being indirect measures of cell death, other drawbacks typically include the lack of physiological conditions and restriction to end-point analyses [5]. One way to overcome these limitations is by using the IncuCyte Live and Dead Cell assay.
The IncuCyte Live and Dead Cell assay employs common cell permeability techniques, but in a capacity that allows for real-time and live-cell quantification. Cytotox green reagent is a membrane-impermeable dye that is only able to enter cells with poor membrane integrity, hence serving as a cell death marker. NucLight rapid red dye is a membrane-permeable DNA dye that labels all cell nuclei. Residing in a tissue culture incubator, the IncuCyte® Live-Cell Analysis system can capture images at fixed time intervals, enabling the quantification of dead vs. live cells using the IncuCyte software. Live and dead cell quantification is used to calculate the IC50 and/or EC50. Changes in cell morphology, cell migration, and cell–cell clustering interactions throughout the run can also be quantified.
In this protocol, we describe stepwise how to perform the IncuCyte Live and Dead Cell assay, providing an example of how it can be used to determine the IC50 and EC50 of chloroquine (CQ), a late-stage autophagy inhibitor, in the pancreatic ductal adenocarcinoma cell line, MIA PaCa-2. A modified version of this protocol was used in Sathiyaseelan et al. [6].
Materials and reagents
Biological materials
1. MIA Paca-2 cells (ATCC, catalog number: CRL-1740)
Reagents
1. Dulbecco’s modified Eagle medium (DMEM) (Thermo Fisher Scientific, Gibco, catalog number: 11995-065)
2. Fetal bovine serum (FBS) (Thermo Fisher Scientific, Gibco, catalog number: 12483-020)
3. HEPES (Thermo Fisher Scientific, Gibco, catalog number: 15630-080)
4. Insulin solution from bovine pancreas (Sigma-Aldrich, catalog number: 10516)
5. MEM non-essential amino acids (NEAA) (Thermo Fisher Scientific, Gibco, catalog number: 11140-050)
6. 0.25% Trypsin-EDTA phenol red (Thermo Fisher Scientific, Gibco, catalog number: 25200056)
7. PBS, pH 7.4 (Thermo Fisher Scientific, Gibco, catalog number: 10010-049)
8. EVETM slides and 0.4% trypan blue solution (NanoEnTek, catalog number: EVS-050)
9. Chloroquine diphosphate (Sigma-Aldrich, catalog number: C6628-25G)
10. Staurosporine (Sigma-Aldrich, catalog number: S6942)
11. IncuCyteTM NucLight rapid red dye for live-cell nuclear labeling (Sartorius, catalog number: 4717)
12. IncuCyteTM Cytotox green reagent for counting dead cells (Sartorius, catalog number: 4633)
Solutions
1. Full media (see Recipes)
2. Chloroquine (CQ) stock solution (see Recipes)
Recipes
1. Full media (500 mL)
Note: Store the media for up to 2–3 weeks at 4 °C. Warm to 37 °C before using.
| Reagent | Stock concentration | Final concentration | Quantity or Volume |
|---|---|---|---|
| DMEM | n/a | n/a | 439.75 mL |
| FBS | 100% | 10% | 50 mL |
| NEAA | 100× | 1× | 5 mL |
| HEPES | 1 M | 10 mM | 5 mL |
| Insulin | 10 mg/mL | 5 μg/mL | 250 μL |
2. Chloroquine (CQ) stock solution (1.9 mL)
Note: The stock is 100 mM and is stable for at least 1 year at -20 °C. For experiments, dilute to 2 mM (5 µL of 100 mM stock + 245 µL media) in full media and make further dilutions accordingly in full media.
| Reagent | Final concentration | Quantity or Volume |
|---|---|---|
| Chloroquine diphosphate (MW: 515.86) | 100 mM | 0.1 g |
| 1× PBS | n/a | 1.9 mL |
Laboratory supplies
1. T75 or T25 flasks (VWR, catalog number: BD353136 or 29185-300)
2. 70% ethanol (HealthCare Plus, catalog number: NPN 00825751)
3. 96-well tissue culture plates (Corning, Falcon, catalog number: 353072)
4. Sterile 15 mL tubes (Corning, Falcon, catalog number: 352096)
5. 10 mL pipette (Corning, catalog number: 4488) and pipet-aid (or aspirator)
6. 5.0 mL screw cap MacroTubes (MTC Bio Incorporated, catalog number: C2540)
7. Syringes for DISTRIMAN Mini ST 1,250 μL (Gilson, catalog number: F164140)
Equipment
1. DISTRIMAN repetitive pipette (Gilson, model: F164001)
2. EVE automatic cell counter (NanoEnTek, catalog number: EVE-MC)
3. Autoflow IR Direct Heat CO2 incubator (NuAire, model: NU-5510E)
4. IncuCyte S3 live-cell analysis system (Sartorius, IncuCyte S3)
5. Tissue culture hood (Microzone Corporation, model: BK-2-4)
6. Vortex Genie 2 (Scientific Industries, model: SI-0236)
Software and datasets
1. IncuCyte software 2022B (IncuCyte, 2022)
2. Excel 2016 (Microsoft, 09/22/2015); requires license
3. Prism v10.2.3 (GraphPad, 04/21/2024); requires license
4. BioRender (https://www.biorender.com/). The following figures were created using BioRender: Graphical overview: BioRender.com/c77h076
Procedure
A. Cell culturing
1. Grow MIA Paca-2 cells in full media in T75 (or T25) flasks in a humidified incubator at 37 °C with 5% CO2 until they reach 80%–90% confluency. For the MIA Paca-2 cell line, we typically split cells at a ratio of 1:3 when they reach 80%–90% confluency, which takes 3–4 days.
2. Sterilize the tissue culture hood with 70% ethanol. Spray down the container with tubes, pipettors, tips, and media bottle with 70% ethanol and place them in the hood for 20 min. Bring MIA Paca-2 cells inside the hood.
3. Remove media with an aspirator or a 10 mL pipette and wash cells three times with 6 mL of 1× PBS. Add 1 mL of 0.25% trypsin-EDTA per T75 flask (500 μL per T25). Incubate flasks at 37 °C in the incubator for 2–3 min until the cells completely detach.
4. Tap the flask to dislodge cells completely and prepare cell suspension in the tissue culture hood. Add 6–8 mL full media as required and pipette cells 5–10× with a 10 mL pipettor to resuspend cells. Transfer cell suspension to a 15 mL Falcon tube.
5. Gently vortex cells at a low speed and take cell counts with a hemocytometer or a cell counter using a cell viability dye like trypan blue as per the manufacturer’s instructions.
Note: Vortexing may not apply to all cell lines.
6. In a 15 mL Falcon tube (or 50 mL as required), make 10–15 mL of 5 × 10⁴ cells/mL (50 cells/μL) suspension in the full media. Plate 100 μL of 50 cells/μL with a repeater pipettor in each well of a 96-well plate.
Note 1: We pipette 2× 50 µL per well (not 1× 100 µL), which gives a more equal distribution of cells per well.
Note 2: Cell numbers should be empirically determined for each cell line based on proliferation rates and the total duration of the experiment. Initial well confluency of 30% is recommended by Sartorius for cytotoxicity assays. Avoid high seeding densities because contact inhibition slows cell growth and makes it difficult to distinguish cells using imaging analysis.
7. Dilute NucLight rapid red dye (1:500 final well dilution) and Cytotox green reagent (250 nM final well concentration) together in full media and dispense 50 μL per well (at this point, the total well volume should be 150 μL). The final dilutions or concentrations should be calculated based on the final well volume of 200 μL.
Note 1: The concentrations of NucLight red and Cytotox green dyes, added together in a volume of 50 µL, should be calculated based on a final well volume of 200 µL. The same applies for the drug (step A8).
Note 2: Dyes can also be added after the cells adhere, but care should be taken not to disturb the cells. The dyes are nontoxic and incorporate readily into DNA; they typically remain detectable for 72 h or more, but dye retention is cell line dependent.
Note 3: According to Sartorius, cells are labeled immediately upon the addition of NucLight red.
8. Incubate plates at 37 °C in the incubator for 2–3 h until cells adhere. Meanwhile, prepare the drug for treatment (e.g., chloroquine) at required concentrations. Refer to Recipe 2 for preparing chloroquine stocks and further dilutions in full media. Add 50 μL of drug volume to the respective wells taking care not to disturb the cells (at this point, the total well volume should be 200 μL). Place the 96-well plate lid back on the plate and gently tap the plate to mix the reagents well.
B. Setting up IncuCyte protocol
1. Place the 96-well plate into the IncuCyte S3 instrument located in a humidified incubator at 37 °C with 5% CO2.
2. Let the plate sit in the IncuCyte for at least 30 min before starting the program to allow adjustment to the incubator temperature. Scans can be taken at any desired time interval. We generally record 4–5 images (recording 3 images also works well and saves scan time) per well every 4 h (or 2 h as required) at 10× objective to monitor cell proliferation and cell death for up to 72 h. Include negative (e.g., untreated or vehicle) and positive (e.g., staurosporine for cell death [7]) controls. Full media was the vehicle control used in our experiments. In 96-well plates, we exclude the outer wells from the experiment and fill them with media to avoid evaporation effects. We typically have three technical replicates per treatment.
3. Follow the steps as indicated in Figure 1 to start the run for IncuCyte S3 (or follow instructions for the other models or instruments as per the manufacturer’s instructions). We use default settings for acquisition times for 10× objective scans. We prefer to create a plate map for our runs (Figure 2) using the IncuCyte plate map editor software, but it is not necessary.
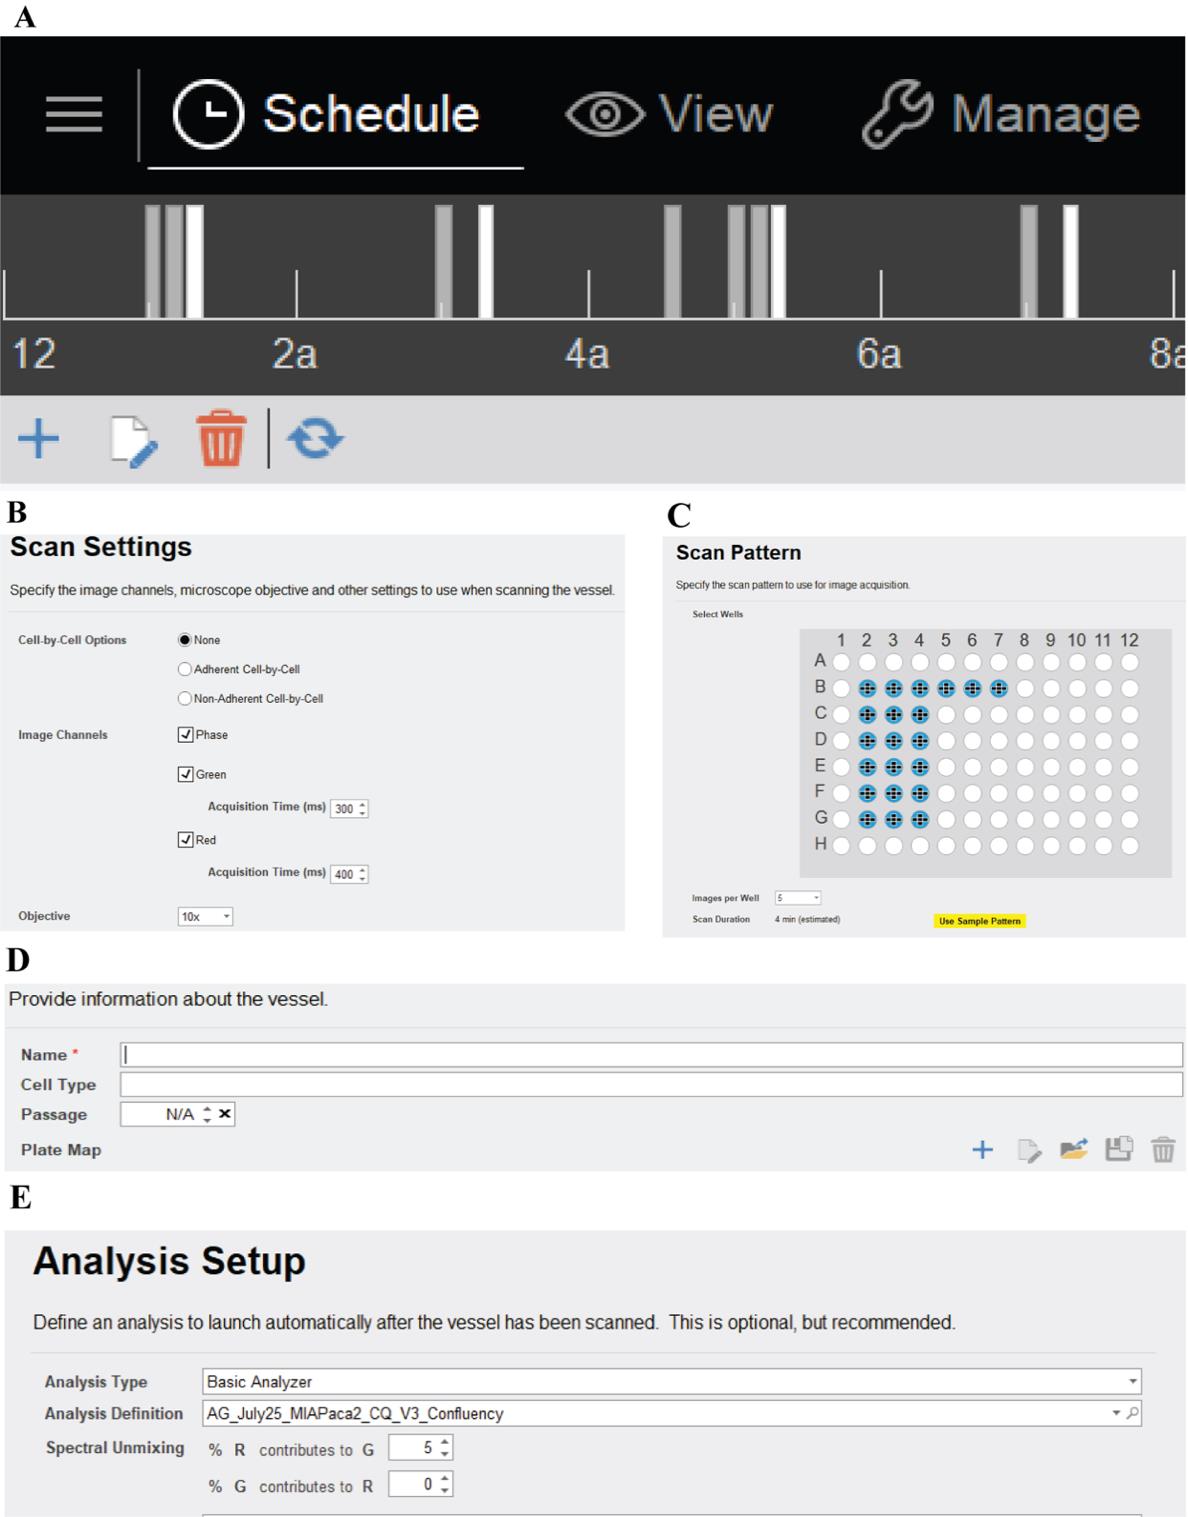
Figure 1. Key steps to start a run. A. Click on the “plus” sign to schedule your run. B. Select scan settings including image channels and objective. C. Select wells to scan and the number of images per well. D. Name run and provide plate map (this can be added after the run is complete). E. Define an analysis and spectral unmixing (this can also be done after the run ends).
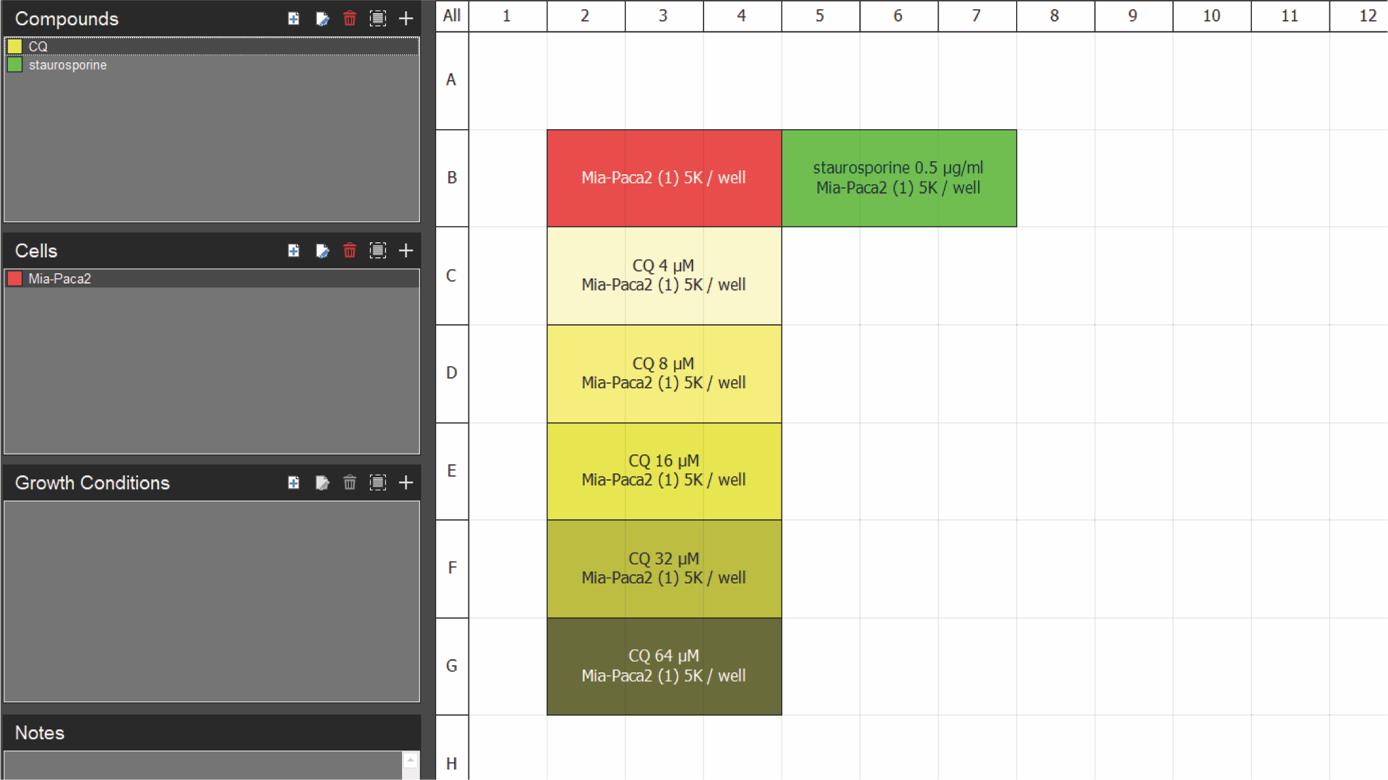
Figure 2. Example IncuCyte plate map. The map depicts well location of MIA Paca-2 cells untreated (red) or treated with chloroquine (CQ; yellow; increasing shade corresponds to increasing drug concentration) or staurosporine (green). Three replicate wells were used for each condition. Creating a plate map facilitates data analysis as the software recognizes the identity of each well and labels the data correspondingly. Compounds, cells, and growth conditions can be added to the plate map description on the left.
Data analysis
A. Creating an analysis definition
1. For data analysis, we use the integrated algorithms of the IncuCyte software S3 (for details, refer to the User Manual available in the top left corner under the Help tab) to calculate NucLight red–positive (red fluorescence, total cells) and Cytotox green–positive (green fluorescence, dead cells) cells. Representative IncuCyte images for each treatment condition after 72 h are shown in Figure 3.
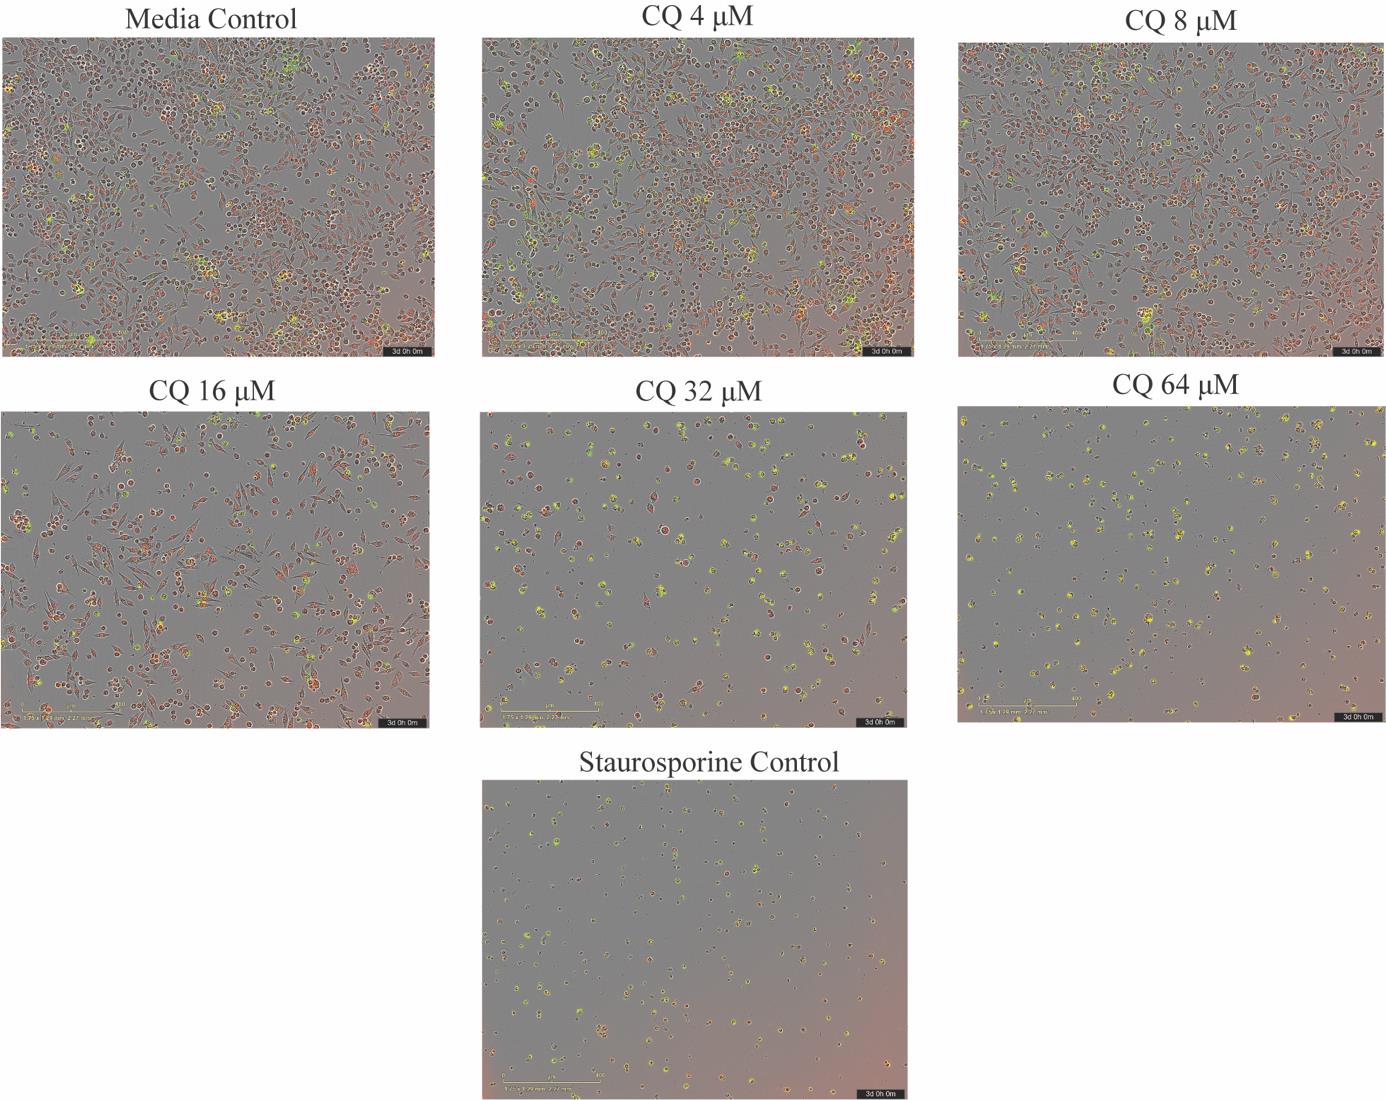
Figure 3. IncuCyte images. IncuCyte images showing NucLight red–positive and Cytotox green–positive cells taken after 72 h of run time at 10× objective, treated with 0.0005 mg/mL of staurosporine and varying concentrations of chloroquine (CQ). Staurosporine is the positive control, and full media is the negative control.
2. We use a basic analyzer for this assay and take images with phase (optional), red and green channels, and include overlap (green and red channel). Spectral unmixing was set at 5%–8% red removed from green to better represent the distribution of both green and red channels. Sartorius recommends 2%–8% red removed from green. The value is incrementally adjusted until the red fluorophore signal is not detected in the green channel. An example analysis window can be seen in Figure 4A. For MIA PaCa-2 cells, the red, green, and overlap counts were set as follows:
Red object count (total nuclei) parameters: Top-hat segmentation with 100 μm radius and 1 threshold; edge split on with edge sensitivity set to -30 (Figure 4B).
Green object count parameters: Top-hat segmentation with 100 μm radius and 2 threshold; edge split on and edge sensitivity set to -30. Adjust size set to -3. Dead cells were defined as double-positive red+/green+ objects and were identified by their overlap (overlap area min 50 mm2) (Figure 4C). These settings were optimized on a representative set of images.
Note: The settings should be adjusted for each adherent cell type. The User Manual describes the setting parameters in detail. Once settings for a particular cell line have been defined, the same settings should be used in all subsequent experiments for that cell line.
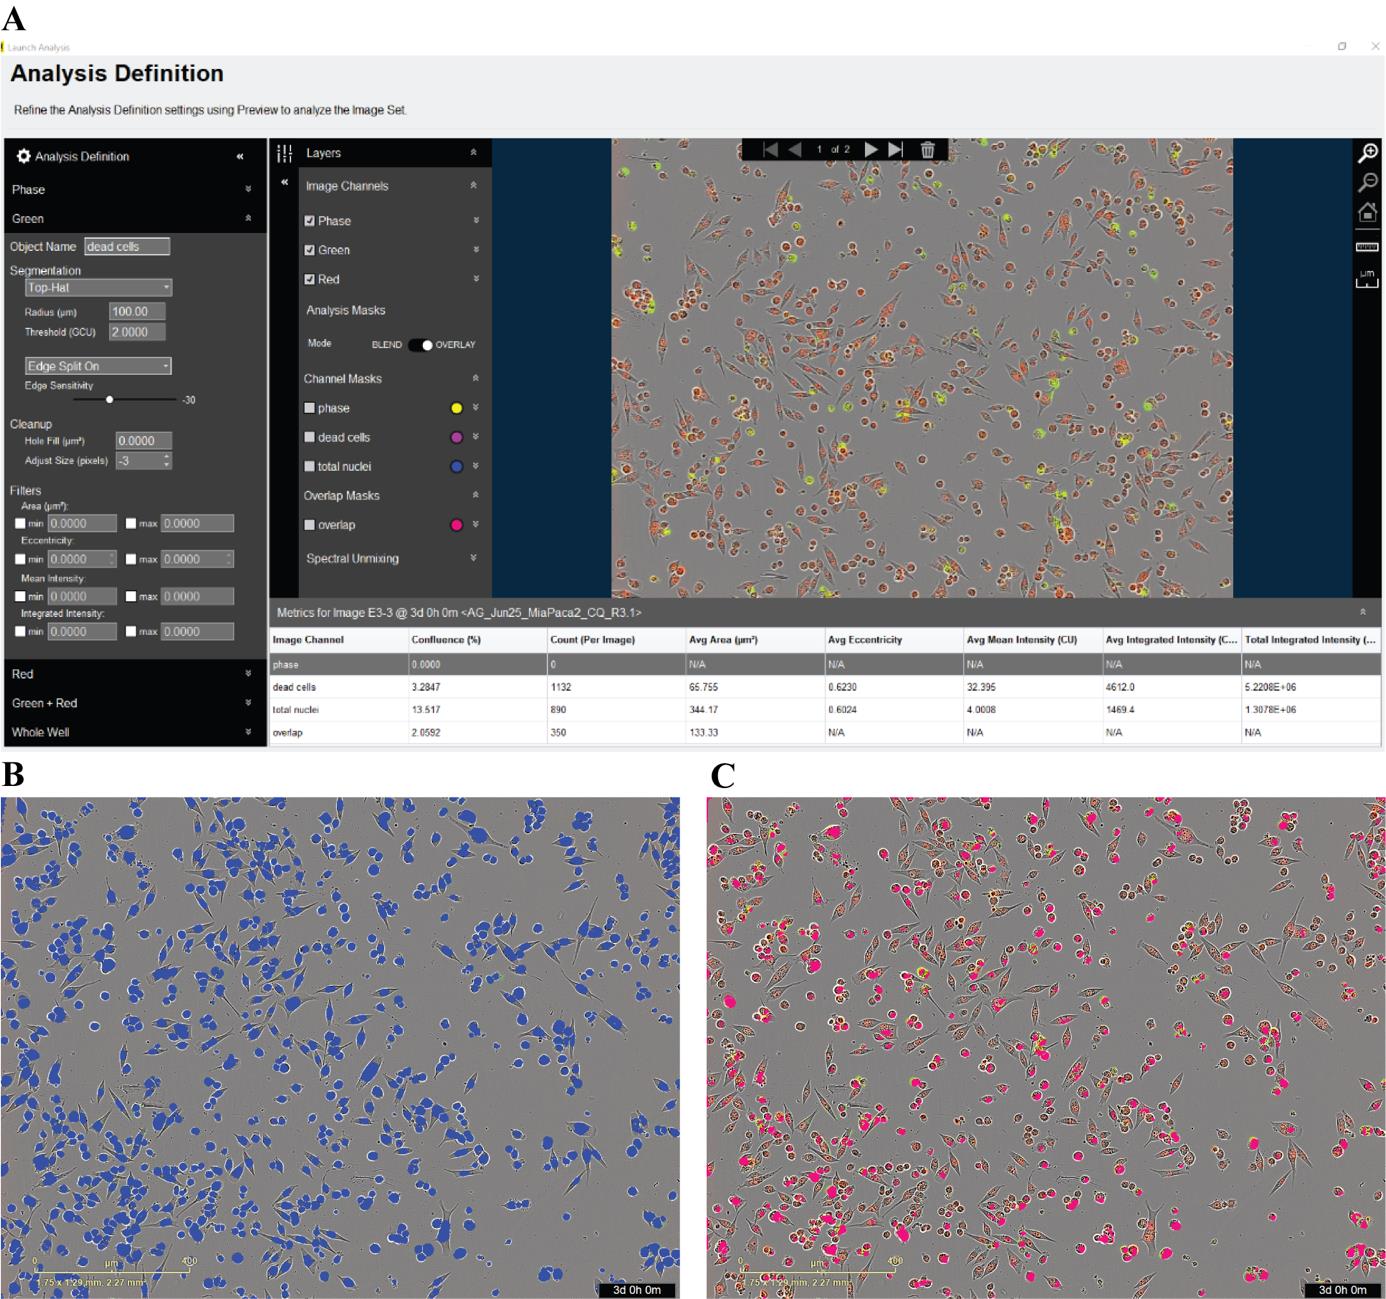
Figure 4. Defining an analysis. A. An example of an IncuCyte analysis window. Settings can be adjusted and previewed to determine the appropriate capture of confluency, red, green, and overlap masks. B. Mask for red object count (total cells). C. Overlap mask of red and green object counts (dead cells).
3. The red fluorescence, green fluorescence, and overlap counts are exported for further analysis.
B. Live and dead cell time-lapse analysis using Microsoft Excel
1. Using Excel, determine relative total cell (red cells relative to the 0 h time point, the time of treatment initiation), relative confluency (relative to the 0 h time point), and relative dead cell [yellow (green+red) cells relative to total cells] kinetics for up to 72 h. Live cell kinetics can be determined by subtracting dead cells (yellow cells) from total cells (red cells). Refer to Table 1 for further details.
Note: Relative cell death is more informative than just dead cell number since total cells also change over time.
Table 1. Description and formulas for calculating relative total cells, relative dead cells, relative live cells, and relative confluency
| Parameter | Description/Formula |
|---|---|
| Relative total cells | Red cells per mm2 normalized to 0 h time point |
| Relative dead cells | Yellow (red and green overlay count) cells per mm2 divided by red cells per mm2 |
| Relative live cells | Red cells per mm2 minus yellow cells per mm2 normalized to 0 h time point |
| Relative confluency | Confluency (area of vessel covered in cells) normalized to 0 h time point |
*Note: If presenting data as percentages, then values should be multiplied by 100.
2. Using GraphPad Prism software, graph relative total cells for each treatment concentration (Figure 5A). Repeat this for dead cells (Figure 5B), live cells (Figure 5C), and confluency (Figure 5D).
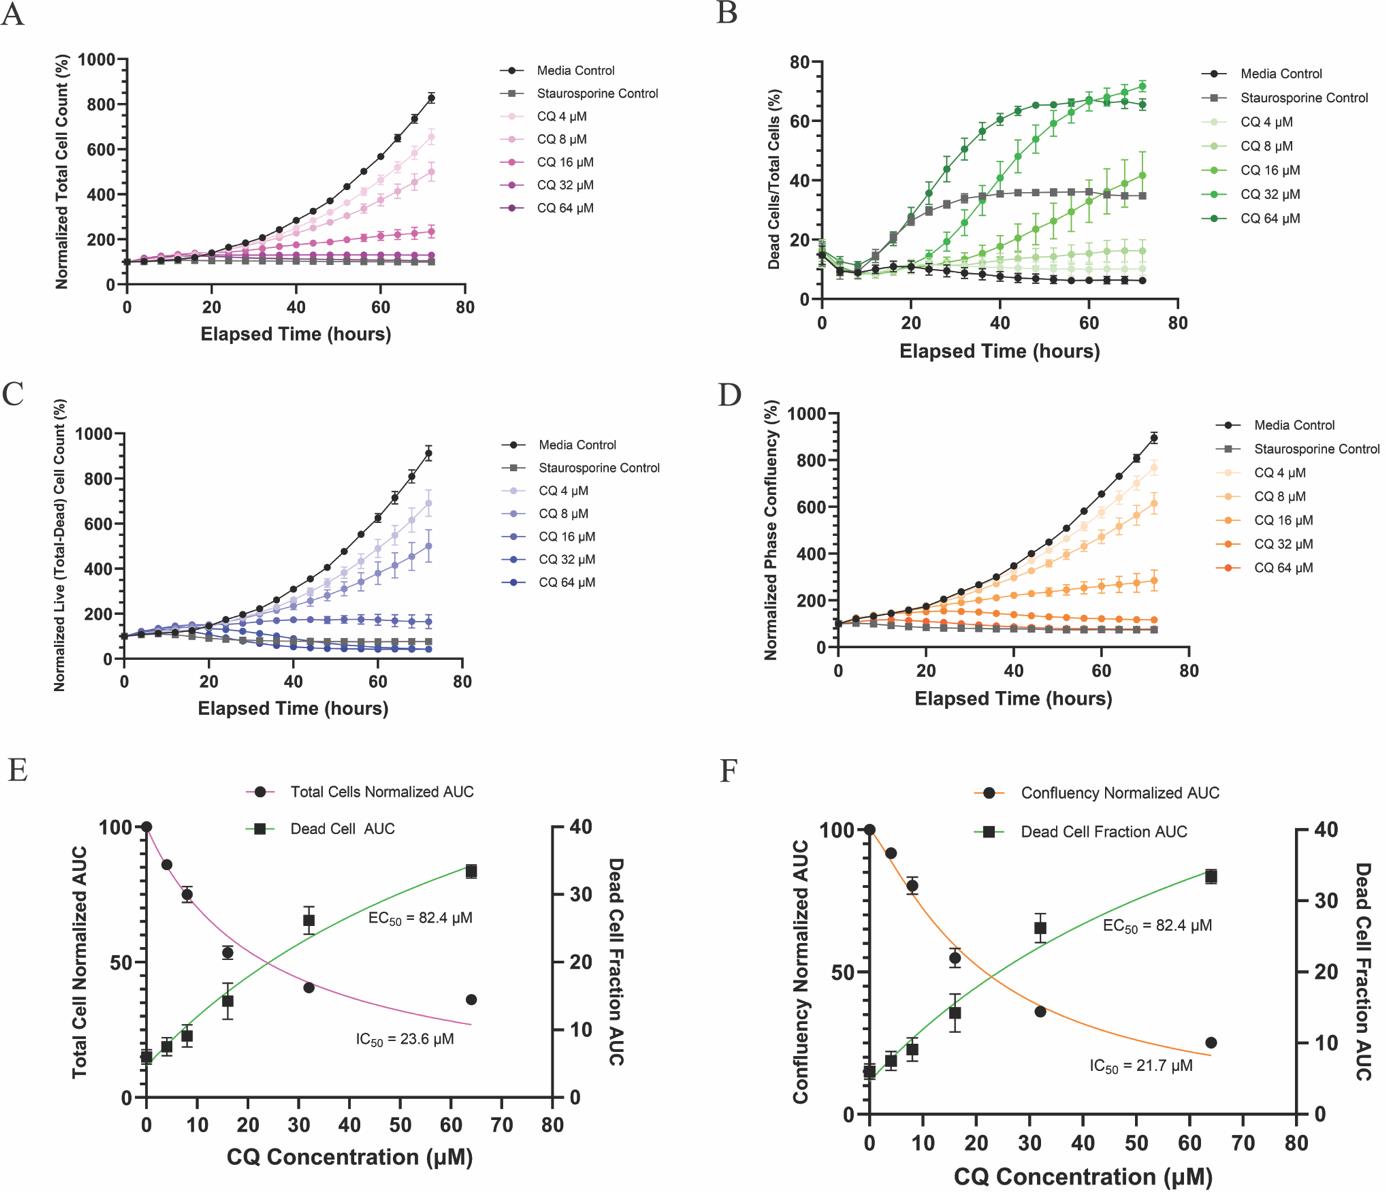
Figure 5. Graphing data and determining IC50/EC50. MIA Paca-2 cells were treated with increasing concentrations of chloroquine (CQ) for 72 h. Errors bars represent SEM. A. Total cell count normalized to the first time point. B. Dead cells relative to total cell fraction (dead/total cells). C. Live (total-dead) cell count normalized to the first time point. D. Phase confluency (determined by phase contrast microscopy channel images) normalized to the first time point. E. IC50 and EC50 of chloroquine based on total cell–normalized AUC and dead cell AUC. For the IC50, curve [Inhibitor] vs. normalized response was used for curve fitting on GraphPad. For the EC50 curve, [Agonist] vs. response (three parameters) was used for curve fitting. F. IC50 and EC50 based on confluency-normalized AUC and dead cell–AUC, respectively. For IC50, [Inhibitor] vs. normalized response–variable slope was used.
C. GraphPad Prism analysis
1. Next, using total and dead cell kinetics, determine IC50 and EC50 values. In GraphPad Prism (v10.2.3), under Analysis, click on Analyze and choose Area under curve (AUC).
2. Export treatment concentrations and AUCs for each treatment from both total and dead cell analyses to a new XY table, respectively. Just as before, under Analysis, click on Analyze, but this time choose Nonlinear regression. To determine IC50 values, use total cell data: choose dose-response-inhibition followed by [inhibitor] vs. normalized response to “curve-fit” (Figure 5E). (Note: We used normalized AUC and did not use logarithmic values of treatment concentrations because our drug concentration range was relatively small.) Curve-fitting should be chosen according to the data used and depends on the slope of the curve and whether the data is normalized and/or logarithmic. Please see Help in GraphPad software for details. This analysis was also repeated with confluency AUC data and [Inhibitor] vs. normalized response, in which the variable slope was used to curve fit (Figure 5F).
Note: The IC50 values determined by relative total cell and relative confluency are comparable.
3. Likewise, use dead cell AUCs for each treatment and determine EC50 values: use dose-response stimulation followed by [Agonist] vs. response (three parameters) to curve-fit (Figure 5E, F). The choice for curve-fit depends on the response data and the type of data (i.e., logarithmic, normalized, etc.) you use, as indicated above.
Validation of protocol
This protocol or parts of it has been used and validated in the following research article:
• Sathiyaseelan et al. [6]. Loss of ATG4B and ATG4A results in two-stage cell cycle defects in pancreatic ductal adenocarcinoma cells. Journal of Cell Science (Figure 8, panel H).]
General notes and troubleshooting
General notes
This 2-color live and dead cell assay provides a multiplex way to analyze the viability and cytotoxicity effects of various treatments from the same well. Live and dead cell data from the same wells can be analyzed to compare IC50 and EC50 values (Figure 5E, F), providing insight into both the viability and cytotoxicity effects of the drug treatment. An advantage of the 2-color live and dead cell assay compared to the confluency assay is that it directly quantitates all cells and distinguishes between those live and dead. The confluency assay includes dead cells that are still attached to the plate (but does not identify them as dead) and thus can overestimate viability in such instances. Similar live and dead cell assays can be performed using alternate dead cell dyes available. For example, instead of Cytotox green dye, a caspase-3/7 green dye can be used to measure apoptotic cells.
Troubleshooting
Problem 1: Some cells do not take up NucLight red or efflux NucLight red within the experimental timeframe.
Solution(s): In these cases, confluency can be used to estimate total cells and determine IC50 values. Alternatively, cells stably expressing nuclear markers [histone B2 (H2B)-mCherry, IncuCyte® NucLight lentivirus system] can be used for total or live cell counts.
Problem 2: Air bubbles in the sample wells can cause images to be distorted.
Solution(s): Use a squeeze bottle with 70% ethanol with the straw removed to pass air above the wells and pop the air bubbles.
Problem 3: Dyes can clump together and create background signals that interfere with analysis.
Solution(s): Make sure to resuspend dyes thoroughly before adding them to wells.
Acknowledgments
We thank J. Chan and G. Samarasekera for valuable comments and feedback. This work was supported by the Canadian Institutes of Health Research (PJT-159536) and the Canadian Cancer Society (grant #707495). This protocol was adapted from the methods section of the study by Sathiyaseelan et al. [6].
Competing interests
The authors declare they have no conflict of interest.
References
- Ediriweera, M. K., Tennekoon, K. H. and Samarakoon, S. R. (2019). In vitro assays and techniques utilized in anticancer drug discovery. J Appl Toxicol. 39(1): 38–71.
- Caldwell, G. W., Yan, Z., Lang, W. and A. Masucci, J. (2012). The IC50 Concept Revisited. Curr Top Med Chem. 12(11): 1282–1290.
- Adan, A., Kiraz, Y. and Baran, Y. (2016). Cell Proliferation and Cytotoxicity Assays. Current Pharm Biotechnol. 17(14): 1213–1221.
- Khalef, L., Lydia, R., Filicia, K. and Moussa, B. (2024). Cell viability and cytotoxicity assays: Biochemical elements and cellular compartments. Cell Biochem Funct. 42(3): e4007.
- Kamiloglu, S., Sari, G., Ozdal, T. and Capanoglu, E. (2020). Guidelines for cell viability assays. Food Front. 1(3): 332–349.
- Sathiyaseelan, P., Chittaranjan, S., Kalloger, S. E., Chan, J., Go, N. E., Jardon, M. A., Ho, C. J., Hui, T., Xu, J., Chow, C., et al. (2023). Loss of ATG4B and ATG4A results in two-stage cell cycle defects in pancreatic ductal adenocarcinoma cells. J Cell Sci. 136(19): e260644.
- Su, X., Wang, J., Jiang, L., Chen, Y., Lu, T., Mendonca, M. S. and Huang, X. (2021). PCNA inhibition enhances the cytotoxicity of β-lapachone in NQO1-Positive cancer cells by augmentation of oxidative stress-induced DNA damage. Cancer Lett. 519: 304–314.
Article Information
Publication history
Received: Aug 30, 2024
Accepted: Dec 30, 2024
Available online: Jan 19, 2025
Published: Feb 5, 2025
Copyright
© 2025 The Author(s); This is an open access article under the CC BY-NC license (https://creativecommons.org/licenses/by-nc/4.0/).
How to cite
Gidda, A. K., Chittaranjan, S. and Gorski, S. M. (2025). Real-time IncuCyte® Assay for the Dynamic Assessment of Live and Dead Cells in 2D Cultures. Bio-protocol 15(3): e5210. DOI: 10.21769/BioProtoc.5210.
Category
Cancer Biology > Cell death > Cell biology assays > Cell viability
Cell Biology > Cell viability > Cell death
Cell Biology > Cell-based analysis
Do you have any questions about this protocol?
Post your question to gather feedback from the community. We will also invite the authors of this article to respond.