- Protocols

- Articles and Issues
- For Authors
- About
- Become a Reviewer

Cell-Sonar, an Easy and Low-cost Method to Track a Target Protein by Expression Changes of Specific Protein Markers
Published: Vol 15, Iss 3, Feb 5, 2025 DOI: 10.21769/BioProtoc.5206 Views: 1839
Reviewed by: Alessandro DidonnaXin XuAnonymous reviewer(s)
Original research article
The authors used this protocol in:

Aug 2024
Advertisement


Protocol Collections
Comprehensive collections of detailed, peer-reviewed protocols focusing on specific topics


Related protocols
Abstract
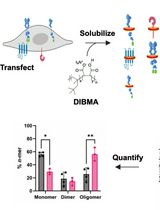
Different research methods aim to clarify the intracellular trafficking of target proteins or unknown pathways. Currently, existing methods are mostly complex and expensive, requiring expert knowledge. Detailed microscopy for protein co-localization detection or omic technologies, which provide holistic network data, are elaborate, mostly complex, and expensive to apply. Our protocol illustrates a method to track a target protein by detecting expression changes of user-selected marker proteins that directly or indirectly interact with the target. Modulation of protein expression indicates interactions between the target and marker protein. Even without co-localization analysis, the results of the protein expression change are the first insights into the target's fate. Moreover, the use of the cell-sonar is straightforward and affordable, and the results are rapidly available. Furthermore, this method could also be used to determine if and how pathways are affected by compounds added to the cells. In conclusion, our method is adaptable to a wide range of proteins, easy to apply, inexpensive, and expandable with substances that affect proteins.
Key features
• Easy-to-implement method to track intracellular proteins.
• Marker protein expression change demonstrates protein interaction.
• Combined data of all marker proteins is used to give an indirect overview of protein localization.
• This method is also applicable to different compounds and thus provides information about protein induction or influence on pathways.
Keywords: Protein expression changesGraphical overview
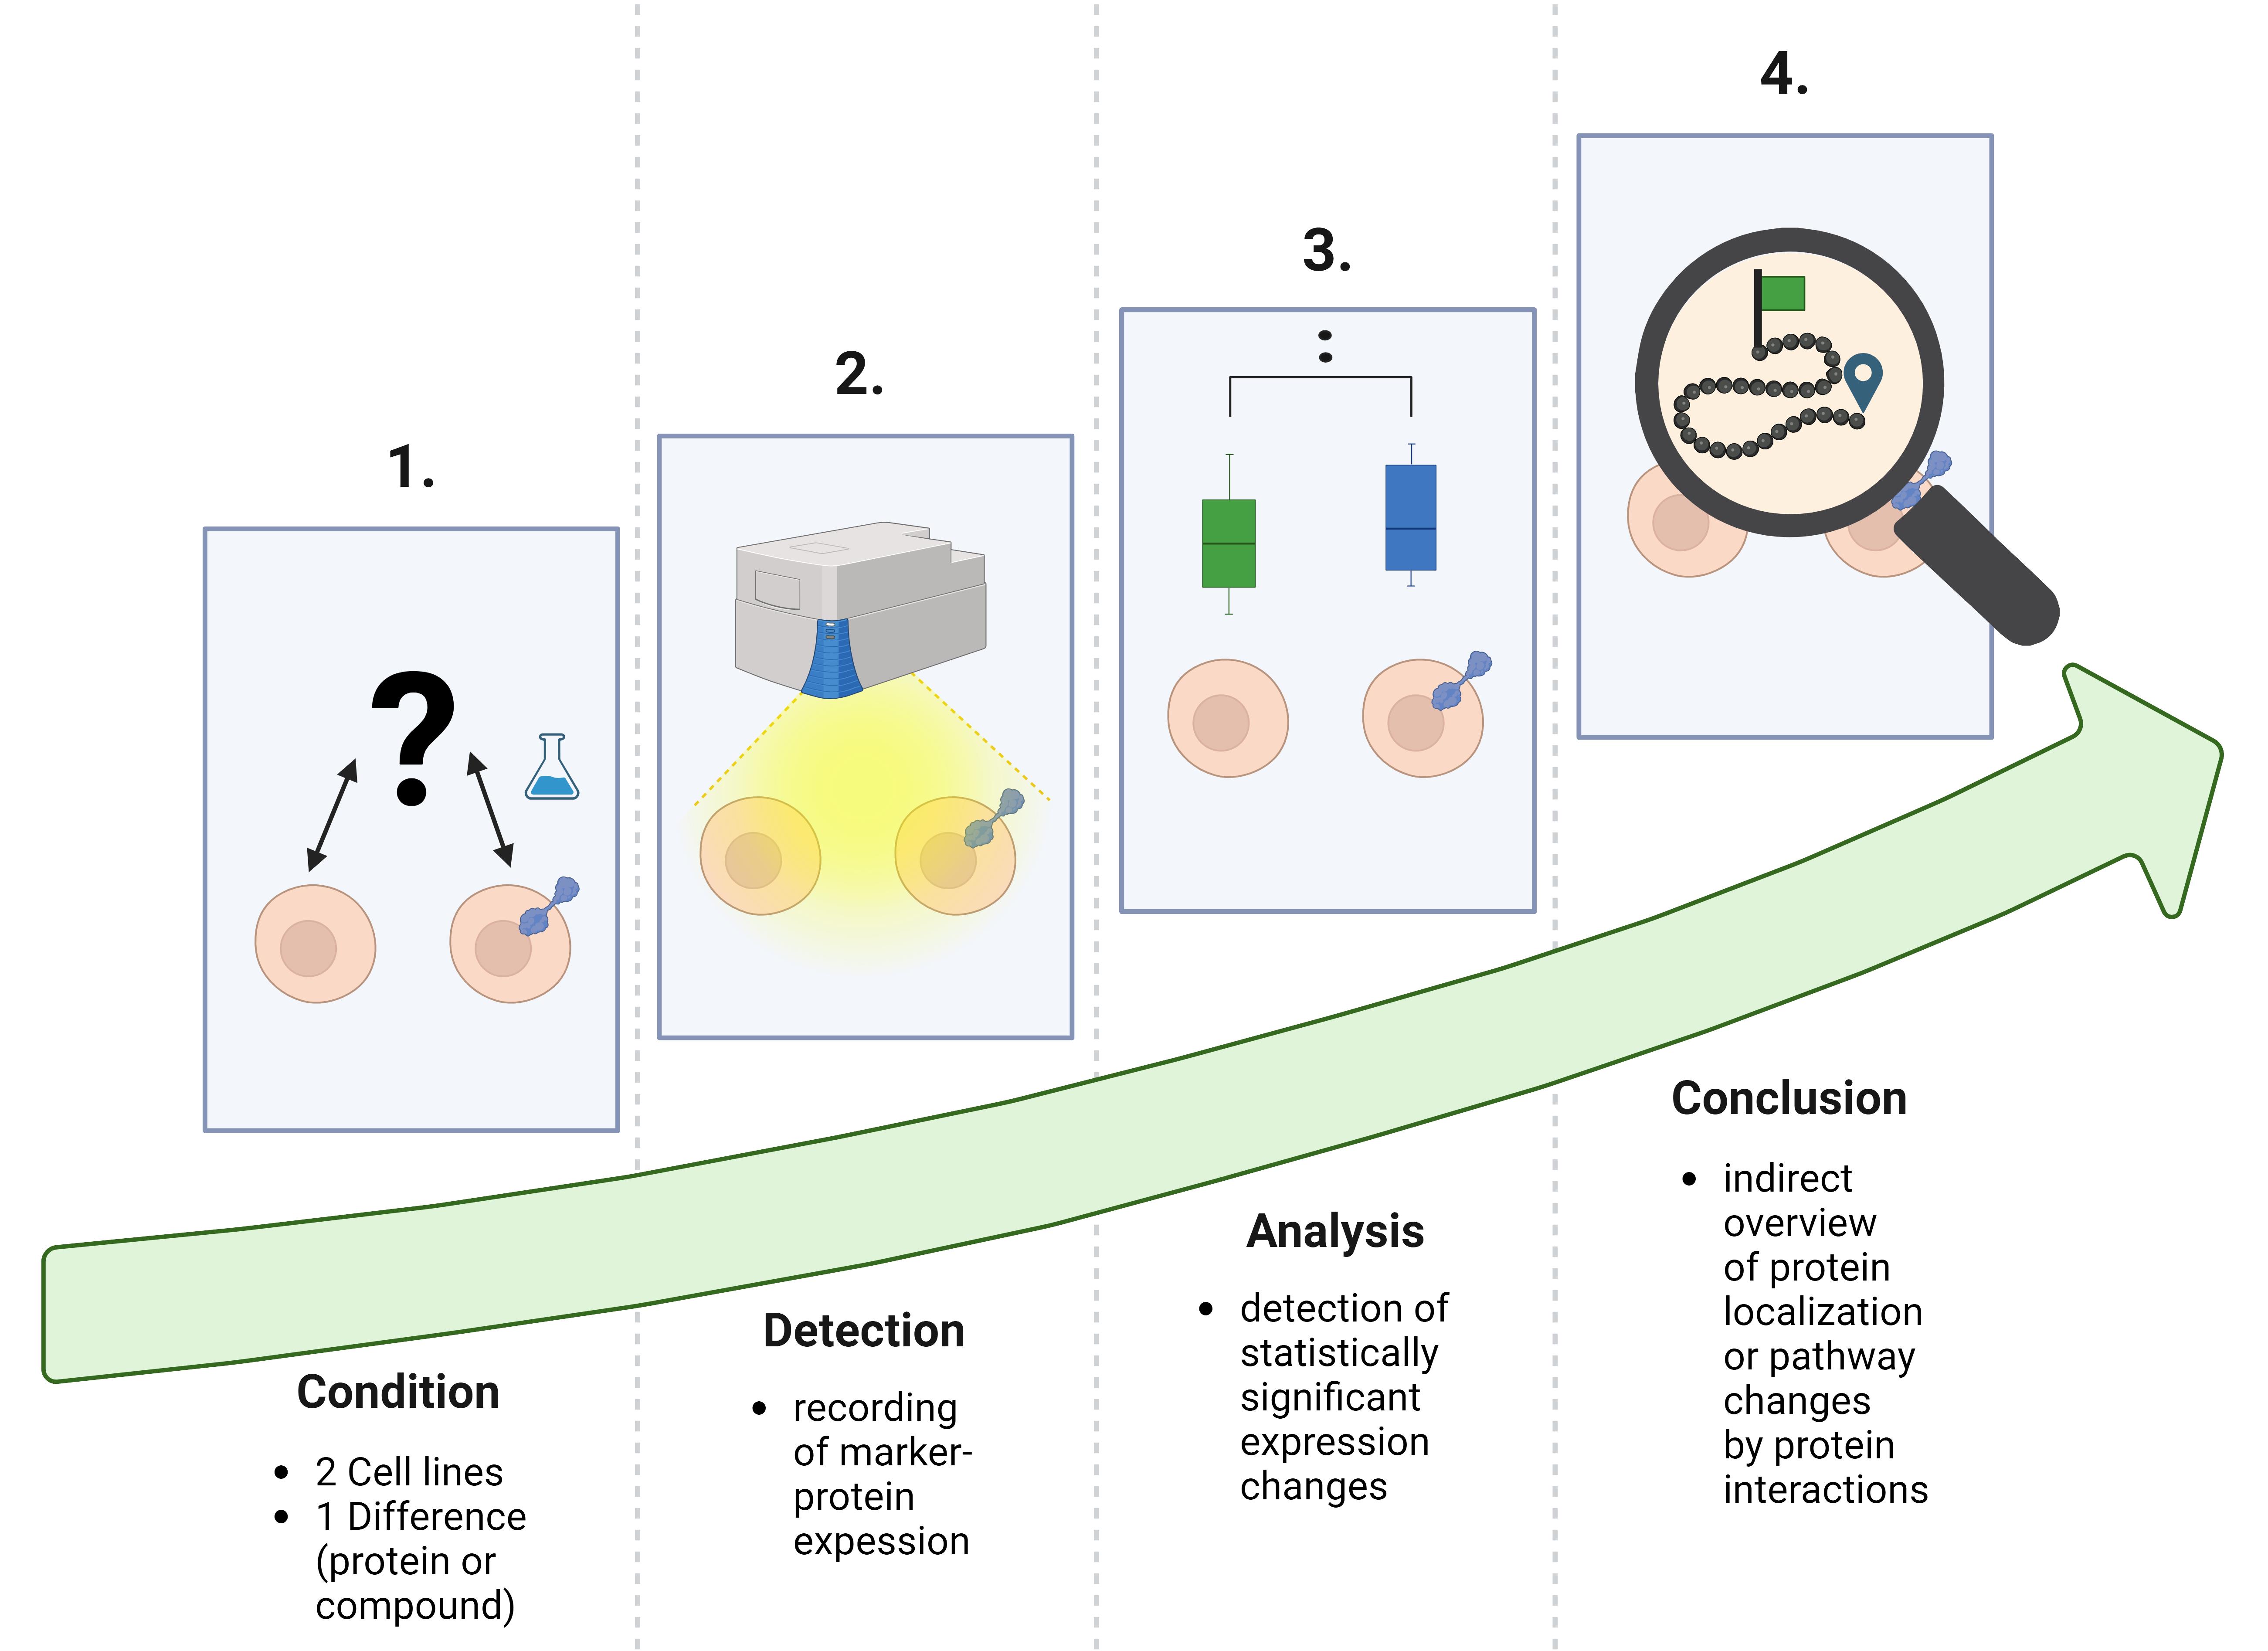
Workflow of cell-sonar
Background
Cell-sonar is an easy-to-implement method that allows indirect intracellular tracking of target proteins. The elucidation of secretory pathways has long been the primary objective of most research fields. Available methods for this are diverse microscopy techniques [1–4] or “omic” screenings [5]. These specific procedures result in high-definition data but, in almost all applications, they are complex, complicated, expensive, and elaborate. Our illustrated protocol is an alternative to these existing techniques, with the difference that cell-sonar is inexpensive, simple, and quick to apply. The results provide a first insight into protein localization.
The cell-sonar concept works universally for any application due to the principle of proteostasis, which regulates the protein balance in cells [6]. Several evolutionarily conserved signaling cascades for protein expression are controlled by proteostasis [6–8]. These protein networks are organized via signaling by recognition of stress responses and the maintenance of cellular proteins [7–9]. Internally, the endoplasmic reticulum (ER) controls the unfolded protein response (UPR) to each protein change [7] during its biosynthesis by regulating the ER capacity of nascent protein levels [7]. Signaling to the nucleus for the expression of required proteins is also orchestrated by UPR [10–12]. The signaling network located outside the ER is controlled by the mitogen-activated protein kinase (MAPK), and they interact in a synergistic manner [7]. The recognition of intracellular stress by MAPK-induced nucleus signaling is essential for gene expression [13]. This ability to dynamically detect changes, such as transgenic protein insertion or compound exposure, allows the detection of induced cellular protein expression. Exposure to a compound or expression of a transgenic target protein serves as an initiator of a stress response. Comparison of two cell lines that differ only in compound exposure or protein expression allows the detection of expression changes of interacting proteins, as shown in Figure 1. Altered intracellular protein levels provide a tracking indicator to observe secretory or other pathways of interest.
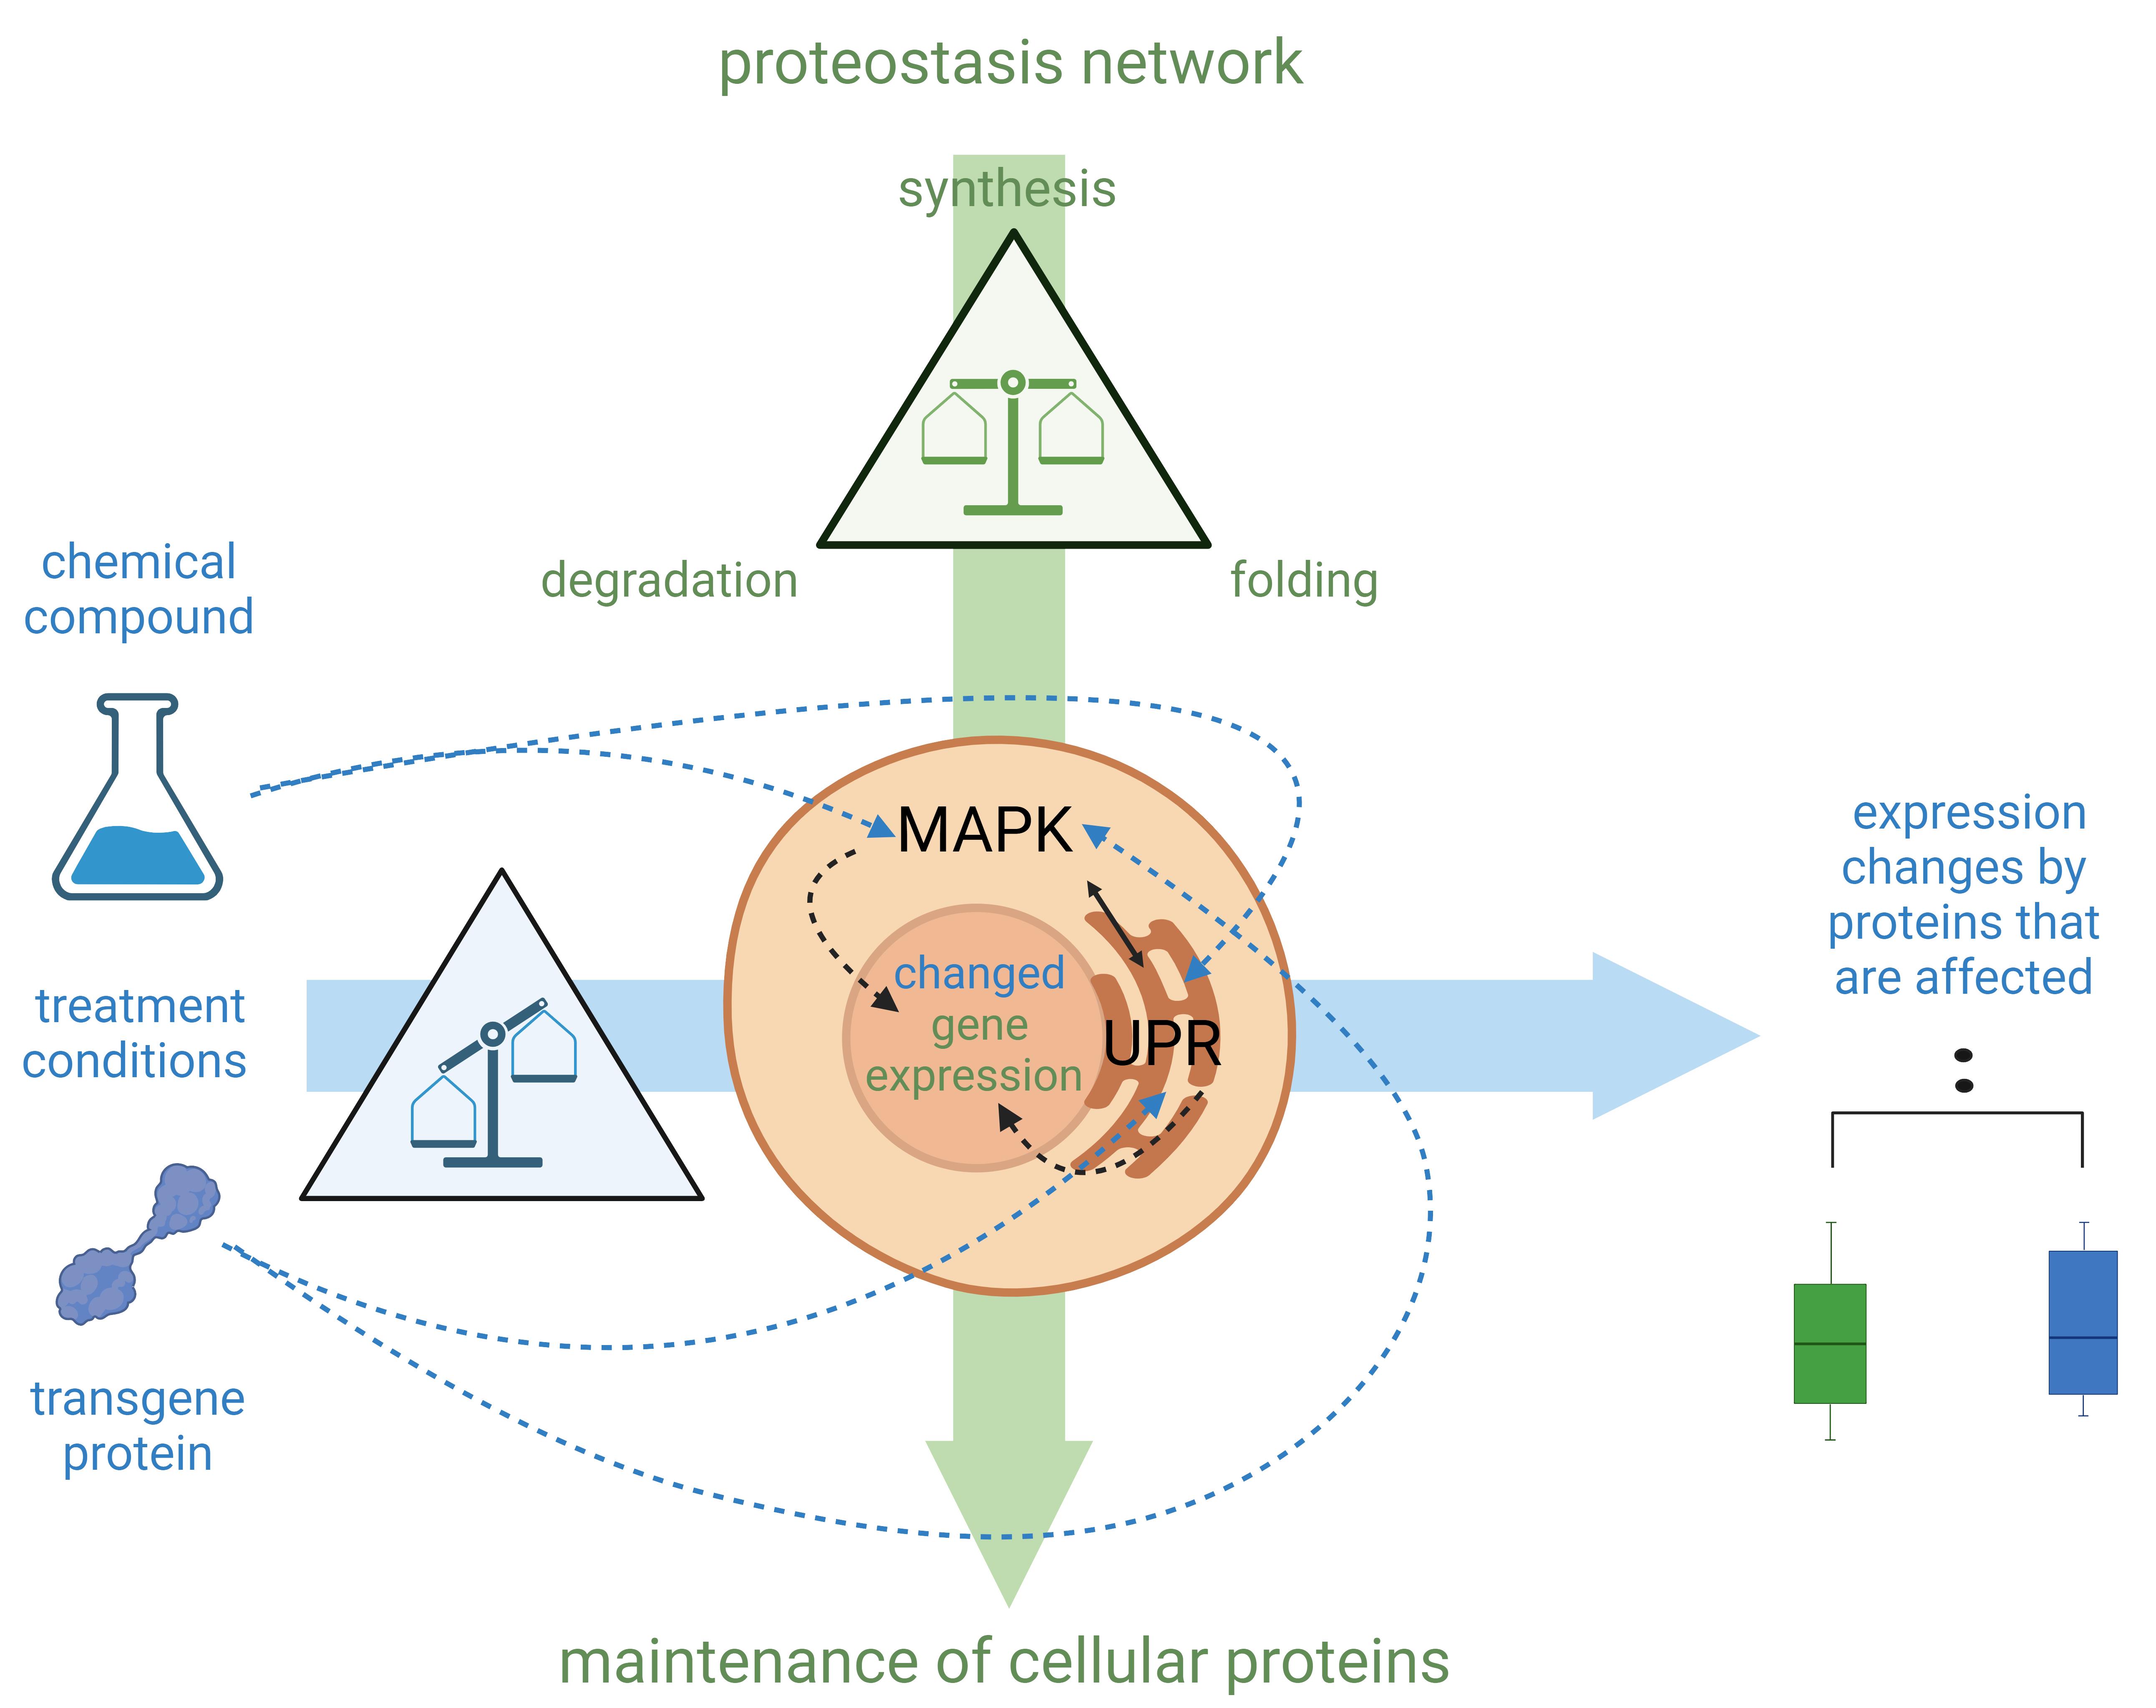
Figure 1. Schematic explanation of the cell-sonar principle. Mitogen-activated protein kinase (MAPK) and unfolded protein response (UPR) synergistically orchestrate signaling throughout the cell with subsequent induction of gene expression in the nucleus. (See details in Background section.) Highlighted in green are the components of the proteostasis network, which balances the synthesis, folding, and degradation of proteins to maintain the count of cellular proteins. MAPK and UPR are signaling networks that regulate any protein change that affects proteostasis processes. Highlighted in blue are the treatments that affect these balances. Chemical compounds or transgene proteins, which are not typically present in the cell, can result in an imbalance of the affected proteins as they interact (represented by blue dashed arrows). The proteostasis network regulates by altering gene expression to restore the balance. This is the reason why expression changes of interacting protein levels can be observed in direct comparison with untreated (green boxplot) and treated (blue boxplot) cellular proteins.
If there is a detectable expression change, it is the result of a protein interaction; if there is none, no protein interaction has happened. The results obtained from a few selected marker proteins provide a comprehensive overview of the fate of the target protein without the need to demonstrate the co-localization between a target and a marker protein. The advantages of cell-sonar are that it is adaptable to a wide range of proteins, easy to apply, and applicable to almost any cell line while it provides insights into the secretory pathway tracking in a short time.
The limitations include the fact that cell-sonar remains an overview. In order to make a reliable statement, it is crucial to use at least two marker proteins for one aspect and possess a detailed knowledge of the pathway and the proteins involved.
Materials and reagents
The following protocol instructions refer to the ER as the selected cellular area. Depending on the research question, the method can be expanded to additional cellular areas or various cellular pathways. In the following, we describe the basic principle and application of the method. We illustrate our protocol with two different cell lines, two different target proteins, and one compound to demonstrate the versatility of the cell-sonar method. Furthermore, we use the in-cell western method for the detection of protein expression changes but, of course, other methods such as on-cell western, western blot, or fluorescence-activated cell sorting analysis can also be used for this detection.
Biological materials
1. Chinese hamster ovary (CHO) cell line (Leibniz Institute DSMZ, ACC 110) and GH4C1 (Rattus norvegicus) cells (Genionics, Schlieren, Switzerland); both cell lines stably express different recombinant nicotinic acetylcholine receptors (nAChR). That means there are a) CHO cells, b) CHO cells expressing α12β1δϵ nAChR, [14], c) GH4C1 cells, and d) GH4C1 cells expressing α7 nAChR. Using identical cell lines for both host cells and genetically modified cells enables a direct comparison of protein levels
Reagents
1. MeOH (Merck/Sigma-Aldrich, catalog number: 1.06011.2500L)
2. Blocking buffer (LiCor, catalog number: 927-70001)
3. PBS pH 7.4, 1× dilution, without Mg and Ca (Gibco, catalog number: 10010-015)
4. Tween 20 (Merck/Sigma-Aldrich, catalog number: P1379-100mL)
5. Cell tag stain 700 (LiCor, catalog number: 926-41090)
6. Nicotine (Merck/Sigma-Aldrich, catalog number: N3876-25mL)
7. Primary antibodies: calnexin (CN) (Abcam, catalog number: ab133615), BiP (Abcam, catalog number: ab213258), Sil1 (Abcam, catalog number: ab228868), Hrd1 (Abcam, catalog number: ab249578), UGGT1 (Abcam, catalog number: ab124879), and GAPDH (Abcam, catalog number: ab8245)
8. Secondary antibodies: IRDye 800 rabbit (LiCor, catalog number: 92632211) and IRDye 800 mouse (LiCor, catalog number: 2632210)
9. Culture medium F-12 Nut Mix + GlutaMaxTM (Gibco, catalog number: 31765-027)
10. Fetal calf serum (FCS) (Gibco, catalog number: 10270-106)
Solutions
1. PBST (0.1% Tween-20 in PBS)
2. Primary antibody dilution 1:200 in blocking buffer
3. Secondary antibody dilution 1:800 in blocking buffer
4. Nicotine cell treatment (see Recipes)
Recipes
1. Nicotine cell treatment
| Reagent | Final concentration | Exposure time |
|---|---|---|
| Nicotine | 30 μM | 24 h |
Laboratory supplies
1. Black 96-well microplates with clear bottoms (Greiner Bio one, catalog number: 655986)
Equipment
Odyssey CLx Imager (LiCor, catalog number: 9140)
Note: Odyssey CLx is no longer available, the successor model is Odyssey DLx Imager, catalog number: 9142.
2. KS 260 control IKA (Sigma-Aldrich, catalog number: Z341835)
3. Fume hood HERA Safe KSP (Thermo Scientific, catalog number: 17168075)
Software and datasets
1. Image Studio software (version 5.2 LiCor)
2. Prism [version 9.5.1 (733) GraphPad]
3. Excel (version 16.0.10415.20025 Microsoft Excel 2019 MSO)
4. BioRender (https://www.biorender.com/). The following figures were created using BioRender: Graphical overview, BioRender.com/s04v667; Figure 1, BioRender.com/w21c279; Figure 2, BioRender.com/i62d658
Procedure
A. Determine the linear regression for cell count normalization
1. Seed CHO cells in culture medium and 16.5% FCS, and GH4C1 cells in the same medium with 10% FCS supplement in different black 96-well microplates in linearly increasing cell counts: 0, 5,000, 10,000, 15,000, 20,000, 25,000, 30,000, 35,000, 40,000, 45,000, and 50,000 cells. Apply biological and technical triplicates in corresponding culture media each with 100 μL as the final volume per well.
2. Incubate plates for 24 h at 37 °C, 5% CO2, and 90% humidity.
3. Perform cellular fixation and permeabilization in a fume hood with 50 μL of 100% MeOH (-20 °C) per well for 10 min at room temperature.
4. Gently wash each well three times with 150 μL of PBS for 5 min.
5. Block every well with 150 μL of blocking buffer for 1.5 h at room temperature at 180 rpm.
6. Apply cell tag stain 700 solution, necessary for normalization on cell counts, at 50 μL/well and incubate for 1 h at room temperature at 180 rpm, protected from light. Therefore, dissolve cell tag stain 700 in 100 μL of PBS and incubate for 30 min at room temperature protected from light; the concentration per well is 0.2 μM.
7. Gently wash each well three times with 150 μL of PBST for 5 min.
8. Add 100 μL of PBS per well before scanning plates with Odyssey CLx Imager using the Image Studio software.
9. Scan the plate with the following settings: resolution = 169 μm, quality = medium, and focus offset = 3.8 mm.
Note: Focus offset needs to be adjusted for different plates.
10. Match each scanned fluorescence per well utilizing the special grid of the Analysis tab of the software menu.
11. Export the data as an Excel report and use the detected fluorescence signals to determine the linear regression for cell count normalization.
B. Perform in-cell western for marker protein expression level detection
1. Seed 30,000 CHO and GH4C1 cells in different black 96-well microplates in biological triplicates and four technical replicates in corresponding culture media each with 100 μL as the final volume per well. In the case of nicotine treatment, the final concentration of nicotine in the wells was 30 μM.
Note: Nicotine treatment was performed in our case regarding its anticipated effect on receptors and as an example of compound application in the cell-sonar method.
2. Incubate plates for 24 h at 37 °C, 5% CO2, and 90% humidity.
3. Perform cellular fixation and permeabilization with 50 μL of 100% MeOH (-20 °C) per well for 10 min at room temperature.
4. Gently wash each well three times with 150 μL of PBS for 5 min.
5. Block every well with 150 μL of blocking buffer for 1.5 h at room temperature at 180 rpm.
6. Apply 50 μL of primary antibody solution/well and incubate for 2.5 h at room temperature at 180 rpm. Perform each microplate with controls, which are shown in Figure 2.
7. Gently wash each well three times with 150 μL of PBST for 5 min.
8. Apply cell tag stain 700 solution, necessary for normalization on cell counts, at 0.2 μM concentration and secondary antibody dilution at 50 μL/well and incubate for 1 h at room temperature and 180 rpm protected from light. Do not add cell tag stain 700 solution to the control wells of the secondary antibody signal alone (see Figure 2).
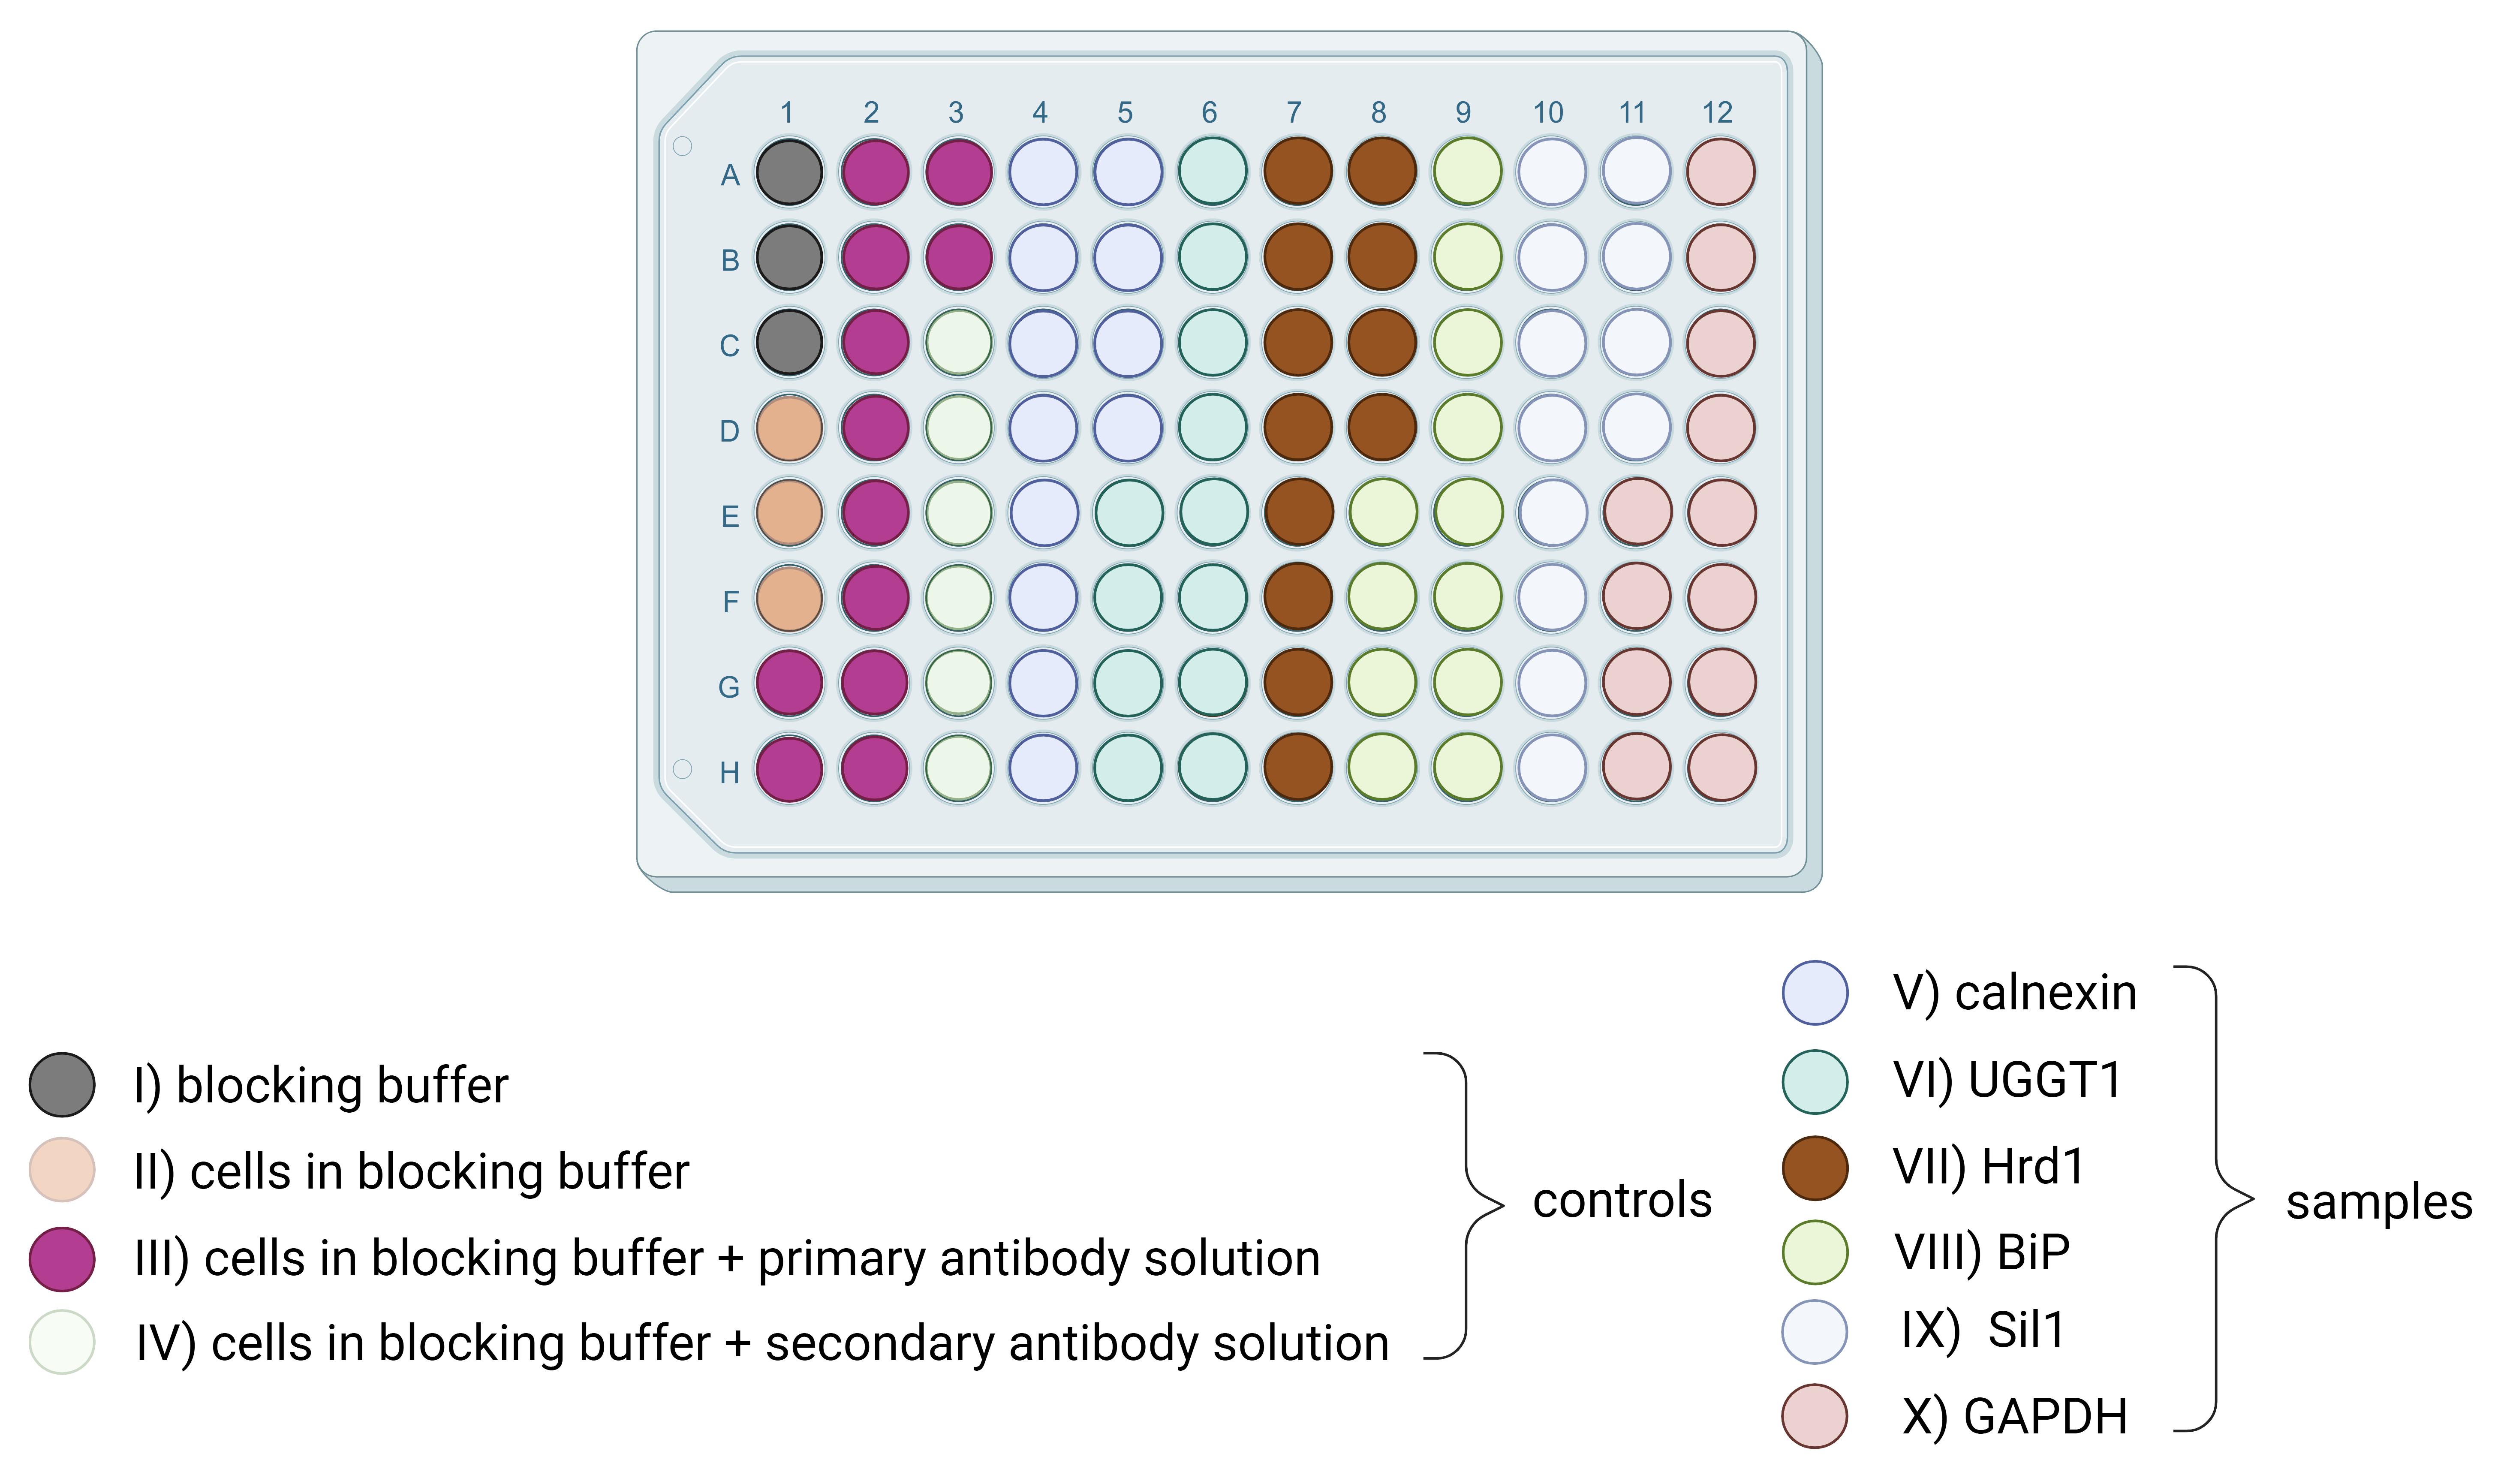
Figure 2. Schematic microplate overview with controls and samples. The plate layout shows how to handle controls (I–IV) and samples (V–X). I. Add three wells with blocking buffer only. II. Add three wells with cells in blocking buffer only. III. Add two wells (in sum 12 wells) for each solution of all individual primary antibodies on cells in blocking buffer. IV. Add three wells (in sum 6 wells) for each solution of all individual secondary antibodies on cells in blocking buffer all without adding cell tag stain 700. V–X. Performed for marker protein expression level detection; each marker protein in a biological triplicate (n = 3) and with four technical repeats, for a total of 12 wells. To these wells, primary antibody solution, secondary antibody solution, and cell tag stain 700 were added. This microplate had to be performed eight times in total for host CHO and GH4C1 cells, for host CHO and GH4C1 cells under nicotine treatment, for transduced CHO and GH4C1 cells, and for transduced CHO and GH4C1 cells under nicotine treatment.
9. Gently wash each well three times with 150 μL of PBST for 5 min.
10. Add 100 μL of PBS/well before scanning plates with Odyssey CLx Imager using Image Studio software.
11. Scan the plate with the following settings: resolution = 169 μm, quality = medium, and focus offset = 3.8 mm.
Note: Focus offset needs to be adjusted for different plates.
12. Match each scanned fluorescence per well by utilizing the special grid of the Analysis tab of the software menu.
13. Export data as an Excel report and utilize the detected fluorescence signals for analysis of the expressed protein levels.
Data analysis
Raw data may be analyzed in GraphPad Prism, as in our case. As visualized in Figure 2, multiple controls are mandatory for data analysis. Controls I–III of Figure 2 should not detect signals stronger than the sample fluorescence values. Control IV of Figure 2 shows the background signals required to average the secondary rabbit and secondary mouse IRDye 800 intensities. We recommend a minimum of three technical replicates per control. For data analysis, initially, the mean of the mouse or rabbit background was subtracted from all acquired data. To normalize the raw data to an accurate cell count, the user is required to perform a linear regression, as described in section A. In our example, the fluorescence signals were normalized to a cell count of 30,000 cells per well.
The preprocessed data are then used to generate boxplots. Each marker protein is represented by a boxplot of 12 data points. Boxplots were presented for host cells with transduced cells without treatment and both cells under nicotine treatment. Additionally, a two-sample t-test with dependent samples was conducted. p-values below 0.05 were considered statistically significant.
Any case of significant expression changes demonstrates a protein interaction between the marker protein and the target protein or the influence of the applied compound. The results are compared to the current literature to infer ATP-dependent or calnexin cycle–dependent associations. The sum of the data enables the tracking of proteins within the ER and throughout the cell, in the case of additional regions.
Validation of protocol
This protocol has been used and validated in the following research article:
• Brockmöller et al. [15]. Cell-sonar, a Novel Method for Intracellular Tracking of Secretory Pathways. Cells 13(17), (complete publication, three chosen cellular areas: the ER, between the ER and Golgi, and the endocytic pathway, with CHO cells and transgene α12β1δϵ nAChR).
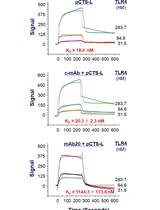
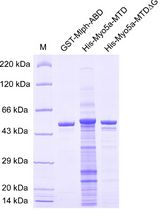
Additionally, this protocol has been used and validated in previously unpublished experiments with GH4C1 cells and the transgene α7 nAChR. Initially, we performed a western blot from purified protein solutions to demonstrate that α7 nAChR is expressed in the transgene GH4C1 cell line but not in the GH4C1 host cell line (Figure 3). The cell-sonar was performed with UGGT1, CN, Hrd1, BiP, Sil1, and GAPDH, which are marker proteins for the ER area [15], in the presence and absence of nicotine treatment. The results are presented in Figure 4. As described in the Data Analysis section, changes in protein expression were detected for five marker proteins, which means that the presence of α7 nAChR can be indirectly detected without western blot analysis. Furthermore, the ER area is divided into ATP-dependent (Figure 4A) and calnexin cycle–dependent domains (Figure 4B). The receptor also interacts differently with these marker proteins without and under nicotine treatment. Our protocol has also been applied to our laboratory procedures to gain new insights into some secretory pathways under different aspects and target proteins.
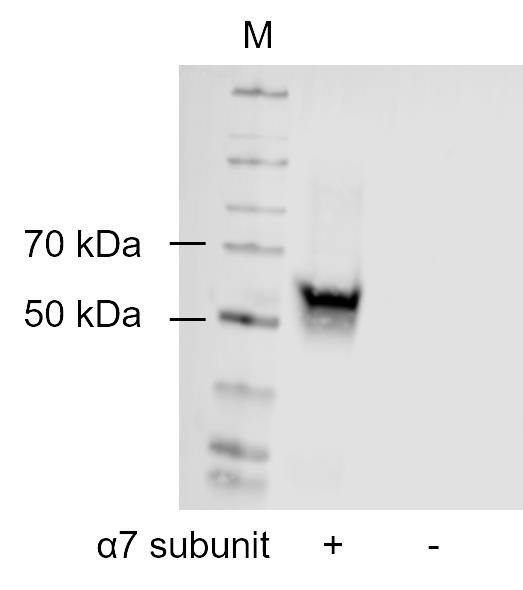
Figure 3. Western blot of the α7 subunit of nAChR from transgene (+) and host GH4C1 (-) cells. Western blot was performed from 57 ng of purified protein solutions of both GH4C1 cell lines. M shows the marker, 50 and 70 kDa bands are indicated.
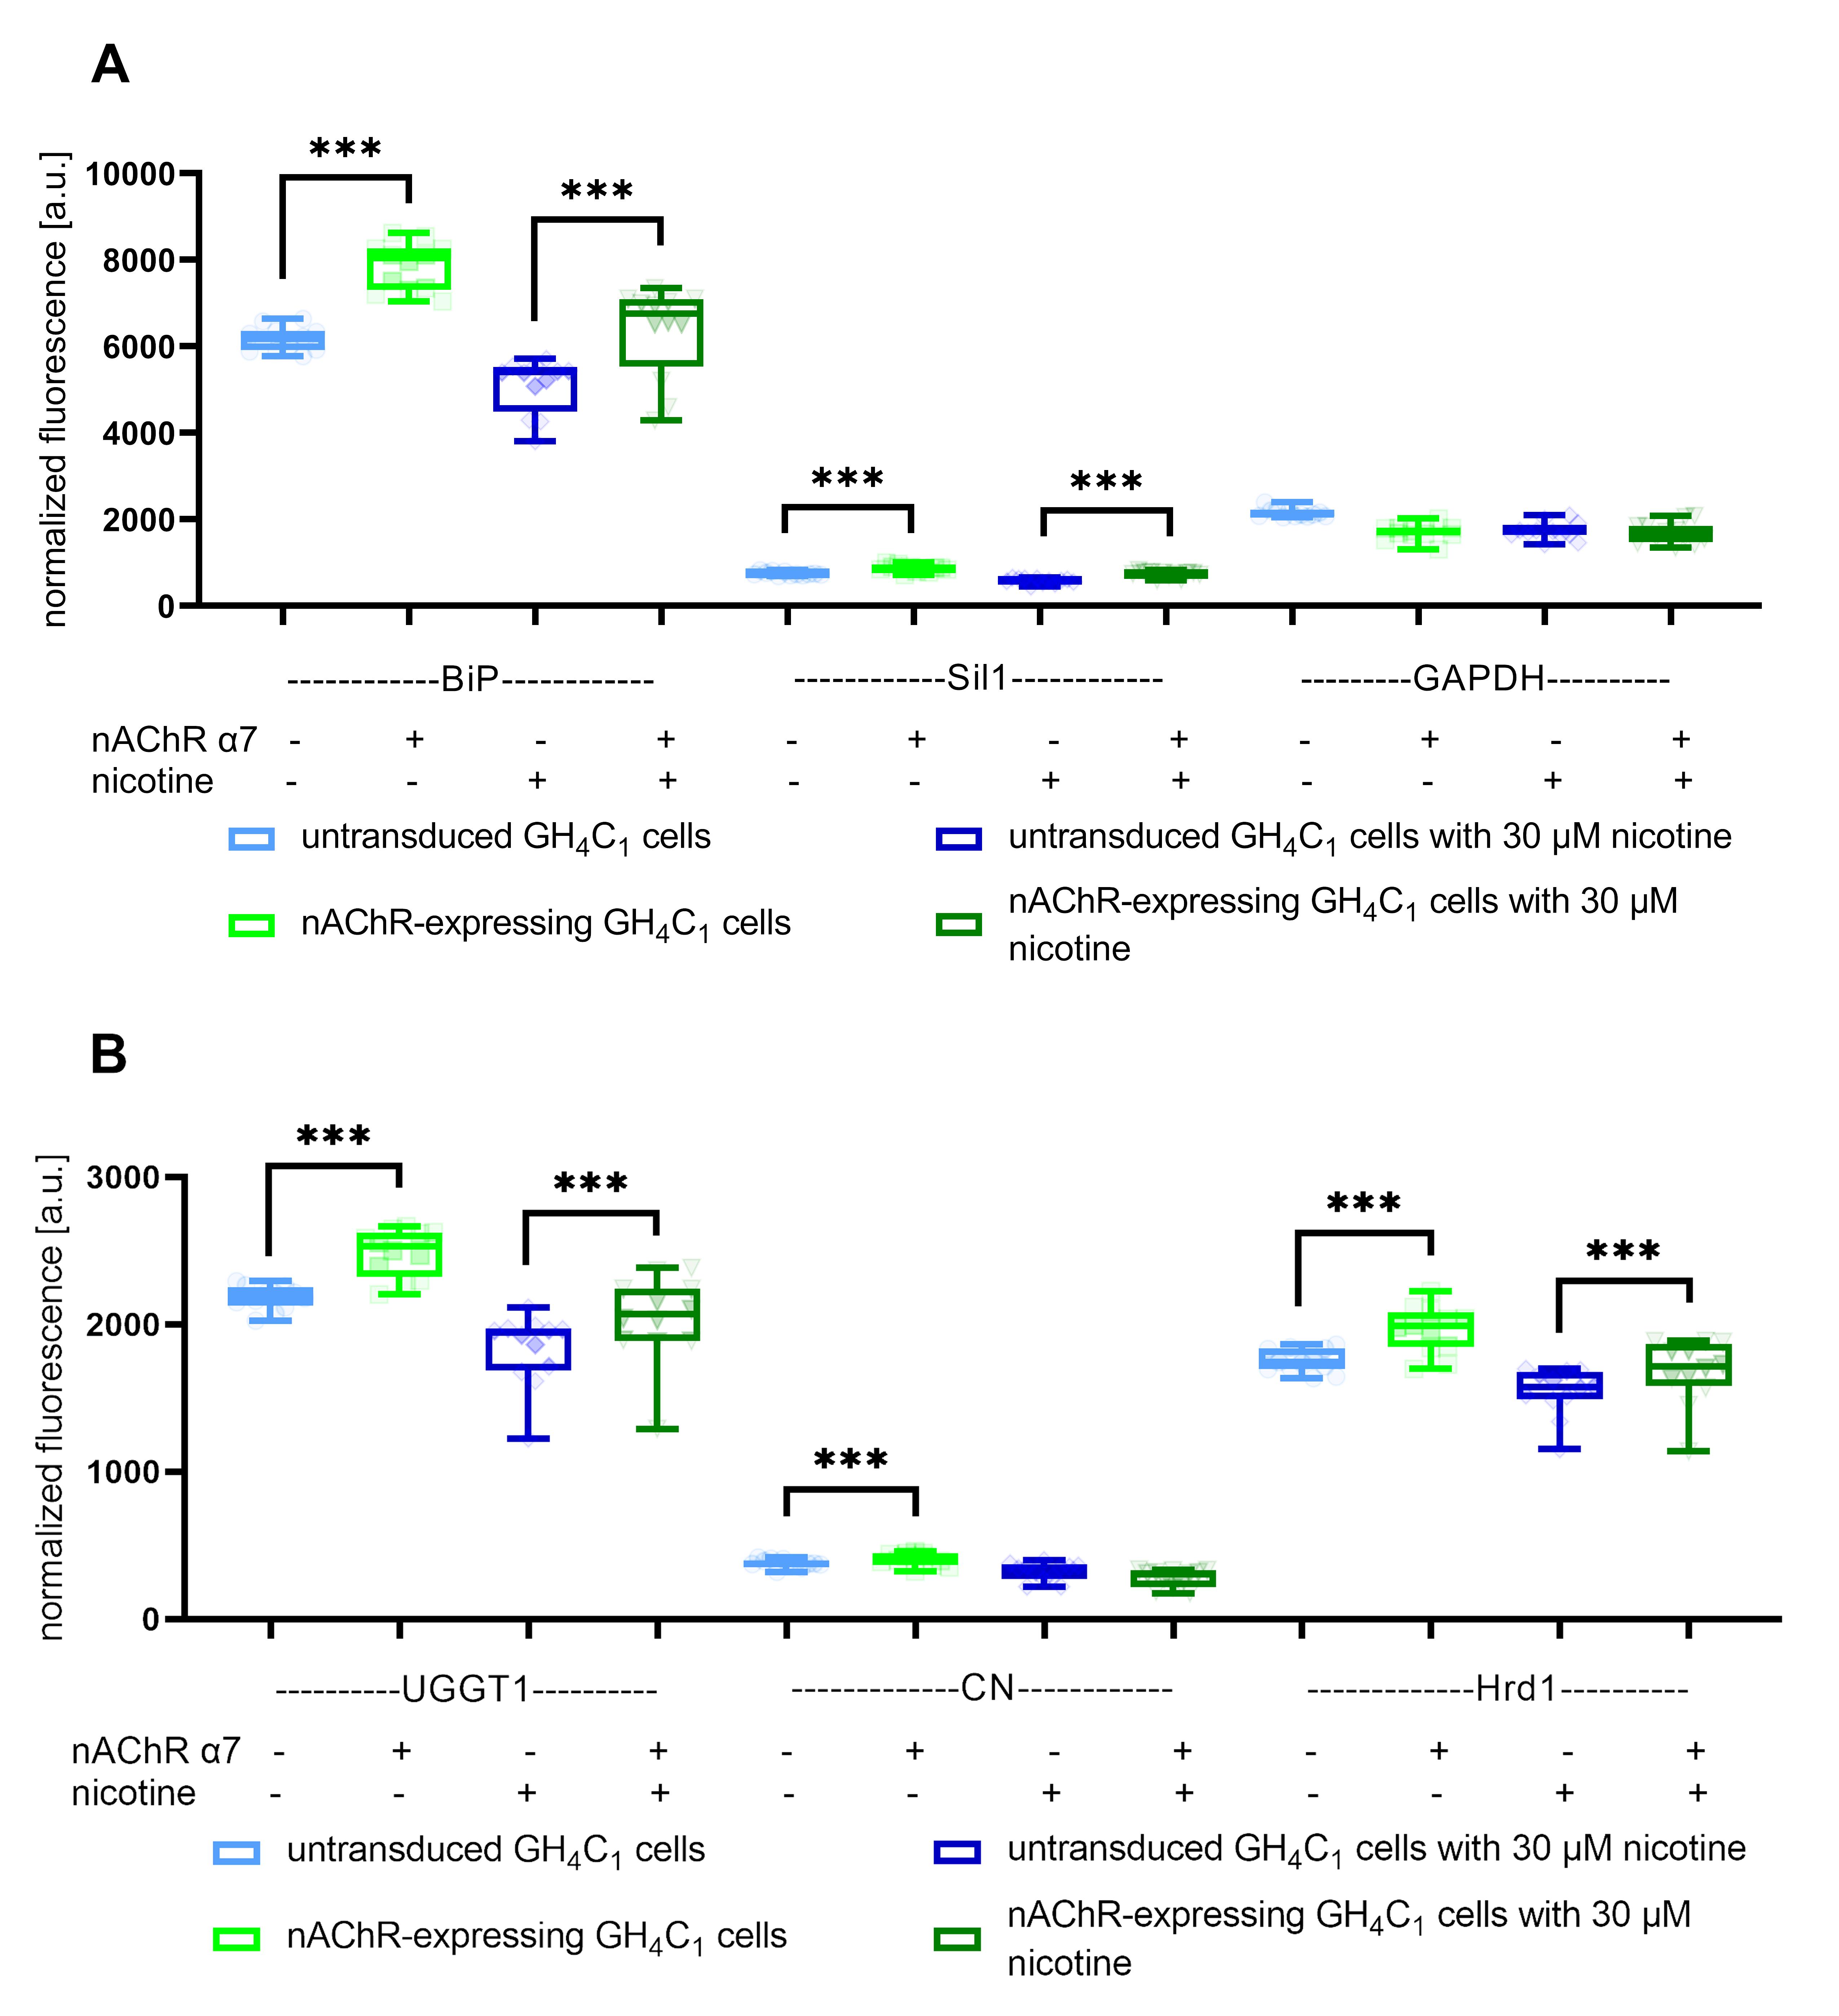
Figure 4. Expression changes of in-cell western for BiP, Sil1, GAPDH, UGGT1, CN, and Hrd1 as endoplasmic reticulum (ER) markers. Boxplots of normalized fluorescence signals of A) BiP, Sil1, and GAPDH as markers for ATP-dependent associations show expression changes between α7 nAChR-expressing GH4C1 cells and untransduced controls in the presence or absence of nicotine, whereas GAPDH was not increased under either condition. B) UGGT1, CN, and Hrd1 as markers for calnexin-cycle dependent associations show different expression levels, whereas CN was not significantly increased under nicotine treatment. Data are combined from biological triplicates with four technical replicates each, *** means significance with a p-value below 0.001.
General notes and troubleshooting
General notes
1. Each aspect that should be investigated requires at least two marker proteins. The result from one marker may be a coincidence and is thus not sufficient. Thus, we recommend a minimum of two marker proteins for a particular aspect.
2. It is important to allow enough time to find suitable marker proteins. Without knowledge of secretory pathways or intracellular understanding, conclusions could be incorrect. The application of the cell-sonar in the laboratory is straightforward; however, the theoretical foundation requires thorough literature research.
3. Interacting proteins do not require direct contact to function, and communication is possible through signaling throughout the cell. Cell-sonar demonstrates the interaction of proteins but not the co-localization of those.
Troubleshooting
Problem 1: Clustered proliferation of some cell lines, like HEK cells. If cell lines proliferate in a very clustered manner, whole cell clusters may break from the well bottom at the wash steps and distort the following results.
Possible cause: The number of plated cells is too high and/or the washing steps are too excessive.
Solution: Plate a lower cell count of HEK cells and execute each washing step with the utmost care.
Acknowledgments
We would like to thank Prof. Dr. Horst Thiermann for providing the laboratories and working equipment. Further, we would like to thank Dr. Hildegard Mack for her extensive support.
Funding: The authors declare that no funds, grants, or other support were received during the preparation of this manuscript.
Previous work or the original research paper in which this protocol was described and validated: Brockmöller, S.; Seeger, T.; Worek, F.; Rothmiller, S. (2024). Cell-Sonar, a Novel Method for Intracellular Tracking of Secretory Pathways. Cells, 13(17): 1449, doi:10.3390/cells13171449 [15].
Competing interests
The authors have no relevant financial or non-financial interests to disclose.
References
- Bayguinov, P. O., Oakley, D. M., Shih, C., Geanon, D. J., Joens, M. S. and Fitzpatrick, J. A. J. (2018). Modern Laser Scanning Confocal Microscopy. Curr Protoc Cytom. 85(1): e39.
- Ghisaidoobe, A. and Chung, S. (2014). Intrinsic Tryptophan Fluorescence in the Detection and Analysis of Proteins: A Focus on Förster Resonance Energy Transfer Techniques. Int J Mol Sci. 15(12): 22518–22538.
- Axelrod, D. (2008). Chapter 7 Total Internal Reflection Fluorescence Microscopy. Methods Cell Biol. 89: 169–221.
- Herzenberg, L. A., Parks, D., Sahaf, B., Perez, O., Roederer, M. and Herzenberg, L. A. (2002). The History and Future of the Fluorescence Activated Cell Sorter and Flow Cytometry: A View from Stanford. Clin Chem. 48(10): 1819–1827.
- Horgan, R. P. and Kenny, L. C. (2011). ‘Omic’ technologies: genomics, transcriptomics, proteomics and metabolomics. Obstetr Gynaecol. 13(3): 189–195.
- Balch, W. E., Morimoto, R. I., Dillin, A. and Kelly, J. W. (2008). Adapting Proteostasis for Disease Intervention. Science. 319(5865): 916–919.
- Hotamisligil, G. S. and Davis, R. J. (2016). Cell Signaling and Stress Responses. Cold Spring Harbor Perspect Biol. 8(10): a006072.
- Hipp, M. S., Kasturi, P. and Hartl, F. U. (2019). The proteostasis network and its decline in ageing. Nat Rev Mol Cell Biol. 20(7): 421–435.
- Meiners, S. and Ballweg, K. (2014). Proteostasis in pediatric pulmonary pathology. Mol Cell Pediatr. 1(1): e1186/s40348–014–0011–1.
- Shamu, C. E. and Walter, P. (1996). Oligomerization and phosphorylation of the Ire1p kinase during intracellular signaling from the endoplasmic reticulum to the nucleus. EMBO J. 15(12): 3028–3039.
- Bertolotti, A., Zhang, Y., Hendershot, L. M., Harding, H. P. and Ron, D. (2000). Dynamic interaction of BiP and ER stress transducers in the unfolded-protein response. Nat Cell Biol. 2(6): 326–332.
- Peters, A., Nawrot, T. S. and Baccarelli, A. A. (2021). Hallmarks of environmental insults. Cell. 184(6): 1455–1468.
- Morrison, D. K. (2012). MAP kinase pathways. Cold Spring Harb Perspect Biol. 4(11): a011254.
- Brockmöller, S., Seeger, T., Worek, F. and Rothmiller, S. (2023). Recombinant cellular model system for human muscle-type nicotinic acetylcholine receptor α12β1δε. Cell Stress Chaperon. 28(6): 1013–1025.
- Brockmöller, S., Seeger, T., Worek, F. and Rothmiller, S. (2024). Cell-Sonar, a Novel Method for Intracellular Tracking of Secretory Pathways. Cells. 13(17): 1449.
Article Information
Publication history
Received: Oct 15, 2024
Accepted: Dec 19, 2024
Available online: Jan 14, 2025
Published: Feb 5, 2025
Copyright
© 2025 The Author(s); This is an open access article under the CC BY license (https://creativecommons.org/licenses/by/4.0/).
How to cite
Brockmöller, S., Molitor, L. M., Worek, F. and Rothmiller, S. (2025). Cell-Sonar, an Easy and Low-cost Method to Track a Target Protein by Expression Changes of Specific Protein Markers. Bio-protocol 15(3): e5206. DOI: 10.21769/BioProtoc.5206.
Category
Biochemistry > Protein > Expression
Biochemistry > Protein > Interaction > Protein-protein interaction
Do you have any questions about this protocol?
Post your question to gather feedback from the community. We will also invite the authors of this article to respond.