- Submit a Protocol
- Receive Our Alerts
- Log in
- /
- Sign up
- My Bio Page
- Edit My Profile
- Change Password
- Log Out
- EN
- EN - English
- CN - 中文
- Protocols
- Articles and Issues
- For Authors
- About
- Become a Reviewer
- EN - English
- CN - 中文
- Home
- Protocols
- Articles and Issues
- For Authors
- About
- Become a Reviewer
Using DIMet for Differential Analysis of Labeled Metabolomics Data: A Step-by-step Guide Showcasing the Glioblastoma Metabolism
(*contributed equally to this work) Published: Vol 15, Iss 2, Jan 20, 2025 DOI: 10.21769/BioProtoc.5168 Views: 2687
Reviewed by: Hélène LégerSébastien GillotinAnonymous reviewer(s)
Abstract
Stable-isotope resolved metabolomics (SIRM) is a powerful approach for characterizing metabolic states in cells and organisms. By incorporating isotopes, such as 13C, into substrates, researchers can trace reaction rates across specific metabolic pathways. Integrating metabolomics data with gene expression profiles further enriches the analysis, as we demonstrated in our prior study on glioblastoma metabolic symbiosis. However, the bioinformatics tools for analyzing tracer metabolomics data have been limited. In this protocol, we encourage the researchers to use SIRM and transcriptomics data and to perform the downstream analysis using our software tool DIMet. Indeed, DIMet is the first comprehensive tool designed for the differential analysis of tracer metabolomics data, alongside its integration with transcriptomics data. DIMet facilitates the analysis of stable-isotope labeling and metabolic abundances, offering a streamlined approach to infer metabolic changes without requiring complex flux analysis. Its pathway-based "metabologram" visualizations effectively integrate metabolomics and transcriptomics data, offering a versatile platform capable of analyzing corrected tracer datasets across diverse systems, organisms, and isotopes. We provide detailed steps for sample preparation and data analysis using DIMet through its intuitive, web-based Galaxy interface. To showcase DIMet's capabilities, we analyzed LDHA/B knockout glioblastoma cell lines compared to controls. Accessible to all researchers through Galaxy, DIMet is free, user-friendly, and open source, making it a valuable resource for advancing metabolic research.
Key features
• Glioblastoma tumor spheroids in vitro replicate tumors’ three-dimensional structure and natural nutrient, metabolite, and gas gradients, providing a more realistic model of tumor biology.
• Joint analysis of tracer metabolomics and transcriptomics datasets provides deeper insights into the metabolic states of cells.
• DIMet is a web-based tool for differential analysis and seamless integration of metabolomics and transcriptomics data, making it accessible and user-friendly.
• DIMet enables researchers to infer metabolic changes, offering intuitive and visually appealing "metabologram" outputs, surpassing conventional visual representations commonly used in the field.
Keywords: MetabolomicsGraphical overview
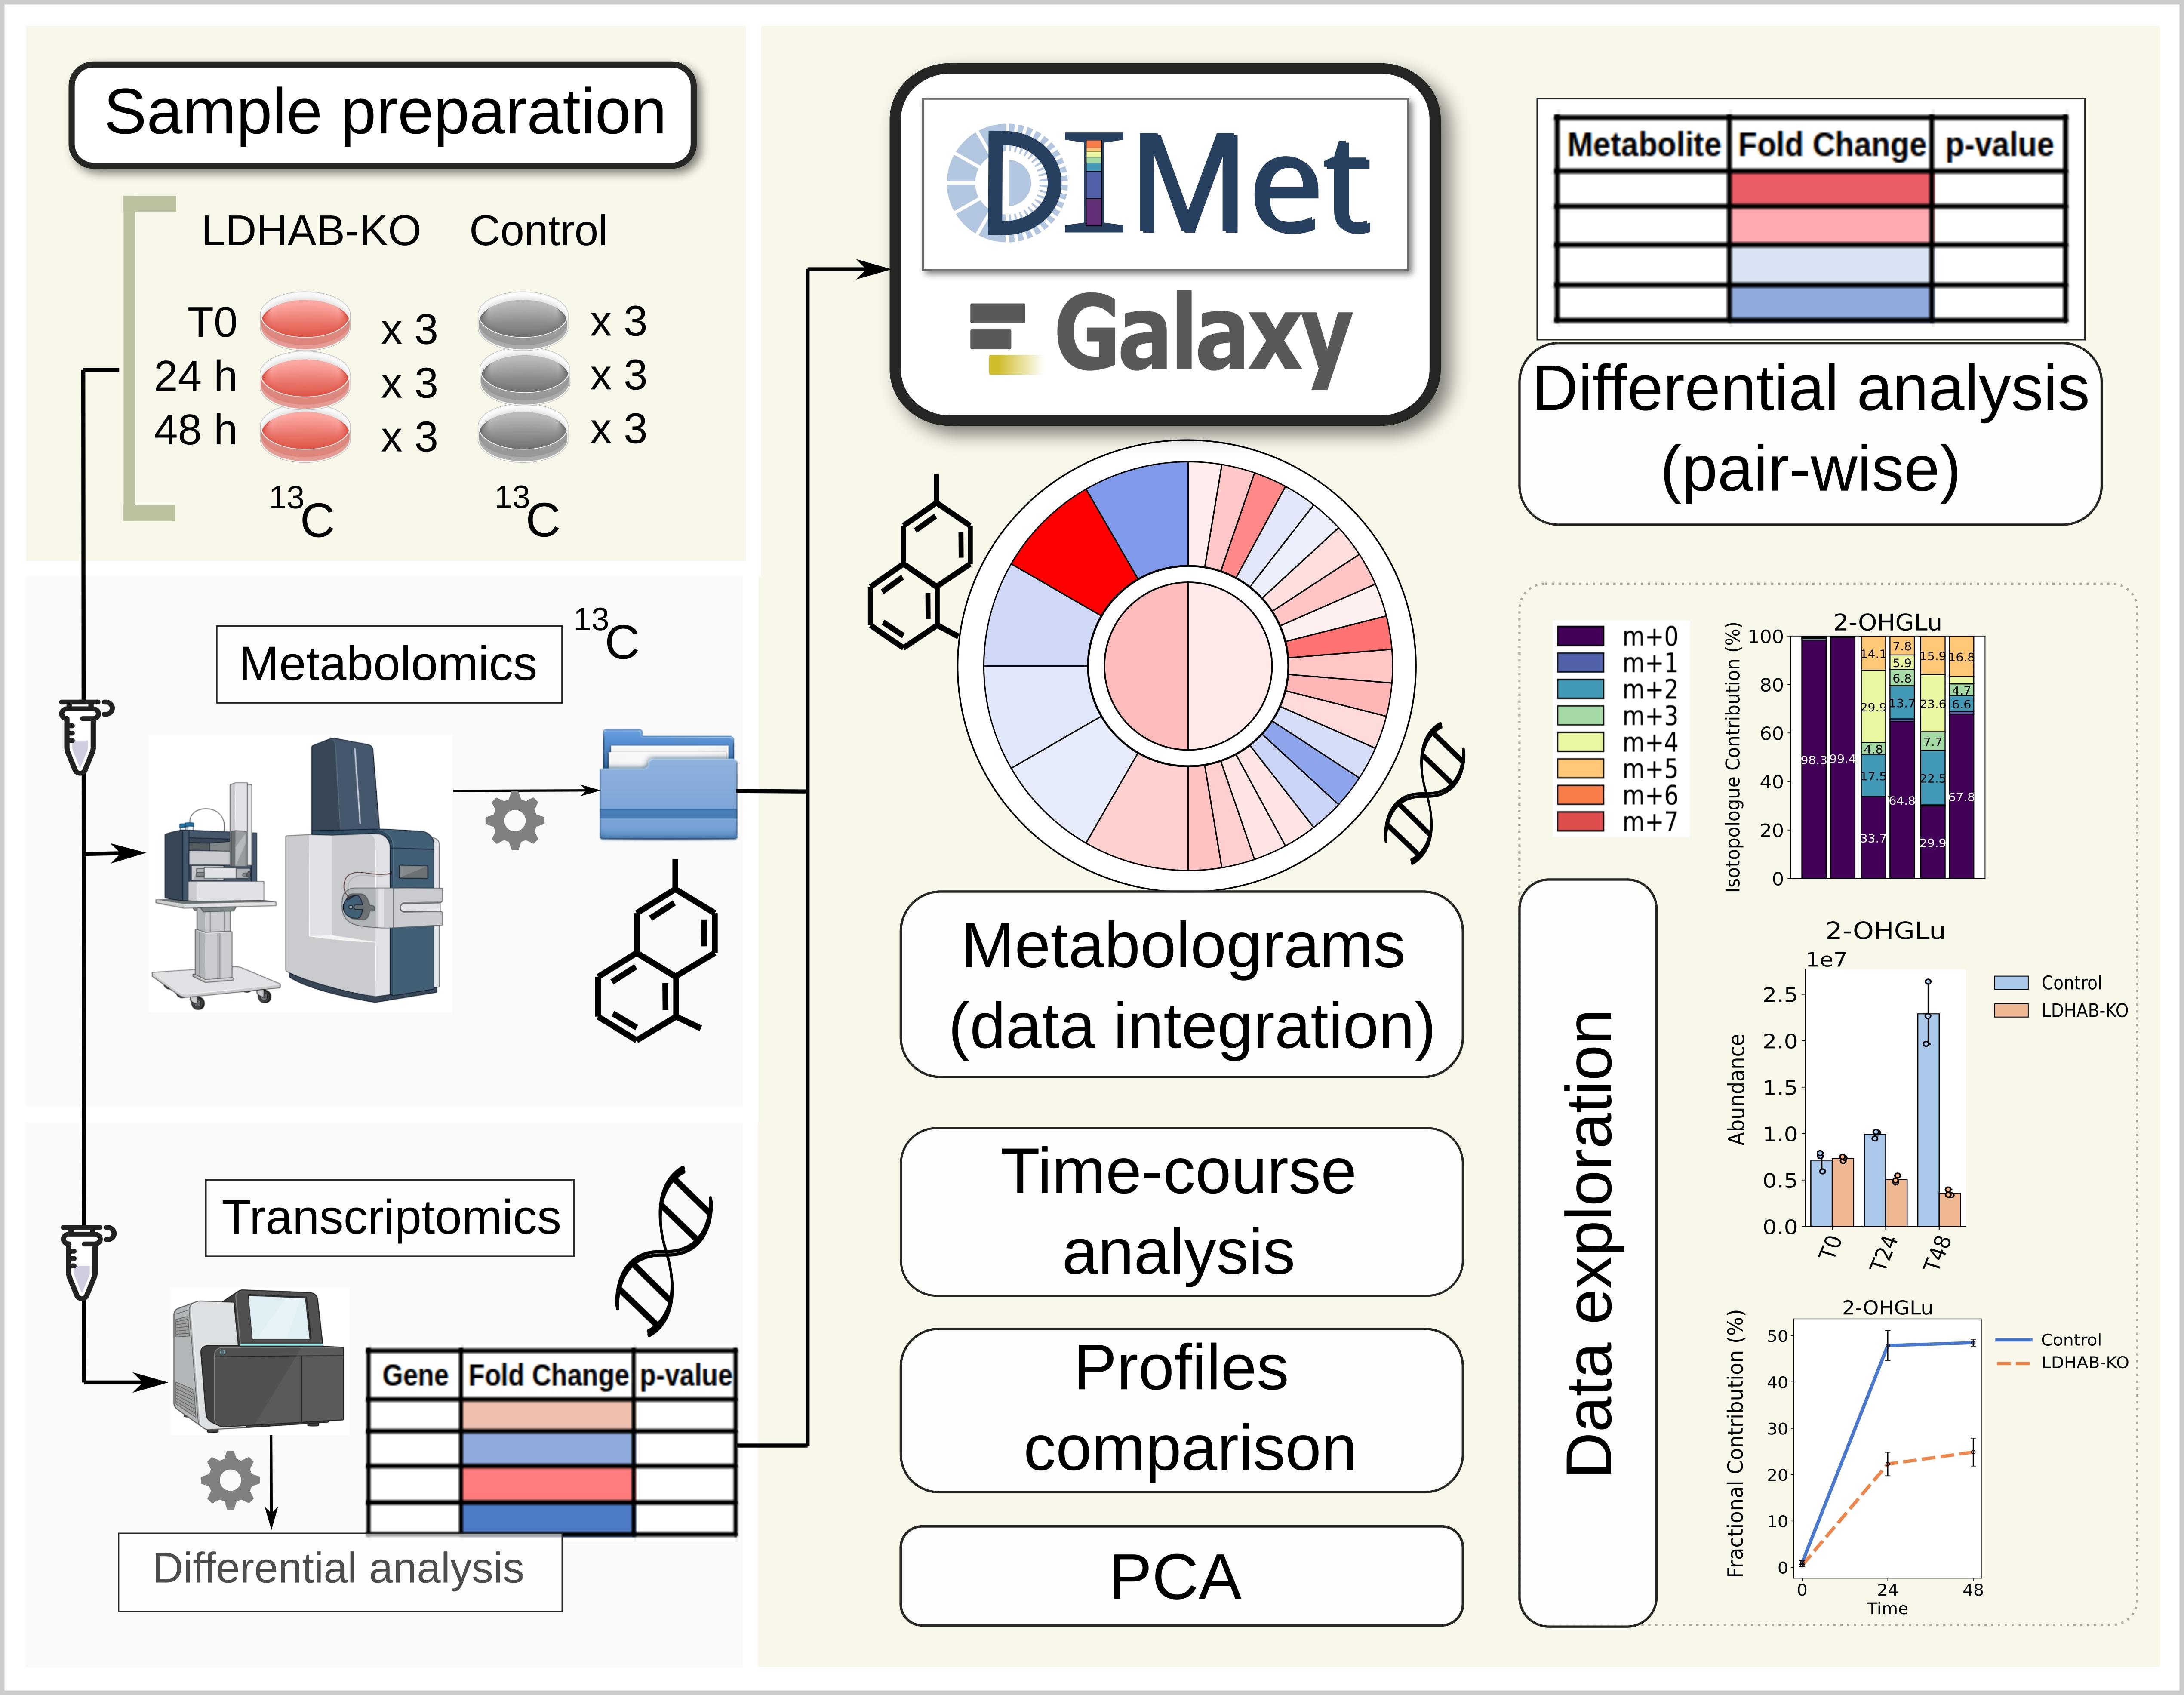
Metabolomics and transcriptomics acquired data undergo downstream analysis with DIMet in Galaxy (image created with BioRender and Inkscape)
Background
Metabolic processes within cells play a major role in tumor adaptation, growth, and proliferation [1]. In the case of glioblastoma (GB), our previous in vitro studies focused on tumor plasticity driven by the hypoxic and acidic microenvironment and highlighted the critical role of lactate dehydrogenases (LDHA, LDHB) in this metabolic symbiosis [2]. We employed omics technologies—specifically transcriptomics and metabolomics—because they provide complementary insights into metabolic pathways. Transcriptomics captures the initial stage of gene expression through the analysis of mRNA transcripts, while metabolomics sheds light on the enzymatic activities associated with transcript translation.
To further characterize metabolic dynamics, we used stable-isotope resolved metabolomics (SIRM), also referred to as tracer or labeled metabolomics [3]. SIRM involves the administration of a stable isotope–labeled substrate to the cells or organisms, allowing to trace the integration of these isotopes into metabolic pathways, thus revealing subsequent biochemical reactions [3–5]. While 13C is the most commonly used isotope, other isotopes are also employed. The resulting corrected data contain the total abundances and labeling information, such as isotopologues and mean enrichment [4,6]. However, previous bioinformatics solutions for analyzing these datasets have exhibited limitations, including statistical frameworks or accessibility [7–11]. Furthermore, flux estimation often requires substantial computational resources and complex parameterization [12,13], creating a barrier to its adoption.
This protocol begins with the preparation of glioblastoma cell lines. Two distinct cell lines are used, P3 sgCont and sgLDHA/B, both generated from P3 wild-type glioblastoma cells through CRISPR-Cas9 editing [2]. For simplicity, we refer to sgCont as control throughout this paper. The sgLDHA/B cell line corresponds to a double knockout (KO) of the LDHA and LDHB genes and is referred to as LDHAB-KO. Along these cell lines, we provide the corresponding SIRM and transcriptomics datasets.
The primary focus of this paper is the data analysis using our recently published tool, DIMet [6], available in its Galaxy interface. DIMet is the first comprehensive tool designed for the differential analysis of tracer metabolomics data integrated with transcriptomics data. This protocol provides a detailed step-by-step guide for using DIMet in Galaxy. Specifically, we performed differential analyses between conditions and/or time points to evaluate total metabolite abundances and isotope labeling. By interpreting these two levels of information together, it becomes possible to infer variations in the production and consumption rates of metabolites, providing a proxy for flux differences [4,9].
We further combined metabolomics and transcriptomics datasets into DIMet's pathway-based metabolograms, addressing the limitations of previous tools. DIMet offers several key advantages: (i) it accommodates the unique requirements of SIRM data, (ii) it integrates data in a pathway-centric manner, (iii) it generates visually ergonomic outputs, and (iv) all functionalities are accessible via the free, user-friendly Galaxy interface. While complex analyses involving multiple isotopes and substrates are not yet supported, DIMet’s features and accessibility more than compensate for this limitation. Without restrictions on the system, organism, or isotope-substrate combination, DIMet in Galaxy can be used for differential analysis of any corrected tracer metabolomics dataset.
Materials and reagents
Biological materials
1. P3 glioblastoma stem-like cells (generated from patient [14] and modified through CRISPR-cas9 editing [2])
Reagents
1. Neurobasal medium (NBM) (Gibco, catalog number: 2110349), storage at 4 °C
2. B27 50× (Thermo Fisher Scientific, catalog number: 17504044), storage at 4 °C
3. FGF basic (PeproTech, catalog number: 100-18B), storage at -20 °C
4. Heparin (Sigma-Aldrich, catalog number: H3149)
5. Penicillin-streptomycin (Dutscher, catalog number: P06-07100), storage at -20 °C
6. Neurobasal medium without glucose (NBMW/O) (Gibco, catalog number: A2477501), storage at 4 °C
7. [13C]6-glucose (Sigma, catalog number: 389374), storage at 4 °C
8. Accutase (Corning, catalog number: 25058CI), storage at -20 °C
9. Phosphate-buffered saline (PBS) (Gibco, catalog number: 14190-094), storage at 4 °C
Solutions
1. Cell culture medium (see Recipes)
Recipes
1. Cell culture medium
Prepare the complete NBM (cNBM) and the complete NBMW/O (cNBMW/O) by adding 10 mL of B27, 20 ng/mL of basic FGF, 100 U/μL of heparin, and 1,000 U/mL of penicillin-streptomycin in 500 mL of medium. Supplement the cNBMW/O with 4.5 mg/mL of [13C]6-glucose ([13C]6-glucose NBM).
Laboratory supplies
1. Filter membrane 0.2 μm (Sartolon Polyamide)
2. Qiagen RNeasy Mini kit (Qiagen, catalog number: 74104)
Equipment
1. CO2 incubator (Panasonic, model: MCO-18AC-PE, catalog number: 13040182)
2. Hypoxia chamber (Heraeus, model: B 5060 EK/CO2, catalog number: 8403096)
3. Vacuum pump (KNF Neuberger, model: N86 KN.18, catalog number: D-79112)
Software and datasets
1. The datasets and software used here are listed in Table 1. The DIMet tool [6] and its companion tool for data formatting, TraceGroomer, are both available through two user-friendly Galaxy web platforms: Galaxy EU [15] and Workflow4Metabolomics (W4M) [16,17]. For this protocol, W4M was chosen because it includes an isotopologue correction tool [18], which is compatible with DIMet and TraceGroomer. No coding skills are required from the user.
Table 1. Software and datasets for data analysis. DIMet and TraceGroomer Galaxy versions are available through Workflow4Metabolomics (W4M) https://workflow4metabolomics.usegalaxy.fr/ and Galaxy EU (https://usegalaxy.eu/).
| Type | Software/dataset/resource | Version | Date | License | Access |
|---|---|---|---|---|---|
| Data | https://zenodo.org/records/13741706 | 0.3 | 10/09/2024 | CC BY | free |
| Software | DIMet in its web Galaxy version (source code: https://github.com/cbib/DIMet) | 0.2.4 | 22/03/2024 | MIT | free |
| Software | Tracegroomer in its web Galaxy version (https://github.com/cbib/TraceGroomer) | 0.1.4 | 06/08/2024 | MIT | free |
| Workflow manager | Galaxy Workflow4Metabolomics (W4M) https://workflow4metabolomics.usegalaxy.fr/ | 23.0 | 06/06/2023 | GPL-3.0 | free |
Procedure
Cells were grown as spheroids and cultured in cNBM at 37 °C in a 5% CO2 incubator. Prior to use, these cell lines were tested for mycoplasma contamination. The absence of mycoplasma was confirmed using specific PCR primers. All cell lines used for experimental procedures were cultured between passages 10 and 30.
A. Cell passage
1. Collect spheroids in a 15 mL tube.
2. Centrifuge the tube at 1,000× g for 5 min.
3. Remove the supernatant and wash with 5 mL of PBS twice.
4. Centrifuge the tube at 1,000× g for 5 min.
5. Remove the supernatant.
6. Dissociate spheroids with 1 mL of Accutase (700 U/mL) for 15 min at 37 °C.
7. Recover cells with 9 mL of [13C]6-glucose NBM.
8. Count the cells.
B. Labeled substrate administration
1. Seed 500,000 P3 cells in 6-well plates with [13C]6-glucose NBM.
2. Incubate cells for 0, 24, and 48 h in normoxia (21% O2) or in hypoxia (0.1% O2).
C. Cells extracts for metabolomics data acquisition
1. For cells in suspension (fast filtration method):
a. Drop 1 mL of cell culture on a filter membrane with 0.2 μm.
b. Rinse the filter with 2 mL of PBS.
c. Quickly remove the filter membrane from the filtration unit, put it on an aluminum foil, and freeze it in liquid nitrogen.
d. Store the filter membrane at -80 °C.
2. For cell supernatants:
a. Recover the filtered supernatant from the filtration unit.
b. Store the supernatant at -80 °C before shipment.
3. Follow the guidance of the core services. In our case, the metabolomic profiling was performed in collaboration with MetaboHub-MetaToul.
D. RNA purification for transcriptomics data acquisition
1. Seed 500,000 P3 cells in 6-well plates with cNBM.
2. Incubate cells for 0, 24, and 48 h in normoxia (21% O2) or hypoxia (0.1% O2).
3. Freeze the cells as in section C.
4. Extract the RNA from fresh frozen cells using the Qiagen RNeasy Mini kit according to the manufacturer's protocol.
5. Check the quality and quantity of RNA. We used a fragment analyzer (Agilent) with the company's Standard Sensitivity RNA Kit (DNF‐471). Transcriptomic sequencing was performed in collaboration with the Core Unit for Molecular Tumor Diagnostics (CMTD), National Center for Tumor Diseases (NCT), Dresden, Germany.
E. Shipping of the biological samples for omics data acquisition
Send all the samples in dry ice. This is valid for both samples shipped to the metabolomics core and samples shipped to the transcriptomics platform. Metabolomics data acquisition and RNA sequencing are out of the scope of this protocol; both can be consulted in our previous publication [2].
F. Collecting the metabolomics and transcriptomics datasets
1. Collect the labeled metabolomics data. Check that the data has been corrected by the occurrence of natural isotopes; most metabolomics services provide corrected abundances of isotopologues. This correction is carried out with external tools such as IsoCor [18], available in W4M.
2. Collect the transcriptomics (RNA-seq) data, acquired by the sequencing services, and perform the differential analysis to obtain the tables of differentially expressed genes (DEG) (see Note 1).
Data analysis
A. Preparing data for the analysis with DIMet in Galaxy
1. Download the provided data from Zenodo (https://zenodo.org/records/13741706), and review its detailed description. The metabolomics data has been pre-corrected using IsoCor by the metabolomics facility. In addition to the metabolomics data, differentially expressed genes (DEG) of LDHAB-KO vs. Control, at T0 and T48 time points, are provided. Save and unzip the downloaded folder on your local machine.
2. Ensure the metabolomics data includes at least three biological replicates per group (≥ 5 biological replicates is optimal). The data provided has three biological replicates.
B. Accessing DIMet tools through the Galaxy web workflow manager
1. Open Galaxy W4M https://workflow4metabolomics.usegalaxy.fr/ in your browser. If unfamiliar with Galaxy, refer to File S1 for guidance on loading files, opening tools, and reusing files. Run all subsequent steps in the same Galaxy session for easy file reuse.
2. Only a web browser is required; no coding skills are necessary.
C. Formatting the metabolomics data with TraceGroomer
1. Open the TraceGroomer tool in Galaxy (Figure 1A) to format data for compatibility with DIMet:
a. Upload the labeled metabolomics file and the samples metadata file (Figure 1A.i).
b. Drag and drop the appropriate files to the required fields as shown in Figure 1A.ii.
c. Leave fields for optional files empty and use default settings for input type (“isocor output file”) and advanced options. Run the tool.
d. Download the output files. TraceGroomer generates four files (Figure 1A.iv) [6]. These four quantification files will be used in the following steps by the DIMet modules.
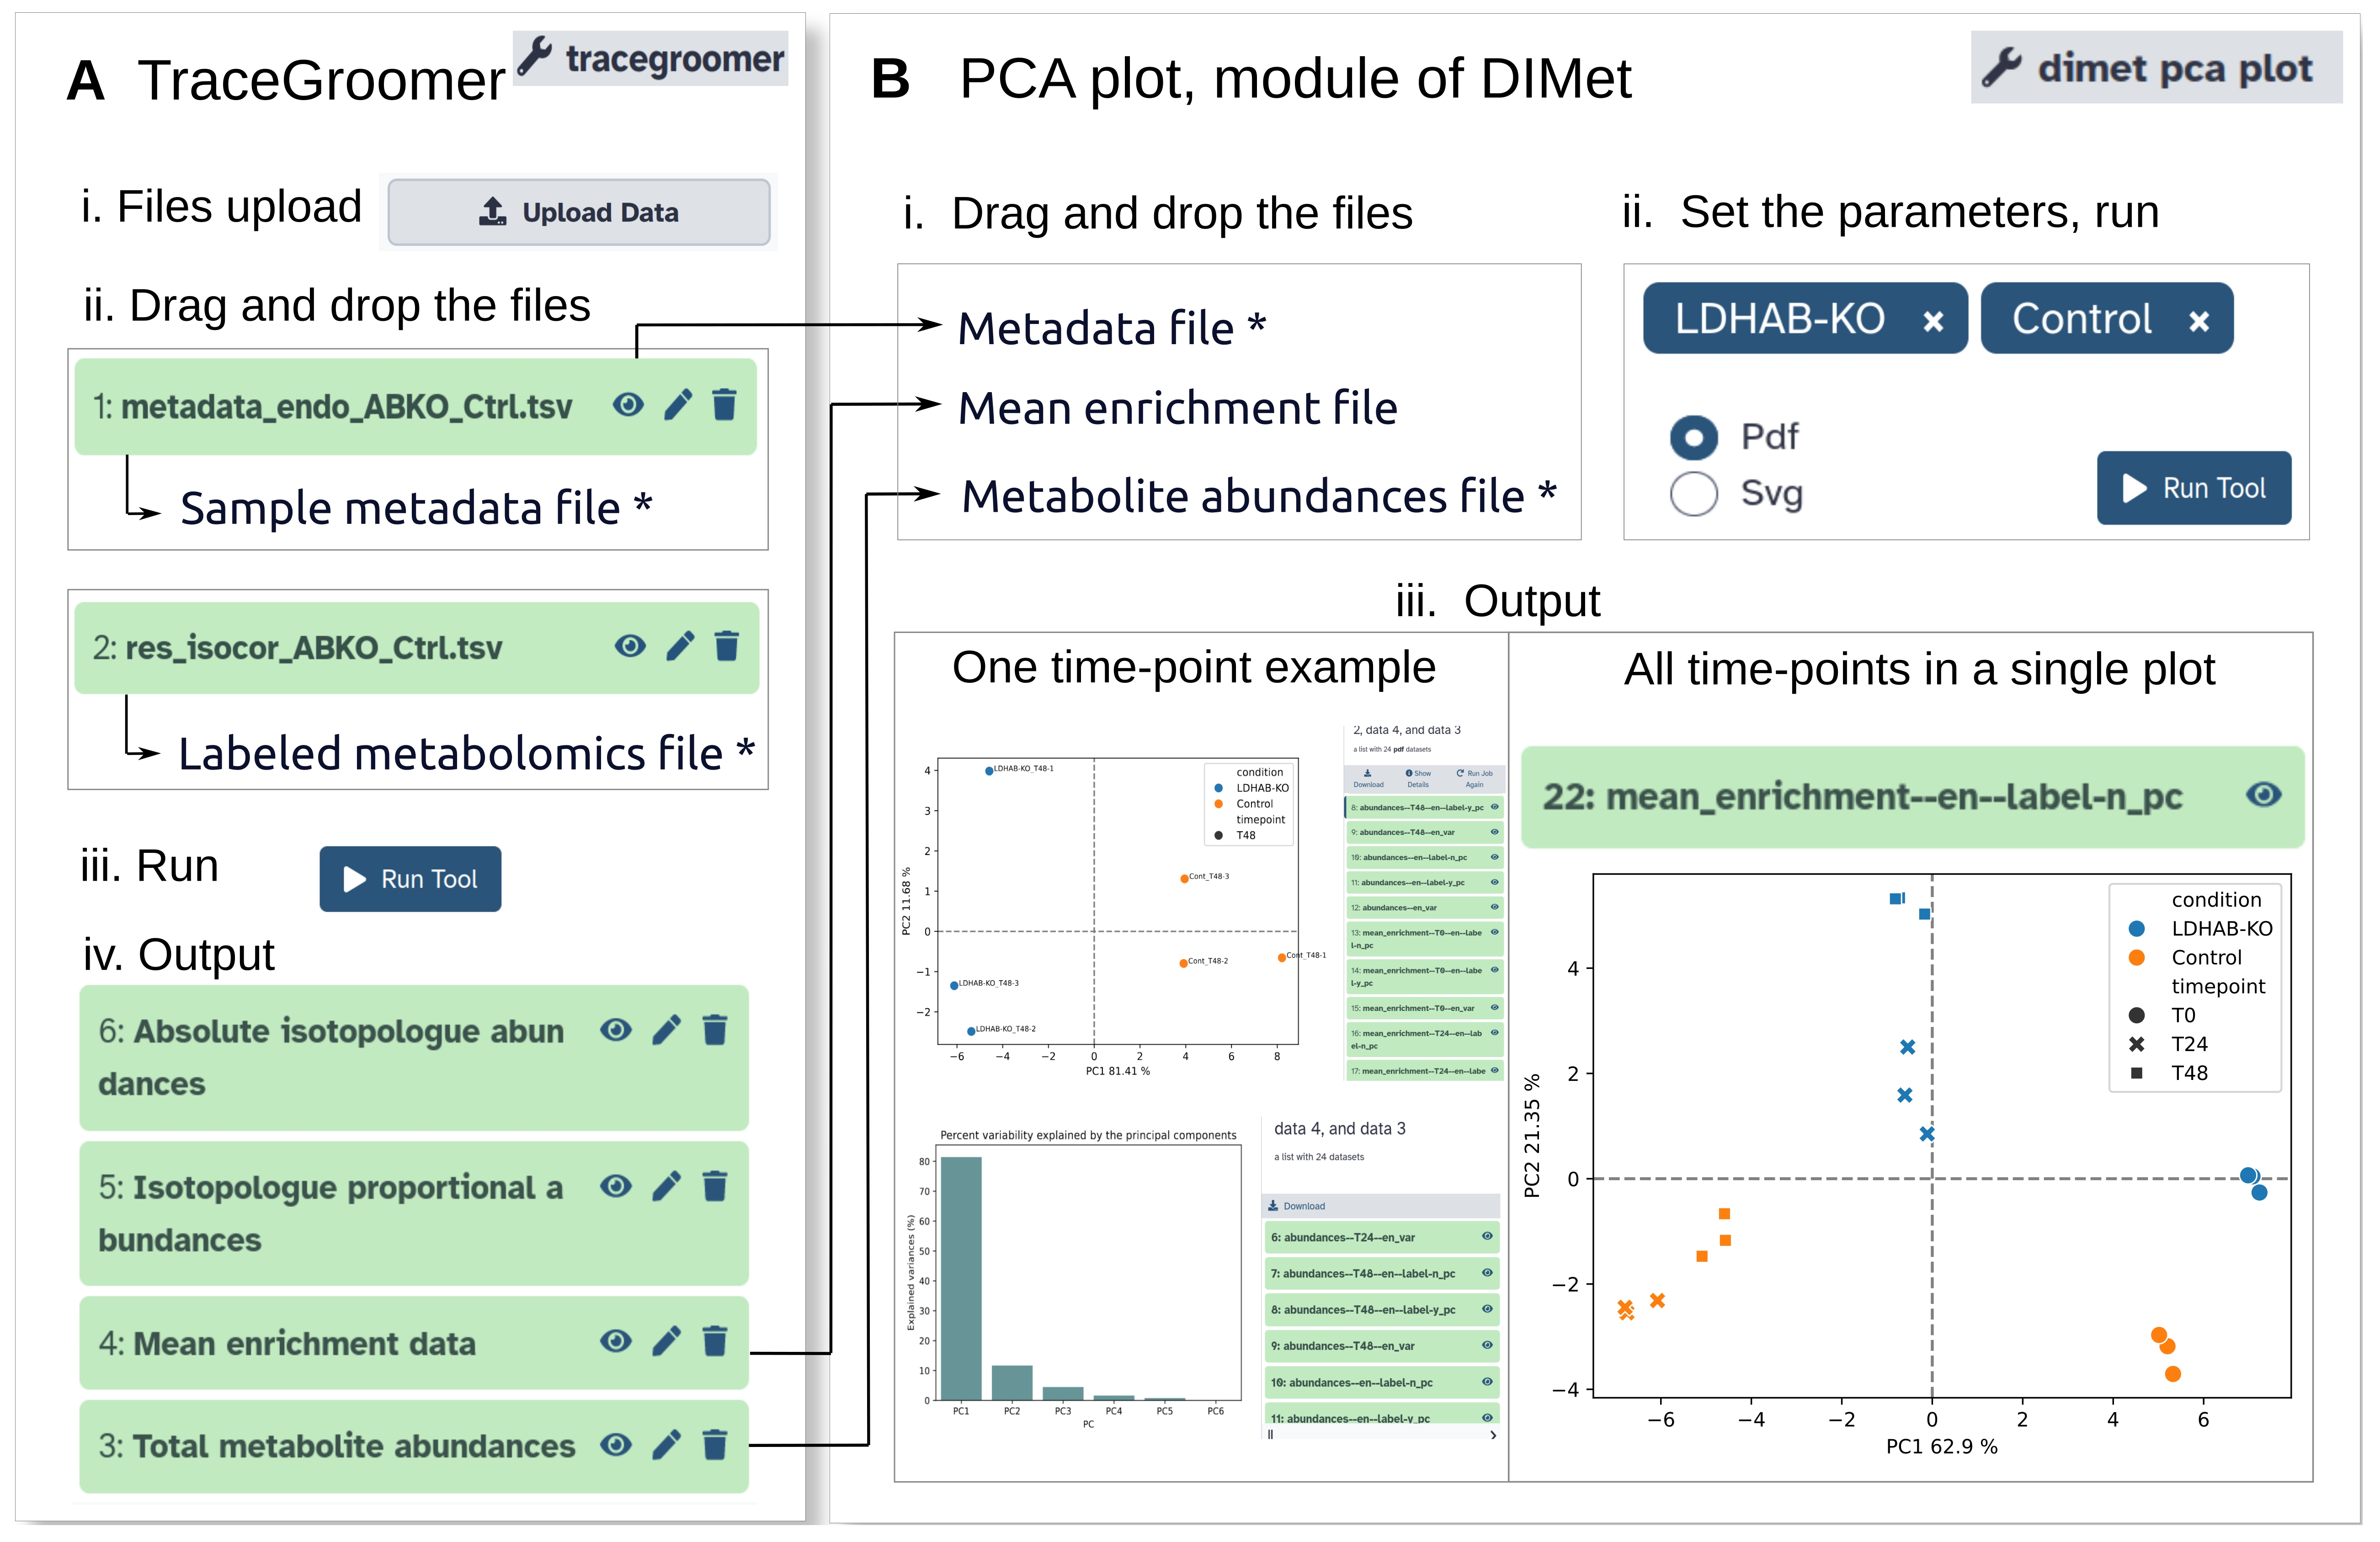
Figure 1. Format and globally explore the dataset. (A) Formatting with TraceGroomer. Upload the metadata file and the metabolomics file (i), then drag and drop them to their respective fields (ii). Run (iii). The four output files are the isotopologue abundances, the isotopologue proportions, the mean enrichment, and the total metabolite abundances (iv). (B) Explore the global data structure with the principal components analysis (PCA) plot. Drag and drop the total abundances and mean enrichment (generated in A) and the metadata to the fields as shown (i). Select the conditions (ii, upper), the output format (ii, lower-left), and run (ii, lower-right). The output consists of two types of figures: the projections of principal components 1 and 2 (scatterplots) (iii, upper left; iii, right), and the component variabilities (bars) (iii, lower-left).
D. Exploring the global data structure with the principal components analysis (PCA) using DIMet
1. Open the dimet pca plot module in Galaxy, continuing the same session used in section C.
2. Drag and drop the appropriate files to the fields, as shown in Figure 1B.i. You need to provide the total metabolite abundances (or mean enrichment) file along with the samples metadata file.
3. Set the parameters as shown in Figure 1B.ii. Select the two conditions (control and LDHAB-KO) from the drop-down menu and specify the desired output format (.pdf or .svg) using the radio buttons. Run the module.
4. Once executed, visualize the results (Figure 1B.iii) and download them (Note 2).
E. Exploring metabolite-by-metabolite quantifications using DIMet
1. For each dedicated module, run them separately (Table 2 and Figure 2A) in your session. Drag and drop the input quantification file for each module as indicated in Table 2. Continue to assign the metadata file as per the previous steps.
Table 2. DIMet modules to generate figures of individual metabolites. Each one of the three modules accepts a corresponding quantification file.
| Open this module in Galaxy | Drag and drop this quantification file as input |
|---|---|
| dimet enrichment plot | mean enrichment |
| dimet isotopologues plot | isotopologue proportions |
| dimet abundance plot | total metabolite abundances |
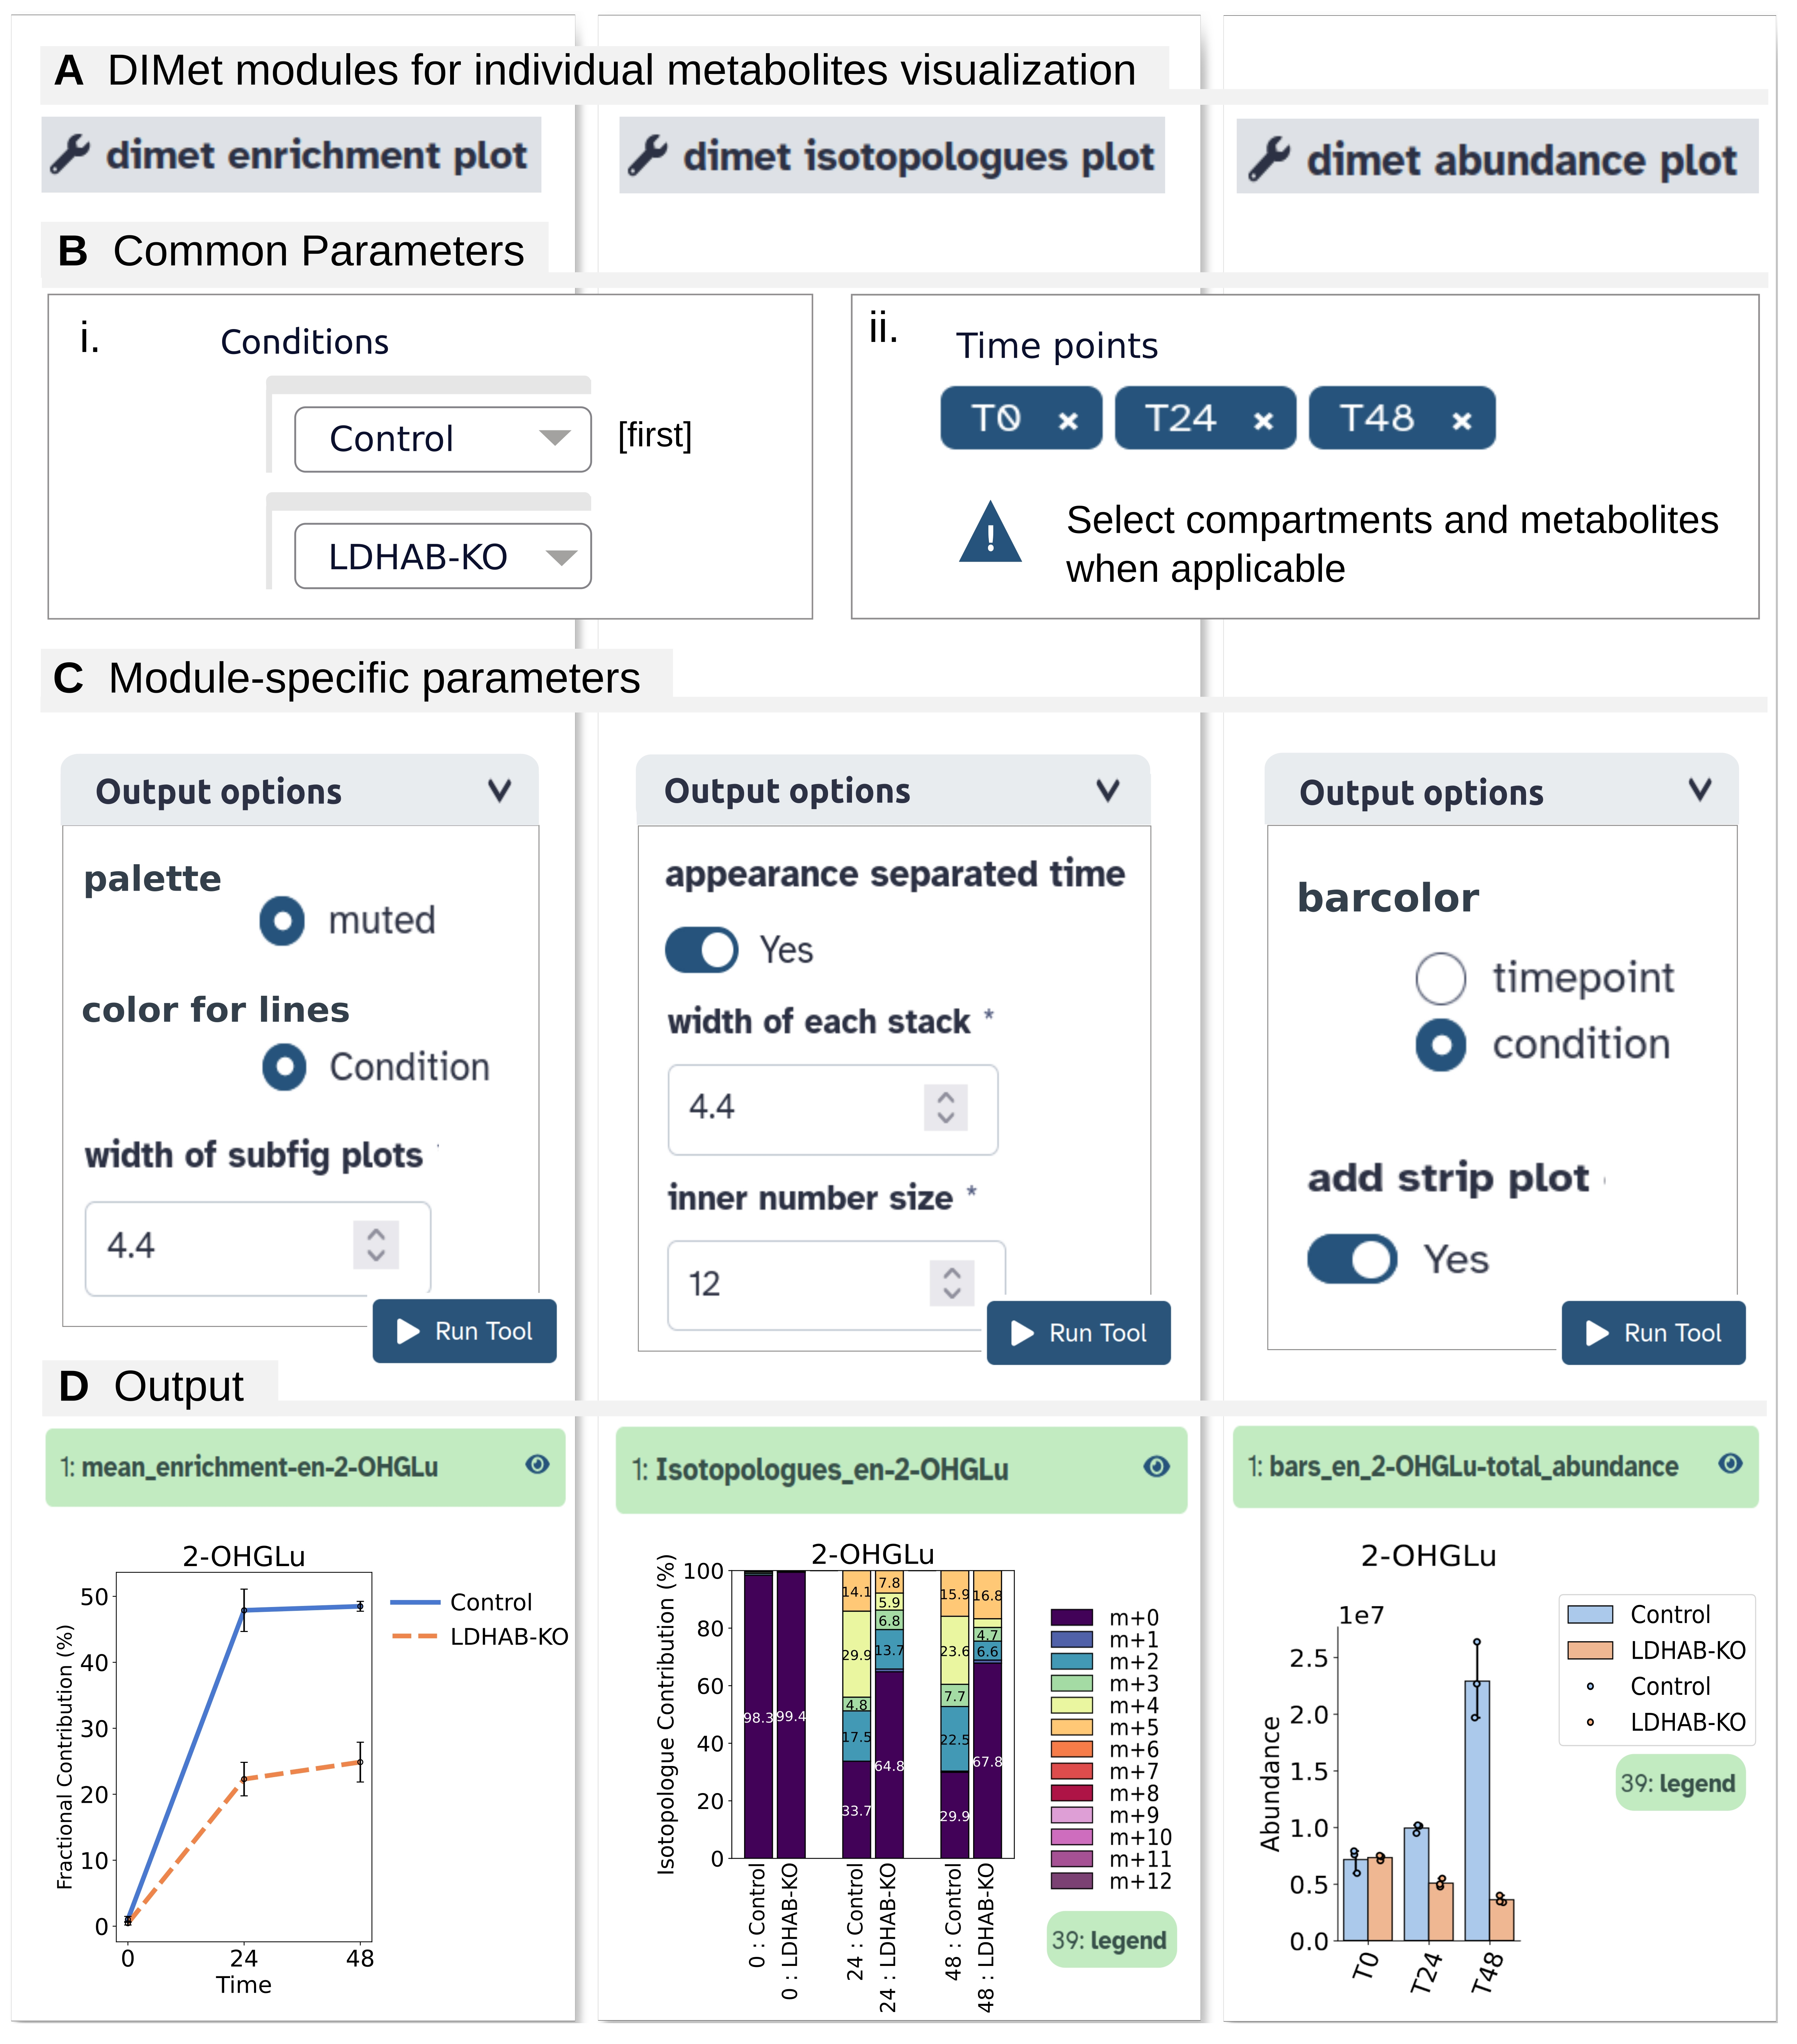
Figure 2. Explore metabolite-by-metabolite quantifications using DIMet. The horizontal panels represent the steps, whereas the vertical panels represent each one of the three modules. (A) The three modules’ names must be used separately. (B) Common parameters for the three modules: set a sequential order within the Conditions box as indicated in (i), and select all the time points (ii, upper). (C) Adjust the module-specific parameters to obtain identical output as in D. (D) Output plots. For the isotopologues (center) and the total abundance bars (right), the legend is generated as a separate file.
2. Set data-specific parameters as shown in Figure 2B, which are consistent across all three modules. Next, adjust the module-specific parameters as shown in Figure 2C.
3. Run the modules. Once completed, visualize and download the results (Figure 2D).
F. Performing the DIMet differential analysis between two groups (LDHAB-KO and control samples)
1. Open the dimet differential analysis module in Galaxy.
2. Identify the files generated by section C and the metadata within your session (Figure 3A). The dimet differential analysis accepts any type of quantification file, but only one type per run.
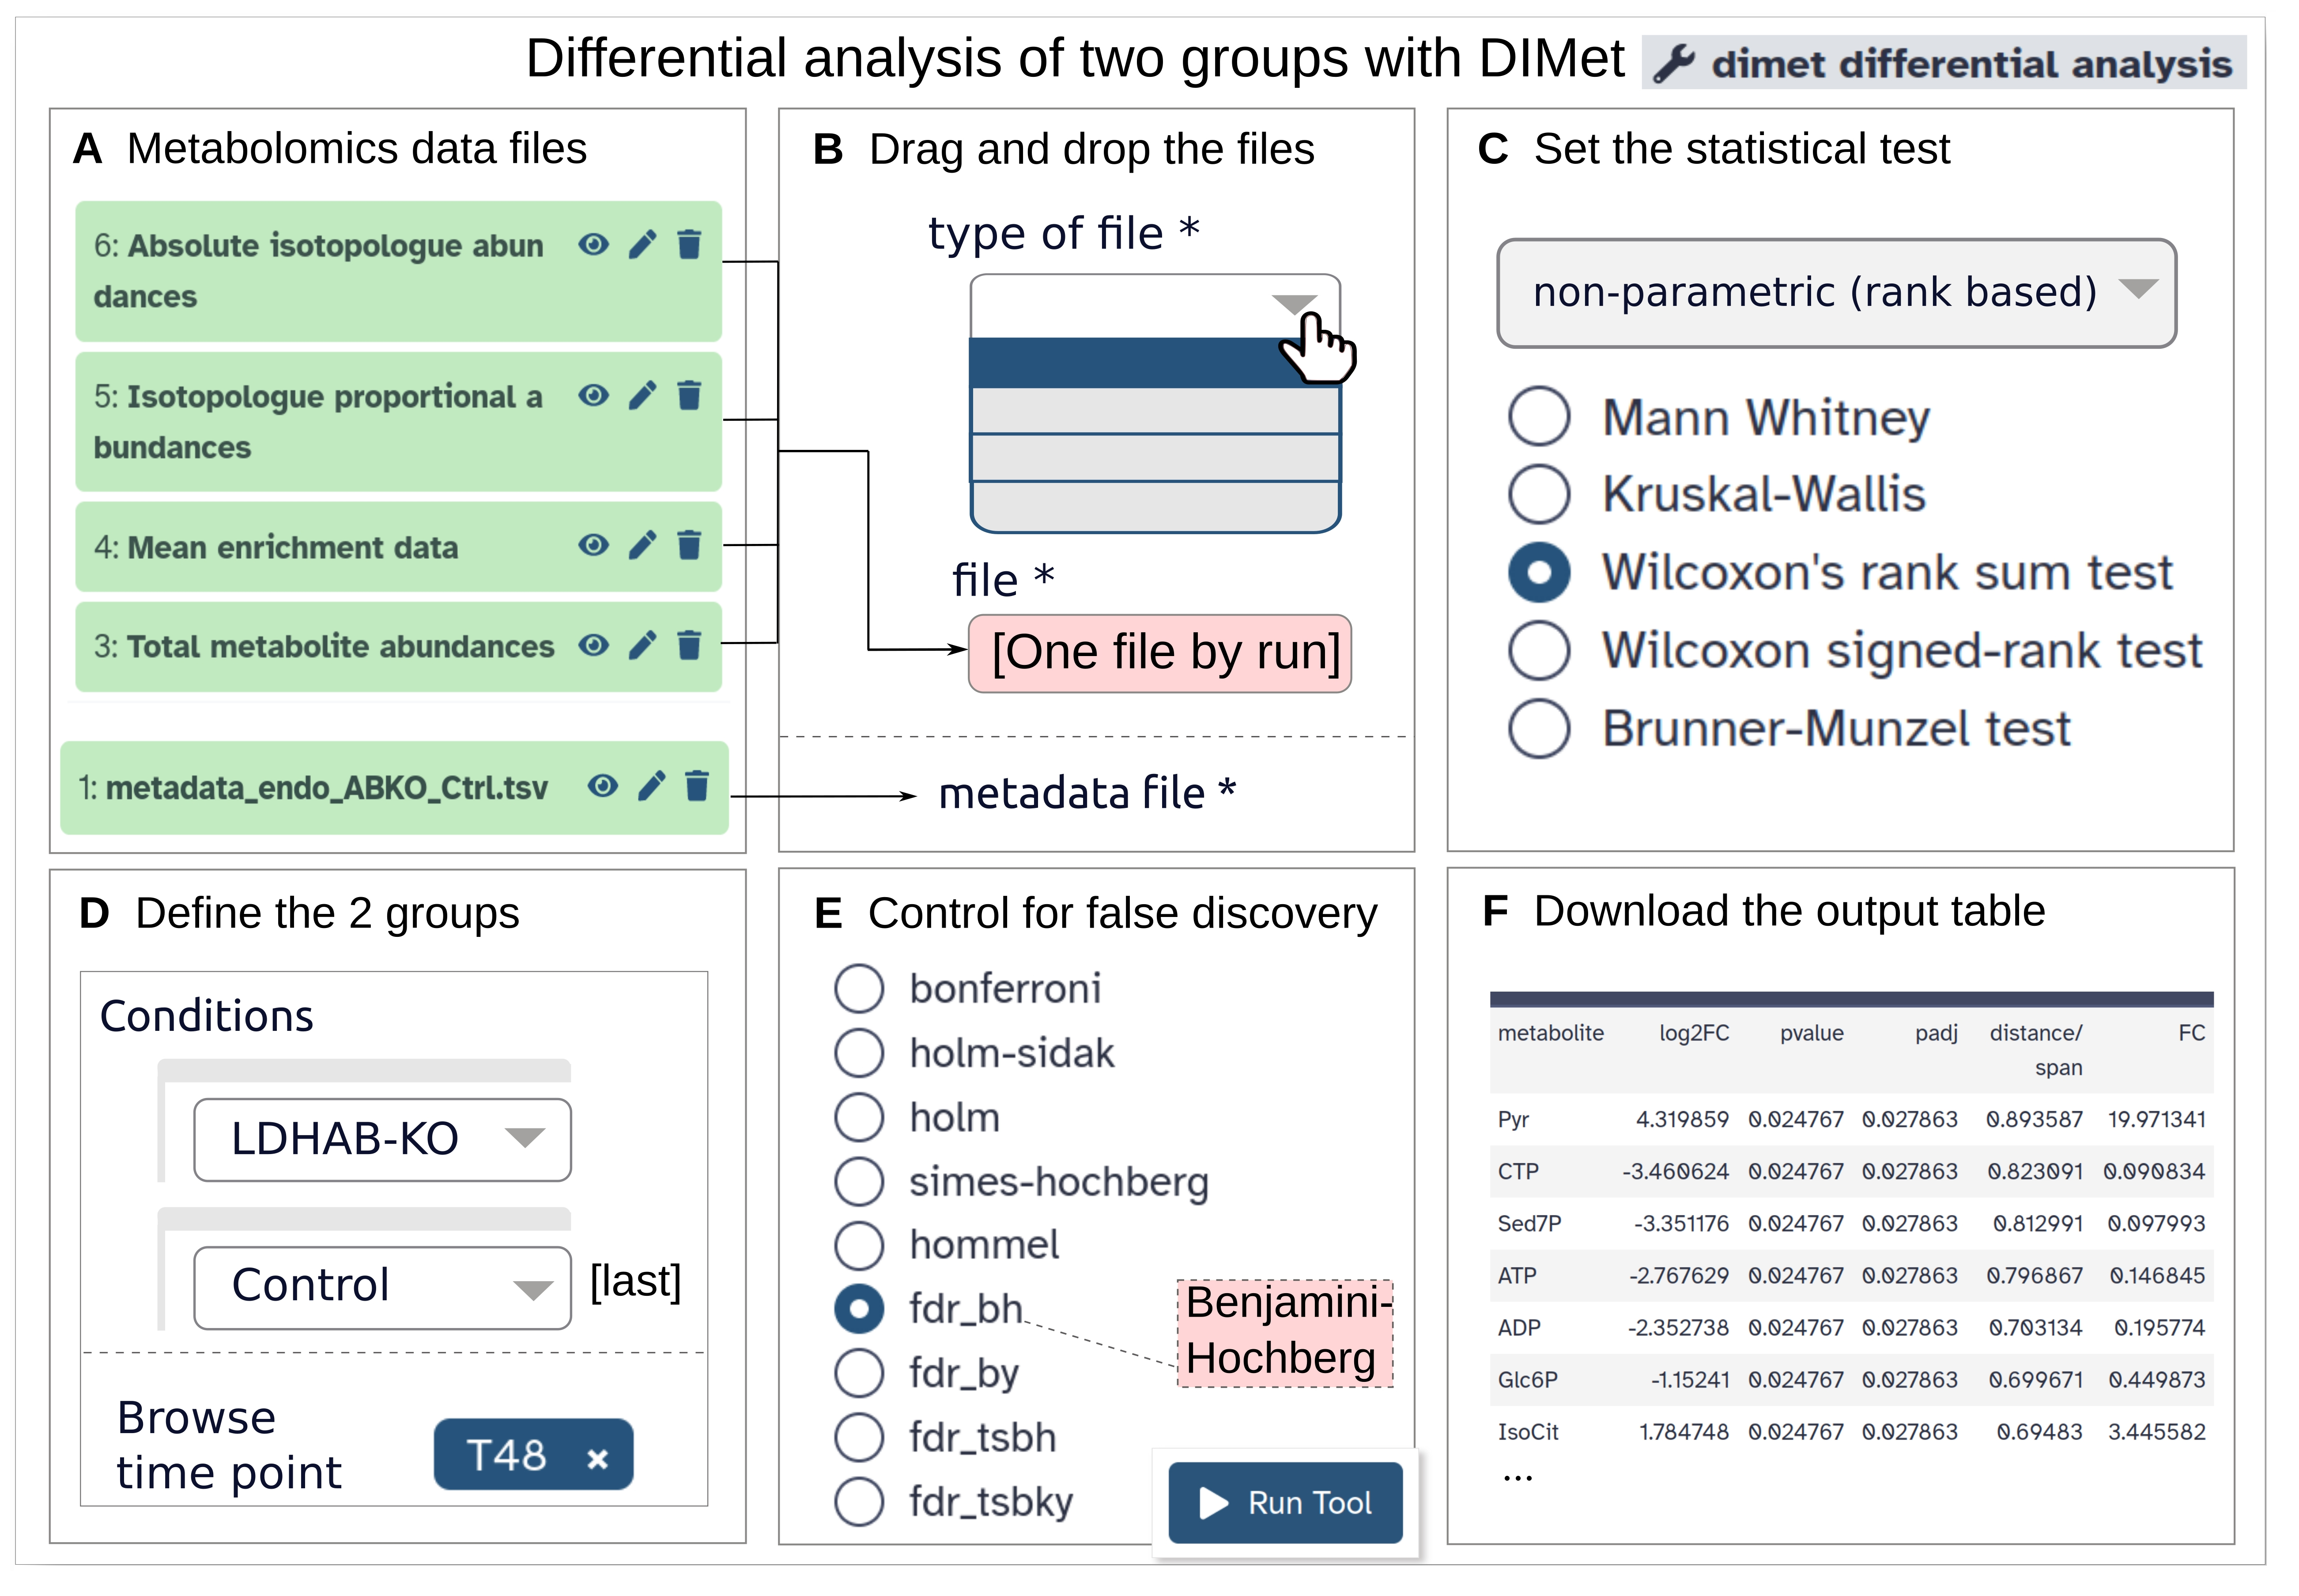
Figure 3. Differential analysis between two groups with DIMet. (A) Active files in the session. (B) Choose the type of quantification file in the drop-down menu (upper), then drag and drop the quantification file (center) and the metadata (lower) to their fields. (C) Select “Wilcoxon’s rank sum test” as the statistical test. (D) Define the two groups to be compared: in the Conditions box, set “LDHAB-KO” and “Control” in the indicated order (upper); in the browse time point menu, select T48 (lower). (E) Select fdr_bh (which corresponds to the Benjamini-Hochberg method) as the multiple test correction method and run. The output table (F) can be visualized and downloaded.
3. Drag and drop the input files as shown in Figure 3B.
4. Set the nonparametric statistical test as shown in Figure 3C.
5. Define the two groups to be compared, as indicated in Figure 3D. In this example, LDHAB-KO vs. control at T48 is compared. You can use any other time point to do this exercise.
6. Select the method for correcting multiple tests, as shown in Figure 3E (see Note 3), and then run the module.
7. Visualize the resulting output table (Figure 3F) and download it.
G. Performing the time-course analysis with DIMet
1. Open the dimet timecourse analysis module, which allows to compare consecutive time points.
2. Drag and drop one (any) of the quantification files as shown in Figure 3B and the metadata.
3. Select the statistical test and the method for multiple test correction as in the pairwise differential analysis (see section F).
4. In the Conditions box (Figure 3D, upper), specify the conditions that will be used for the analysis (note that conditions are not compared here).
5. Run the module. DIMet will automatically compare consecutive time points (tx+1 vs. tx) within each condition.
6. Once the results are available, download the output tables. The file names indicate the comparisons performed.
H. Comparing the entire labeling profiles between conditions or time points with DIMet
1. Open the dimet bivariate analysis module to compare entire labeling profiles (see Note 4).
2. Drag and drop the isotopologue proportions file as shown in Figure 3B and the metadata.
3. Select the Spearman test in the statistical test to apply radio buttons section.
4. In the Conditions box (Figure 3D), set the desired conditions. Then, select “fdr_bh” for multiple test correction (using radio buttons), as shown in Figure 3E.
5. Run the module. DIMet will automatically perform comparisons: (i) between LDHAB-KO and control samples for each time point, and (ii) tx+1 vs. tx for each condition.
6. Download the output tables. File names will indicate the performed comparisons.
I. Integrating metabolomics and transcriptomics data with DIMet
1. Open the dimet metabologram module to integrate labeled metabolomics with transcriptomics datasets in a pairwise differential analysis. Continue in the same session to reuse the total metabolite abundances file (generated in section C) and the metadata file (Figure 4A.i).
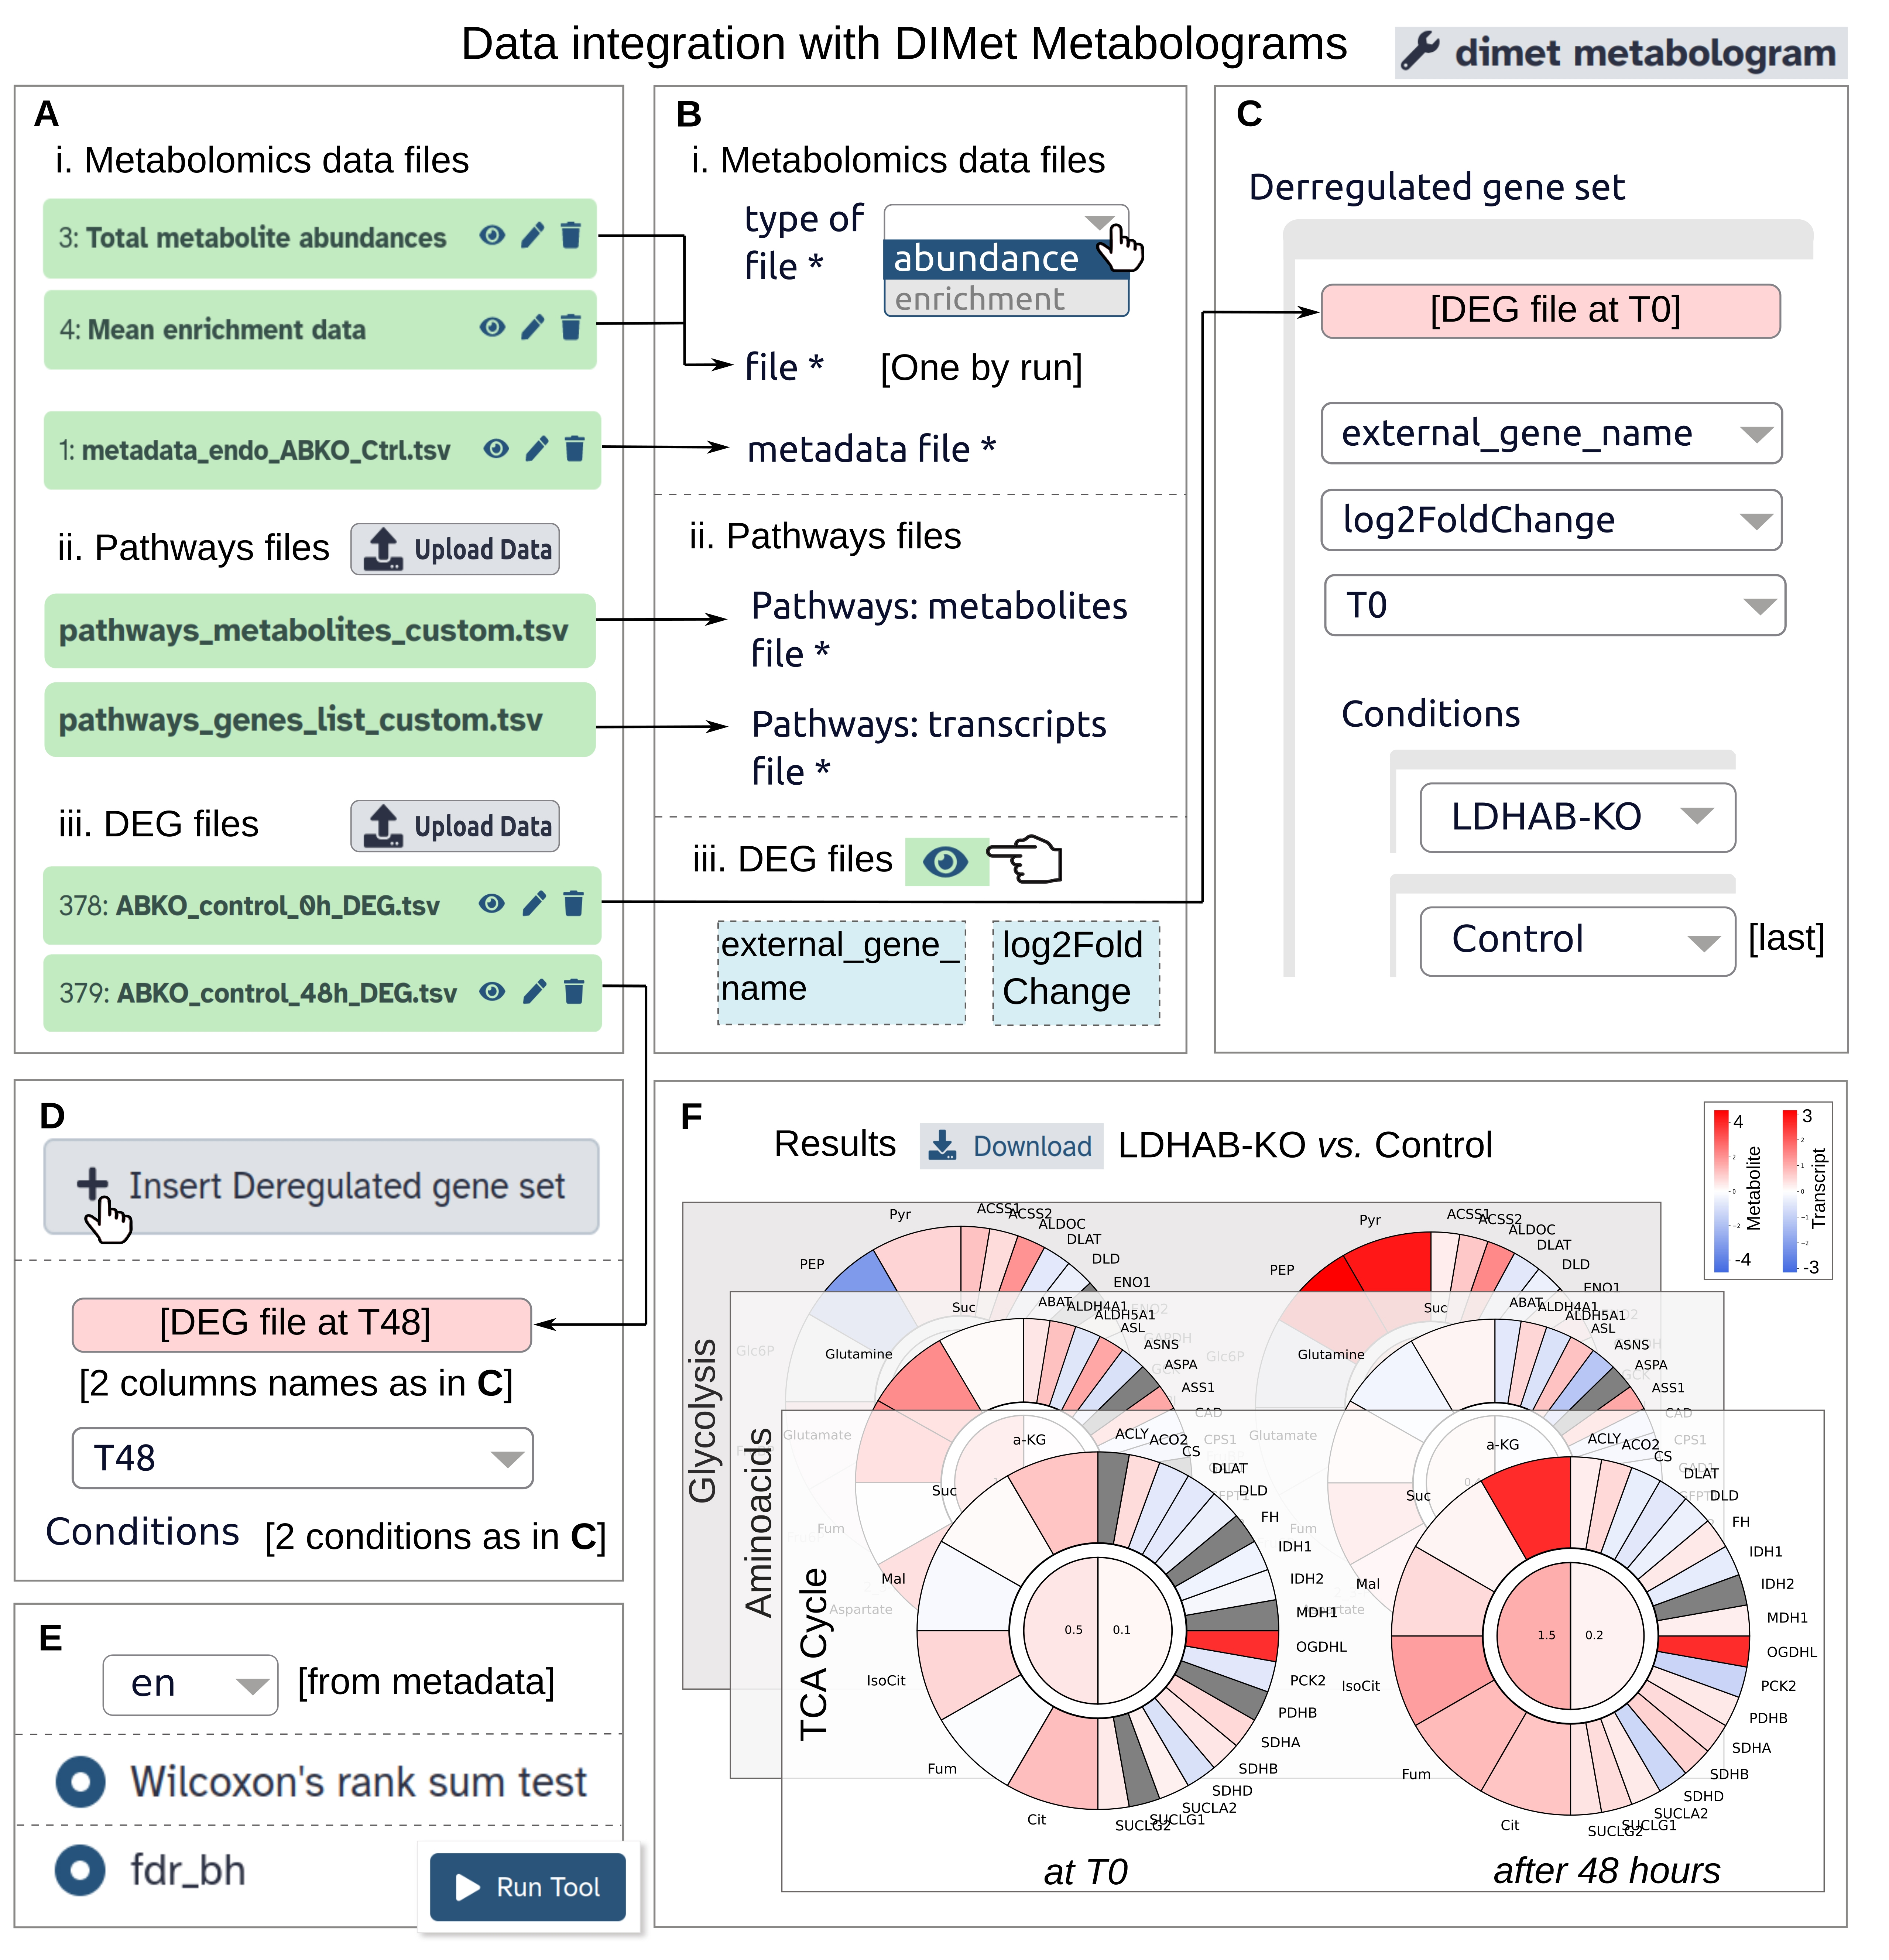
Figure 4. Integrate metabolomics and transcriptomics data with DIMet. (A) Files ready for the dimet metabologram module: the metabolomics data files (i), the two pathways files (ii), and the two differentially expressed genes (DEG) files (iii). (B) Drag and drop the metabolomics and pathways files (B.i, B.ii); quickly visualize the DEG files with the eye button (B.iii); identify the columns for gene symbols (lower-left) and the numeric data (lower-right). (C) Define the first comparison: drag and drop the T0 DEG file (C, upper). In the drop-down menus, choose the columns seen in B.iii and the time point T0 (which is read from the metadata) (C, center). Set the Conditions box as indicated (C, lower). (D) Define the second comparison: click the insert deregulated set button to open the fields; drag and drop the T48 DEG file, choose the time point T48, and set the rest of the fields as in C. (E) Set the compartment (upper), set the statistical parameters as shown (center, lower), and run. (F) Results are downloadable; each metabologram is generated as an independent figure, as well as the global legend. The downloaded figures were arranged (F) by using external graphics software (Inkscape). Note that “transcript” and “gene” are interchangeable terms for the metabolograms.
2. From the Zenodo download (https://zenodo.org/records/13741706) in section A, locate the two files containing metabolic pathway data and the two files of the differentially expressed genes (DEGs). These four files are found in the subfolder metabologram_data/. Upload the files to your Galaxy session as illustrated in Figures 4A.ii and 4A.iii.
3. Ensure that all active files appear as depicted in Figure 4A. Drag and drop the files to their respective fields as illustrated in Figures 4B, 4C, and 4D.
4. Set the comparisons to appear in the output (Figures 4C and 4D) and configure the global parameters (Figure 4E). Run the tool.
5. Once complete, download the results (Figure 4F).
Validation of protocol
This protocol was validated in two of our previously published papers. The first explored the role of lactate dehydrogenases in the metabolic plasticity of glioblastoma [2], with the analysis presented in Figure 4C and Appendix Figure S4. The second paper demonstrated the application of the DIMet tool to real tracer metabolomics datasets, including a time-series dataset from glioblastoma control cultures [6].
General notes and troubleshooting
General notes
To learn how to create and organize your own files for data analysis (such as sample metadata, pathway lists, DEG files, etc.), refer to the Help menu within the DIMet Galaxy modules. There, you will find detailed guidance on the expected content and file organization for each input type.
1. We processed the bulk RNA-seq data using a standard pipeline [2]. Briefly, after preprocessing and mapping the fastq files, the resulting raw count matrix was subjected to differential expression analysis, to obtain sets of differentially expressed genes (DEGs).
2. Principal components analysis can also generate numerical results (i.e., tables) using the dimet pca analysis module in Galaxy. The usage is identical to dimet pca plots.
3. For more detailed information about the statistical tests and multiple testing correction methods offered, refer to the supplementary material of our previous publication [6], section S3.
4. A metabolite’s labeling profile refers to the set of all its isotopologues, ordered by the number of labeled (carbon) atoms and expressed as proportions. This profile is also known as MDV (mass isotopomer distribution vector) [4].
Supplementary information
The following supporting information can be downloaded here:
1. File S1. Supplementary information related to general Galaxy usage
Acknowledgments
This work was funded by the PLBIO 2021 “Biologie et Sciences du Cancer” [N 221284] grant of the Institut National du Cancer (INCA), France. This protocol was first described and validated in Guyon et al. [2] and Galvis et al. [6].
Competing interests
There are no conflicts of interest or competing interests.
Ethical considerations
P3 cells were derived from patient donor samples; the regional ethical committee approved the collection of biopsy tissue at Haukeland University Hospital, Bergen, Norway (REK 013.09).
References
- Deshmukh, R., Allega, M. F. and Tardito, S. (2021). A map of the altered glioma metabolism. Trends Mol Med. 27(11): 1045–1059.
- Guyon, J., Fernandez‐Moncada, I., Larrieu, C. M., Bouchez, C. L., Pagano Zottola, A. C., Galvis, J., Chouleur, T., Burban, A., Joseph, K., Ravi, V. M., et al. (2022). Lactate dehydrogenases promote glioblastoma growth and invasion via a metabolic symbiosis. EMBO Mol Med. 14(12): e202115343.
- Balcells, C., Foguet, C., Tarragó-Celada, J., de Atauri, P., Marin, S. and Cascante, M. (2019). Tracing metabolic fluxes using mass spectrometry: Stable isotope-resolved metabolomics in health and disease. TrAC, Trends Anal Chem. 120: 115371.
- Buescher, J. M., Antoniewicz, M. R., Boros, L. G., Burgess, S. C., Brunengraber, H., Clish, C. B., DeBerardinis, R. J., Feron, O., Frezza, C., Ghesquiere, B., et al. (2015). A roadmap for interpreting 13 C metabolite labeling patterns from cells. Curr Opin Biotechnol. 34: 189–201.
- Jang, C., Chen, L. and Rabinowitz, J. D. (2018). Metabolomics and Isotope Tracing. Cell. 173(4): 822–837.
- Galvis, J., Guyon, J., Dartigues, B., Hecht, H., Grüning, B., Specque, F., Soueidan, H., Karkar, S., Daubon, T., Nikolski, M., et al. (2024). DIMet: an open-source tool for differential analysis of targeted isotope-labeled metabolomics data. Bioinformatics. 40(5): e1093/bioinformatics/btae282.
- Agrawal, S., Kumar, S., Sehgal, R., George, S., Gupta, R., Poddar, S., Jha, A. and Pathak, S. (2019). El-MAVEN: A Fast, Robust, and User-Friendly Mass Spectrometry Data Processing Engine for Metabolomics. In: D’Alessandro, A. (Ed.). High-Throughput Metabolomics (Vol. 1978, pp. 301–321). New York, NY: Springer New York.
- Alcoriza-Balaguer, M. I., García-Cañaveras, J. C., Benet, M., Juan-Vidal, O. and Lahoz, A. (2023). FAMetA: a mass isotopologue-based tool for the comprehensive analysis of fatty acid metabolism. Briefings Bioinf. 24(2): e1093/bib/bbad064.
- De Craemer, S., Driesen, K. and Ghesquière, B. (2022). TraVis Pies: A Guide for Stable Isotope Metabolomics Interpretation Using an Intuitive Visualization. Metabolites. 12(7): 593.
- Kiefer, P., Schmitt, U., Müller, J. E. N., Hartl, J., Meyer, F., Ryffel, F. and Vorholt, J. A. (2015). DynaMet: A Fully Automated Pipeline for Dynamic LC–MS Data. Anal Chem. 87(19): 9679–9686.
- Pang, Z., Chong, J., Zhou, G., de Lima Morais, D. A., Chang, L., Barrette, M., Gauthier, C., Jacques, P. Ã., Li, S., Xia, J., et al. (2021). MetaboAnalyst 5.0: narrowing the gap between raw spectra and functional insights. Nucleic Acids Res. 49: W388–W396.
- Millard, P., Enjalbert, B., Uttenweiler-Joseph, S., Portais, J. C. and Létisse, F. (2021). Control and regulation of acetate overflow in Escherichia coli. eLife. 10: e63661.
- Millard, P., Schmitt, U., Kiefer, P., Vorholt, J. A., Heux, S. and Portais, J. C. (2020). ScalaFlux: A scalable approach to quantify fluxes in metabolic subnetworks. PLoS Comput Biol. 16(4): e1007799.
- Daubon, T., Léon, C., Clarke, K., Andrique, L., Salabert, L., Darbo, E., Pineau, R., Guérit, S., Maitre, M., Dedieu, S., et al. (2019). Deciphering the complex role of thrombospondin-1 in glioblastoma development. Nat Commun. 10(1): 1146.
- The Galaxy Community, Abueg, L. A. L., Afgan, E., Allart, O., Awan, A. H., Bacon, W. A., Baker, D., Bassetti, M., Batut, B., Bernt, M., et al. (2024). The Galaxy platform for accessible, reproducible, and collaborative data analyses: 2024 update. Nucleic Acids Res. 52: W83–W94.
- Giacomoni, F., Le Corguille, G., Monsoor, M., Landi, M., Pericard, P., Petera, M., Duperier, C., Tremblay-Franco, M., Martin, J. F., Jacob, D., et al. (2015). Workflow4Metabolomics: a collaborative research infrastructure for computational metabolomics. Bioinformatics. 31(9): 1493–1495.
- Guitton, Y., Tremblay-Franco, M., Le Corguillé, G., Martin, J. F., Pétéra, M., Roger-Mele, P., Delabrière, A., Goulitquer, S., Monsoor, M., Duperier, C., et al. (2017). Create, run, share, publish, and reference your LC–MS, FIA–MS, GC–MS, and NMR data analysis workflows with the Workflow4Metabolomics 3.0 Galaxy online infrastructure for metabolomics. Int J Biochem Cell Biol. 93:89–101.
- Millard, P., Delépine, B., Guionnet, M., Heuillet, M., Bellvert, F. and Létisse, F. (2019). IsoCor: isotope correction for high-resolution MS labeling experiments. Bioinformatics. 35(21): 4484–4487.
Article Information
Publication history
Received: Sep 13, 2024
Accepted: Nov 20, 2024
Available online: Dec 10, 2024
Published: Jan 20, 2025
Copyright
© 2025 The Author(s); This is an open access article under the CC BY license (https://creativecommons.org/licenses/by/4.0/).
How to cite
Galvis, J., Guyon, J., Daubon, T. and Nikolski, M. (2025). Using DIMet for Differential Analysis of Labeled Metabolomics Data: A Step-by-step Guide Showcasing the Glioblastoma Metabolism. Bio-protocol 15(2): e5168. DOI: 10.21769/BioProtoc.5168.
Category
Bioinformatics and Computational Biology
Systems Biology > Metabolomics
Do you have any questions about this protocol?
Post your question to gather feedback from the community. We will also invite the authors of this article to respond.
Share
Bluesky
X
Copy link


