- Protocols

- Articles and Issues
- For Authors
- About
- Become a Reviewer

Using HBmito Crimson to Observe Mitochondrial Cristae Through STED Microscopy
(*contributed equally to this work) Published: Vol 15, Iss 1, Jan 5, 2025 DOI: 10.21769/BioProtoc.5150 Views: 1866
Reviewed by: Domenico Azarnia TehranAftab NadeemRozemarijn Van Der Veen
Original research article
The authors used this protocol in:

May 2024
Advertisement


Protocol Collections
Comprehensive collections of detailed, peer-reviewed protocols focusing on specific topics


Related protocols

Abstract
Mitochondrial cristae, formed by folding the mitochondrial inner membrane (IM), are essential for cellular energy supply. However, the observation of the IM is challenging due to the limitations in spatiotemporal resolution offered by conventional microscopy and the absence of suitable in vitro probes specifically targeting the IM. Here, we describe a detailed imaging protocol for the mitochondrial inner membrane using the Si-rhodamine dye HBmito Crimson, which has excellent photophysical properties, to label live cells for imaging via stimulated emission depletion (STED) microscopy. This allows for STED imaging over more than 500 frames (approximately one hour), with a spatial resolution of 40 nm, enabling the observation of cristae dynamics during various mitochondrial processes. The protocol includes detailed steps for cell staining, image acquisition, image processing, and resolution analysis. Utilizing the superior resolution of STED microscopy, the structure and complex dynamic changes of cristae can be visualized.
Key features
• The protocol is designed to visualize mitochondrial cristae in living cells using STED microscopy.
• The protocol enables nanoscale observation of dynamic mitochondrial cristae.
• Real-time observation of mitochondrial morphological changes, fusion, and fission events.
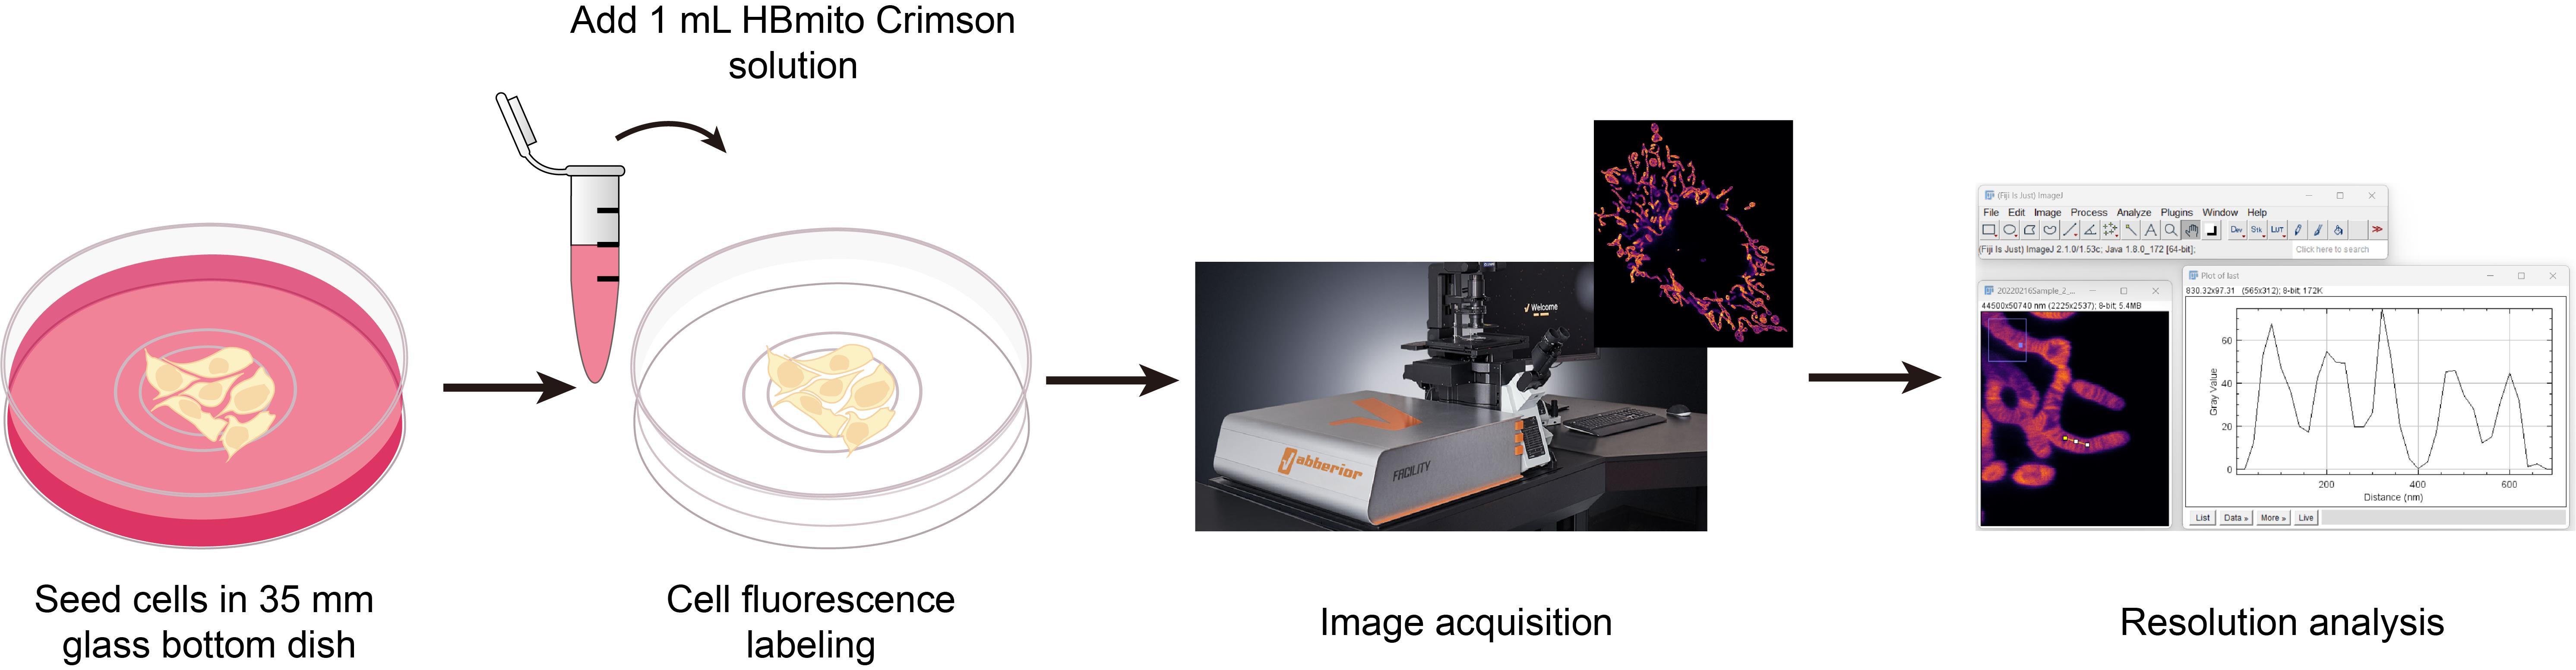
Keywords: Live cell imagingGraphical overview
Background
Mitochondria are crucial organelles responsible for ATP production, metabolic regulation, calcium homeostasis, and participation in cellular signaling processes [1–5]. The mitochondrial inner membrane (IM) is a crucial structure within mitochondria, containing the oxidative phosphorylation complexes responsible for ATP synthesis. These complexes on the IM play a key role in cellular energy supply by hosting the entire respiratory chain [6,7]. The IM folds into cristae to increase the surface area, thereby supporting greater ATP production. The shape of the cristae is altered by mitochondrial dynamics, which can affect mitochondrial respiration [8].
The diameter of mitochondria ranges from 200 to 700 nm, with cristae spacing typically around 70 nm [9]. Conventional confocal microscopy has a resolution limited to approximately 200 nm, which is insufficient to resolve the details of these structures; however, the advent of super-resolution microscopy has enabled the visualization of cristae [10]. Stimulated emission depletion (STED) microscopy, in particular, achieves high resolution by employing a doughnut-shaped depletion laser to selectively erase peripheral fluorescence following sample excitation, thereby improving the point spread function (PSF). STED technique provides a spatial resolution of 50 nm and temporal resolution of 1 frame per second, making it a powerful tool for dynamic imaging of mitochondrial cristae at the single-crista level.
In the STED system, the intensity of the depletion beam is several thousand times higher than that of the excitation beam, requiring fluorophores in the fluorescent probes to possess exceptional photostability to avoid quenching. Therefore, we have designed a novel fluorescent dye for STED imaging. HBmito Crimson is characterized by exceptional photostability, targeted accumulation on the mitochondrial IM, and emission only upon binding to the IM, as shown in Figure 1A. In pure organic solvents or water, HBmito Crimson exhibited its absorption peak at 660 nm and an emission peak at 688 nm (Figure 1B). The emission spectrum tail of HBmito Crimson extends toward 775 nm, generating a small peak near this wavelength. This reduces the dye’s saturation power, significantly enhancing the depletion efficiency of the 775 nm laser [11].
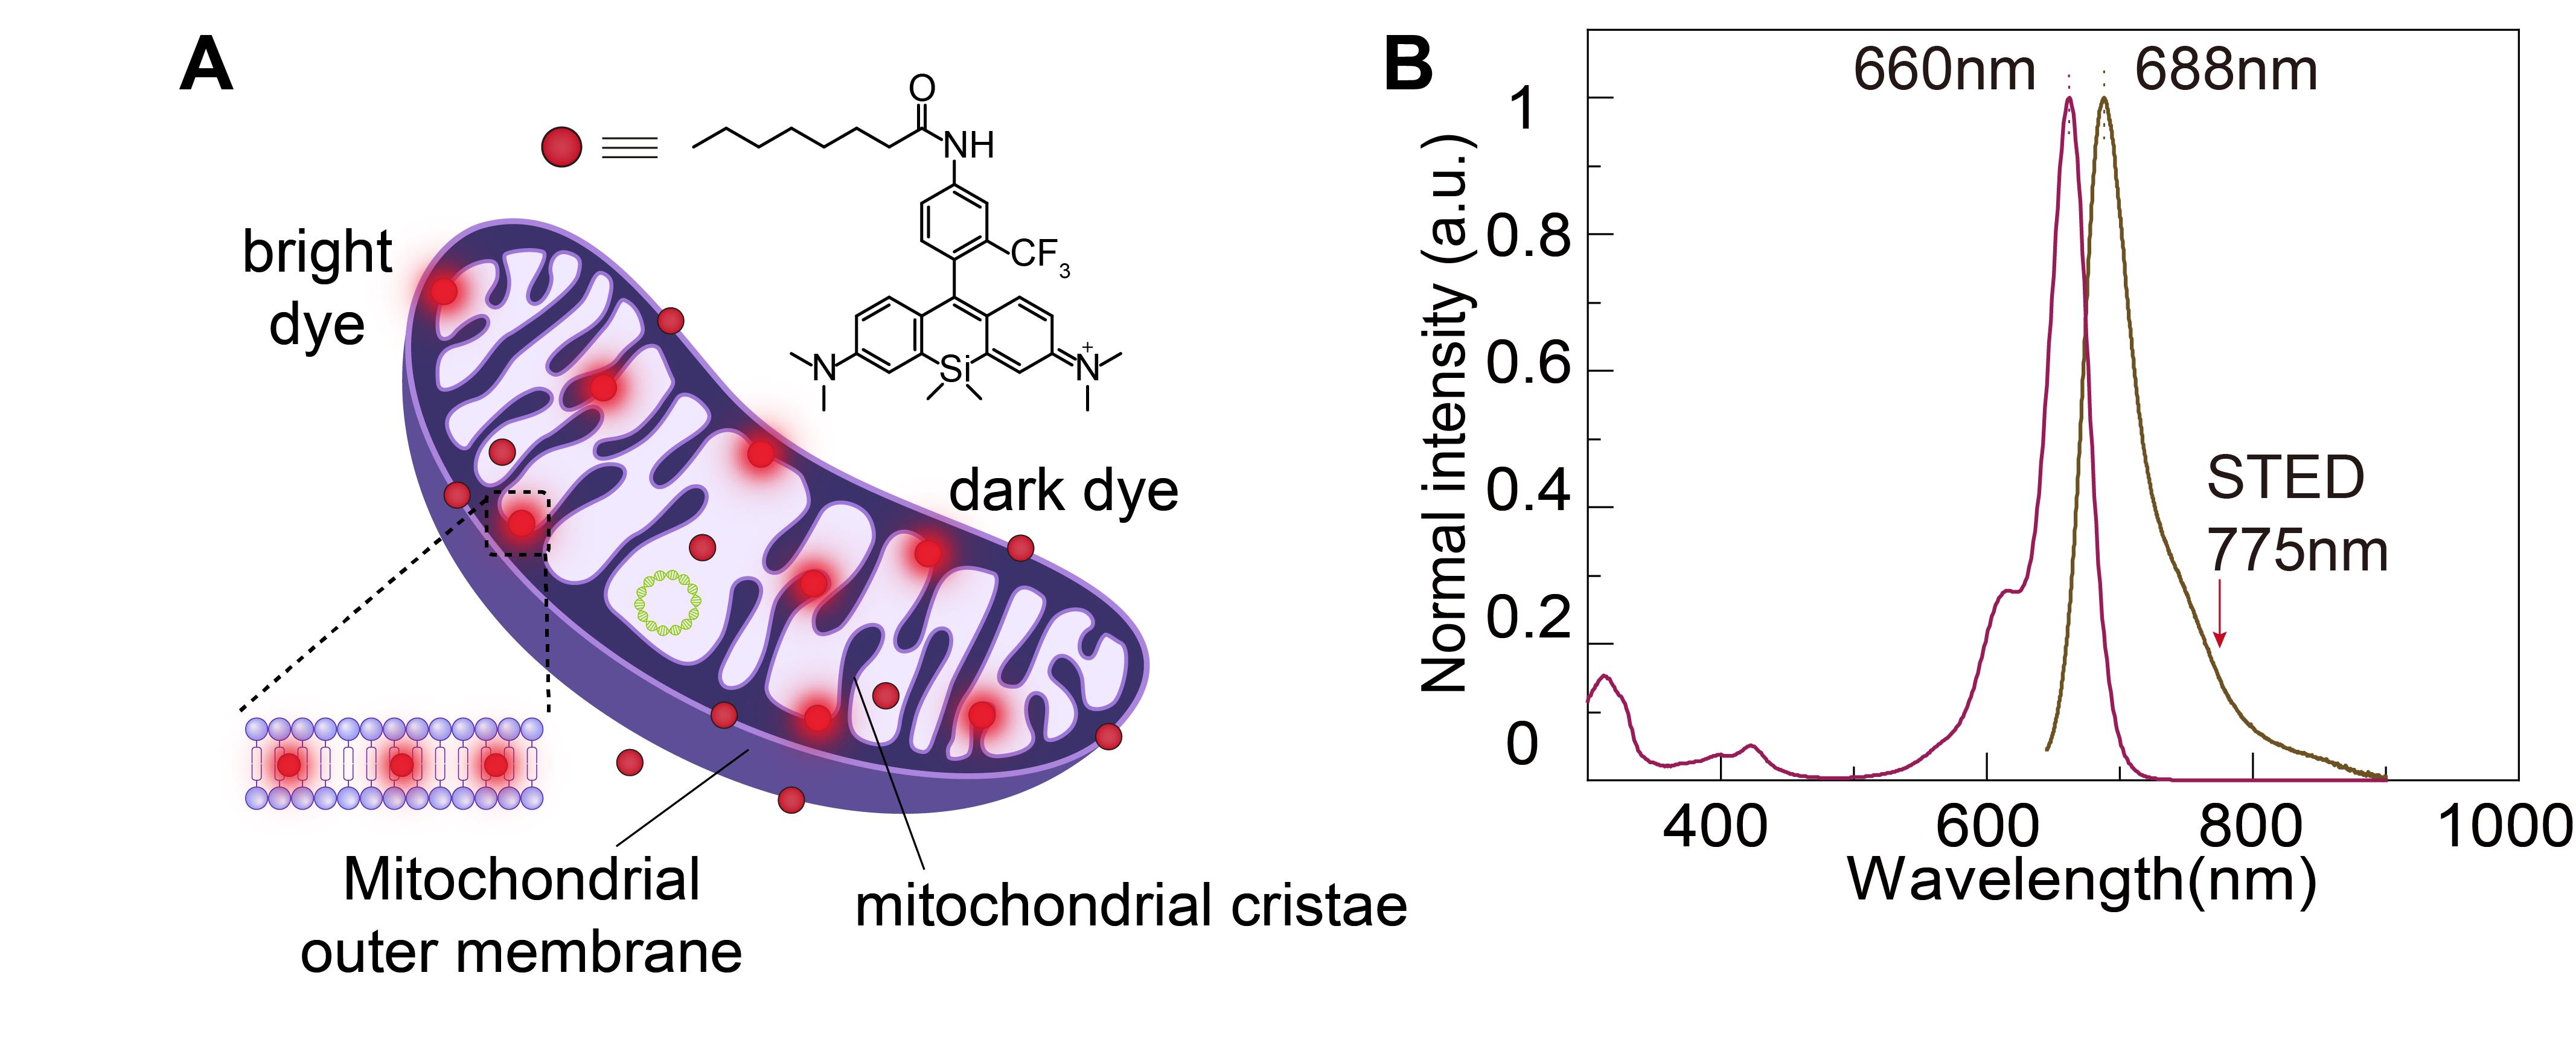
Figure 1. Structural and spectral properties of HBmito Crimson for mitochondrial labeling. A. The chemical structure of HBmito Crimson is used for the specific labeling of the mitochondrial inner membrane. B. The absorption and emission spectra of HBmito Crimson, which can be depleted using a 775 nm laser.
In this protocol, we describe in detail the preparation of cells, labeling methods with HBmito Crimson, image acquisition, and image processing methods suitable for confocal and STED microscopy imaging.
Materials and reagents
Biological materials
1. COS7 cell (ATCC, CRL-1651)
Reagents
1. Dulbecco’s modified Eagle’s medium (DMEM) (Gibco, catalog number: 11965-092), store at 4 °C
2. Fetal bovine serum (FBS) (Gibco, catalog number: 10091148), store at -20 °C
3. Penicillin/streptomycin solution (Gibco, catalog number: 15140122), store at -20 °C
4. Trypsin-EDTA solution (Gibco, catalog number: 25200056), store at -20 °C
5. Dulbecco’s phosphate buffered saline (PBS) (Gibco, catalog number: 11965-092), store at 4 °C
6. HBmito Crimson, 200 μM DMSO solution, store at -20 °C
The dyes in this article can be synthesized and purified according to the literature [11] or purchased from MedChemExpress (catalog number: HY-D2346).
7. DMSO (analytical reagent grade) (Aladdin, catalog number: D103272), store at room temperature
8. Immersion oil (Olympus, catalog number: IMMOIL-F30CC)
Solutions
1. Complete COS7 cell media (see Recipes)
2. HBmito Crimson solution (see Recipes)
3. HBmito Crimson DMSO solution (see Recipes)
Recipes
1. Complete COS7 cell media
| Reagent | Final concentration | Amount |
|---|---|---|
| DMEM | n/a | 44.5 mL |
| FBS | 10% | 5 mL |
| Penicillin/streptomycin solution | 1% | 0.5 mL |
| Total | n/a | 50 mL |
The solution should be stored at 4 °C and used within one month. Ensure that it is sterile each time it is used. FBS should be filtered through a 0.2 μm filter membrane.
2. HBmito Crimson solution
| Reagent | Final concentration | Amount |
| HBmito Crimson, 200 μM | 500 nM | 2 μL |
| COS7 cell media | n/a | Up to 1 mL |
| Total | n/a | 1 mL |
Prepare the solution before each use.
3. HBmito Crimson DMSO solution
| Reagent | Final concentration | Amount |
| HBmito Crimson, 5 mM | 5 μM | 1 μL |
| DMSO | n/a | Up to 1 mL |
| Total | n/a | 1 mL |
Prepare the solution before each use.
Laboratory supplies
1. Sterile 1.5 mL polypropylene centrifuge tubes (any vendor)
2. Sterile 50 mL polypropylene centrifuge tubes (any vendor)
3. Sterile nuclease-free filter tips (10, 200, and 1000 μL) (any vendor)
4. 35 mm glass bottom dishes, 170 μm ± 5 μm (Standard Imaging, catalog number: STGBD-035-1; Cellvis, catalog number: C35-20-1.5H)
5. Pipette tips, sterile (any vendor)
6. Cell culture flasks, vented flask surface area 25 cm2 (any vendor)
7. Pipettor (Eppendorf Research® plus) with volume ranges of 0.5–10 μL, 10–100 μL and 100–1000 μL
8. 0.2 μm filter membrane (Millex-GP, catalog number: SLGPR33RB)
Equipment
1. Abberior Facility Line (Abberior Instruments GmbH, Germany) with a 60× oil immersion objective (N.A. 1.42, Olympus, Japan)
2. Common lab equipment: cell culture incubator, safety cabinet, -20°C freezer, fridge (any vendor)
3. Microscope incubator (OKOlab, model: H301-T-UNIT-BL-PLUS)
Software and datasets
1. Abberior Imspector (16.3.14280)
2. Huygens SVI (23.10)
3. ImageJ Fiji, version 2.1.0. with Java 1.8.0_172
4. Origin (2019b)
Procedure
A. STED saturation power measurement
STED saturation power refers to the laser power required to effectively deplete the fluorescence of dye molecules. Dyes with low saturation power improve the overall quality of STED imaging, especially in high-resolution, long-term experiments. Therefore, saturation power is a key parameter for determining whether a dye is suitable for high-resolution imaging. Additionally, measuring saturation power can help estimate the optimal depletion laser intensity needed for imaging, such as in section C for setting the depletion power of HBmito Crimson. The resolution in STED microscopy can be described by the following formula:
λ is the excitation wavelength, N.A. is the numerical aperture of the microscope objective, ISTED is the intensity of the depletion laser, and Isat is the saturation intensity of the fluorophore. From the formula, it is evident that when ISTED remains constant, decreasing the saturation power Isat increases ISTED/Isat, resulting in higher resolution. Therefore, low-saturation-power probes can achieve high resolution at lower laser powers, effectively reducing photobleaching and phototoxicity.
1. Add 1 mL of HBmito Crimson DMSO solution to a 35 mm glass bottom dish.
2. Set the spatial light modulator (775 nm) mode to “none” in the background interface of the commercial STED system, transforming the depletion beam of the donut distribution into a Gaussian distribution. Set the excitation intensity to 3%, which can be calibrated according to the dye's brightness. Adjust the excitation intensity to 3%, calibrated based on the brightness of the dye. Gradually increase the depletion laser intensity from 0%, in increments of 1%–3% (approximately 2–5 mW), e.g., 0%, 2%, 4%, and so on, up to 50%. At each depletion laser intensity level, capture two images—one with the excitation laser on and one with it off. Record the average fluorescence intensity for each image.
3. For each depletion laser power, subtract the average fluorescence intensity of the excitation-off image from that of the excitation-on image. Plot the normalized fluorescence intensity against the depletion laser intensity. Fit the data to a curve and identify the point at which the fluorescence intensity decreases to 50% of its initial value. The corresponding depletion laser intensity at this point is the saturation power of the dye.
Note: Repeat the imaging and recording at each laser intensity multiple times to ensure data accuracy and reliability. Monitor the sample for photobleaching to prevent damage from excessive excitation and adjust the laser settings as needed to minimize photobleaching.
B. Sample preparation
1. In our work, COS7 cells were cultured in a cell culture flask with COS7 medium. The cells were maintained at 37 °C in a humidified atmosphere containing 5% CO2 for 2–3 days.
2. When the cells reach 80% density, remove the original COS7 medium and wash the cells with 3 mL of PBS to eliminate the residual medium. Add 1 mL of trypsin-EDTA solution for digestion for 3 min. After digestion, add 1 mL of COS7 cell medium to stop the digestion process.
3. Centrifuge the digested cells at 200× g for 3 min to collect the cell pellet.
4. Seed approximately 6 × 10⁴–9 × 10⁴ cells into 35 mm glass-bottom dishes. For optimal imaging results, ensure that the cells are evenly distributed and not overcrowded after seeding.
5. Allow the cells to grow in the incubator for 24 h. A confluence between 40%–80% is ideal for subsequent labeling and imaging procedures. If cell washing is required, the optimal imaging time is within 1 h after washing.
6. Remove the original medium and add 1 mL of HBmito Crimson solution, incubating for 10 min in a 37 °C, 5% CO2 environment. Without washing, proceed directly to STED imaging, making the necessary adjustments to meet specific experimental requirements.
Note: When preparing cells for imaging, several key factors must be considered:
Cell density: Maintain an appropriate cell density (between 40% and 80%) to ensure cell health while providing sufficient space for single-cell imaging. High cell density may lead to cell aggregation, adversely affecting image quality.
Culture medium selection: Choose an appropriate basal medium and serum for different cell lines to ensure optimal growth conditions.
Contamination control: Cells must be free of any contamination to ensure reliable imaging results. The inclusion of antibiotics in the culture medium can help prevent contamination.
C. Image acquisition
This protocol is specifically designed for use with the Abberior Facility Line, but the method can be adapted for use with other STED microscopes as well.
When acquiring live-cell imaging with fluorophores, it is crucial to select the appropriate wavelength range. Optimal excitation power, depletion laser power, pixel size, line accumulations, and dwell time should be empirically determined to maximize the signal-to-noise ratio (SNR) while minimizing photobleaching, particularly during extended time-lapse imaging. We also recommend positioning the cells in the center of the field of view (FOV), as the imaging quality is best at the center of the FOV.
Excitation power: Select an appropriate excitation wavelength based on the dye properties and experimental requirements. For HBmito Crimson, use an excitation wavelength of 640 nm. Start with a low excitation intensity (1%–5%) and gradually increase the excitation intensity in increments of 1%–3%. Determine an appropriate excitation power value based on the signal intensity observed in the image. Be cautious to avoid over-excitation, which can lead to photobleaching of the sample and prevent signal oversaturation.
Depletion laser power: Select an appropriate depletion wavelength. For HBmito Crimson, use a STED depletion laser wavelength of 775 nm. Start with a depletion laser power of 15%–20% (approximately 20–30 mW) and gradually increase the intensity in increments of 1%–3% (approximately 2–5 mW). Adjust the depletion light intensity based on the observed resolution and SNR in the images.
Pixel size: In STED microscopy, setting an appropriate pixel size is crucial to satisfy the Nyquist sampling theorem and ensure that the acquired images accurately reflect the sample's details and resolution. Pixel size should be at least 1/2 of the resolution, i.e., pixel size ≤ d/2.
Dwell time: Dwell time determines the exposure time for each pixel, thereby influencing the SNR and resolution of the image. For most samples, the setting of dwell time is typically between 1 and 10 μs. This range ensures that the image maintains an adequate SNR. If the sample signal is relatively weak, the exposure time can be increased to 10–20 μs to enhance the signal collection per pixel. A longer dwell time will improve the SNR, but it also increases the overall imaging time and the risk of photobleaching.
Line accumulations: The setting of line accumulations affects the SNR and resolution of the image. For common samples, the default line accumulations are typically set between 2 and 4 times. This range significantly enhances the SNR while avoiding excessive exposure that could lead to photobleaching. If the SNR is weak, the number of line accumulations can be increased, ensuring the sample remains stable and motionless during the acquisition process and does not shift due to prolonged acquisition times. For unstable samples, it is advisable to reduce the number of line accumulations. For experiments requiring high resolution and high SNR, consider setting line accumulations to higher values (e.g., 8 or more). Conversely, for rapid imaging needs or samples prone to photobleaching, lower line accumulations (e.g., 1–2 times) can be selected to reduce photobleaching and imaging time.
To determine the optimal imaging parameters, we recommend using the method of controlled variables, systematically altering one parameter at a time to observe its effect on image quality. This approach allows for achieving the best image quality and highest resolution.
1. Power on the microscope system, ensuring proper communication between the software and hardware, and open the Abberior Facility Line software.
2. Select the 63× oil immersion objective and apply immersion oil to the lens.
3. Place the standard beads sample on the sample holder, open the software, select the alignment function, and wait for the system dialog to display the message "alignment successful," indicating the program is complete. Ensure both excitation and depletion lasers are properly aligned.
4. Connect the live-cell incubation chamber to the microscope system. Once the environmental conditions in the incubation chamber stabilize at 37 °C, 5% CO2, and 75% humidity, add the prepared sample.
5. Use the microscope’s autofocus function to locate the sample’s focal plane. The Abberior autofocus actively stabilizes the Z-position of the sample, with continuous Z-drift compensation ensuring that focal drift does not occur during confocal and STED imaging.
6. Identify a suitable imaging area in confocal mode.
7. Adjust the imaging parameters accordingly.
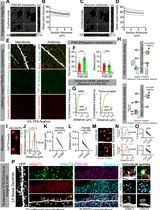
As shown in Figure 2, λEx 640 nm: 15.7 μW; λDep 775 nm: 71.2 mW; pixel size: 20 nm; line accumulations: 3; dwell time: 6.5 μs; ROI: 44.5 μm × 50.74 μm; detection wavelength: 650–750 nm.
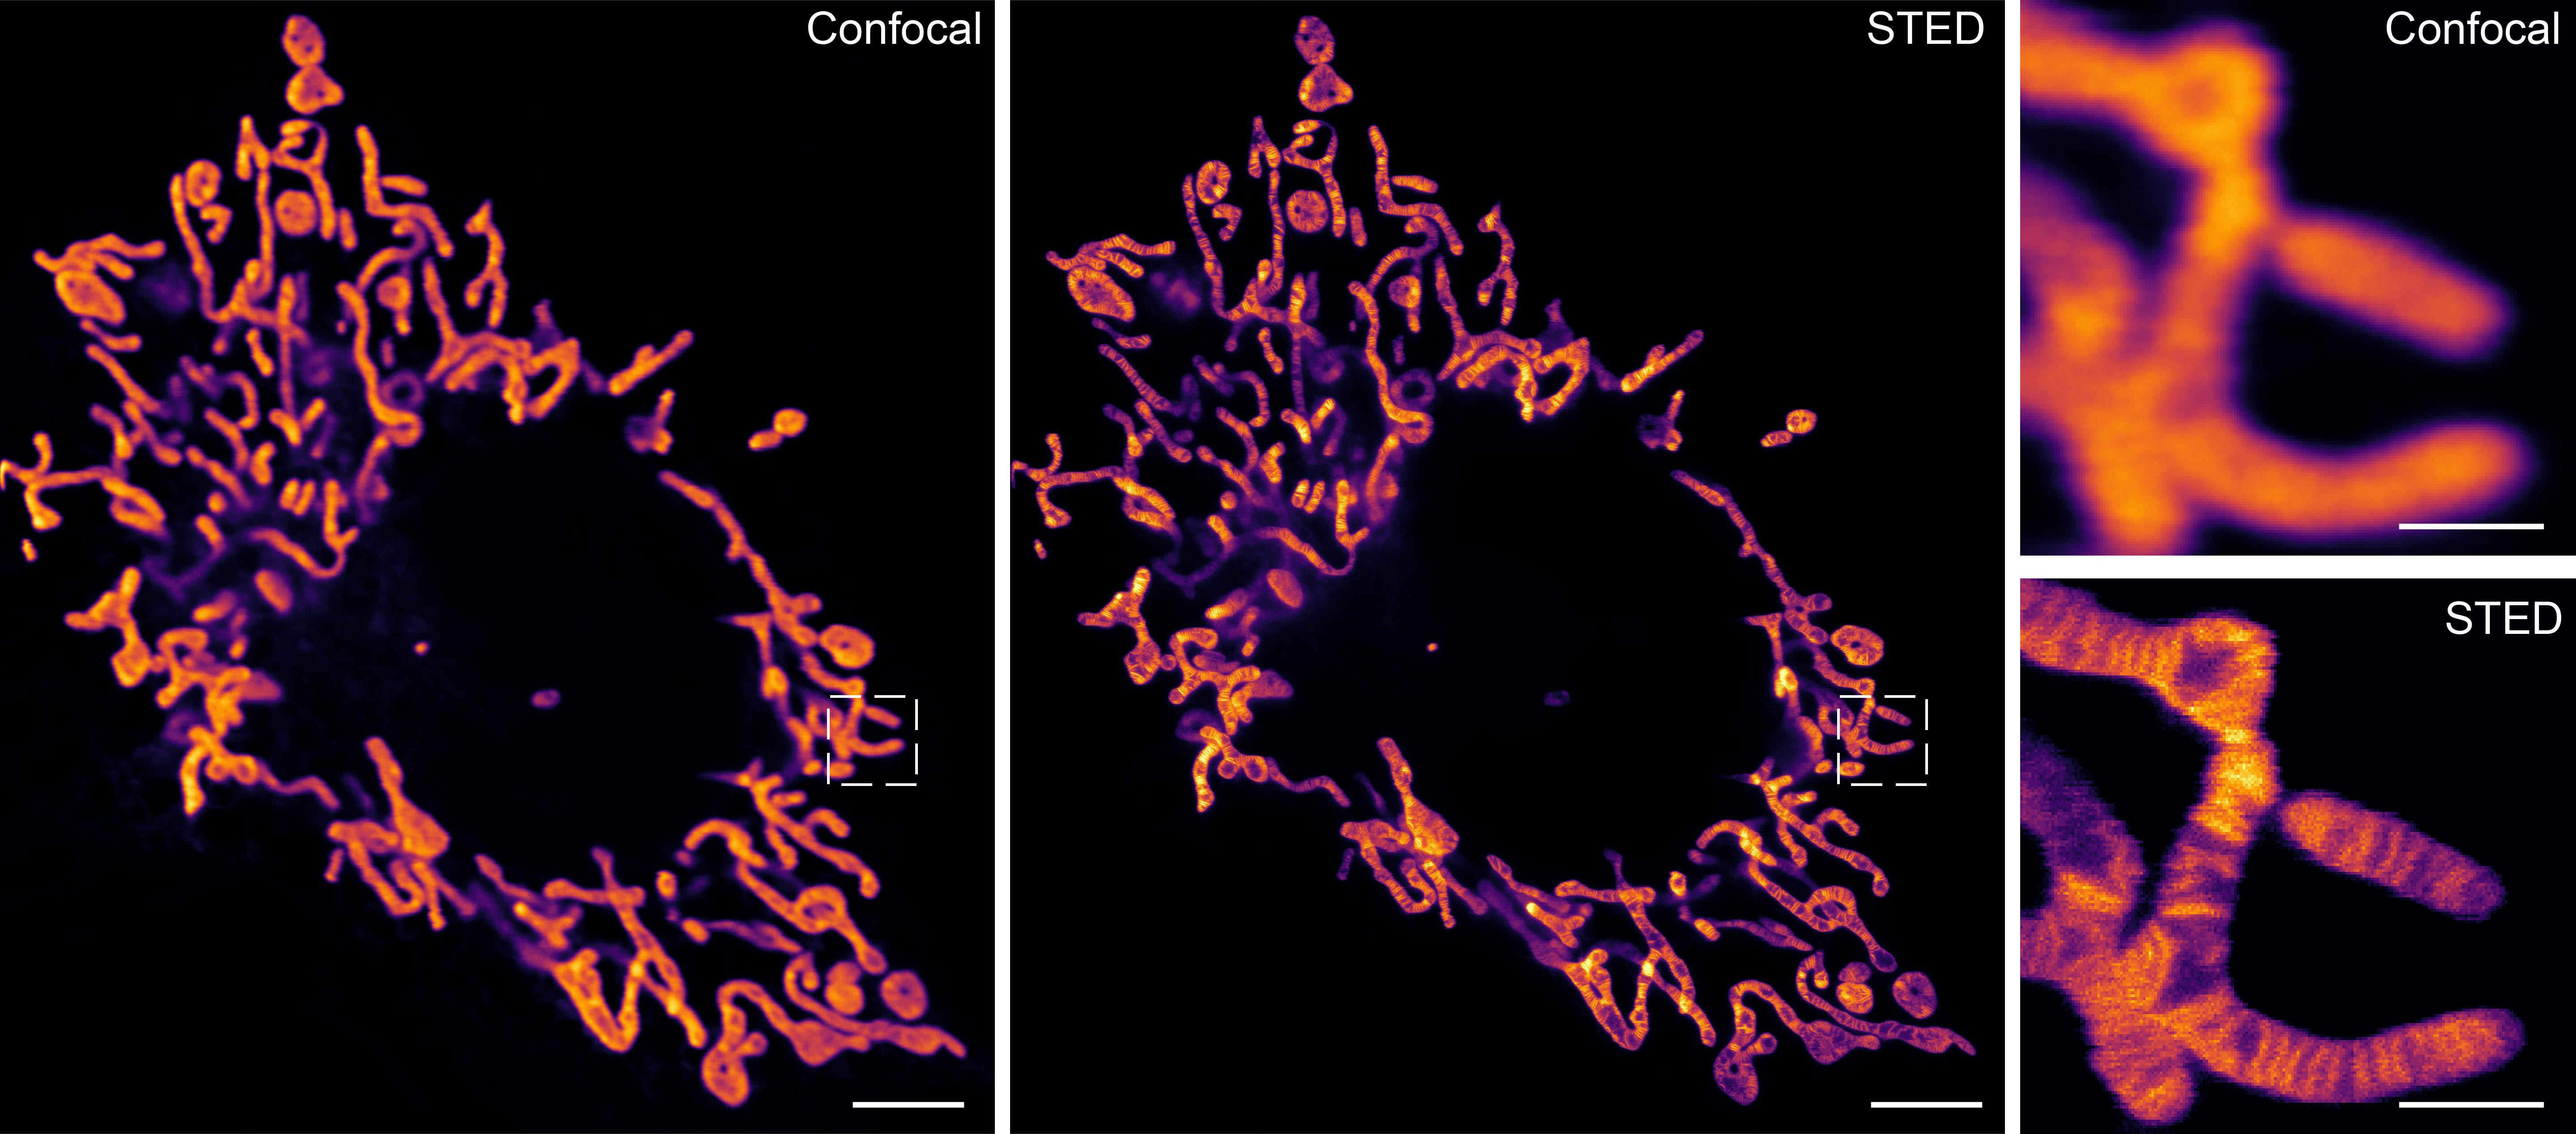
Figure 2. Comparison of confocal and STED imaging results in living COS7 cell mitochondria labeled with HBmito Crimson. Scale bar in the original image is 5 μm. Scale bar in the enlarged image is 1 μm.
8. Acquire STED images, ensuring that confocal and STED images are collected simultaneously.
9. For long-term imaging, appropriately reduce the excitation power, depletion power, line accumulations, and dwell time based on empirical observations. Depletion laser intensity can be reduced to approximately half of that used for single-frame imaging to meet the imaging requirements. Set the time intervals and number of imaging frames, then acquire images.
As shown in Figure 3, λEx 640 nm: 12.75 μW; λDep 775 nm: 34.7 mW; pixel size: 25 nm; line accumulations: 3; dwell time: 5 μs; frame time: 8.22 s; ROI: 4.75 μm × 7.025 μm; detection wavelength: 650–750 nm.
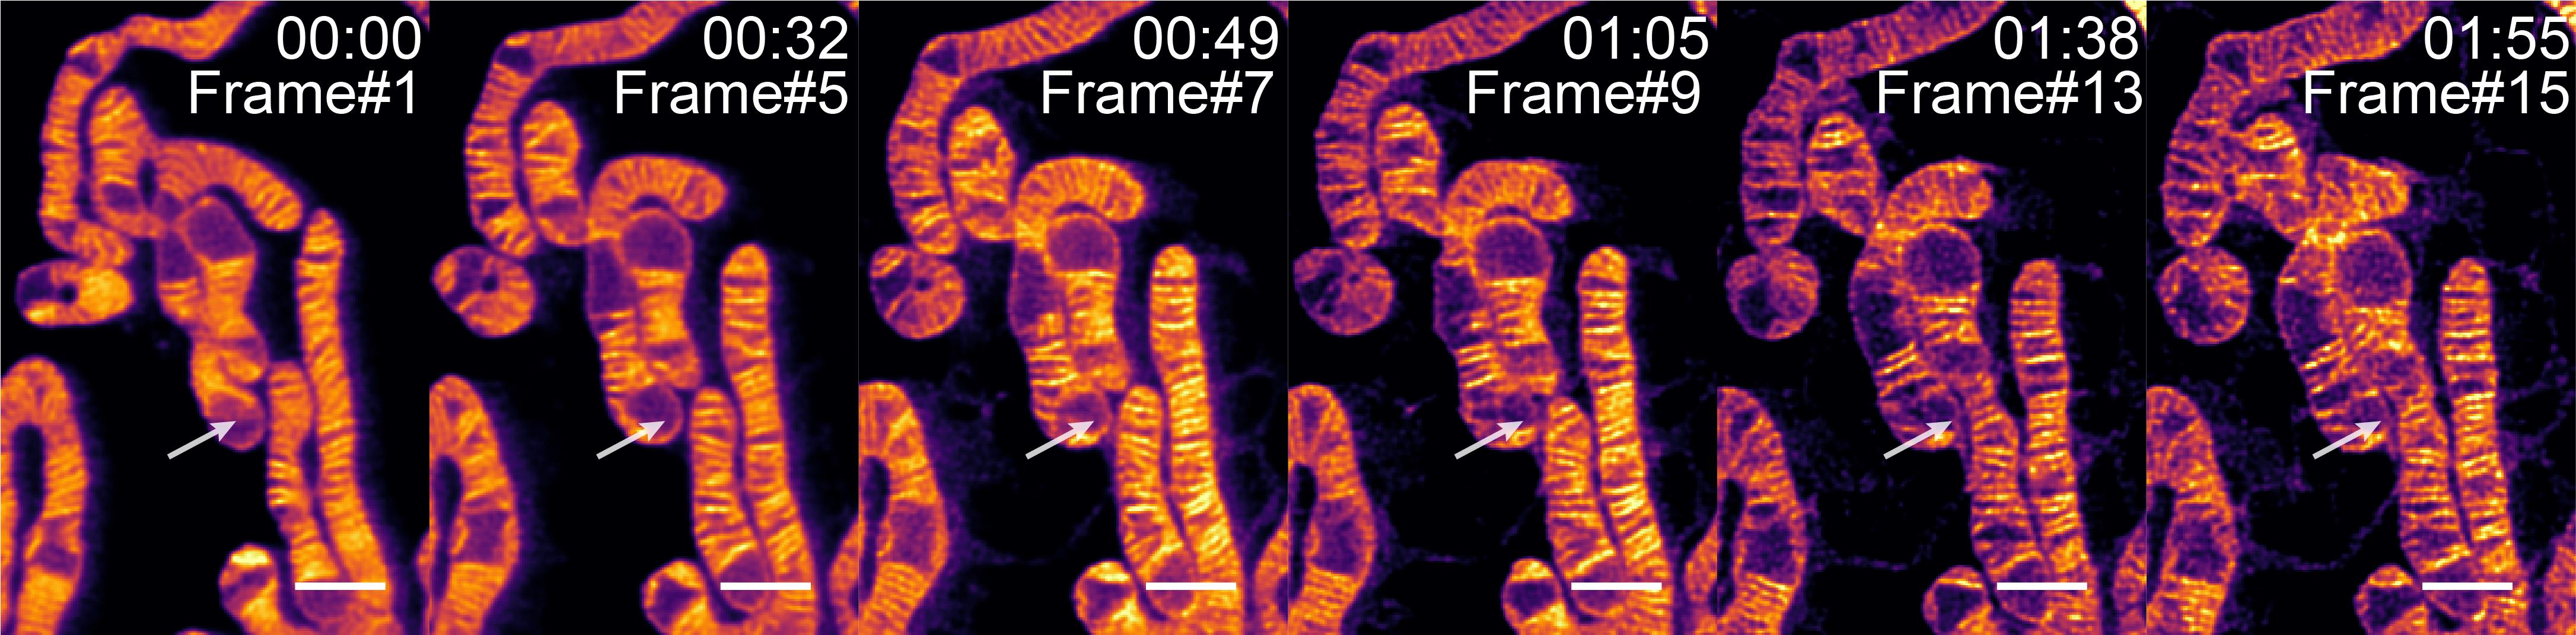
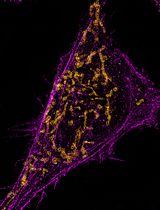
Figure 3. Long-term imaging of mitochondria in COS7 cells labeled with HBmito Crimson; white arrow indicates fusion event. Scale bar: 1 μm.
Note: When determining parameters for long-term imaging, ensure the minimal necessary laser intensity and exposure time to achieve only the required resolution. For mitochondrial cristae imaging, the minimum resolution requirement is defined as the clear visualization of cristae structures at the given power level. By utilizing these optimized settings, long-term imaging can minimize photobleaching effects, allowing for the acquisition of more frames and extending the imaging duration.
10. Save the data.
D. Extended image processing
Process single-frame images directly using Huygens software, setting post-processing parameters for each channel separately. For long-term imaging, it is recommended to first perform intensity correction, followed by batch deconvolution in Huygens software.
1. Open the Huygens Professional software. Import the image files that need deconvolution by selecting File > Open.
2. Access the image properties by selecting the image in the main window. This option can be found under the Edit menu or by right-clicking the image and selecting Properties. Set the microscope parameters accordingly:
Objective lens: Enter the numerical aperture (N.A.) and magnification of the objective lens used to acquire the images.
Excitation wavelength (λEx): Specify the excitation wavelength used during imaging.
Emission wavelength (λEm): Enter the emission wavelength corresponding to the fluorescence channel.
Voxel size: Input the pixel size (in x, y, and z dimensions) used during image acquisition.
Refractive index: Enter the refractive index of the immersion medium used (e.g., oil, water, glycerol).
Pinhole radius: If using a confocal microscope, specify the pinhole radius or size.
3. Select point spread function (PSF): In the Restoration menu, select the PSF option. If the software does not automatically detect the PSF, you can manually select or load the appropriate PSF file. Select Deconvolution Wizard from the Restoration menu. Deconvolution is typically performed using the classic maximum likelihood estimation (CMLE) algorithm, where the software automatically calculates parameters like SNR and background. These default settings are optimized to handle most images. However, parameters such as iteration count, SNR, and background can be manually adjusted to enhance image quality, especially for more complex or low-SNR images.
4. Click the Run button to start deconvolution processing.
5. After processing, use the software's visualization tool to view the deconvolved image.
6. Save the processed image by selecting Save As from the File menu. Save the image in common formats such as TIFF, JPEG, or other available formats.
7. Use the Batch Processor tool to perform batch deconvolution processing on multiple image files. After setting the batch processing parameters and file path, click the Start Batch button to start processing.
Data analysis
The resolution of the STED images is analyzed based on the full width at half maximum (FWHM) of mitochondrial structures. This analysis provides a quantitative measure of the system's resolution, allowing us to accurately assess the spatial resolution achieved during imaging.
1. Launch ImageJ software and open the desired image by selecting File > Open.
2. Duplicate the field of image to be analyzed. Use the Straight Line function in ImageJ to select multiple cristae within this area, as shown in Figure 4, and generate the signal intensity profile at the specified location following the direction indicated by the arrows.
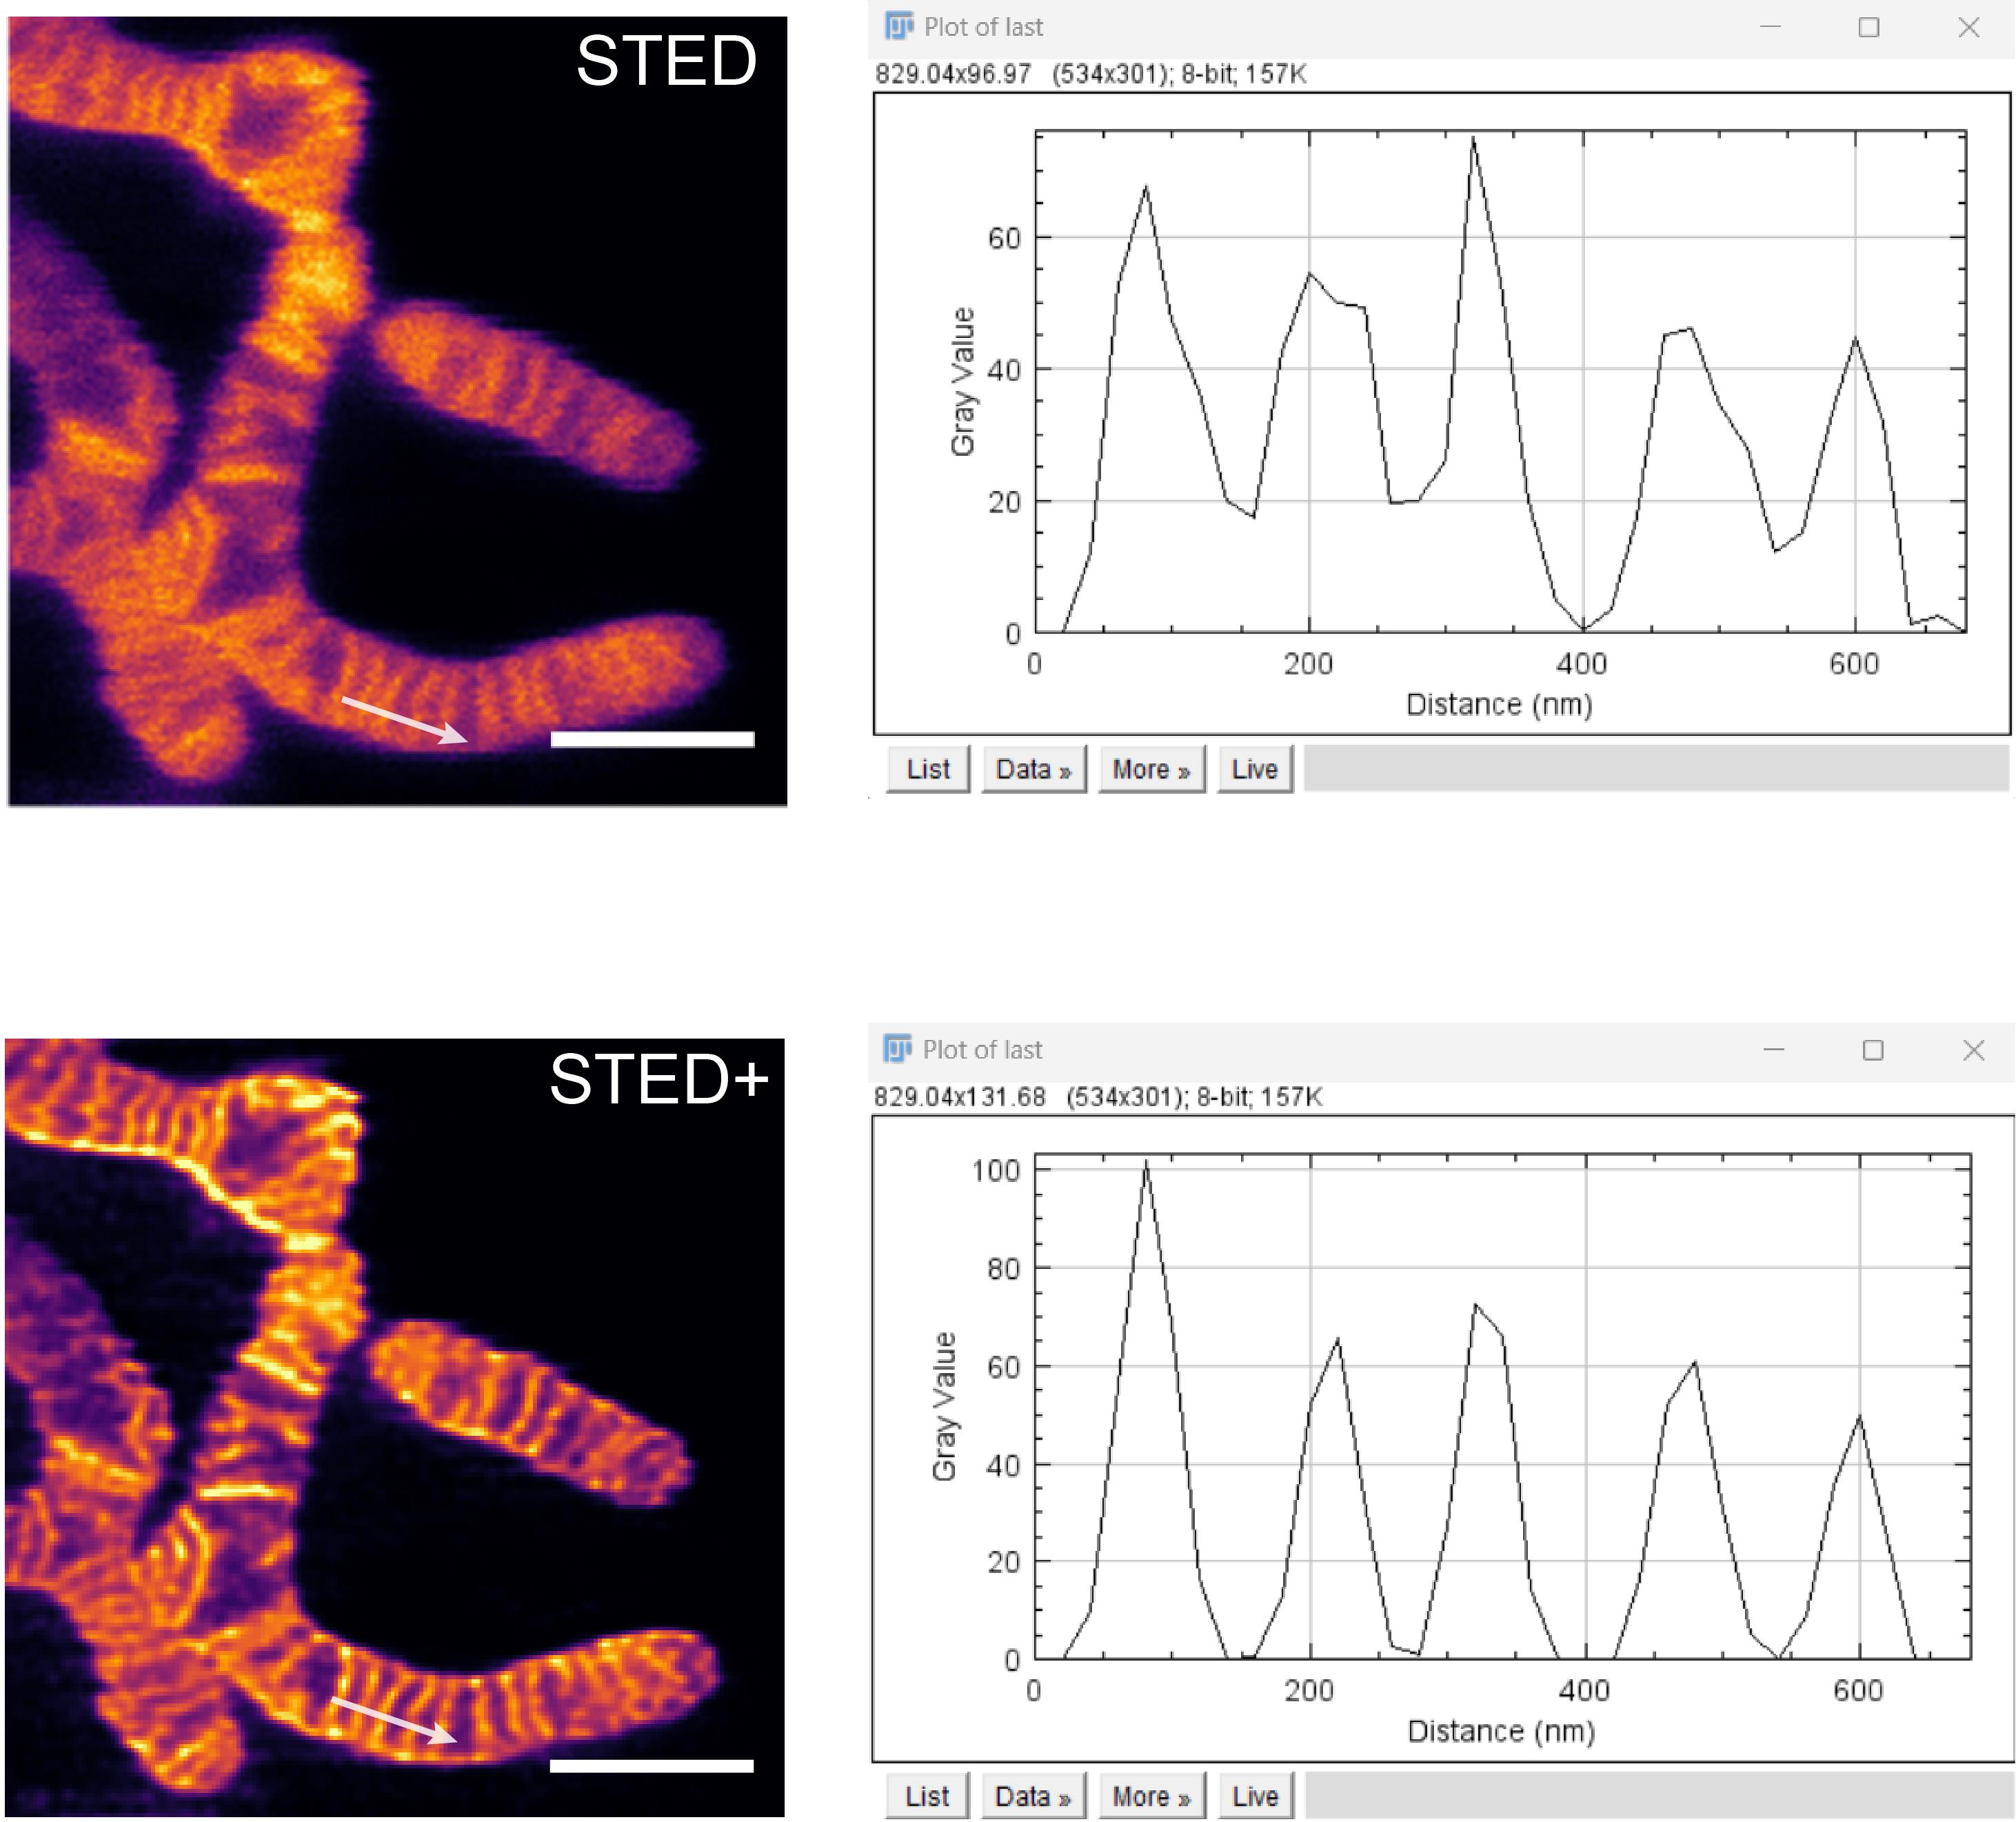
Figure 4. Enlarged STED and STED+ results and fluorescence signal intensity profile correspond to the white arrow. Scale bar: 1 μm. Results were processed with the commercial deconvolution software Huygens (SVI, Netherlands).
3. Utilize the Analyze > Plot Profile function in ImageJ to obtain the signal intensity profile. Click List to open the intensity values, then copy these values into Origin software.
4. In Origin, apply a Gaussian Fit to derive the Gaussian fitting curve, as shown in Figure 5.
5. From the Gaussian fit, calculate the standard deviation (σ). Use the formula FWHM = 2.355 × σ to determine the FWHM of the image.
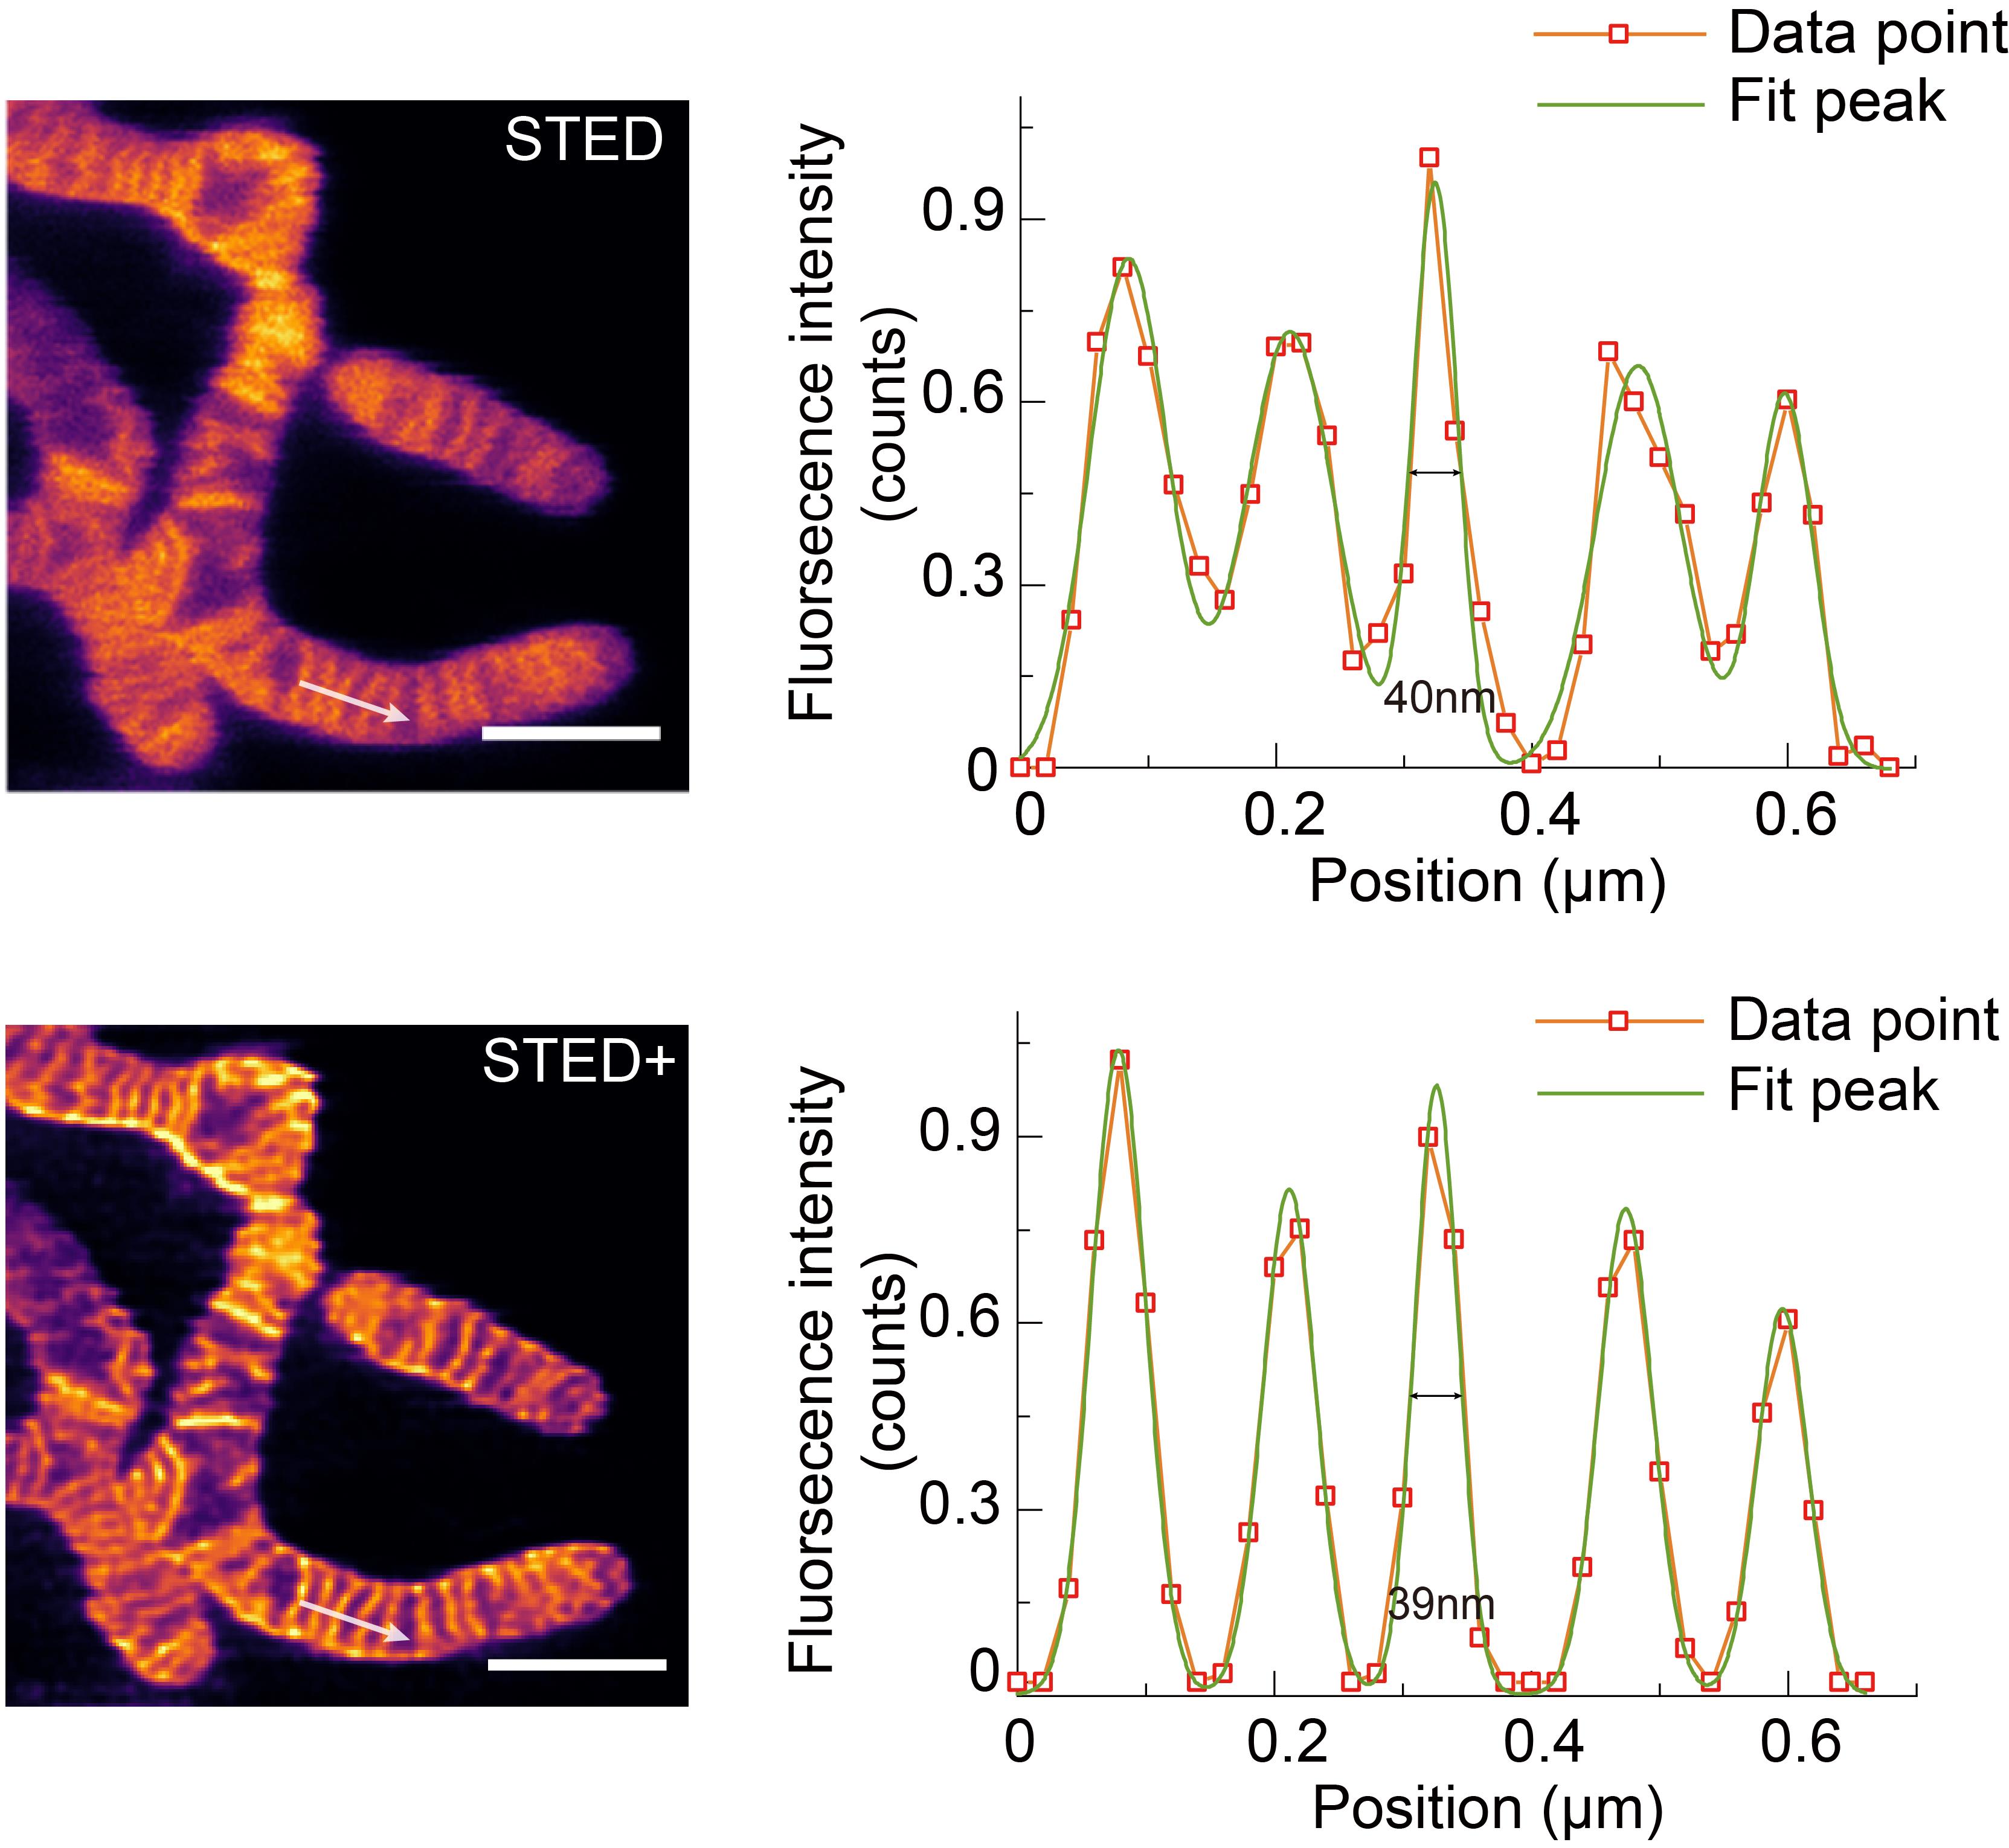
Figure 5. STED and STED+ results and the fitted fluorescence signal intensity distribution correspond to the white arrows. Scale bar: 1 μm.
Validation of protocol
This protocol or parts of it has been used and validated in the following research article:
Ren et al [11]. Visualization of cristae and mtDNA interactions via STED nanoscopy using a low saturation power probe. (Figures 2–6).
General notes and troubleshooting
General notes
1. The dye concentration must be carefully optimized; neither too high nor too low. The recommended dye concentration of HBmito Crimson is 500 nM and the dyeing time is 10 min. Adjustments can be made according to the specific experimental requirements.
2. Select an appropriate laser wavelength for excitation based on the specific dye.
3. Calibrate the excitation and depletion lasers of the STED system to achieve optimal STED performance.
4. Maintaining stable laboratory temperature and humidity is essential to avoid environmental fluctuations that could impact microscope performance.
Troubleshooting
Problem 1: Motion artifacts in STED imaging
Possible cause: Sample jitter or mitochondrial movement.
Solution: It is essential to ensure the sample remains stable and motionless during imaging. In live-cell imaging, slow imaging speeds can lead to mitochondrial movement, resulting in motion artifacts. The imaging speed is limited by pixel dwell time and the line accumulations. Therefore, it is important to minimize line accumulations and dwell time while ensuring sufficient fluorescence signal collection. Additionally, reducing the FOV can help increase imaging speed and reduce the impact of mitochondrial movement.
Problem 2: Insufficient resolution in STED images
Possible cause: Improper alignment of the STED optical path or suboptimal parameter settings.
Solution: Ensure that the system is correctly calibrated. After calibration, image standard 40 nm beads. Perform Gaussian fitting on the signal intensity of individual beads to obtain their FWHM. If the FWHM reaches 40 nm, the system is in good condition. During sample imaging, improper parameter settings can lead to insufficient resolution. Refer to the parameter setting recommendations in the procedure. When adjusting parameters, avoid repeatedly imaging the same FOV to minimize photobleaching effects.
Acknowledgments
This protocol is related to the following paper: Ren et al. Visualization of cristae and mtDNA interactions via STED nanoscopy using a low saturation power probe. DOI: 10.1038/s41377-024-01463-9. This work was supported by the National Key R&D Program of China (2022YFC3401100), National Natural Science Foundation of China (22177024, 62025501, 31971376, 92150301), and Central Guidance Fund for Local Science and Technology Development (246Z1302G). We thank the National Center for Protein Sciences at Peking University in Beijing, China, for assistance with STED super-resolution imaging. We thank Abberior China and Optofem Technology Limited for providing Facility Line STED and Huygens software.
Competing interests
B.G. is an inventor of the awarded patent (ZL202011401937.1) of HBmito Crimson. The other authors declare no competing interests.
Ethical considerations
There are no ethical considerations associated with this protocol.
References
- Spinelli, J. B. and Haigis, M. C. (2018). The multifaceted contributions of mitochondria to cellular metabolism. Nat Cell Biol. 20(7): 745–754. https://doi.org/10.1038/s41556-018-0124-1
- Tan, J. X. and Finkel, T. (2020). Mitochondria as intracellular signaling platforms in health and disease. J Cell Biol. 219(5): e202002179. https://doi.org/10.1083/jcb.202002179
- Rizzuto, R., De Stefani, D., Raffaello, A. and Mammucari, C. (2012). Mitochondria as sensors and regulators of calcium signaling. Nat Rev Mol Cell Biol. 13(9): 566–578. https://doi.org/10.1038/nrm3412
- Lill, R., Hoffmann, B., Molik, S., Pierik, A. J., Rietzschel, N., Stehling, O., Uzarska, M. A., Webert, H., Wilbrecht, C., and Mühlenhoff, U. (2012). The role of mitochondria in cellular iron-sulfur protein biogenesis and iron metabolism. Biochim Biophys Acta. 1823(9): 1491–1508. https://doi.org/10.1016/j.bbamcr.2012.05.009
- Friedman, J. R. and Nunnari, J. (2014). Mitochondrial form and function. Nature. 505(7483): 335–343. https://doi.org/10.1038/nature12985
- Baker, N., Patel, J. and Khacho, M. (2019). Linking mitochondrial dynamics, cristae remodeling and supercomplex formation: How mitochondrial structure can regulate bioenergetics. Mitochondrion. 49: 259–268. https://doi.org/10.1016/j.mito.2019.06.003
- Cogliati, S., Enriquez, J. A. and Scorrano, L. (2016). Mitochondrial Cristae: Where Beauty Meets Functionality. Trends Biochem Sci. 41(3): 261–273. https://doi.org/10.1016/j.tibs.2016.01.001
- Kondadi, A. K., Anand, R., and Reichert, A. S. (2020). Cristae Membrane Dynamics-A Paradigm Change. Trends Cell Biol. 30(12): 923–936. https://doi.org/10.1016/j.tcb.2020.08.008
- Liu, T., Stephan, T., Chen, P., Keller-Findeisen, J., Chen, J., Riedel, D., Yang, Z., Jakobs, S. and Chen, Z. (2022). Multi-color live-cell STED nanoscopy of mitochondria with a gentle inner membrane stain. Proc Natl Acad Sci USA. 119(52): e2215799119. https://doi.org/10.1073/pnas.2215799119
- Stephan, T., Roesch, A., Riedel, D. and Jakobs, S. (2019). Live-cell STED nanoscopy of mitochondrial cristae. Sci Rep. 9(1): e1038/s41598–019–48838–2. https://doi.org/10.1038/s41598-019-48838-2
- Ren, W., Ge, X., Li, M., Sun, J., Li, S., Gao, S., Shan, C., Gao, B. and Xi, P. (2024). Visualization of cristae and mtDNA interactions via STED nanoscopy using a low saturation power probe. Light Sci Appl. 13(1): 116. https://doi.org/10.1038/s41377-024-01463-9
Article Information
Publication history
Received: Aug 11, 2024
Accepted: Oct 27, 2024
Available online: Nov 27, 2024
Published: Jan 5, 2025
Copyright
© 2025 The Author(s); This is an open access article under the CC BY-NC license (https://creativecommons.org/licenses/by-nc/4.0/).
How to cite
Ge, X., Ren, W., Shan, C., Xi, P. and Gao, B. (2025). Using HBmito Crimson to Observe Mitochondrial Cristae Through STED Microscopy. Bio-protocol 15(1): e5150. DOI: 10.21769/BioProtoc.5150.
Category
Biophysics > Biophotonics
Cell Biology > Cell imaging > Super resolution imaging
Cell Biology > Cell staining > Organelle
Do you have any questions about this protocol?
Post your question to gather feedback from the community. We will also invite the authors of this article to respond.