- Protocols

- Articles and Issues
- For Authors
- About
- Become a Reviewer

Muscle Biopsy Sample Preparation and Proteomics Analysis Based on UHPLC-MS/MS
(*contributed equally to this work) Published: Vol 14, Iss 24, Dec 20, 2024 DOI: 10.21769/BioProtoc.5137 Views: 1917
Reviewed by: Amit Kumar DeyAnonymous reviewer(s)
Original research article
The authors used this protocol in:

Apr 2024

Protocol Collections
Comprehensive collections of detailed, peer-reviewed protocols focusing on specific topics


Related protocols

Abstract
Proteomics analysis is crucial for understanding the molecular mechanisms underlying muscle adaptations to different types of exercise, such as concentric and eccentric training. Traditional methods like two-dimensional gel electrophoresis and standard mass spectrometry have been used to analyze muscle protein content and modifications. This protocol details the preparation of muscle samples for proteomics analysis using ultra-high-performance liquid chromatography (UHPLC). It includes steps for muscle biopsy collection, protein extraction, digestion, and UHPLC-based analysis. The UHPLC method offers high-resolution separation of complex protein mixtures, providing more detailed and accurate proteomic profiles compared to conventional techniques. This protocol significantly enhances sensitivity, reproducibility, and efficiency, making it ideal for comprehensive muscle proteomics studies.
Key features
• Developed for analyzing muscle adaptations in response to concentric and eccentric training, applicable to various physiology exercise studies.
• Utilizes UHPLC-MS/MS for high-resolution separation and detailed proteomic profiling.
• Requires access to advanced UHPLC-MS/MS equipment and muscle biopsy collection tools.
• The protocol can be completed within one week, including sample preparation and analysis.
Keywords: Muscle proteomicsGraphical overview
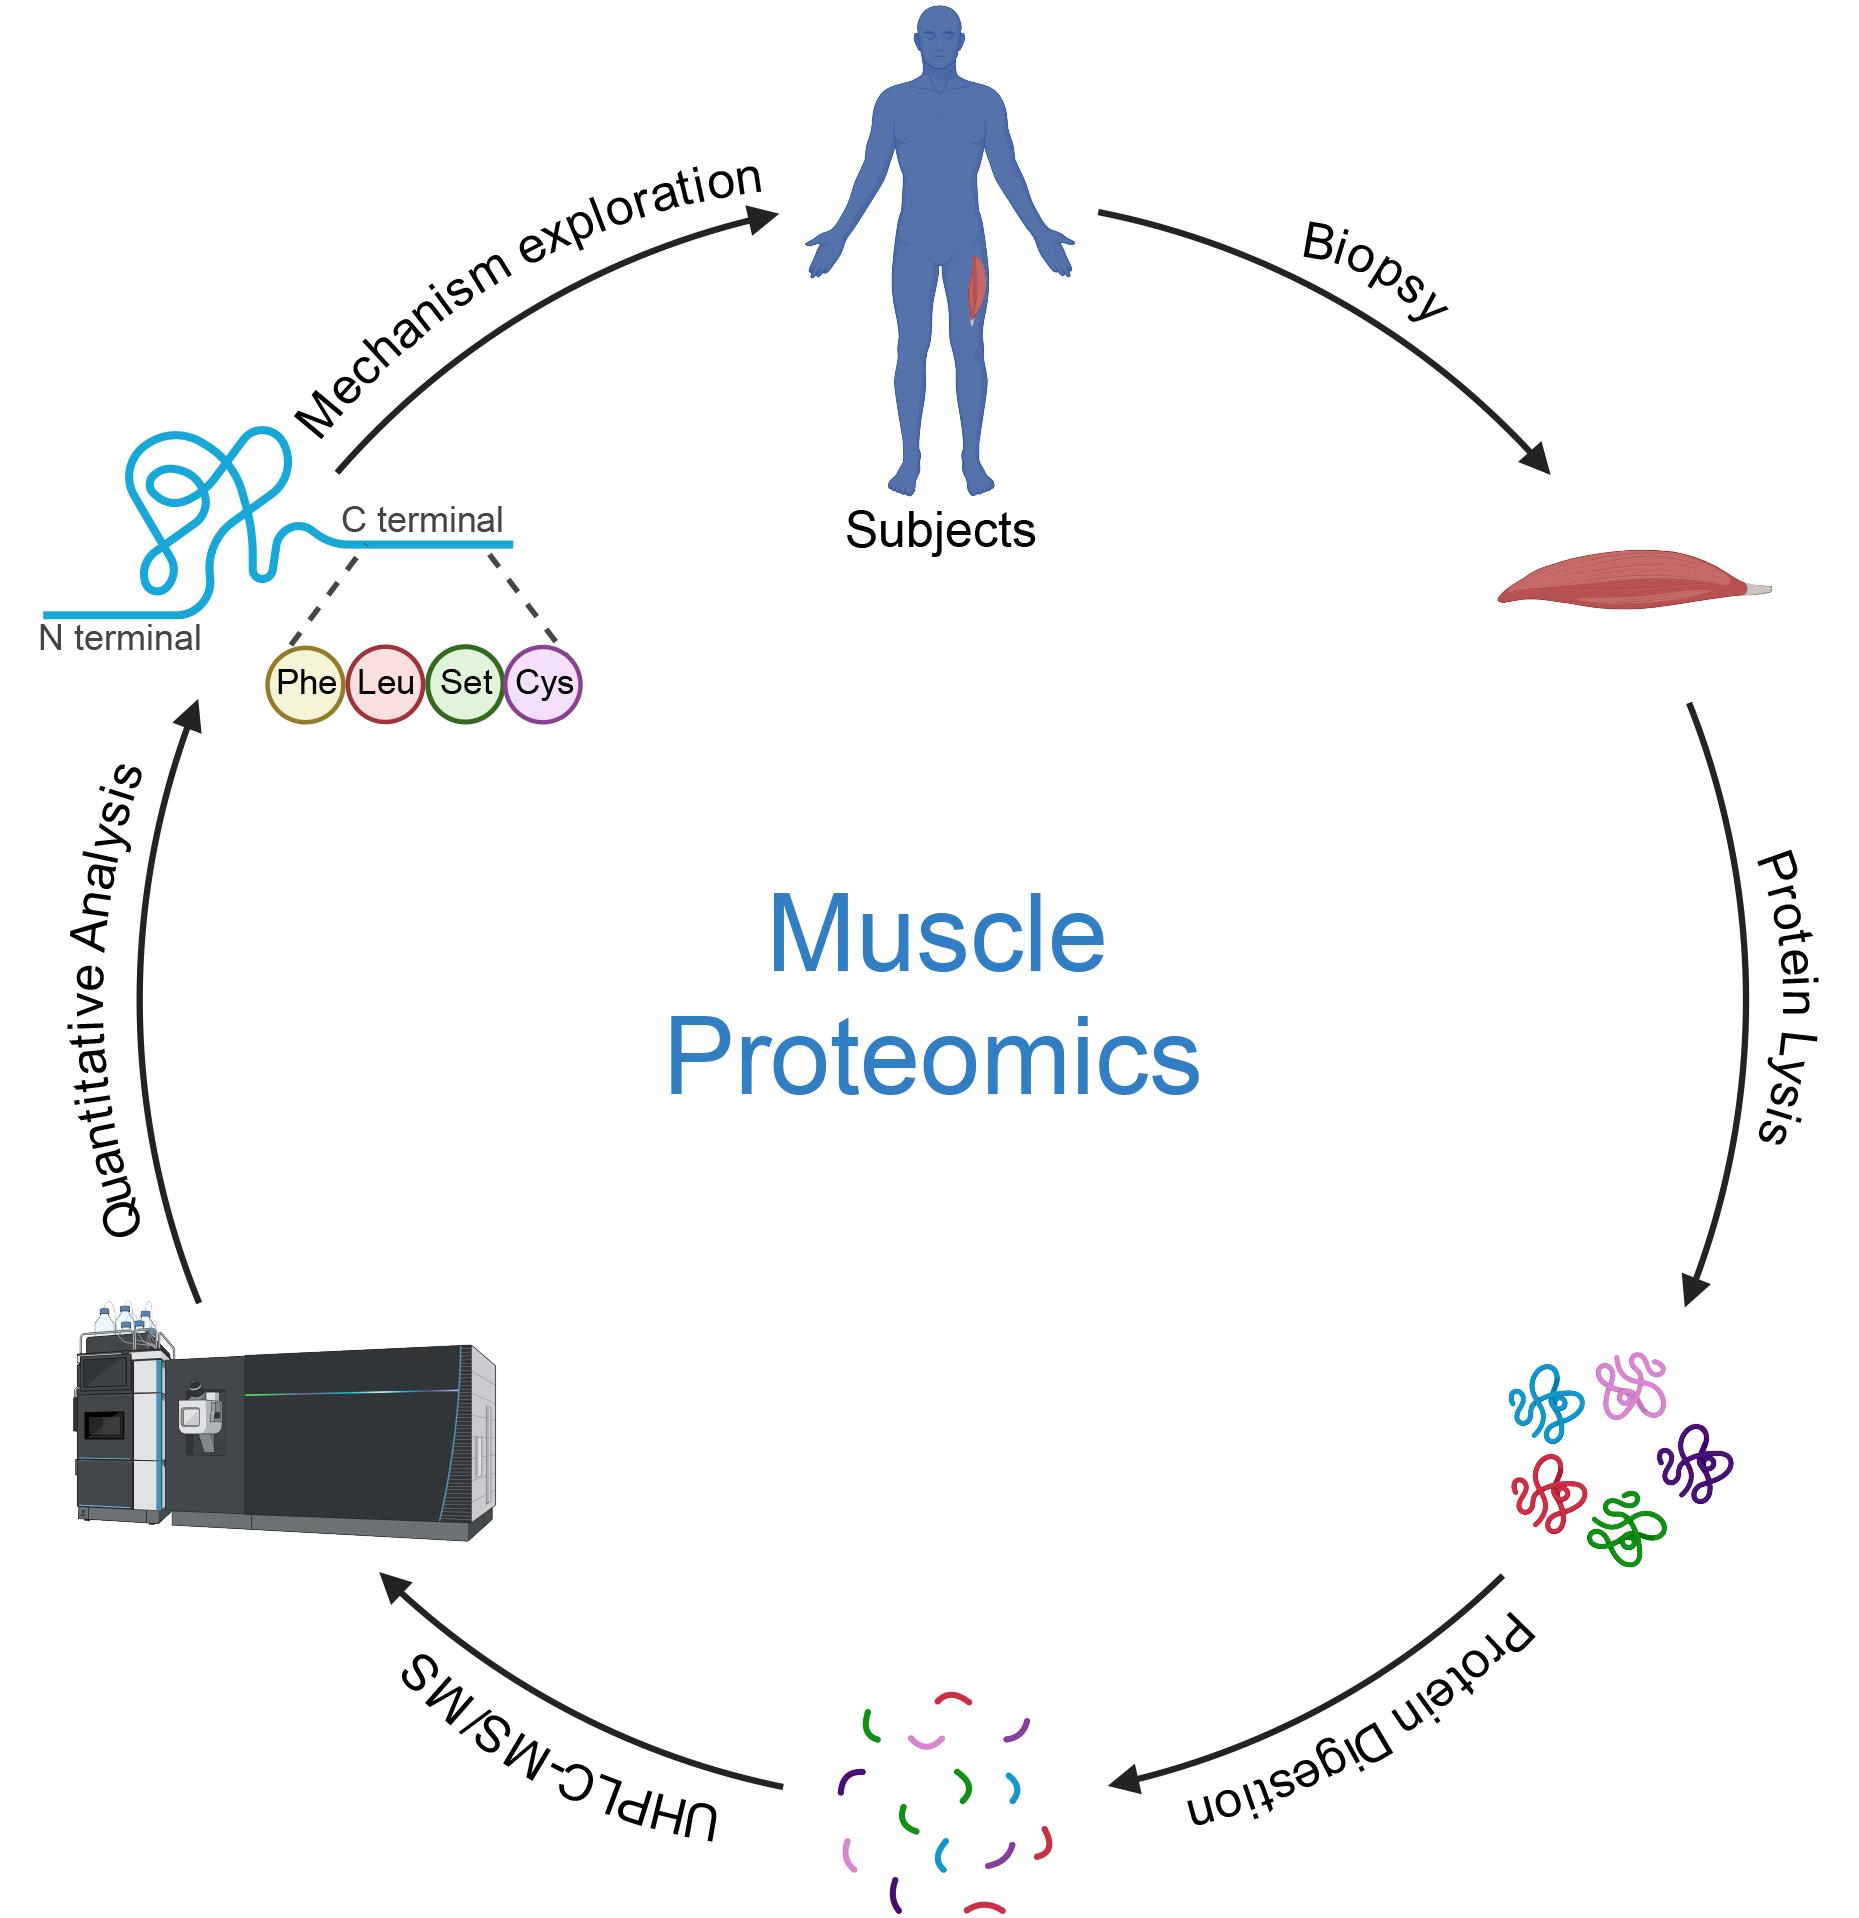
Background
Proteomics is an essential field in biomedical research, offering deep insights into the molecular mechanisms underlying various physiological and pathological processes [1]. This protocol focuses on muscle proteomics, specifically analyzing muscle adaptations to different types of exercise, such as concentric (CON) and eccentric (ECC) training. Muscle proteomics can elucidate the intricate molecular changes that occur in response to physical activity, thereby advancing our understanding of exercise physiology, muscle hypertrophy, and recovery [2]. Traditional liquid chromatography–mass spectrometry (LC–MS) techniques have long been employed for proteomic analysis, offering significant advantages over two-dimensional gel electrophoresis in terms of sensitivity and reproducibility [3]. However, the separation power of conventional LC systems often falls short when dealing with complex mixtures like muscle tissue proteomes, where resolving peptides with close retention times and molecular weights is crucial [4].
The protocol described here utilizes ultra-high-performance liquid chromatography (UHPLC) for the preparation and analysis of muscle samples. This method offers several significant advantages over traditional approaches. UHPLC provides superior resolution and separation of complex protein mixtures compared to conventional liquid chromatography, allowing for more detailed and accurate proteomic profiling [5]. The protocol significantly increases the sensitivity of protein detection, enabling the identification of low-abundance proteins that might be missed using standard methodologies [6]. Additionally, the UHPLC method enhances reproducibility in proteomic analysis due to its precise control over chromatographic conditions and consistent performance across different runs [7]. This protocol also reduces the time required for sample preparation and analysis compared to traditional methods, allowing for quicker turnaround and higher throughput.
Despite its advantages, the UHPLC-based protocol has some limitations. The protocol requires access to advanced UHPLC equipment, which may not be available in all research laboratories. Implementing this protocol necessitates a certain level of technical expertise in UHPLC and proteomic analysis, which may require specialized training for some laboratory personnel. Beyond muscle proteomics, this protocol can be adapted for use in other research areas that involve complex protein mixtures. For example, researchers can apply this protocol to nutritional studies, examining proteomic changes in muscle tissues in response to different dietary interventions and providing insights into the effects of nutrition on muscle health and function [8]. Additionally, the protocol can be used to evaluate the molecular effects of pharmacological agents on muscle tissues, aiding in the development of new drugs aimed at treating muscle-related diseases or enhancing muscle performance [9].
In summary, the UHPLC-based protocol for muscle proteomics offers significant improvements in resolution, sensitivity, reproducibility, and efficiency over traditional methodologies. While it does require specialized equipment and expertise, its advantages make it a powerful tool for advancing research in exercise physiology, muscle adaptation, and a wide range of other biomedical fields. This protocol not only enhances our understanding of molecular adaptations to exercise but also holds promise for broader applications in disease research, nutritional science, and drug development.
Materials and reagents
Biological materials
Human vastus lateralis muscle biopsy sample
Reagents
Povidone-iodine (Sigma-Aldrich, catalog number: PVP-I)
2% lidocaine with epinephrine (Hospira, catalog number: 0409-4279-16)
Glucose solution (Sigma-Aldrich, catalog number: G8769)
Physiological saline (Sigma-Aldrich, catalog number: S8776)
Liquid nitrogen (Air Products, catalog number: NI)
Isopentane (Sigma-Aldrich, catalog number: 277258)
Tris-HCl (Sigma-Aldrich, catalog number: T5941)
Triton X-100 (Sigma-Aldrich, catalog number: T8787)
Protease inhibitor cocktail (Sigma-Aldrich, catalog number: P2714)
BCA Protein Assay Kit (Thermo Fisher, catalog number: 23227)
Trichloroacetic acid (TCA) (Sigma-Aldrich, catalog number: T6399)
Acetone, HPLC grade (Sigma-Aldrich, catalog number: 34850)
Triethylammonium bicarbonate (TEAB) (Sigma-Aldrich, catalog number: T7408)
Trypsin (Promega, catalog number: V5111)
Dithiothreitol (DTT) (Sigma-Aldrich, catalog number: D0632)
Iodoacetamide (IAA) (Sigma-Aldrich, catalog number: I1149)
Formic acid (FA), HPLC grade (Sigma-Aldrich, catalog number: 56302)
Acetonitrile (ACN), HPLC grade (Sigma-Aldrich, catalog number: 34967)
Water, HPLC grade (Thermo Fisher, catalog number: W7-4)
EASY-nLC 1200 solvent A (0.1% formic acid in water) (Thermo Fisher, catalog number: LS1224)
EASY-nLC 1200 solvent B (0.1% formic acid in acetonitrile) (Thermo Fisher, catalog number: LS1225)
FAIMS Pro compensation voltage solution (Thermo Fisher, catalog number: FMSP 0003)
Solutions
PBS (see Recipes)
Triton lysis buffer (see Recipes)
LC-MS/MS mobile phase A (see Recipes)
LC-MS/MS mobile phase B (see Recipes)
Recipes
PBS
Reagent Final concentration Quantity or Volume NaCl 137 mM 8.01 g KCl 2.7 mM 0.2 g NaHPO 10 mM 1.42 g KHPO 1.8 mM 0.24 g Distilled H2O n/a Up to 1 L Triton lysis buffer
Reagent Final concentration Quantity or Volume Tris-HCl 50 mM 60.57 mg NaCl 150 mM 87.66 mg EDTA 1 mM 0.292 mg Triton X-100 1% 10 μL Protease inhibitor 1% 10 μL Distilled H2O n/a Up to 1 mL LC-MS/MS mobile phase A
Reagent Final concentration Quantity or Volume Formic acid 0.1% 1 mL (for 1 L) Acetonitrile 2% 20 mL (for 1 L) Water -- Up to 1 L LC-MS/MS mobile phase B
Reagent Final concentration Quantity or Volume Formic acid 0.1% 1 mL (for 1 L) Acetonitrile 90% 900 mL (for 1 L) Water -- Up to 1 L
Laboratory supplies
Disposable semi-automatic biopsy needle (Bard, catalog number: 1520-5010)
Pre-cooled tweezers (VWR, catalog number: 82027-530)
Aluminum foil (Reynolds, catalog number: 614)
Liquid nitrogen storage container (Thermo Fisher, catalog number: 11887163)
Cryogenic vials (Nalgene, catalog number: 5000-1020)
Mortar and pestle set (Bel-Art, catalog number: H37260-0000)
Microcentrifuge tubes (Eppendorf, catalog number: 0030120086)
1.5 mL microcentrifuge tubes (Eppendorf, catalog number: 022363204)
50 mL conical tubes (Falcon, catalog number: 352070)
1,000 μL pipette tips (Rainin, catalog number: RT-L1000F)
200 μL pipette tips (Rainin, catalog number: RT-L200F)
10 μL pipette tips (Rainin, catalog number: RT-L10F)
Sterile gloves (Medline, catalog number: MDS195285)
Sterile surgical drapes (3M, catalog number: 1010)
Sterile gauze pads (Dynarex, catalog number: 3344)
Surgical mask (Medline, catalog number: NON27378)
Medical adhesive tape (3M, catalog number: 1530-1)
Medical bandages (Johnson & Johnson, catalog number: 2015)
96-well plates (Thermo Fisher, catalog number: 260836)
Equipment
Ultrasound machine (GE Healthcare, model: LOGIQ E9)
-80 °C freezer (Thermo Fisher, model: ULT2186)
Centrifuge (Eppendorf, model: 5424)
Ultrasonic homogenizer (Qsonica, model: Q55)
Vortex mixer (VWR, model: 945302)
UHPLC system (Thermo Fisher, model: EASY-nLC 1200)
nanoACQUITY HPLC HHS T3 column (Waters, catalog number: 186003538)
Mass spectrometer (Thermo Fisher, model: Orbitrap Exploris 480)
FAIMS Pro Interface (Thermo Fisher, catalog number: FAIMS01-10000)
Water bath (Grant Instruments, model: JB Academy)
pH meter (Mettler Toledo, model: SevenCompact)
Magnetic stirrer (IKA, model: RCT basic)
Analytical balance (Sartorius, model: Entris II)
Refrigerated microcentrifuge (Eppendorf, model: 5418 R)
Electronic pipettes (Eppendorf, model: Xplorer plus)
Software and datasets
UniProt (https://www.uniprot.org/) (Access date, 2021/08)
Proteome Discoverer (v2.4.1.15, Thermo Scientific)
Procedure
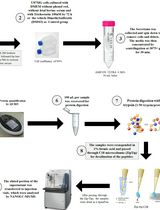
Muscle biopsy
Preparation
Ensure all equipment and reagents are prepared and sterile.
Set up a sterile area and prepare a disposable semi-automatic biopsy needle.
Biopsy procedure
Position the subject comfortably and identify the biopsy site (typically the vastus lateralis muscle).
Disinfect the target puncture site three times using povidone-iodine, expanding the circular disinfection area around the puncture point. Inject 3–5 mL of 2% lidocaine containing 50 μL of epinephrine for local anesthesia of the skin and subcutaneous tissue. Ensure the needle does not penetrate the deep fascia to avoid anesthetic contamination of muscle tissue. Provide the subject with sufficient glucose to prevent hypoglycemia and stabilize their emotions.
The physician holds the disposable semi-automatic biopsy needle and slowly inserts the needle through the skin and subcutaneous tissue, using musculoskeletal ultrasound to guide the needle and avoid important nerves and blood vessels. Upon reaching the deep fascia, increase the force and rotate the needle to penetrate the fascia. Use ultrasound to confirm the needle's position in the vastus lateralis muscle. The assistant gently compresses the muscle around the puncture site, while the physician triggers the needle mechanism to cut the muscle (Figure 1A).
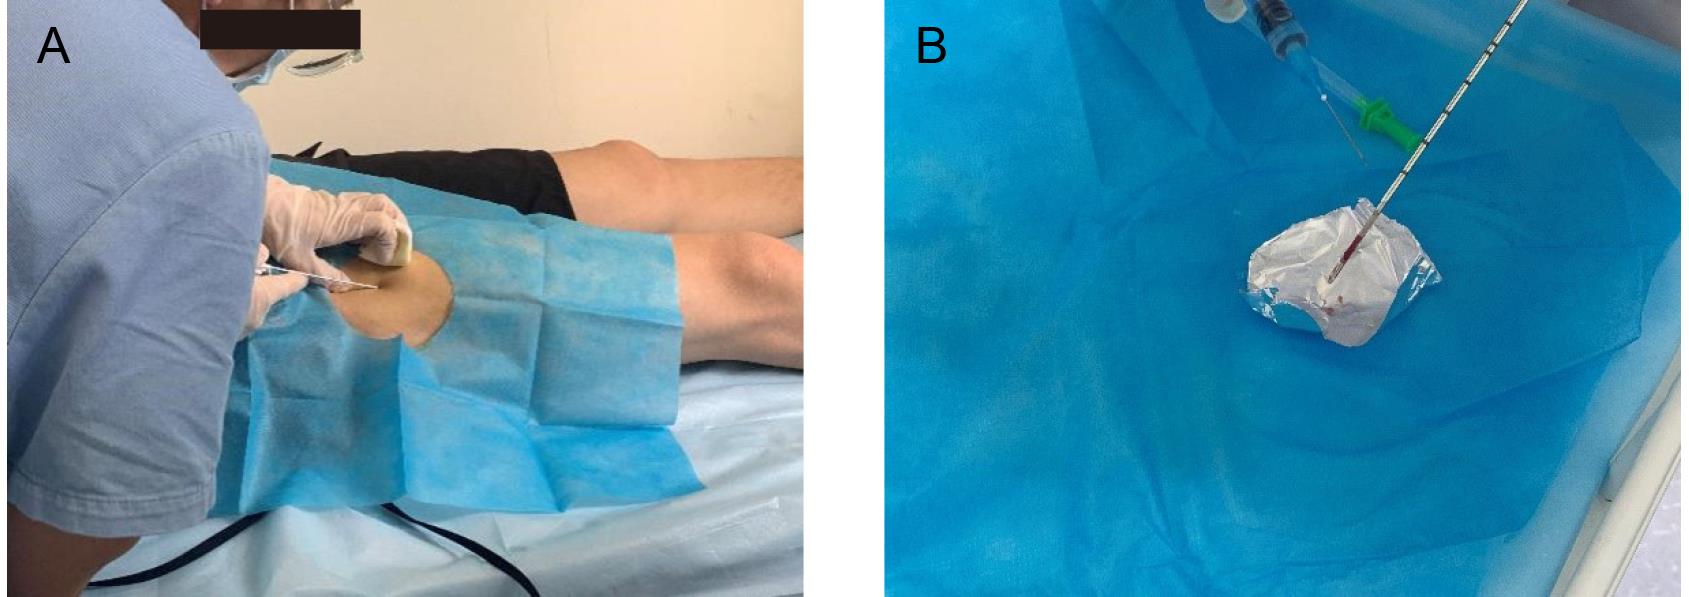
Figure 1. Muscle biopsy. A. Biopsy procedure. B. Muscle sample preservation.Given the small diameter and cutting window of the biopsy needle, multiple cuts (5–7 times) may be necessary to obtain sufficient muscle tissue (~50 mg).
Sample preservation
Remove the muscle tissue from the biopsy needle using pre-cooled tweezers, rinse multiple times with saline, wrap in foil, quickly freeze in liquid nitrogen–cooled isopentane, and temporarily store in a liquid nitrogen container. Finally, store all muscle samples in a -80 °C freezer for proteomic analysis (Figure 1B).
Post-procedure care
Remove the biopsy needle and apply a medical dressing to the puncture site.
Instruct the subject to sit quietly for 15–20 min, applying continuous pressure to the puncture site to prevent bleeding. Advise the subject not to shower for 24 h and to keep the wound clean and dry.
Continuously monitor and record the subject's condition and wound recovery until fully healed.
Preparation of muscle samples for proteomic analysis
Homogenization
Retrieve muscle samples from the -80 °C freezer and place them on ice.
Weigh the tissue sample into a liquid nitrogen–cooled mortar and grind it into a fine powder.
Lysis
Add four times the volume of lysis buffer (see Recipes) to the powdered muscle samples. Perform ultrasonic lysis to homogenize the muscle tissue.
Centrifuge at 12,000× g for 10 min at 4 °C, discard the pellet, and transfer the supernatant to a new tube.
Determine protein concentration using a BCA assay kit.
Protein digestion
Digest equal amounts of muscle sample protein from each group (100 μg to 1 mg). Adjust the volume with lysis buffer.
Slowly add TCA to a final concentration of 20%, vortex to mix, and precipitate at 4 °C for 2 h.
Centrifuge at 4,500× g for 5 min at 4 °C, discard the supernatant, and wash the pellet 2–3 times with pre-cooled acetone.
Air-dry the pellet (15–30 min), add TEAB to a final concentration of 200mM, and sonicate to disperse the pellet. Sonication time is 10–30 s per cycle; power is 30%–50% output; 3–5 cycles with 30 s to 1 min cooling on ice between cycles.
Add DTT to a final concentration of 5 mM and reduce at 56 °C for 30 min.
Add IAA to a final concentration of 11 mM and incubate in the dark at room temperature for 15 min.
Add trypsin at a 1:50 ratio (enzyme:protein, m/m) and digest overnight at 37 °C.
UHPLC-MS/MS analysis
Calibration process of UHPLC-MS/MS
Calibration of the instrument: To ensure accuracy, the UHPLC-MS/MS system is typically calibrated by injecting standard solutions with known concentrations. The calibration process aims to validate the performance of chromatographic separation and mass spectrometric detection and ensure a good linear response across the concentration range of the target analyte.
Optimization of mass spectrometry parameters: Calibration of the mass spectrometry component involves optimizing ion source conditions (e.g., spray voltage, ion source temperature) and settings of the mass analyzer to ensure accurate detection of compounds across different molecular weights, with stable peak shapes and responses.
Mass calibration: Using standard mass calibration substances (such as known peptides or small molecules), the mass accuracy of the spectrometer is checked regularly, and necessary corrections are made to ensure that the mass deviation is within the permissible range.
Preparation of calibration solutions
Selection of standards: The standards used in the experiment should be high-purity target compounds, usually with a purity of over 98%. These standards could be purified forms of the target analyte, isotope-labeled compounds, or peptides with known sequences.
Preparation of stock solutions: First, weigh the standard and dissolve in an appropriate solvent (e.g., 0.1% formic acid solution or acetonitrile) to prepare a high-concentration stock solution. The stock solution should have an accurate concentration, typically 1 mg/mL or higher.
Dilution of standard solutions: From the stock solution, prepare a series of diluted solutions of different concentrations to cover the expected concentration range of the samples. The concentration of the standard solutions usually ranges from 1 ng/μL to 500 ng/μL, depending on the experimental requirements.
Establishment of calibration standards
Calibration curve: Inject different concentrations of the standard solutions into the UHPLC-MS/MS system, record the mass spectrometric response (such as peak area or peak height) for each concentration, and plot a calibration curve. The calibration curve should exhibit good linearity across the measured concentration range to ensure the accuracy of quantitative analysis.
Use of internal standards: To compensate for variability during sample preparation and detection, internal standards (such as isotope-labeled peptides or compounds) may be used. Internal standards can be added to both the sample and the standard solution to correct for experimental errors.
Quality control and validation
Regular calibration: The calibration process should be conducted regularly, especially if the instrument undergoes maintenance or there are changes in experimental conditions. Regular validation of the instrument’s performance ensures consistency and reliability in calibration results.
Use of quality control samples: Quality control (QC) samples can be used to assess the instrument’s performance and ensure that the mass spectrometric response falls within the expected range.
Validation of calibration results
Linear validation: Ensure that the calibration curve maintains a good linear relationship across the entire analytical range (usually requiring an R2 greater than 0.99).
Limit of detection (LOD) and limit of quantification (LOQ): Based on the calibration curve, determine the instrument’s LOD and LOQ to ensure that accurate detection results can still be obtained at low concentrations.
Sample loading and separation
Inject 1 μg of peptide dissolved in 0.1% formic acid into an EASY-nLC1200 system using a nanoACQUITY HPLC HHS T3 column (75 μm × 150 mm, 1.8 μm). The mobile phase A is 0.1% formic acid with 2% acetonitrile; mobile phase B is 0.1% formic acid with 90% acetonitrile.
Set the gradient: 0–68 min, 6%–23% B; 68–82 min, 23%–32% B; 82–86 min, 32%–80% B; 86–90 min, 80% B. Maintain the flow rate at 450 nL/min.
Ionization and mass spectrometry
The separated peptides are ionized using an NSI source and analyzed by an Orbitrap Exploris 480 mass spectrometer. Set the capillary temperature to 260 °C and ionization voltage to 2.3 kV. The FAIMS compensation voltage (CV) is set to -45V, -65V.
Mass spectrometry analysis
Both the parent ions and their fragments are detected using the high-resolution Orbitrap. The primary scan range is 400–1,200 m/z with a resolution of 60,000; the secondary scan range starts at 110 m/z with a resolution of 15,000. TurboTMT is off.
Data acquisition
Use data-dependent acquisition (DDA) to select the top 25 precursor ions for fragmentation using HCD with a collision energy of 27% and secondary analysis.
To optimize the use of the mass spectrometer, set the automatic gain control (AGC) to 100%, the signal threshold to 5E4 ions/s, maximum injection time to Auto, and dynamic exclusion to 20 s.
Data analysis
Mass spectrometry data analysis
Quality control
Peptide length distribution: Most effective peptides should be between 7 and 20 amino acids in length, with the ideal length being 8–15 amino acids (Figure 2A).
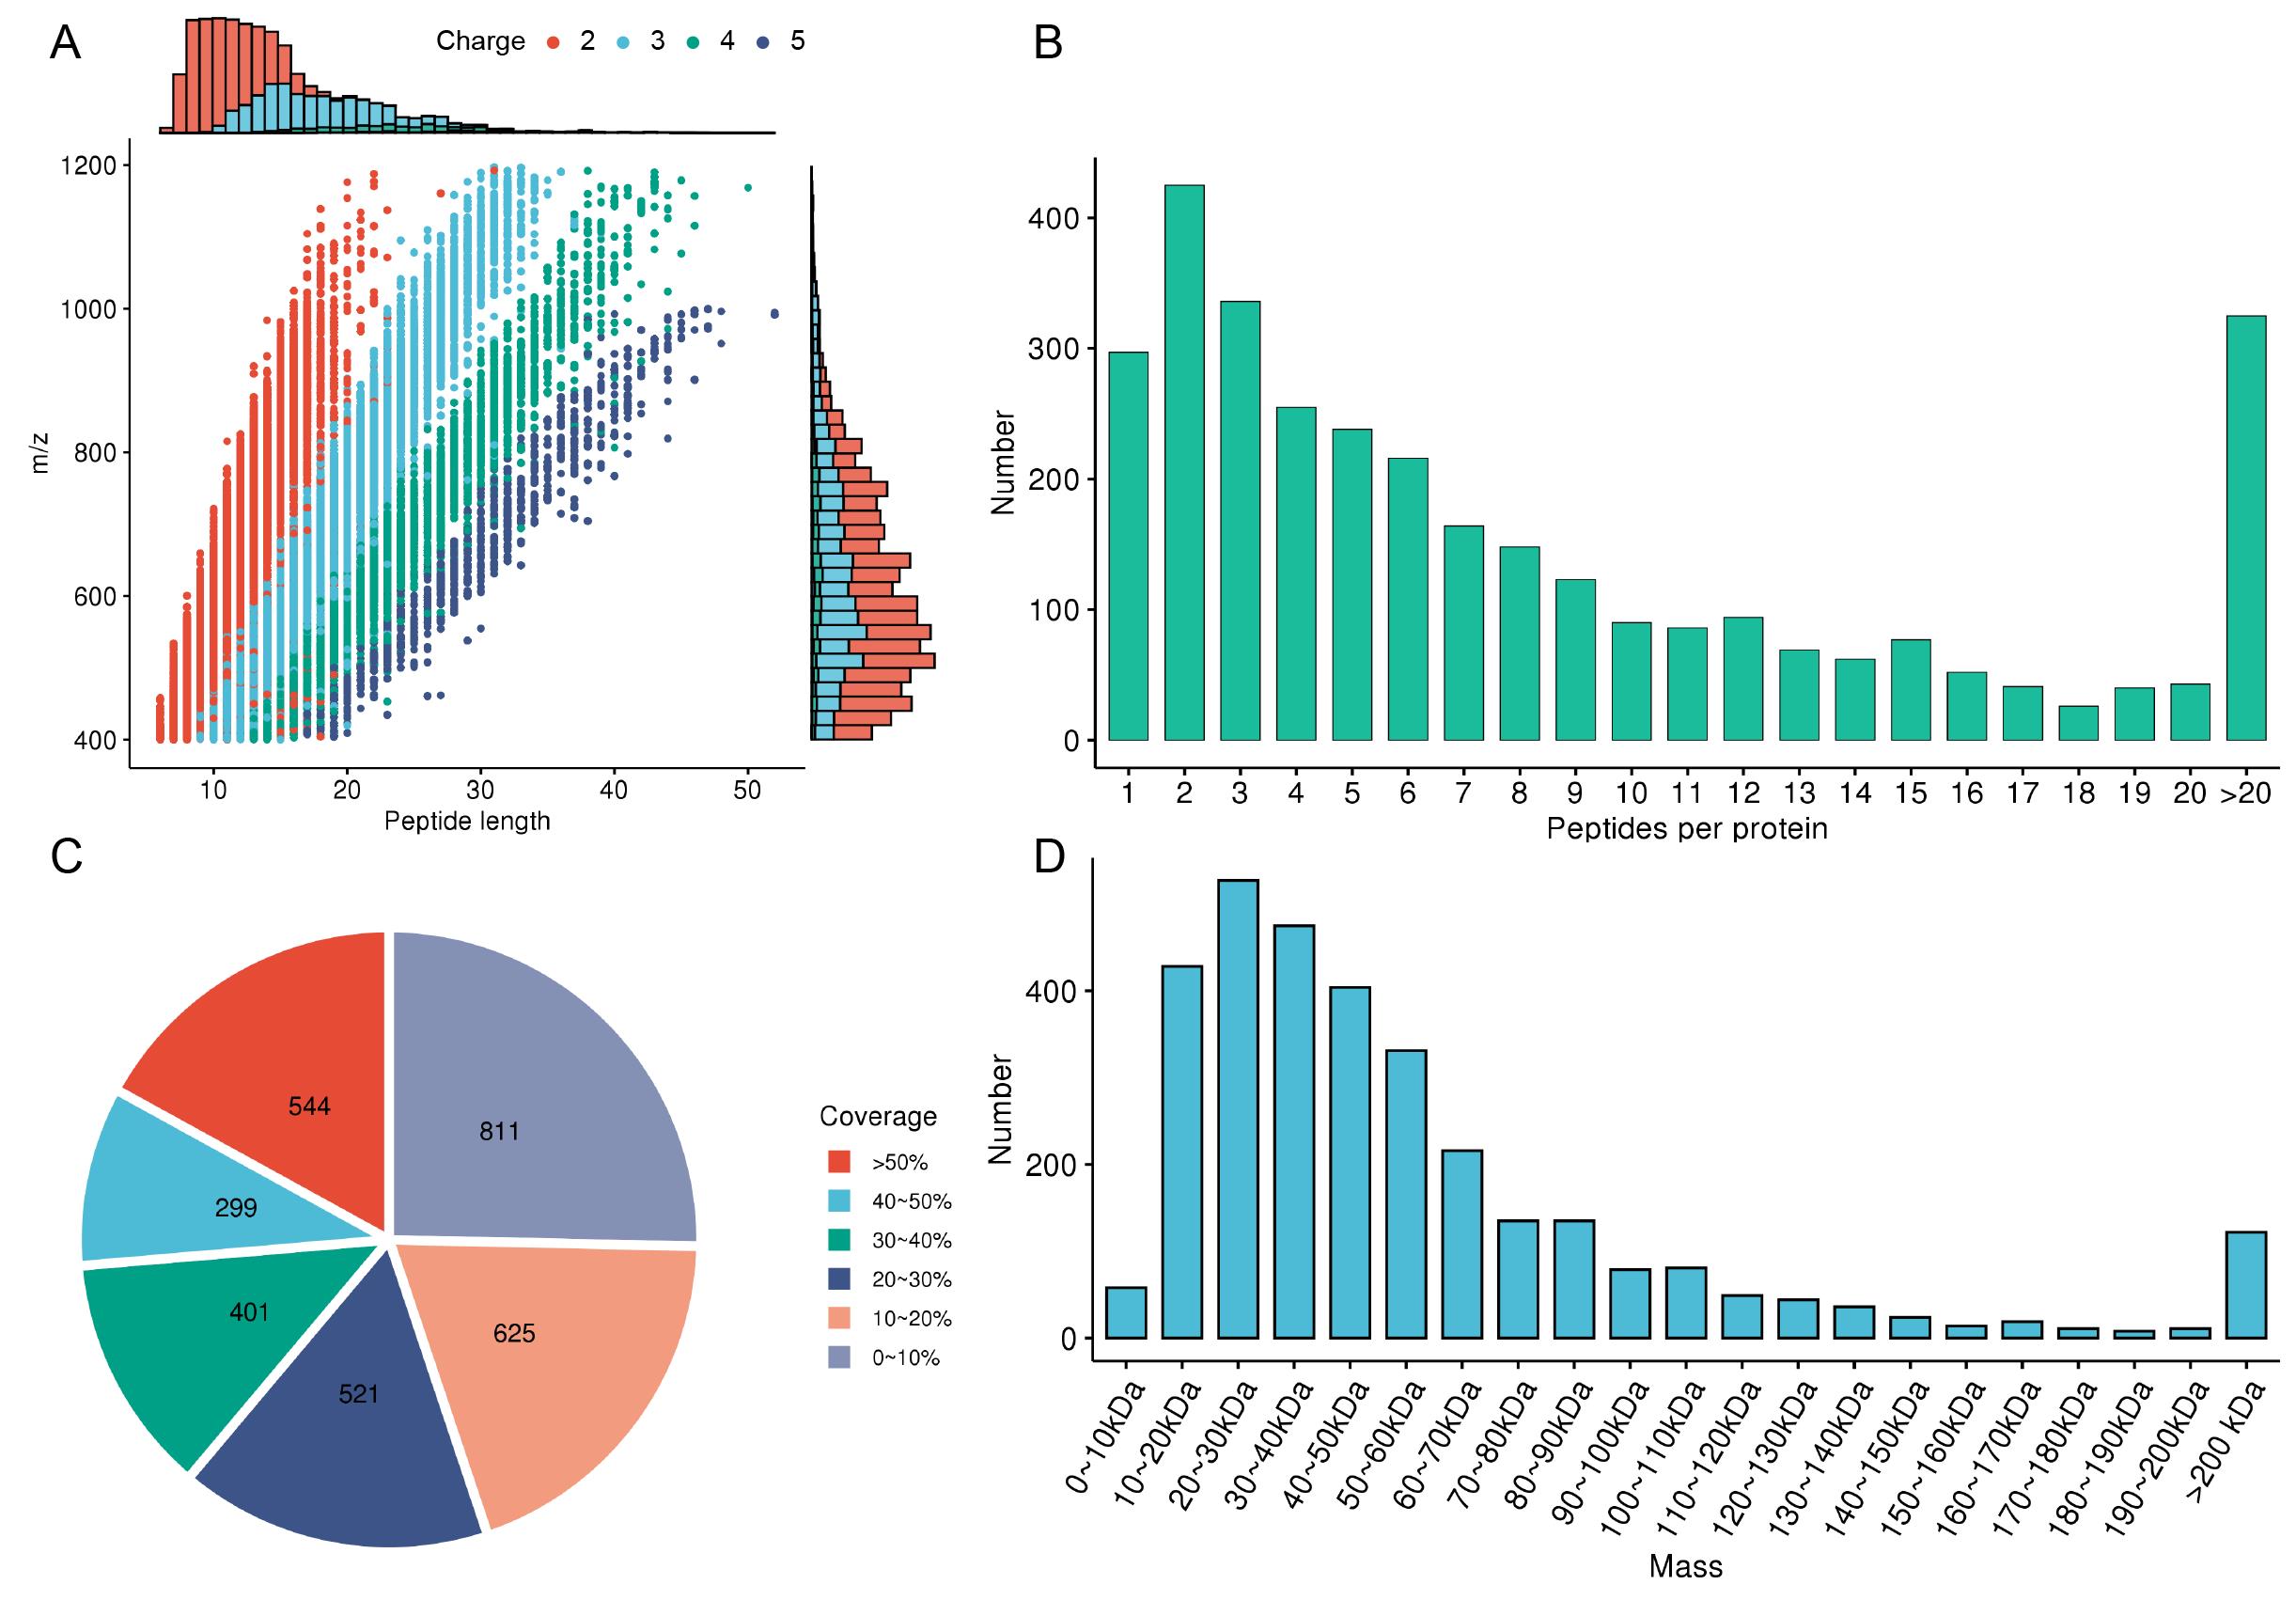
Figure 2. Quality control. A. Peptide length distribution. The colors represent the amount of charge carried by the peptide. B. Peptide count distribution. C. Protein coverage distribution. The colors represent protein coverage. D. Protein molecular weight distribution.Peptide count distribution: At least 2–3 unique peptides should be detected for each protein to ensure reliability and reproducibility (Figure 2B).
Protein coverage distribution: Generally, the protein coverage should exceed 20%–30%, with high-abundance proteins ideally achieving 50% or more (Figure 2C).
Protein molecular weight distribution. A wide range of molecular weights should be covered, typically from 5 to 250 kDa, ensuring the detection of proteins of various sizes within this range (Figure 2D).
Filter data at the spectrum, peptide, and protein levels with an FDR of 1%.
Data processing
Use Proteome Discoverer (v2.4.1.15) to analyze the secondary mass spectrometry data. Set the database to Homo_sapiens_9606_SP_20210721.fasta (20,387 sequences) with a decoy database to calculate the false discovery rate (FDR) and a contaminant database to eliminate common contaminants. Set enzyme to Trypsin (Full) with up to two missed cleavages, minimum peptide length of six residues, and a maximum of three modifications per peptide. Set the precursor mass tolerance to 10 ppm and fragment mass tolerance to 0.02 Da.
The mass tolerance for precursor ions is set to 10 ppm, and to 0.02 Da for fragment ions; the maximum allowed retention time deviation is 10 min.
Search engines choose Sequest HT. Set Carbamidomethyl (C) as a fixed modification; Oxidation (M), Acetyl (N-terminus), Met-loss (M), Deamidated (N, Q), and Met-loss + acetyl (M) as variable modifications. Set FDR for protein, peptide, and PSM identification to 1%.
In the Minora detection process, set the minimum trace length for signal identification to 5, Max ΔRT of Isotope Pattern Multiplets [min] to 0.02, and the confidence of the Peptide-Spectrum Match to HIGH.
Use UNIQUE and RAZOR peptides for quantification based on intensity values. Protein abundance was calculated as summed abundance.
Quantitative analysis
Normalization
Normalize raw mass spectrometry data both row-wise and column-wise. Divide each protein's quantification value by its average value across all samples (row-wise). Then, divide each protein in a sample by the median value of that sample (column-wise) to obtain normalized data for bioinformatics analysis.
Validation of protocol
This protocol or parts of it has been used and validated in the following research article(s):
Du et al. [10]. Proteomic Profiling of Muscular Adaptations to Short-Term Concentric Versus Eccentric Exercise Training in Humans. Mol Cell Proteomics (Supplemental Table S2)]
General notes and troubleshooting
General notes
Problem 1: How to recalibrate the gradient and how to optimize the column temperature.
Recalibrate the gradient
Check the gradient program: Begin by reviewing the existing gradient program to determine whether it is appropriate for separating the target compounds. If the gradient time or solvent ratio is incorrect, it may lead to retention time shifts or poor separation of the target analytes.
Optimize start and end conditions: Adjust the starting and ending solvent ratios based on the polarity and chemical nature of the sample. For polar compounds, use a higher proportion of the aqueous phase at the start. For hydrophobic compounds, start with more of the organic phase.
Extend or shorten gradient time: If peaks are not well-separated, consider extending the gradient time to allow more time for different compounds to separate. If the peaks are too broad, resulting in lower resolution, shorten the gradient time.
Validate with standards: Use known standard samples to check if the new gradient can effectively separate the target compounds and ensure stable retention times. After adjusting the gradient, record the retention time for each compound and ensure it remains consistent.
Optimize column temperature
Determine the optimal temperature range: Typically, column temperature is optimized between 25 °C and 60 °C. Higher temperatures can speed up the analysis process and reduce retention times but may lead to decreased resolution. Lower temperatures, on the other hand, increase resolution but result in longer analysis times.
Monitor peak shape and resolution: Gradually adjust the temperature (e.g., by increasing or decreasing it by 5 °C at a time) and observe changes in peak shape and resolution. Generally, as temperature increases, sample mobility improves, and peaks become narrower. However, excessive temperature increases may lead to peak fronting or peak loss.
Balance analysis time and resolution: Select a temperature that maintains good separation while also not excessively prolonging the analysis time, ensuring sufficient resolution.
Consider sample stability: For heat-sensitive samples, avoid using excessively high column temperatures to prevent sample degradation in the column.
Problem 2: How to increase the sample volume within the linear range of the instrument.
In LC–MS methods, increasing the sample amount must ensure it remains within the linear range of the instrument to avoid signal saturation and ensure quantitative accuracy. The following steps and considerations should be followed when increasing the sample amount:
Confirm the instrument's linear range: The linear range of the instrument refers to the range in which the analyte concentration has a linear relationship with the detection signal (e.g., peak area). In this range, the signal increases linearly with the sample concentration. Create a calibration curve by injecting standards at different concentrations to determine the linear range. This curve should cover the expected sample concentrations and typically uses at least five different concentration points.
Gradually increase sample amount: If the sample amount needs to be increased, it is recommended to gradually increase the concentration or injection volume while monitoring the signal response. Stop increasing the sample amount before the signal enters the nonlinear range. The sample amount can be increased by injecting a larger volume into the liquid chromatography system, for example, increasing from 10 to 20 μL. However, ensure that the injection volume does not exceed the sample loop capacity.
Evaluate signal saturation: While increasing the sample amount, monitor the signal intensity of the mass spectrometer. If the signal intensity starts to show nonlinear growth or approaches the saturation point, reduce the sample concentration or injection volume accordingly. Increasing the sample amount may lead to increased co-eluting substances, causing ion suppression and affecting the detection of analytes. Therefore, closely monitor for ion suppression and adjust sample preparation methods if necessary.
Appropriate sample dilution: For high-concentration samples, perform dilution to ensure that the sample concentration falls within the instrument's linear range. The dilution factor should be chosen based on the linear range of the calibration curve. Internal standards can help correct signal deviations that may result from increased sample amounts, ensuring the accuracy of the quantification results.
Optimize mass spectrometer parameters: When increasing the sample amount, adjust the ion source parameters of the mass spectrometer (e.g., spray voltage, gas flow, temperature) to prevent ion source overload. By optimizing the scan range or using selected reaction monitoring (SRM) mode, focus on the target analytes and minimize interference from other substances.
Maintain good peak shape: Increasing the sample amount may cause peak broadening, affecting the separation. Ensure that the column selection is appropriate, and that flow rate, gradient, and other parameters are optimized to maintain good peak shape. Excessive sample amounts may overload the column, leading to peak broadening or tailing. Monitor the peak shape when increasing the sample amount to ensure the column is not overloaded.
Repeat experiments and validation: After each increase in sample amount, repeat the experiment to ensure consistency and reproducibility, avoiding random deviations. After increasing the sample amount, validate the calibration curve again to confirm that the linear range and detection limits remain unaffected.
Troubleshooting
Problem 1: Poor chromatographic separation.
Possible cause: Incorrect solvent composition or gradient program.
Solution: Double-check the solvent preparation and gradient program. Ensure that solvent bottles are correctly connected and that the mobile phase composition matches the method. If the problem persists, consider recalibrating the gradient and optimizing the column temperature.
Problem 2: Low signal intensity in MS.
Possible cause: Insufficient sample loading.
Solution: Increase the sample injection volume within the linear range of the instrument. Ensure that samples are properly dissolved in the appropriate solvent. Check for clogs or blockages in the sample introduction system and clean or replace them as necessary.
Problem 3: Poor ionization efficiency.
Possible cause: Contaminated ion source or electrospray emitter.
Solution: Clean the ion source and electrospray emitter according to the manufacturer's instructions. Use appropriate solvents for cleaning to avoid damaging sensitive components. Regularly perform maintenance procedures recommended by the instrument manual to ensure optimal ionization conditions.
Acknowledgments
This study was supported by the National Natural Science Foundation of China (82071413, 82271438). This protocol was adapted and modified from Du et al. [10].
Competing interests
The authors declare no competing interests.
Ethical considerations
This protocol was conducted according to the Declaration of Helsinki's ethical principles. The local ethics committee of Sports Science Experimental Ethics Committee at Beijing Sport University approved the study (Permission number: 2020148H).
References
- Anderson, N. L. and Anderson, N. G. (2002). The Human Plasma Proteome. Mol Cell Proteomics. 1(11): 845–867.
- Hoffman, N. J., Parker, B. L., Chaudhuri, R., Fisher-Wellman, K. H., Kleinert, M., Humphrey, S. J., Yang, P., Holliday, M., Trefely, S. and Fazakerley, D. J. (2015). Global Phosphoproteomic Analysis of Human Skeletal Muscle Reveals a Network of Exercise-Regulated Kinases and AMPK Substrates. Cell Metab. 22(5): 922–935.
- Görg, A., Weiss, W. and Dunn, M. J. (2004). Current two‐dimensional electrophoresis technology for proteomics. Proteomics. 4(12): 3665–3685.
- Aebersold, R. and Mann, M. (2003). Mass spectrometry-based proteomics. Nature. 422(6928): 198–207.
- Howard, J. W., Kay, R. G., Pleasance, S. and Creaser, C. S. (2012). UHPLC for the separation of proteins and peptides. Bioanalysis. 4(24): 2971–2988.
- Smaczniak, C., Li, N., Boeren, S., America, T., van Dongen, W., Goerdayal, S. S., de Vries, S., Angenent, G. C. and Kaufmann, K. (2012). Proteomics-based identification of low-abundance signaling and regulatory protein complexes in native plant tissues. Nat Protoc. 7(12): 2144–2158.
- Perez de Souza, L., Alseekh, S., Scossa, F. and Fernie, A. R. (2021). Ultra-high-performance liquid chromatography high-resolution mass spectrometry variants for metabolomics research. Nat Methods. 18(7): 733–746.
- Tipton, K. D., Elliott, T. A., Cree, M. G., Aarsland, A. A., Sanford, A. P. and Wolfe, R. R. (2007). Stimulation of net muscle protein synthesis by whey protein ingestion before and after exercise. Am J Physiol Endocrinol Metab. 292(1): E71–E76.
- Yarasheski, K. E., (2003). Review Article: Exercise, Aging, and Muscle Protein Metabolism. J Gerontol A Biol Sci Med Sci. 58(10): M918–M922.
- Du, J., Yun, H., Wang, H., Bai, X., Su, Y., Ge, X., Wang, Y., Gu, B., Zhao, L. and Yu, J. G. (2024). Proteomic Profiling of Muscular Adaptations to Short-Term Concentric Versus Eccentric Exercise Training in Humans. Mol Cell Proteomics. 23(4): 100748.
Article Information
Publication history
Received: Jun 19, 2024
Accepted: Oct 10, 2024
Available online: Oct 31, 2024
Published: Dec 20, 2024
Copyright
© 2024 The Author(s); This is an open access article under the CC BY-NC license (https://creativecommons.org/licenses/by-nc/4.0/).
How to cite
Du, J., Hou, J., Yun, H. and Song, Y. (2024). Muscle Biopsy Sample Preparation and Proteomics Analysis Based on UHPLC-MS/MS. Bio-protocol 14(24): e5137. DOI: 10.21769/BioProtoc.5137.
Category
Systems Biology > Proteomics > Secretome
Biochemistry > Protein
Cell Biology > Cell-based analysis > Protein secretion
Do you have any questions about this protocol?
Post your question to gather feedback from the community. We will also invite the authors of this article to respond.