- Protocols

- Articles and Issues
- For Authors
- About
- Become a Reviewer

In-Gel Activity Assay of Mammalian Mitochondrial and Cytosolic Aconitases, Surrogate Markers of Compartment-Specific Oxidative Stress and Iron Status
Published: Vol 14, Iss 23, Dec 5, 2024 DOI: 10.21769/BioProtoc.5126 Views: 2431
Reviewed by: Elizabeth CalzadaAnonymous reviewer(s)
Original research article
The authors used this protocol in:
Aug 2008
Advertisement


Protocol Collections
Comprehensive collections of detailed, peer-reviewed protocols focusing on specific topics


Abstract
Two aconitase isoforms are present in mammalian cells: the mitochondrial aconitase (ACO2) that catalyzes the reversible isomerization of citrate to isocitrate in the citric acid cycle, and the bifunctional cytosolic enzyme (ACO1), which also plays a role as an RNA-binding protein in the regulation of intracellular iron metabolism. Aconitase activities in the different subcellular compartments can be selectively inactivated by different genetic defects, iron depletion, and oxidative or nitrative stress. Aconitase contains a [4Fe-4S]2+ cluster that is essential for substrate coordination and catalysis. Many Fe-S clusters are sensitive to oxidative stress, nitrative stress, and reduced iron availability, which forms the basis of redox- and iron-mediated regulation of intermediary metabolism via aconitase and other Fe-S cluster-containing metabolic enzymes, such as succinate dehydrogenase. As such, ACO1 and ACO2 activities can serve as compartment-specific surrogate markers of oxygen levels, reactive oxygen species (ROS), reactive nitrogen species (RNS), iron bioavailability, and the status of intermediary and iron metabolism. Here, we provide a protocol describing a non-denaturing polyacrylamide gel electrophoresis (PAGE)-based procedure that has been successfully used to monitor ACO1 and ACO2 aconitase activities simultaneously in human and mouse cells and tissues.
Key features
• Monitoring aconitase activity changes in the mitochondria and cytosol simultaneously in response to oxidative or nitrative stress, iron depletion, and various pathophysiological conditions.
• Optimized for human and mouse cell lines and tissue samples.
• Semi-quantitative detection of aconitase isoforms with different states of phosphorylation and/or post-translational modification.
Keywords: AconitaseBackground
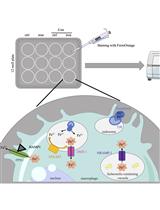
Aconitases play a central role in the crosstalk between citrate and iron metabolism [1]. Aconitase is best known for its metabolic function in the mitochondrial citric acid cycle, the primary catabolic pathway that reduces NADP+ to generate NADPH that feeds into the oxidative phosphorylation pathway for ATP production. In addition to the mitochondrial isoform ACO2, mammalian cells express various levels of a bifunctional cytosolic ACO1 that can register iron and oxidative stress through its labile Fe–S cluster. Upon the loss of its Fe-S cluster, ACO1 converts to an iron response element (IRE) binding protein IRE-BP1 (also known as iron regulatory protein 1, IRP1), which binds to IRE-containing RNAs and thereby regulates the expression of various proteins that are important in iron metabolism, including iron storage protein ferritin, iron transport proteins (transferrin receptor TfR1 and ferroportin), and erythrocyte-specific heme biosynthesis protein aminolevulinate synthase, among several targets [1]. Thus, the spatial separation of ACO1/IRP1 and ACO2 allows them to serve as indexes of compartment-specific Fe-S cluster biogenesis/repair pathways, oxidative stress, nitrative stress, and iron status.
The UV/vis spectrophotometric coupled enzyme assay that couples the reactions of aconitase and NADP-dependent (IDH) has offered a very sensitive method for detecting and measuring aconitase activities in purified protein or in whole-cell lysates [2]. However, although subcellular fractions can be used for assaying ACO1 and ACO2 separately, the time and laborious procedure needed for obtaining relatively pure subcellular fractions often results in the loss of the Fe-S cluster and diminished enzyme activities. Mitochondrial and cytosolic aconitase activities in whole-Drosophila extracts have also been assayed jointly after electrophoretic separation on cellulose acetate membranes [3]; however, empirical testing showed that the method was not suitable for quantitative analysis of mammalian aconitase activities, given the different pKa values of aconitases in different species. In addition, it is not possible to know the exact amount of protein loaded onto the cellulose acetate membrane, and the signals from mammalian cell line extracts are much weaker compared to those from the whole fly extracts.
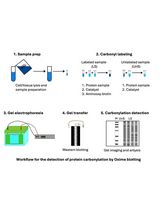
The current protocol describes the non-denaturing polyacrylamide gels and buffers for in-gel assay for human or mouse aconitase activities (adapted from previous work [4]). Aconitase activity was detected chromogenically by incubating the gel after electrophoresis in a coupled enzyme assay mix containing cis-aconitate, NADP-dependent isocitrate dehydrogenase, NADP, thiazolyl blue tetrazolium bromide and phenazine methosulfate. Quantification of the activity of each aconitase isoform is carried out by densitometric analysis.
Materials and reagents
Reagents
Dry ice
Triton X-100 (Sigma-Aldrich, catalog number: T-8787)
RIPA extraction buffer (e.g., RIPA Lysis and Extraction Buffer, Thermo Scientific, catalog number: 89900, ts: 25 mM Tris·HCl pH 7.6, 150 mM NaCl, 1% NP-40, 1% sodium deoxycholate, 0.1% SDS)
Potassium chloride (KCl) (Sigma, catalog number: P3911)
Protein assay reagents (e.g., Protein Assay Kit I, Bio-Rad, catalog number: 5000001EDU)
Ethanol (generic)
30% (w/v) acrylamide/methylene bisacrylamide solution (37.5:1 ratio) (e.g., ProtoGel 30%, National diagnostics, catalog number: EC-890)
TEMED (National Diagnostics, catalog number: EC-503)
Ammonium persulfate (National Diagnostics, catalog number: EC-504)
Tris base (e.g., Sigma, catalog number: T1503)
Boric acid (Sigma-Aldrich, catalog number: B0394)
Glycine (Sigma-Aldrich, catalog number: G7126)
Sodium citrate (Sigma-Aldrich, catalog number: S4641)
NADP-dependent IDH (Sigma-Aldrich, catalog number: I-2002)
Cis-aconitic acid (Sigma-Aldrich, catalog number: A-3412)
β-NADP (Sigma-Aldrich, catalog number: N-0505)
Thiazolyl blue tetrazolium bromide (also known as MTT) (Sigma-Aldrich, catalog number: M2128)
Phenazine methosulfate (PMS) (Sigma-Aldrich, catalog number: P-9625)
Magnesium chloride (MgCl2) (Sigma-Aldrich, catalog number: M4880)
Protease inhibitor cocktail (e.g., Roche Complete mini protease inhibitor cocktail tablet, Millipore Sigma, catalog number: 11836153001)
Dithiothreitol (DTT) (e.g., Pierce DTT, No-WeightTM Format Thermo Fisher Scientific, catalog number: A39255)
Glycerol (generic)
Manganese chloride (MnCl2) (Sigma-Aldrich, catalog number: M1787)
Bromophenol blue (Bio-Rad, catalog number: 1610404)
Pre-stained protein standard (e.g., Thermo Fisher SeeBlue Plus2, catalog number: LC5925)
Optional: ACO2 antibody (Proteintech, catalog number: 11134-1-AP)
Optional: Tubulin antibody (Sigma-Aldrich, catalog number: T9026)
Phosphate buffered saline (PBS) (e.g., Corning, catalog number: 46-013-CM)
Isopropyl alcohol (e.g., Sigma-Aldrich, catalog number: I9516)
Stock reagents:
1 M Tris-HCl (adjusted to pH 7.5 and 8.0 with HCl), store at room temperature (RT)
40 mM KCl, 25 mM Tris-Cl, pH 7.5, store at RT
25% Triton, store at RT
1 M sodium citrate (500×), store at -20 °C
20 mM MnCl2, store at -20 °C
20 mM β-NADP (20×), store at -20 °C
50 mM cis-aconitate (20×), store at -20 °C
1 M MgCl2, store at -20 °C
0.5 mg/20 μL PMS, store at -20 °C
10% ammonium persulfate (APS) (prepare fresh)
0.1 M DTT (prepare fresh)
Solutions
1% Triton-citrate extraction buffer (see Recipes)
RIPA-citrate extraction buffer (see Recipes)
Electrophoresis buffers for the human aconitase in-gel activity assay (see Recipes)
10× Tris-glycine-8.3 stock for running buffer
Running buffer: Tris-glycine-citrate-8.3
Gel buffer: Tris-borate-8.3
4× loading buffer
Gel recipes for the human aconitase in-gel activity assay (see Recipes)
Separating gel for human aconitases
Stacking gel for human aconitases
Electrophoresis buffers for the mouse aconitase in-gel activity assay (see Recipes)
10× Tris-glycine-8.7 stock for running buffer
Running buffer: Tris-glycine-citrate-8.7
Gel buffer: Tris-borate-8.7
4× loading buffer
Gel recipes for the mouse aconitase in-gel activity assay (see Recipes)
Separating gel for mouse aconitases
Stacking gel for mouse aconitases
Aconitase activity coupled enzyme assay mix (see Recipes)
Recipes
1% Triton-citrate extraction buffer
Reagent Final concentration Quantity or Volume Buffer (40 mM KCl, 25 mM Tris-Cl, pH 7.5) 9.18 mL Triton 25% 1% 0.40 mL Roche Complete mini protease inhibitor cocktail tablet 1 DTT 0.1 M (made fresh) 1.0 mM 0.10 mL Sodium citrate, 1 M, 500× 2.0 mM 0.020 mL MnCl2, 20 mM 0.60 mM 0.30 mL Total volume 10 mL Notes:
Store the Triton-citrate extraction buffer in 0.5–1 mL aliquots at -20 °C for 3–6 months.
Citrate is added to stabilize the Fe-S cluster in aconitase.
RIPA-citrate extraction buffer
Reagent Final concentration Quantity or Volume RIPA Lysis and Extraction Buffer 9.58 mL Roche Complete mini protease inhibitor cocktail tablet 1 DTT 0.1 M (made fresh) 1.0 mM 0.10 mL Sodium citrate, 1 M, 500× 2.0 mM 0.020 mL MnCl2, 20 mM 0.60 mM 0.30 mL Total volume 10 mL Notes:
Store the RIPA-citrate extraction buffer in 0.5–1 mL aliquots at -20 °C for 3–6 months.
Citrate is added to stabilize the Fe-S cluster in aconitase.
Electrophoresis buffers for the human aconitase in-gel activity assay
10× Tris-glycine-8.3 stock for running buffer
Reagent Final concentration Quantity or Volume Tris base 250 mM 30.2 g Glycine 1.92 M 144 g H2O Enough to make 1 L buffer Total volume 1.0 L Note: Do not adjust the pH of this 10× stock. The pH of this stock will be ~8.3.
Running buffer: Tris-glycine-citrate-8.3
Reagent Final concentration Quantity or Volume 10× Tris-glycine-8.3 stock 1× 80 mL 1 M sodium citrate 3.6 mM 2.88 mL H2O Enough to make 0.8 L buffer Total volume 0.80 L Gel buffer: Tris-borate-8.3
Reagent Final concentration Quantity or Volume Tris base 890 mM 108 g Boric acid 890 mM 55 g H2O Enough to make 1 L buffer Total volume 1.0 L Note: Do not adjust the pH of this stock. The pH of this buffer will be ~8.3.
4× loading buffer
Reagent Final concentration Quantity or Volume 1 M Tris-Cl pH 8.0 100 mM 0.10 mL Glycerol 40% 0.40 mL Bromophenol blue 1 mg 0.1% H2O Enough to make 1 mL buffer Total volume 1.0 mL Gel recipes for the human aconitase in-gel activity assay
For HeLa cell extract, an 8% acrylamide separating gel at pH 8.3 and electrophoresis at 170 V for 2.5 h at 4 °C gives a good resolution of two bands corresponding to ACO1 and ACO2. For better resolution of samples that contain more than two isoforms (e.g., aconitases with different phosphorylation), a 6% or 7% acrylamide separating gel may be used.
Separating gel for human aconitases
8% acrylamide
Tris-borate-citrate-8.3
mini gel
6% acrylamide
Tris-borate-citrate-8.3
mini gel
8% acrylamide
Tris-borate-citrate-8.3
big gel
ProtoGel 30% 1.68 mL 1.26 mL 6.7 mL Tris-borate-8.3 gel buffer 0.94 mL 0.94 mL 3.75 mL H2O 3.64 mL 4.06 mL 14.55 mL Sodium citrate, 1 M 22.5 μL 22.5 μL 90 μL APS 10% 31 μL 31 μL 125 μL TEMED 6.25 μL 6.25 μL 25 μL Stacking gel for human aconitases
4% acrylamide
Tris-borate-citrate-8.3
mini gel
4% acrylamide
Tris-borate-citrate-8.3
big gel
ProtoGel 30% 0.20 mL 0.80 mL Tris-borate-8.3 gel buffer 0.11 mL 0.45 mL H2O 1.16 mL 4.65 mL Sodium citrate, 1 M 4.2 μL 21 μL APS 10% 21 μL 84 μL TEMED 3.75 μL 15 μL Electrophoresis buffers for the mouse aconitase in-gel activity assay
10× Tris-glycine-8.7 stock for running buffer
Reagent Final concentration Quantity or Volume Tris base 250 mM 30.2 g Glycine 960 mM 72 g H2O Enough to make 1 L buffer Total volume 1.0 L Note: Do not adjust the pH of this 10× stock.
Running buffer: Tris-glycine-citrate-8.7
Reagent Final concentration Quantity or Volume 10× Tris-glycine-8.7 stock 1× 80 mL 1 M Sodium citrate 3.6 mM 2.88 mL H2O Enough to make 0.8 L buffer Total volume 0.80 L Gel buffer: Tris-borate-8.7
Reagent Final concentration Quantity or Volume Tris base 890 mM 54 g Boric acid 445 mM 13.75 g H2O Enough to make 0.5 L buffer Total volume 0.50 L Note: Do not adjust the pH of this stock.
4× loading buffer
Reagent Final concentration Quantity or Volume 1 M Tris-Cl pH 8.0 100 mM 0.10 mL Glycerol 40% 0.40 mL Bromophenol blue 1 mg 0.10% H2O Enough to make 1 mL buffer Total volume 1.0 mL Gel recipes for the mouse aconitase in-gel activity assay
For mouse liver samples, a 5%–6% acrylamide Tris-borate-citrate-8.7 separating gel and 4%–5% stacking gel and electrophoresis at 170 V for 3–4 h at 4 °C gives nice resolution and detection of two ACO1 bands and two ACO2 bands.
Separating gel for mouse aconitases
5% acrylamide
Tris-borate-citrate-8.7
mini gel
6% acrylamide
Tris-borate-citrate-8.7
mini gel
ProtoGel 30% 1.1 mL 1.26 mL Tris-borate-8.7 gel buffer 0.94 mL 0.94 mL H2O 4.22 mL 4.06 mL Sodium citrate, 1 M 22.5 μL 22.5 μL APS 10% 31 μL 31 μL TEMED 6.5 μL 6.5 μL Stacking gel for mouse aconitases
4% acrylamide
Tris-borate-citrate-8.7
mini gel
5% acrylamide
Tris-borate-citrate-8.7
mini gel
ProtoGel 30% 0.20 mL 0.25 mL Tris-borate-8.7 buffer 0.11 mL 0.11 mL H2O 1.16 mL 1.11 mL Sodium citrate, 1 M 4.2 μL 4.2 μL APS 10% 21 μL 21 μL TEMED 3.75 μL 3.75 μL Aconitase activity coupled enzyme assay mix
Prepare fresh immediately before use.
Reagent Final concentration Quantity or Volume Tris, 1 M, pH 8.0 100 mM 1.0 mL NADP, 20 mM (20×) 1.0 mM 0.50 mL cis-aconitate 50 mM (20×) 2.5 mM 0.50 mL MgCl2 1 M, (200×) 5.0 mM 0.050 mL MTT, 24 mM (20×) 1.2 mM 0.50 mL PMS (0.5 mg/20 μL) 40 μL IDH 5 U/mL Dependent on specific activity H2O ~7.40 mL Total 10 mL Notes:
Use 10–15 mL for small gels and more for big gels.
MTT is light-sensitive. Prewarm H2O at 37 °C in a light-protected container. Add the remaining reagents, IDH last, right before staining.
Laboratory supplies
Snap-cap or screw-cap microcentrifuge tubes that can be closed tightly (e.g., USA Scientific, catalog number: 1615-5500)
Homogenization beads (e.g., Next Advance ZrOB10 Zirconium Oxide Beads 1.0 mm)
Equipment
Refrigerated microcentrifuge
Homogenizer/cell disruptor (e.g., Next Advance Bullet Blender or mortar and pestle)
Vertical gel electrophoresis system (e.g., Bio-Rad Laboratories, model: Mini-PROTEAN® II)
Mini-gel glass plates (e.g., Gel Company, model: GBS07B-10S or GBS07L-10)
Mini-gel 10-lane or 12-lane 1.0 mm thick comb (Bio-Rad or Gel Company)
Mini-gel 10-lane or 12-lane 1.0 mm thick spacers (Bio-Rad or Gel Company)
pH meter
Scanner
Gel dryer
Software and datasets
Densitometric analysis software, e.g., ImageJ or similar software
Procedure
Prepare cell culture extracts
Notes:
Although protein extracts stored at -80 °C have been used successfully for aconitase in-gel assay, it is recommended to use fresh extracts because it generally results in a stronger signal and better-defined bands of activity. Repeated sample freeze-thaw can also decrease enzymatic activity.
If using fresh protein extracts for the non-denaturing PAGE, prepare the extracts while the gel is polymerizing and cooling (steps C2–4).
Keep reagents and tubes containing cell pellets and extracts at 0–4 °C between steps. The addition of the aconitase substrate citrate (or isocitrate) to the extraction and electrophoresis buffers protects the Fe-S cluster and markedly reduces the loss of aconitase activity.
Try to keep extract protein concentration high, e.g., 20–40 μg/μL, to keep the loading volume to a minimum for better resolution and to minimize the amount of salt and detergent loaded into the gel.
Harvest cell cultures and wash cell pellets 3× with PBS at 4 °C. Lyse the cell pellets for analysis immediately or flash-freeze cell pellets on dry ice. Store cell pellets at -80 °C until use.
Note: One 100 mm plate of near-confluent HeLa S3 cells yields approximately 1 mg of protein.
Lyse cell pellets using Triton-citrate or RIPA-citrate extraction buffer at 4 °C. Add 1–2 v/v of Triton-citrate or RIPA-citrate extraction buffer to each cell pellet. Disperse cells using a pipette. Incubate on ice for 10 min, with intermittent agitation. Centrifuge at >16,000× g for 5 min in a refrigerated microcentrifuge. Collect the supernatant (protein extract). Repeat the centrifugation step. Use the extracts immediately or store at -80 °C.
Notes:
A concentrated protein extract rather than a diluted extract is better for detection and resolution in the aconitase in-gel assay. Protein extract containing 20–40 μg of protein per microliter is a good starting point.
Aliquot samples if necessary. Repeated sample freeze-thaw can decrease enzymatic activity.
Proceed with protein quantification.
Note: We use Bradford Protein Assay from Bio-Rad and follow the manufacturers’ protocol. Other protein quantification methods may be used. For instance, a BCA detection kit can be used for extracts made without DTT.
Prepare tissue extracts
Notes:
Although extracts stored at -80 °C have been used successfully, it is recommended to use fresh extracts because it generally results in stronger signals and better-defined bands of activity. Repeated sample freeze-thaw can decrease enzymatic activity.
If using fresh protein extracts for the non-denaturing PAGE, prepare the extracts while the gel is polymerizing and cooling (steps C2–4).
Keep reagents and tubes containing cell pellets and extracts at 4 °C or on ice between steps. Set up the Bullet Blender in the cold room.
Oxygen levels vary between 0% and 19% in healthy mammalian tissues. Aconitase activity levels vary significantly in different mammalian tissues because of different expression levels and the tissue-specific Oz levels. Tissue extraction and electrophoresis procedures may also be carried out inside an anaerobic chamber, using reagents that were prepared with degassed H2O and/or equilibrated inside the anaerobic chamber. The addition of the aconitase substrate citrate (or isocitrate) to the extraction and electrophoresis buffers protects the Fe-S cluster and markedly reduces the loss of aconitase activity.
Try to keep extract protein concentration high, e.g., 20–40 μg/μL, to keep loading volume to a minimum and to minimize the amount of salt and detergent in the sample loaded.
Harvest tissues, cut into small pieces, and flash-freeze on dry ice. Store at -80 °C until use.
For homogenization using the Bullet Blender, chill microcentrifuge tubes containing ~100 μL of homogenization beads on dry ice.
Note: For homogenization using the Bullet Blender, microcentrifuge tubes that can be closed tightly are strongly recommended (e.g., high-quality snap-cap or screw-cap tubes).
Weight out 20–40 mg of tissue pieces in the microcentrifuge tubes containing the homogenization beads.
Add 5 μL of cold RIPA-citrate extract buffer per milligram of tissue to each tube, e.g., 100 μL of extraction buffer for 20 mg of tissue.
For mouse liver and heart samples, run the Bullet Blender for 2 min at speed 8 at 4 °C. Wait for 2 min. Repeat once.
Note: Homogenization times, speeds, and beads may need to be adjusted if working with different tissues. Follow the manufacturer’s instructions.
Centrifuge at 2,000× g for 2 min in a refrigerated microcentrifuge. Transfer the supernatant into chilled microcentrifuge tubes. Centrifuge at maximum speed (21,000× g) for 10 min at 4 °C. Transfer the supernatant (tissue RIPA extract) to chilled microcentrifuge tubes. Use immediately or store at -80 °C until use.
Notes:
Repeated sample freeze-thaw can decrease enzymatic activity. Aliquot extracts if needed.
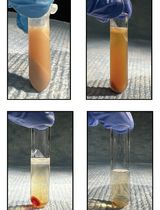
Some tissue extracts, e.g., liver, have high lipid content, which can cause band distortion in the in-gel assay. Carefully transfer the lower layer of the supernatant (the red aqueous phase containing the protein extract) into a clean, chilled microcentrifuge tube using a 200 μL pipette tip. Avoid pipetting the top white lipid layer. A gel loading tip can be substituted. Repeat centrifugation to remove more lipids. Carefully transfer the lower layer of the supernatant into a clean chilled microcentrifuge tube.
Proceed with protein quantification.
Note: We use Bradford Protein Assay from Bio-Rad and follow the manufacturers’ protocol. Other protein quantification methods may be used. For instance, a BCA detection kit can be used for extracts made without DTT.
Non-denaturing polyacrylamide gel electrophoresis
Notes:
We use a mini-Protean II PAGE system from Bio-Rad and gel spacers of 1.0 mm thickness.
Keep samples at 0–4 °C to minimize loss of enzymatic activity.
The electrophoresis should be run at a low temperature (0–4 °C) to minimize loss of enzymatic activities. Chill 1 L of H2O for making 1× running buffer more than 12 h before the experiment. Use running buffer at 0–4 °C. Chill down the electrophoresis cell before and during the electrophoresis. Run the electrophoresis with the electrophoresis cell in an ice bath or in a cold room.
Prepare 1× running buffer (see Recipes) and keep it cold (0–4 °C).
Cast the separating gel (see Recipes). Overlay the separating gel with 0.5 mL of isopropyl alcohol to exclude oxygen from the gel surface during polymerization and ensure an even interface between the separating and stacking gels. Allow polymerization to occur for 15 min at RT. After 15 min, rinse out the alcohol and remove residual H2O with a blotting paper.
Notes:
Prepare fresh 10% APS shortly prior to use.
Although visible gelation occurs in 15–20 min, polymerization continues for much longer (https://www.bio-rad.com/webroot/web/pdf/lsr/literature/Bulletin_1156.pdf). Allow >90 min for total separating gel polymerization time before running electrophoresis for best results.
For diluted samples, cast a shorter separating gel such that the height of the stacking gel is at least 2× the height of the sample in the well, which ensures band sharpness for large loading volumes (https://www.bio-rad.com/webroot/web/pdf/lsr/literature/Bulletin_6201.pdf).
Cast the stacking gel (see Recipes) and insert the well-forming comb without trapping air under the teeth. Allow polymerization to occur for 15 min at RT.
Assemble the electrophoresis cell.
Remove the comb from the gel, rinse wells with 1× running buffer, and assemble the electrophoresis cell.
Fill the inner and outer buffer chambers with cold running buffer. Allow gel polymerization and cooling to continue in an ice bath or in a cold room at 4 °C for 1 h.
Prepare loading samples: Mix the protein extract with the appropriate amount of the loading buffer and deionized H2O to reach 12–20 μL of final volume for a 12-well 1.0 mm thick gel. For example, to load 80 μg of protein per lane, add 4 μL of 20 µg protein/μL extract to 3 μL of 4× loading buffer and 5 μL of H2O.
Notes:
Do not boil the samples. Boiling results in irreversible loss of enzymatic activity.
The amount of total protein extract needed per lane could be variable depending on aconitase expression and activity levels. For human muscle biopsies and mouse liver extracts, 5–20 μg of protein per lane is a good starting point. For human or mouse cell lines cultured at 21% O2 atmosphere, 50–100 µg of protein per lane is a good starting point.
For best resolution, load a smaller volume rather than a larger volume. Using 12–16 µL of loading samples per lane in a 10- or 12-well mini-gel is a good starting point. However, if the extracted protein concentration is <20 μg/μL, to avoid high salt concentration in the loading samples, increase the loading volume and use a gel with a taller stacking gel.
Load samples slowly to allow them to settle evenly on the bottom of the wells.
Run electrophoresis at constant 170 V at 4 °C for 2.5–4 h for a mini-gel (8.3 × 10 cm) and 5–6 h for a big gel (16 × 20 cm).
Notes:
The electrophoresis running time may vary with different electrophoresis cells. For pilot experiments, use Invitrogen SeeBlueTM Plus2 Pre-Stained Standard as a guide. Running electrophoresis until the top two blue bands are ~2 cm apart is a good starting point for human and mouse aconitase in-gel assays.
Optional: Run a parallel SDS-PAGE gel with the same samples. After running the gel, perform immunoblot analysis using anti-aconitase and anti-tubulin antibodies or Coomassie staining to check protein loading.
In-gel aconitase activity staining
Notes:
The MTT reagent is sensitive to light. Avoid extended exposure of MTT to direct light.
IDH is sensitive to heat. Add IDH to the reaction mix immediately before staining the gel.
Prewarm the H2O for the aconitase activity assay mix: put the appropriate amount of H2O in a light-protected container (e.g., a tube wrapped in aluminum foil) and put the tube in a 37 °C water bath or incubator for >10 min.
Immediately before removing the gel from the glass plates, add all the assay reagents, except IDH, to the prewarmed H2O.
Remove the gel carefully from between the glass plates and place the gel in a clean tray (e.g., recycled pipette tip box).
Add IDH to the aconitase activity assay mix and add to the tray containing the gel. Cover with foil. Incubate with gentle agitation at RT or in a 37 °C incubator for 5–60 min.
Note: The staining time could be variable depending on aconitase expression level and activity. For human muscle biopsies and mouse liver extracts, strong signals may be visible in 5–15 min. For human or mouse cell cultures, incubate for 15–60 min.
Gel washing: Wash gel 5–10 times (5–10 min each) with H2O, with gentle agitation and protection from direct light.
Note: The total washing time could be variable depending on the staining time needed for a good signal of the aconitase activity. The longer the staining time, the longer the washing time needed to remove background staining. However, a very long washing time may result in weaker or less well-defined aconitase activity bands.
Gel drying: Dry gel between a filter paper and a plastic wrap using a gel vacuum dryer or air-drying methods. Take pictures or scan (>400 dpi) before (in case the gel cracks during drying) and after gel drying.
Comparison and quantification of aconitase activities can be done by densitometric analysis using open-source software following manufacturer’s instruction (e.g., ImageJ, https://imagej.net/ij/docs/guide/user-guide.pdf).
Validation of protocol
This protocol has been shown to be robust and reproducible in detecting changes in mammalian aconitase activities in response to oxidative or nitrative stress, iron depletion, and various pathophysiological conditions in human cell line HeLa S3 [1,4], human muscle biopsies [5], murine macrophage cell line RAW264.7 [6], human RAW264.7-mouse Caco2 co-culture [7], mouse tissues [8], etc. Statistical analyses in these studies were performed by Student's t-test for paired samples. All data are representative of three or more independent experiments. Figures 1 and 2 show some examples of in-gel activity assays for human and mouse aconitases, respectively. The assignment of bands corresponding to ACO1 and ACO2 was confirmed using subcellular fractions and extracts from ACO1 or ACO2 knockdown cells or knockout animals.
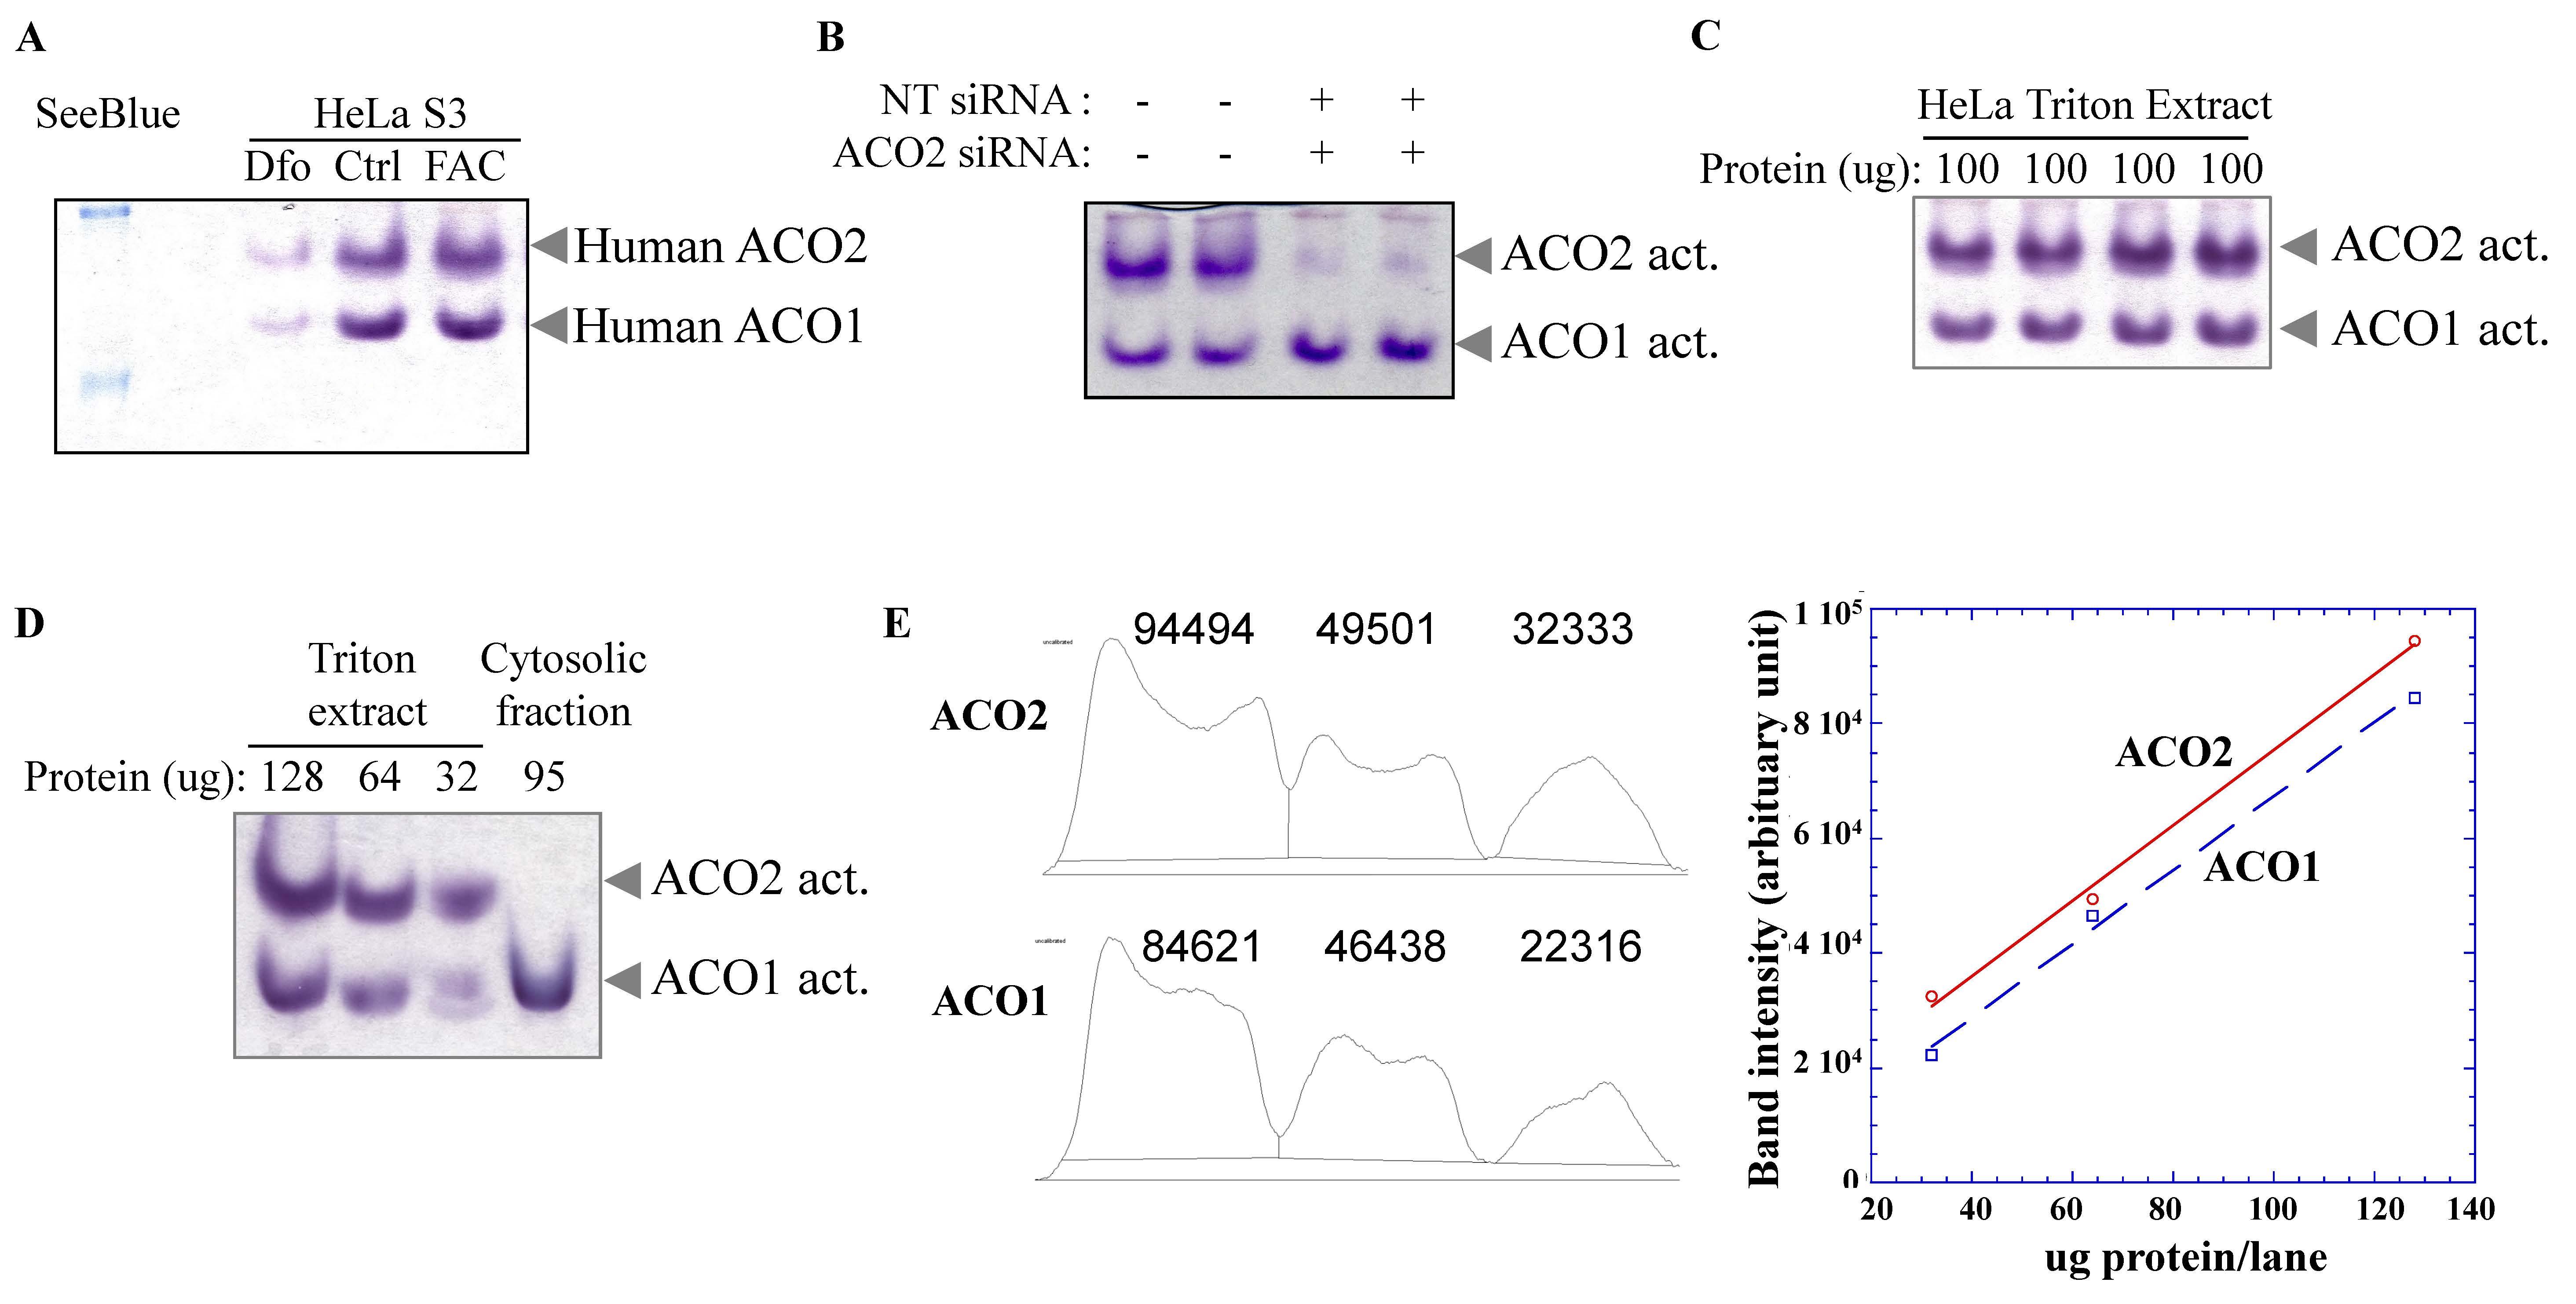
Figure 1. In-gel activity assays for human mitochondrial and cytosolic aconitases. Non-denaturing PAGE of HeLa S3 cell Triton extracts and subcellular fractions at constant 170 V at 4 °C for 2–2.5 h followed by gel staining with a coupled enzyme assay mix at 37 °C. (A) Iron deficiency, induced by treatment with the iron chelator Desferal (Dfo), lowers both ACO1 and ACO2 activities. Note: The aconitase bands run between the top two SeeBlue protein markers. (B) Aconitase in-gel assay of HeLa S3 cells transfected with non-targeting (NT) compared to ACO2 siRNA. 80 µg of protein were loaded in each lane in (A) and (B). (C) Aconitase in-gel assay of four separate HeLa S3 cell cultures demonstrated reproducibility of the assay. (D) Aconitase in-gel assay of HeLa S3 Triton extracts containing 128, 64, and 32 μg of protein, compared to a HeLa S3 cytosolic fraction. (E) Quantitative analysis of aconitase activity of the Triton extracts in (D).
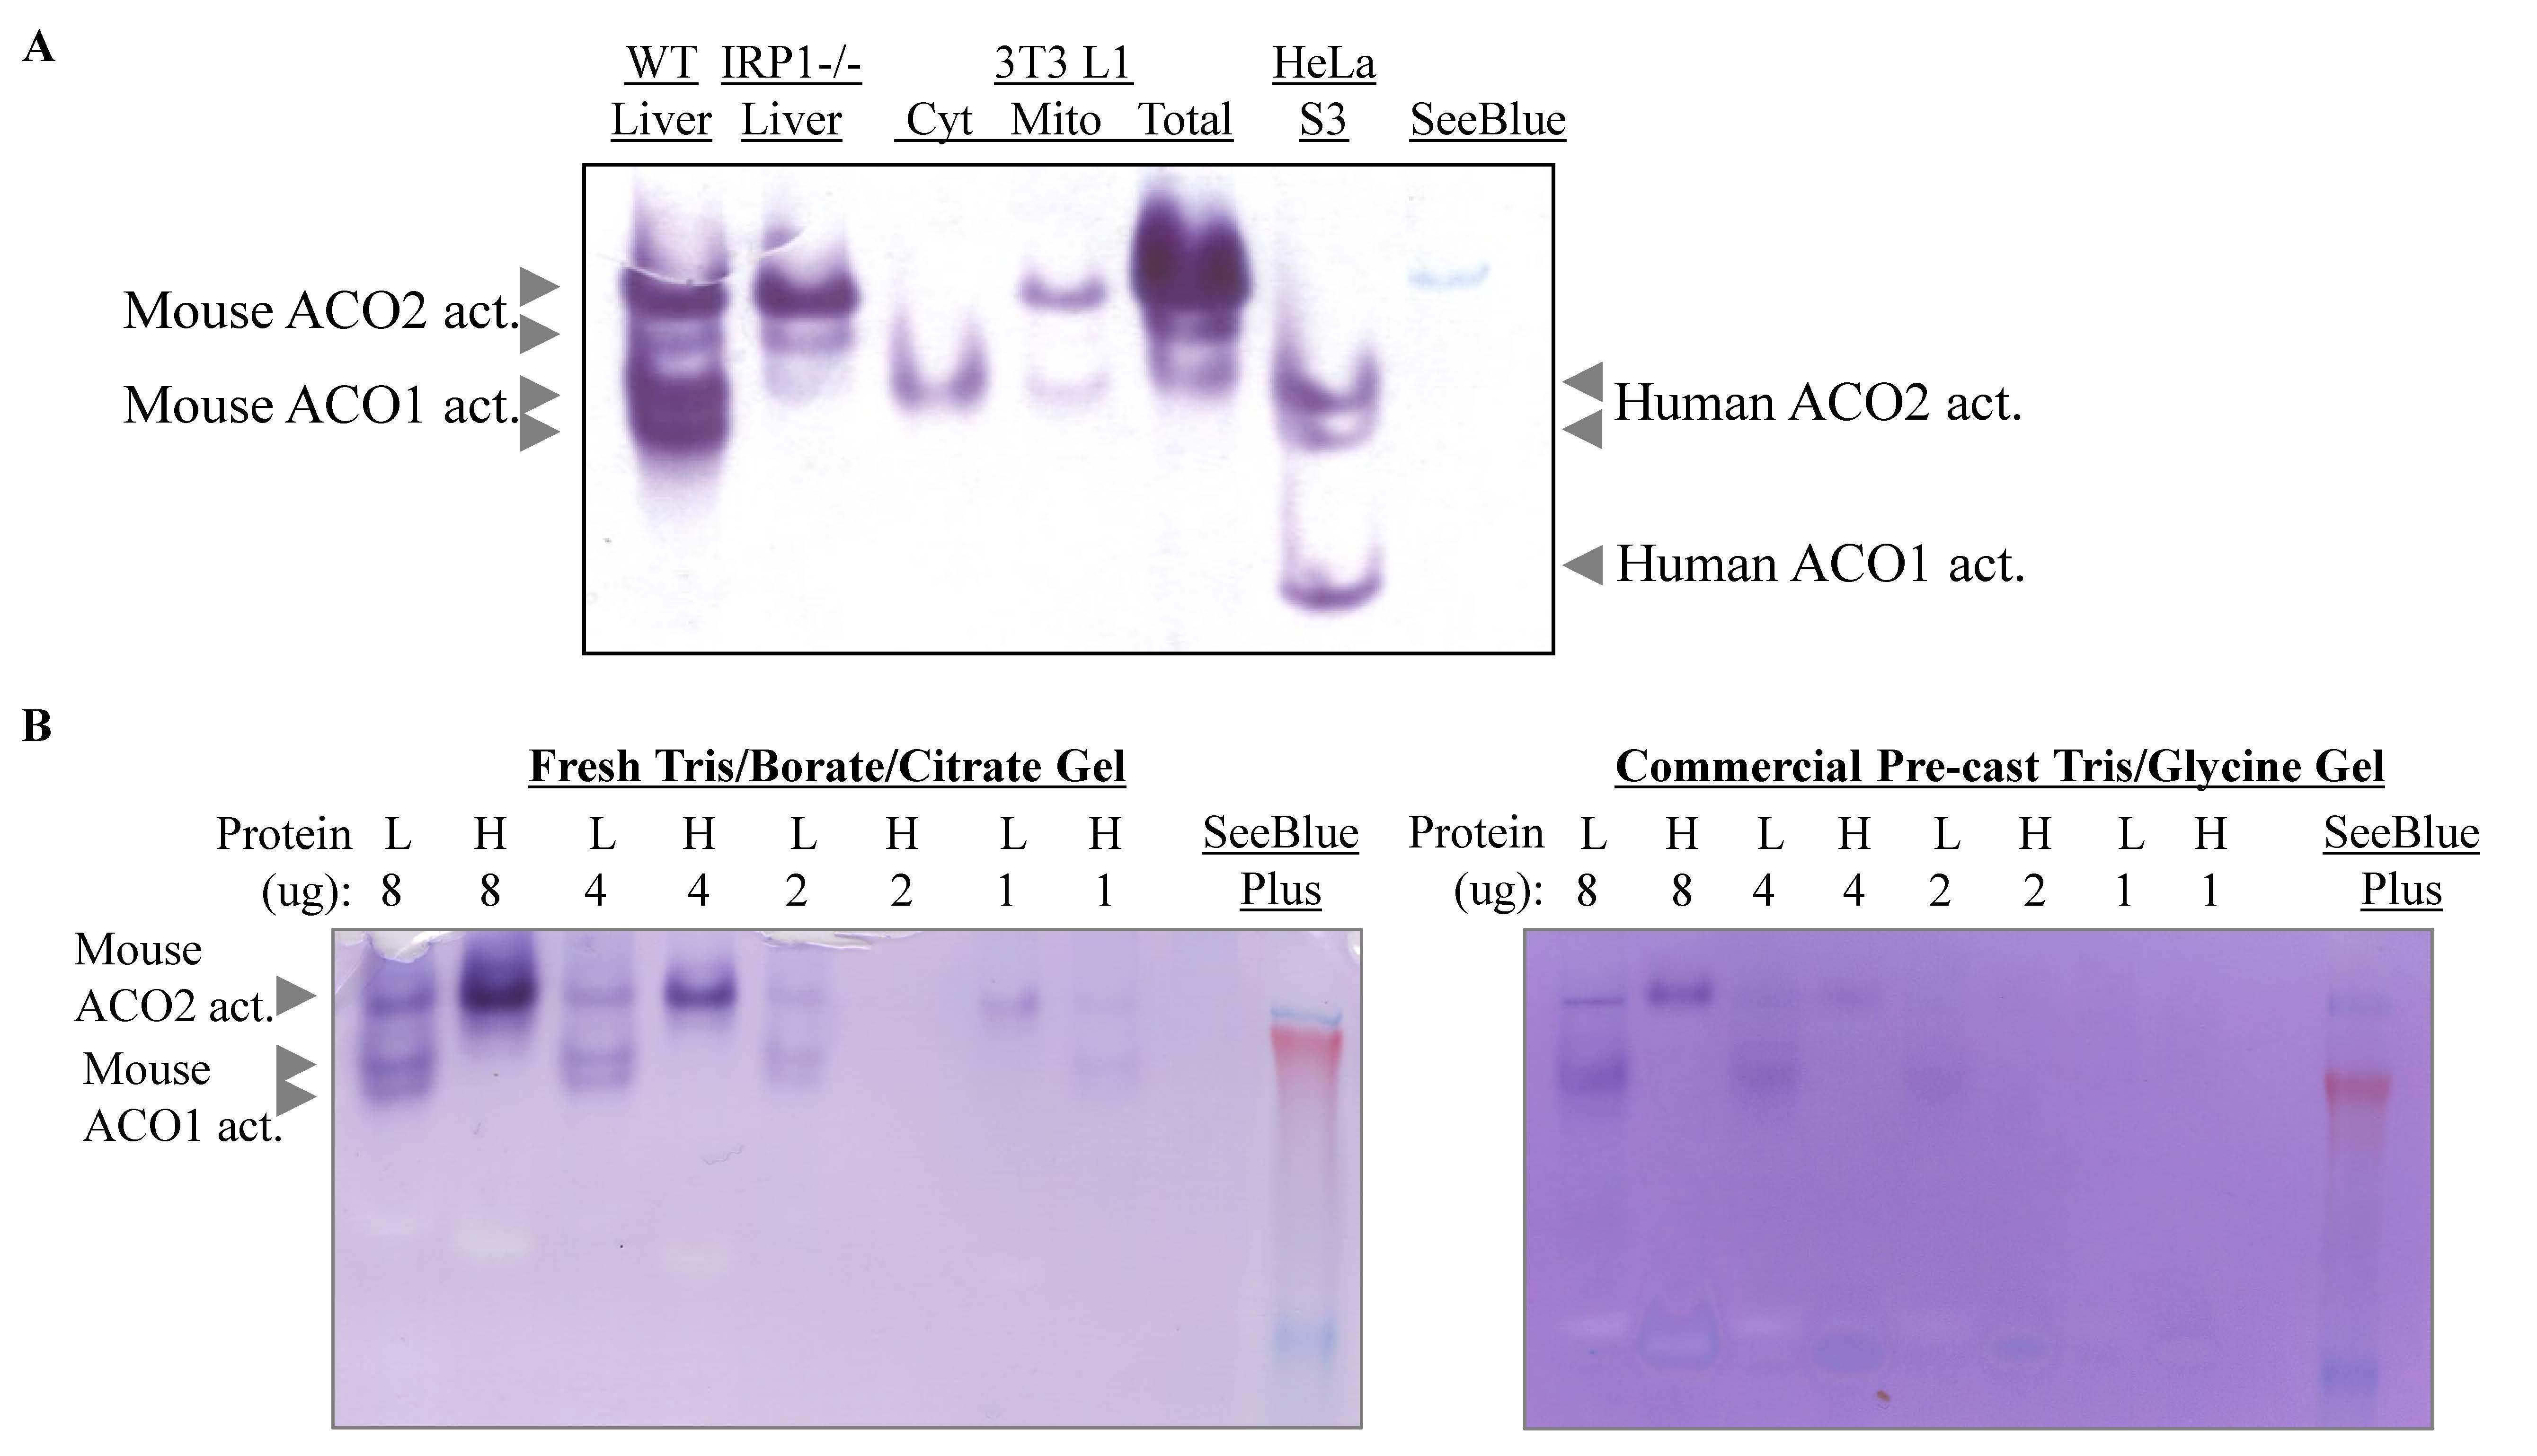
Figure 2. In-gel aconitase activity assays for mouse tissue or cell line extracts. Because of the difference in pKa values of the mouse and human aconitases, gels with 5%–6% acrylamide at a higher pH and longer running time (3–4 h) are needed for better resolution of mouse ACO1 and ACO2. (A) Comparison of aconitases in mouse liver extracts and mouse 3T3 L1 cell cytosolic (Cyt) and mitochondrial (Mito) fractions with human aconitases in HeLa cell lysates. Note: In wild-type (WT) mouse liver extracts, two mitochondrial aconitase isoforms and two cytosolic aconitase isoforms were detected, representing various states of phosphorylation and/or post-translational modification. In IRP1-/- mouse liver extracts, only the ACO2 isoforms were detected. (B) Aconitase in-gel assay of mouse liver (L) and heart (H) using a freshly prepared gel according to the current protocol showed a stronger signal and better resolution compared to a commercial pre-cast Tris-Glycine gel. Courtesy of Dr Suh Young Jeong. This panel also shows that different tissues have different relative amounts of ACO1 and ACO2 activities. For example, mouse heart samples have predominantly ACO2 activity.
General notes and troubleshooting
Advantages and limitations
The main advantage of the in-gel PAGE-based aconitase assay over the classical UV/vis spectrophotometric coupled enzyme assay [2] and commercial aconitase assay kits is that the in-gel assay allows simultaneous monitoring of mitochondrial and cytosolic aconitase activities without the need for the fractionation procedure, which is time-consuming and might result in loss of the oxygen-sensitive Fe-S cluster. However, in our experience, the in-gel assay is ~10× less sensitive than the UV/vis spectrophotometric coupled enzyme assay. In general, this is not an issue for our experiments using HeLa cells or mouse tissues, since we routinely obtained protein extracts at 20–40 μg protein/μL from a 100 mm plate of HeLa cells or a 15 mg piece of mouse liver, heart, or brain, which is enough for the in-gel aconitase assays and western blot controls. That said, for some cell lines, such as Hep3B, it might be more difficult to obtain protein extracts at 20 μg protein/μL from a 100 mm plate of cells (personal communication). Users who have a very limited amount of samples may consider using the UV/vis spectrophotometric coupled enzyme assay to measure total (mitochondrial and cytosolic) or subcellular fraction aconitase activities.
Aconitase in-gel assay using a gel freshly prepared according to the current protocol showed a stronger signal and better resolution compared to a commercial pre-cast Tris-Glycine gel (Figure 2B). One likely factor is the absence of citrate in the commercial pre-cast gel. Another factor is the buffer in the gels. We have made gels using Tris-glycine-citrate buffer for comparison and found that gels made with Tris-borate-citrate buffer gave sharper bands.
Troubleshooting
| Problem | Options |
| Bands appear smeared or distorted | Incomplete gel polymerization. Allow the gel to polymerize for a longer time. Use freshly prepared APS. Use new TEMED. |
| Detergent or gel residues on glass gel plates. Clean and rinse gel plates thoroughly. Optional: Wipe plates with alcohol. | |
| Gel too warm. Keep the gel and running buffer well-chilled before and during running. | |
High salt concentration in the loading sample. | |
| High lipid content (e.g., in liver samples). Remove the protein extract from under the lipid layer carefully. Repeat centrifugation if necessary. | |
| Poor resolution | Reduce the loading volume. Use more concentrated lysates. |
| Run electrophoresis for a longer time. | |
| Gel ran too fast. Current too high. Decrease voltage by 25%. | |
| Aconitase activity bands weak or not detected | Keep samples cold (0–4 °C) and run electrophoresis at a low temperature to minimize loss of enzymatic activities. |
| Use more IDH or a new batch of IDH and longer staining time. | |
| For tissue samples or cells cultured at low O2 atmosphere, reduce exposure of samples to O2. Degas (e.g., https://assets.thermofisher.com/TFS-Assets/LSG/Application-Notes/TR0029-Degas-buffers.pdf) or deoxygenate (e.g., equilibrating H2O or buffers inside an anaerobic hood or passing N2 gas through H2O or buffers using a gas dispersion tube) buffers. Run electrophoresis in an anaerobic chamber following the manufacturer’s instructions. | |
| Include a positive control, e.g., HeLa cells cultured in iron-rich media or mouse liver samples. |
Acknowledgments
We thank Dr. Esther Meyron-Holtz and Dr Suh Young Jeong for their valuable feedback in the testing of this protocol. This work was supported by the intramural program of the National Institute of Child Health and Human Development. The protocols were adapted from the research article of Tong et al. [4].
Competing interests
The author declares no conflicts of interest.
Ethical considerations
All experimental procedures including animal subjects were reviewed and approved by the National Institute of Child Health and Human Development Animal Care and Use Committee and met NIH guidelines for the humane care of animals.
References
- Tong, W. H. and Rouault, T. A. (2007). Metabolic regulation of citrate and iron by aconitases: role of iron–sulfur cluster biogenesis. BioMetals. 20549–564.
- Rose, I. A. and O'Connell, E. L. (1967). Mechanism of Aconitase Action. J Biol Chem. 242(8): 1870–1879.
- Missirlis, F., Hu, J., Kirby, K., Hilliker, A. J., Rouault, T. A. and Phillips, J. P. (2003). Compartment-specific Protection of Iron-Sulfur Proteins by Superoxide Dismutase. J Biol Chem. 278(48): 47365–47369.
- Tong, W. H. and Rouault, T. A. (2006). Functions of mitochondrial ISCU and cytosolic ISCU in mammalian iron-sulfur cluster biogenesis and iron homeostasis. Cell Metab. 3(3): 199–210.
- Mochel, F., Knight, M. A., Tong, W. H., Hernandez, D., Ayyad, K., Taivassalo, T., Andersen, P. M., Singleton, A., Rouault, T. A. and Fischbeck, K. H. (2008). Splice Mutation in the Iron-Sulfur Cluster Scaffold Protein ISCU Causes Myopathy with Exercise Intolerance. Am J Hum Genet. 82(3): 652–660.
- Tong, W. H., Maio, N., Zhang, D. L., Palmieri, E. M., Ollivierre, H., Ghosh, M. C., McVicar, D. W. and Rouault, T. A. (2018). TLR-activated repression of Fe-S cluster biogenesis drives a metabolic shift and alters histone and tubulin acetylation. Blood Adv. 2(10): 1146–1156.
- Fahoum, L., Moshe-Belisowski, S., Zaydel, K., Ghatpande, N., Guttmann-Raviv, N., Zhang, W., Li, K., Tong, W. H., Nyska, A. and Waterman, M. (2024). Iron regulatory protein 1 is required for the propagation of inflammation in inflammatory bowel disease. J Biol Chem. 300(9): 107639.
- Jeong, S. Y., Hogarth, P., Placzek, A., Gregory, A. M., Fox, R., Zhen, D., Hamada, J., van der Zwaag, M., Lambrechts, R. and Jin, H. (2019). 4'‐Phosphopantetheine corrects CoA, iron, and dopamine metabolic defects in mammalian models of PKAN. EMBO Mol Med. 11(12): e201910489.
Article Information
Publication history
Received: Jun 20, 2024
Accepted: Sep 25, 2024
Available online: Oct 17, 2024
Published: Dec 5, 2024
Copyright
© 2024 The Author(s); This is an open access article under the CC BY-NC license (https://creativecommons.org/licenses/by-nc/4.0/).
How to cite
Tong, W. H. and Rouault, T. A. (2024). In-Gel Activity Assay of Mammalian Mitochondrial and Cytosolic Aconitases, Surrogate Markers of Compartment-Specific Oxidative Stress and Iron Status. Bio-protocol 14(23): e5126. DOI: 10.21769/BioProtoc.5126.
Category
Cell Biology > Cell metabolism > Other compound
Molecular Biology > Protein > Activity
Do you have any questions about this protocol?
Post your question to gather feedback from the community. We will also invite the authors of this article to respond.