- Protocols

- Articles and Issues
- For Authors
- About
- Become a Reviewer

Small-Molecule Probe for Imaging Oxidative Stress–Induced Carbonylation in Live Cells
Published: Vol 14, Iss 22, Nov 20, 2024 DOI: 10.21769/BioProtoc.5112 Views: 1586
Reviewed by: Komuraiah MyakalaThomas LintoAnonymous reviewer(s)
Original research article
The authors used this protocol in:

May 2020
Advertisement


Protocol Collections
Comprehensive collections of detailed, peer-reviewed protocols focusing on specific topics


Related protocols
Abstract
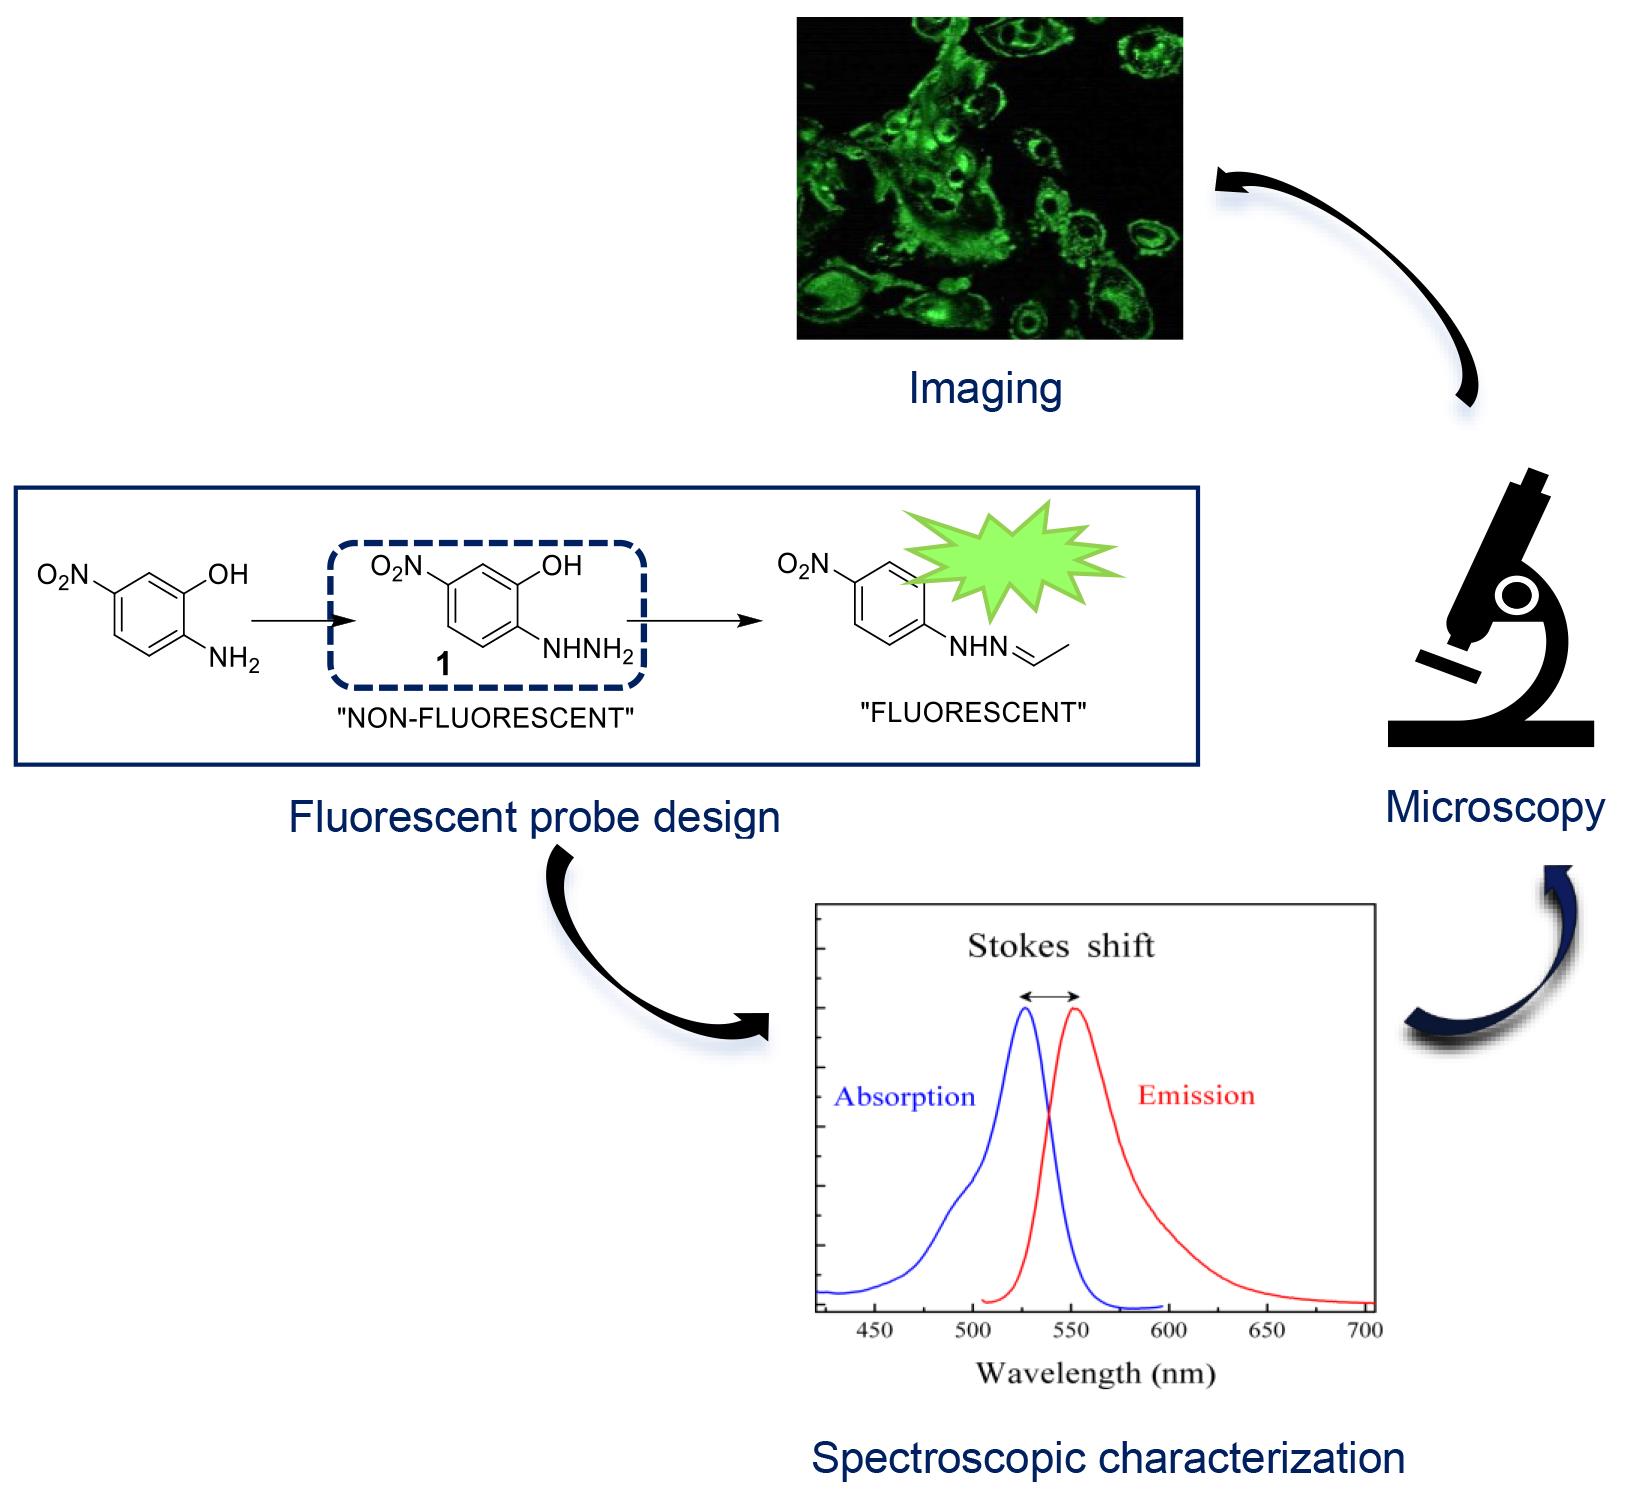
Protein carbonylation has been known as the major form of irreversible protein modifications and is also widely used as an indicator of oxidative stress in the biological environment. In the presence of oxidative stress, biological systems tend to produce large amounts of carbonyl moieties; these carbonyl groups do not have particular UV-Vis and fluorescence spectroscopic characteristics that we can differentiate, observe, and detect. Thus, their detection and quantification can only be performed using specific chemical probes. Commercially available fluorescent probes to detect specific carbonylation in biological systems have been used, but their chemical portfolio is still very limited. This protocol outlines the methods and procedures employed to synthesize a probe, (E,Z)-2-(2-(2-hydroxybenzylidene)hydrazonyl)-5-nitrophenol (2Hzin5NP), and assess its impact on carbonylation in human cells. The synthesis involves several steps, including the preparation of its hydrazone compounds mimicking cell carbonyls, 2-Hydrazinyl 5-nitrophenol, (E,Z)-2-(2-ethylidenehydrazonyl)-5-nitrophenol, and the final product (E,Z)-2-(2-(2-hydroxybenzylidene)hydrazonyl)-5-nitrophenol. The evaluation of fluorescence quantum yield and subsequent cell culture experiments are detailed for the investigation of 2Hzin5NP effects on cell proliferation and carbonylation.
Key features
• This protocol builds upon probe development using click chemistry method by Dilek et al. [1], and its biolabeling application in renal cancer cell lines.
• The non-fluorescent probe has a fast reaction with carbonyl moieties at neutral pH to form a stable fluorescent product leading to a spectroscopic alteration.
• Microscopic and fluorometric analyses can distinguish the exogenous and endogenous ROS-induced carbonylation profile in human dermal fibroblasts along with renal cell carcinoma.
• Carbonylation level that differs in response to exogenous and endogenous stress in healthy and cancer cells can be detected by the newly synthesized fluorescent probe.
Keywords: Bioorthogonal chemistryGraphical overview
Background
Fluorescent probes play a crucial role in visualizing cellular events; the development of probes for imaging oxidative stress-induced carbonylation in live cells represents a significant area of research [1–4]. Oxidative stress–induced protein carbonylation is a key marker of cellular damage and is implicated in various pathological conditions, including neurodegenerative diseases and cancer [5–7]. This area of study aims to enhance our understanding of cellular responses to oxidative stress [8] and provides potential targets for therapeutic interventions [9,10]. Several methodologies have been employed to study protein carbonylation, including immunoblotting and mass spectrometry [11]. However, these techniques often lack spatiotemporal resolution and may require cell fixation, preventing real-time observation. Fluorescent probes, therefore, offer the advantage of live-cell imaging, allowing dynamic monitoring of carbonylation processes [12,13]. To monitor carbonylation in live-cell imaging, the click chemistry method [14,15] is often used as a fast conjugation method, which can be characterized by high efficiency, selectivity, and compatibility with biological systems [16], exemplified by the hydrazine-hydrazone chemistry, where the reactive hydrazine group reacts with an aldehyde or ketone moiety to form a stable hydrazone linkage [17]. This chemistry has been widely employed in the development of fluorescent probes, such as utilizing a fluorescent dye conjugated with an aldehyde group that selectively reacts with a hydrazine-functionalized biomolecule, enabling precise visualization and tracking within biological systems. Our protocol employs a fluorescent probe, (E,Z)-2-(2-(2-hydroxybenzylidene)hydrazonyl)-5-nitrophenol (2Hzin5NP), facilitating real-time observation of oxidative stress–induced carbonylation in live cells. The protocol includes a WST-1 cell proliferation assay and quantification of carbonylation in cell lysate, enabling quantitative assessment of cellular responses. One particular limitation of using this probe for carbonylation imaging is its specificity for responding to an oxidative stress environment; this should be validated against other cellular processes. The protocol involves detecting carbonylation levels in renal carcinoma cell lines A-498 and ACHN, as well as in human dermal fibroblasts (HDF), using these as cell models [18]. However, its applicability to other cell types should also be investigated. Beyond imaging oxidative stress–induced carbonylation, this protocol may find applications in drug discovery and cellular signaling such as assessing the impact of potential therapeutics on oxidative stress–induced cellular damage and investigating the role of carbonylation in cellular signaling pathways. In conclusion, the presented protocol offers a valuable tool for researchers in the field of oxidative stress, enabling live-cell imaging of carbonylation with potential applications in various scientific domains. The stepwise synthesis and quantitative analysis contribute to the protocol's robustness, though ongoing research will refine its specificity and broaden its applicability.
Materials and reagents
Cell lines
A-498, primary human kidney epithelial carcinoma, adherent (ATCC, catalog number: Htb-44)
ACHN, metastatic renal cell adenocarcinoma, adherent (ATCC, catalog number: Crl-1611)
HDF, human dermal fibroblast, adherent (ATCC, catalog number: PCS 201-012)
Chemicals
Chemical synthesis
Silica gel (silica gel 60-200 mesh) (2.5 kg) (Merck, catalog number: 107734)
Hexane (2.5 L) (Merck, catalog number: 104368)
Ethanol (EtOH) (100%) (Merck, catalog number: M.100986.2500)
Chloroform (Merck, catalog number: SC.CL.0200.2500)
Dichloromethane (2.5 L) (Merck, catalog number: M.106050.2500)
Acetone (2.5 L) (Merck, catalog number: M.100013.2500)
Hydrochloric acid (HCl) (2.5 L) (Merck, catalog number: 100317)
Sodium hydroxide pellets (Merck, catalog number: 106498)
Sodium chloride (VWR, catalog number: SC.SO.0227.1000)
Methanol (spectral grade, anhydrous) (2.5 L) (Merck, catalog number: 106009)
Dioxane (1 L) (Spectrophotometric, catalog number: 154822)
Methanol (normal, 2.5 L) (Sigma-Aldrich, catalog number: 34885)
Sodium nitrite (1 kg) (Merck, catalog number: 106544)
Tin (II) chloride (Stannous chloride) (100 g) (Fluka, catalog number: 31669)
2-Amino-5-Nitrophenol (100 g) (Sigma, catalog number: 303585)
Diethyl ether (1 L) (Merck, catalog number: 100921)
TLC aluminum sheets (Merck, catalog number: 105554)
Cell culture media
Dulbecco’s modified Eagle’s medium (DMEM), high glucose (Gibco, catalog number: 41966)
Fetal bovine serum (FBS), cell culture tested (Gibco, catalog number: 10082)
Other reagents for cell culture
Bovine serum albumin (BSA), protein standard (Sigma, catalog number: P0834)
Dimethyl sulfoxide (DMSO) (Santa Cruz, catalog number: Sc-202581)
Dulbecco’s phosphate buffered saline (PBS) (Pan Biotech, catalog number: P04-53500)
H2O2 (50 wt % in H2O) (Sigma, catalog number: 519813)
L-Glutamine (Invitrogen, catalog number: 25030)
Methanol 99% (Sigma, catalog number: 34885)
Phenylmethanesulfonylfluoride (PMSF) (Sigma, catalog number: 78830)
Protease inhibitor (Pi) (Sigma, catalog number: P8340)
Penicillin-streptomycin (Thermo Scientific, catalog number: Sv30010 or Biochrom, catalog number: A2213)
Trypsin-EDTA (Biochrom, catalog number: L2153)
Kits
Cell Proliferation Reagent WST-1 (Roche, catalog number: 05015944001)
Protein Assay Reagent A (Bio-Rad, catalog number: 5000113)
Protein Assay Reagent B (Bio-Rad, catalog number: 5000114)
DCFDA, Cellular Reactive Oxygen Species Detection Assay Kit (Abcam, catalog number: Ab113851)
Small equipment and other supplies
Bright-LineTM hemocytometer (Sigma-Aldrich, catalog number: Z359629)
Coverslip (Sigma-Aldrich, catalog number: Z375357)
Electronic pipette (CAPP Aid)
Filter 0.22 mm (TPP), 0.45 mm (Santorium Stedim Biotech)
Graduated cylinder 50, 250, 500, 1,000 mL (Isolab)
Micropipettes 10, 20, 100, 200, 1,000 μL (Eppendorf Research)
Pipette tips 10, 100, 200, 1,000 µL (Capp Expell Plus)
Polypropylene centrifuge tubes 0.5, 1.5, 2, 15, 50 mL (Isolab)
Serological pipettes 2, 5, 10, 25 mL (Grenier Bio or Axygen)
Tissue culture flasks, T-25, T-75, T-150 (TPP or Grenier-Bio)
Multiple-well cell culture plates and cryovials (TPP or Grenier-Bio)
Whatman paper (Isolab)
Equipment
-80 °C freezer (Thermo, model: Forma -86 C ULT Freezer)
Bruker Avance III 500 MHz Spectrometry
Centrifuge (Hettich, model: Mikro 22r and Sigma, model: 2-5 Centrifuge)
CO2 Incubator (Nuaire, model: Nu5510/E/G)
Confocal microscope (Zeiss, model: Lsm 800)
Fluorescence microscope (Nikon, model: 80i Eclipse Fluorescence Microscope)
Fume Hood (Greenlab)
Heater (Bioer, model: Mb102)
Laminar flow cabinet (ESCO Lab culture Class II Biohazard Safety Cabinet 2A)
Light microscope (Nikon, model: Eclipse #Ts100)
Magnetic stirrer (Heidolph, model: Mr 3004)
pH meter (Hanna Instruments, model: Ph211)
Rotary evaporator (Heidolph, model: Hei-VAP Silver Packages)
UV lamb, cabinet (CAMAG)
Varioskan Lux multimode microplate reader (Thermo Fisher)
Vortex (Stuart Sa8p)
Water bath (Stuart, model: Sb540)
Software and datasets
GraphPad Prism 6
Free versions of SigmaPlot Software and ChemDraw
Procedure
Organic syntheses
Synthesis of 2-hydrazinyl-5-nitrophenol HCl salt In a fume hood, prepare a cold solution of sodium nitrite (106 mg, 1.5 mmol) by dissolving it in 385 μL of water. Keep this solution cold by storing it in an ice container. In a separate container, prepare a cold solution of 2-Amino-5-nitrophenol (200 mg, 1.3 mmol) in 648 μL of HCl and keep it on ice as well. Slowly add the cold sodium nitrite solution dropwise to the cold 2-Amino-5-nitrophenol solution while maintaining the mixture on ice. Make sure to perform this step under a chemical fume hood to safely handle the hazardous chemicals.
Stir the mixture for 1 h at -5 °C, keeping it in a container filled with ice. Add sodium chloride to the ice to maintain the temperature at -5 °C or lower. Meanwhile, prepare a solution of stannous chloride (931 mg, 4.1 mmol) by dissolving it in 927 μL of cold HCl. Slowly add this stannous chloride solution to the reaction mixture while maintaining the low temperature.
Mix the reaction for 1 h at -5 °C.
Vacuum filter the mixture and wash the precipitate with cold methanol and diethyl ether. The reaction should yield dried 2-Hydrazine-5-nitrophenol HCl salt (177 mg) with a yield of 66%.
Stir 2Hzin5NP (400 mg, 2.36 mmol) and salicylaldehyde (2.5 mL, 23.6 mmol) in 19 mL of MeOH for 1 h at room temperature.
After stirring, cool the reaction mixture in an ice bath and then filter the mixture.
Wash the solid product with cold MeOH and dry it under vacuum. This should yield 155 mg of fluorescent product with a yield of 24%. The product exhibits an Rf value of 0.39 on TLC plates using a mixture of hexane and ethyl acetate (7:4) as eluents.
Stir 2Hzin5NP (90 mg, 0.53 mmol) and acetaldehyde (29 μL, 0.44 mmol) in 2.4 mL of EtOH for 1 h at room temperature.
After stirring, cool the reaction mixture in an ice bath, then filter the mixture.
Wash the solid product with cold EtOH and dry it under vacuum. This should yield 90 mg of fluorescent product with a yield of 87%.
TLC plate (silica gel or another appropriate stationary phase)
Solvent (mobile phase): Prepare 7:4 hexane/ethyl acetate solvent
Sample(s) to analyze
Developing chamber (e.g., beaker with lid)
Pencil
Ruler
UV lamp or staining reagent (if needed)
Tweezers
Prepare the TLC plate
Use a pencil to draw a baseline approximately 1 cm from the bottom edge of the TLC plate. Do not use a pen, as the ink may dissolve in the solvent.
Mark the spots where you will apply the sample along the baseline.
Spot the samples
Using a capillary tube, carefully apply a small drop of each sample dissolved in methanol onto the marked spots on the baseline. Allow the spots to dry before proceeding.
Prepare the developing chamber
Fill the developing chamber with a small amount of solvent (mobile phase) to a depth of approximately 0.5 cm. Make sure the solvent level is below the baseline on the TLC plate.
Place a lid or cover on the chamber to saturate the atmosphere with solvent vapor.
Develop the TLC plate
Carefully place the TLC plate in the developing chamber using tweezers, ensuring that the baseline remains above the solvent level.
Allow the solvent to rise up the plate by capillary action until it reaches approximately 1–2 cm below the top edge of the plate.
Remove the plate from the chamber and immediately mark the solvent front (the highest point reached by the solvent) with a pencil.
Visualize the spots
Examine the plate under UV light or use a suitable staining reagent to visualize the spots. Mark the center of each visible spot with a pencil.
Measure and calculate the Rf values
Measure the distance from the baseline to the center of each spot (distance traveled by the compound).
Measure the distance from the baseline to the solvent front (distance traveled by the solvent).
Calculate the Rf value for each compound using the formula:
Rf = Distance traveled by the compound/Distance traveled by the solvent
Document the results
Record the Rf values along with any observations (e.g., color, intensity) in your lab notebook.
Interpret the results
Compare the calculated Rf values with reference values to identify the compounds.
Notes:
i. Ensure that the TLC plate is handled carefully to avoid contamination.
ii. The Rf value is unitless and typically ranges from 0 to 1.
iii. Perform the TLC in a well-ventilated area or fume hood if using volatile or hazardous solvents.
Cell culture
Preparation of cells Culture HDF, A-498, and ACHN cells in DMEM containing 4.5 g/L glucose, 1 mmol/L sodium pyruvate, and 200 mM L-glutamine supplemented with 10% (v/v) FBS and 1% (v/v) penicillin-streptomycin.
Maintain them in a humidified incubator with 5% CO2 at 37 °C.
Once the cells reach 80% confluency (occupying 80% of the available surface area of the culture vessel), subculture them using a trypsin-EDTA solution (0.05%).
Subculture A498, ACHN, and HDF cells when they reach approximately 80% cell confluency. After discarding the media, rinse the cell monolayer with PBS. Incubate the cells with 25% Trypsin/5 mM EDTA solution in PBS (pH 7.4) at 37 °C for 5 min.
Mix the detached cell suspension with 10% FBS (v/v) complete DMEM in twice the volume of trypsin to inhibit trypsin activity. Centrifuge the cell suspension at 300× g for 5 min.
Discard the supernatant and resuspend the cell pellet in complete DMEM growth medium. Seed the cells in a new tissue culture flask.
Use a hemocytometer for cell counting. Load a 10 µL aliquot of the cell suspension into the square of the hemocytometer.
Count the cells three times, focusing on the center of the square under the inverted light microscope using a 20× objective lens. Calculate the cell concentration using the following equation:
Cell number/mL = number of counted cells × dilution factor/mm2 × chamber depth
After trypsinizing the cells and counting them, suspend the cells with a freezing mixture consisting of 10% (v/v) DMSO in heat-inactivated FBS.
Suspend approximately 1 × 10⁶ cells in 1 mL of the freezing mixture and transfer the suspension into a cryovial.
Place the cryovials in a -80 °C freezer for at least 16 h. Then, transfer the cryovials into a liquid nitrogen tank for long-term storage.
Retrieve the cryopreserved cells from either the liquid nitrogen tank or the -80 °C freezer and quickly warm them up to 37 °C in a water bath.
Add the cell suspension dropwise into complete DMEM to prevent cell disruption due to the osmotic pressure difference between the freezing mixture and the medium.
Centrifuge the cell suspension at 300× g for 5 min.
Discard the supernatant and resuspend the cell pellet in 5 mL of complete DMEM.
Seed the cells into a T-25 tissue culture flask.
After the cells attach to the flask, which usually takes approximately 12–24 h, exchange the medium with fresh complete DMEM to remove excess DMSO.
Seed HDF (5,000 cells/well), A-498 (10,000 cells/well), and ACHN (10,000 cells/well) cells in 100 μL into 96-well plates and allow them to adhere overnight (~16 h).
Treat the cells with H2O2 (0.5, 1, 1.5, 2, and 2.5 mM) in FBS-free DMEM for 2 h and wash the cells with serum-free media to remove H2O2.
Incubate cells with 2Hzin5NP (5, 10, 15, 20, 25, and 50 μM) in PBS (pH 7.4) for 30 min at 37 °C.
After removing the media, wash the cells thrice with PBS (5 min washes) and then incubate them with DMEM at 37 °C for 24 h.
Assess the effects of H2O2 and subsequent 2Hzin5NP treatment on cell proliferation using the WST1 assay, following the manufacturer’s instructions.
Measure absorbance values at 450 and 650 nm using a Varioskan Lux multimode microplate reader. Calculate the percentage of cell viability by normalizing the values to non-treated control cells, which should be adjusted to 100% using the formula: Asample × 100/Acontrol.
Pre-treat HDF, A-498, and ACHN cells with increasing concentrations of sodium pyruvate (0, 1, and 2 mM) in complete DMEM for 1 h at 37 °C. After incubation, treat the cells with 2 mM H2O2 in FBS-free medium at 37 °C for 2 h.
Following H2O2 treatment, discard the medium and wash the cells once with PBS.
For hydrazine labeling, incubate A-498 cells with 20 μM 2Hzin5NP, while subjecting ACHN and HDF cells to 15 μM 2Hzin5Np in PBS for 30 min.
To induce endogenous carbonylation, serum-starve the cells in DMEM for up to 24 h and then label them with 2Hzin5NP.
Image the cells using a Zeiss LSM 800 confocal microscope at room temperature after washing them once with PBS.
Excite the samples using diode 405 and 488 lasers and collect the emission using long pass (LP) 435 and 518 filters.
Collect cell pellets from HDF, A-498, and ACHN cells and suspend them in 500 μL of lysis buffer containing 0.05 mM PMSF and a protease inhibitor cocktail dissolved in dH2O.
Lyse the cells by subjecting them to six consecutive freeze-thaw cycles using liquid nitrogen and a water bath at 37 °C.
Determine the protein content using the DC protein assay following the manufacturer’s instructions. Generate a standard curve using BSA standards in the concentration range of 0.05–1 mg/mL.
Measure the fluorescence intensity of H2O2-treated and labeled cell lysates using a Varioskan Lux multimode microplate reader with excitation wavelength set at 396 nm and emission wavelength set at 502 nm.
Biochemical analysis
Cytotoxicity of H2O2 treatment Seed A498, ACHN, and HDF cells at a density of 10,000 cells/well, and HDF cells at a density of 5,000 cells/well into a 96-well plate.
Incubate the cells for 9 h.
Treat the cells with 0.5, 1, 1.5, 2, and 2.5 mM H2O2 in FBS-free standard DMEM for 120 min.
Following H2O2 treatment, change the medium with standard complete DMEM and incubate the cells at 37 °C for 24 h.
Dissolve 10% WST-1 reagent in standard complete DMEM, then add 50 µL of the WST-1 mix to the cells and incubate for 1 h at 37 °C.
Measure absorbance values at 450 and 650 nm using a Varioskan Lux multimode microplate reader.
Subtract the background absorbance at 650 nm from the formazan absorbance at 450 nm.
Plate A498, ACHN, and HDF cells at a density of 10,000 cells/well, and HDF cells at a density of 5,000 cells/well into a 96-well plate.
Incubate the cells for 9 h and treat the cells with 5, 10, 15, 20, 25, and 50 µM 2Hzin5np in PBS (pH 7.4) for 30 min at 37 °C.
After treatment, discard the labeling reagent and wash the cells with PBS (pH 7.4).
Incubate the cells with standard complete DMEM at 37 °C for 24 h.
To measure cell viability, add 50 µL of standard complete DMEM containing 10% WST-1 reagent to each well and incubate for 1 h at 37 °C.
To detect the level of ROS after hydrogen peroxide treatment, label cells with DCFDA (2′,7′-dichlorofluorescin diacetate), a cellular reactive oxygen species detection assay kit. Count A498 and ACHN cells, seed them into a 96-well plate at a density of 10,000 cells/well, and incubate for 24 h.
While A498 cells are incubated with the maximum non-toxic dose of H2O2 at 2.5 mM, ACHN cells are incubated with the maximum non-toxic dose of H2O2 at 2 mM in FBS-free standard DMEM for 120 min. After treatment, discard the medium and wash the cells with PBS (pH 7.4).
Then, load 50 µL of 20 µM DCFDA in PBS (pH 7.4) into each well and incubate cells for 3 min in the dark at room temperature. Subsequently, wash cells with PBS (pH 7.4) and immediately image with a fluorescence microscope using a green fluorescence filter.
Spectroscopic and chemical analysis
Warm-up period: Turn on the FluoroMax-4 and allow it to warm up for at least 30 min prior to use. This ensures optimal performance and accurate measurements.
Automatic calibration: The FluoroMax-4 automatically calibrates itself upon startup. Confirm that the instrument has completed its calibration and is ready for new experiments or stored routines.
Baseline check with water sample: Before beginning any analyses, run a water sample to verify that the fluorescence spectrum is correctly set and that there are no unexpected peaks or noise. This step helps ensure that the instrument is functioning properly.
Sample consistency: Prepare fresh samples for analysis and ensure that all emission spectra measurements are conducted on the same day to avoid any variations due to sample degradation or changes in environmental conditions.
Routine maintenance:
Clean the sample compartment: Regularly clean the sample compartment and cuvette holders to prevent contamination and ensure accurate readings.
Inspect and clean optical components: Periodically check the mirrors, lenses, and filters for dust or smudges. Clean with appropriate optical-grade materials as needed.
Software updates and calibration verification: Check for any software updates and perform manual calibration verification if required, especially after any major software or hardware changes.
Warm-up period: Turn on the UV-Vis spectrophotometer and allow it to warm up for at least 30 min before use. This is essential for obtaining stable and reliable measurements.
Blank measurement: Before analyzing the actual sample, run a blank measurement using the same solvent as the sample. This step zeroes the instrument and accounts for any absorbance from the solvent, ensuring that only the sample's absorbance is measured.
Sample analysis: After recording the blank, proceed with the analysis of your sample. Make sure to use matched cuvettes and handle them carefully to avoid fingerprints or scratches that could interfere with the measurement.
Routine maintenance:
Clean cuvettes and sample holders: Clean all cuvettes and sample holders before and after each use to prevent cross-contamination.
Inspect optical pathways: Regularly check and clean the light source, detectors, and optical pathways. Ensure there are no obstructions or contaminants that could affect the results.
Wavelength calibration check: Perform a wavelength calibration check periodically to ensure the spectrophotometer is accurately measuring across its range. Use calibration standards or reference materials as needed.
Environmental conditions: Maintain a stable environment around both instruments, free from vibrations, temperature fluctuations, and excessive light, to ensure the accuracy and reliability of measurements.
Acquire absorption spectra using an Agilent/HP 8453 UV-Visible spectrophotometer, employing a Starnacell Hellma quartz back wall cuvette with a 1 cm path length.
Record emission spectra at room temperature using a Jobin Yvon Horiba FluoroMax-4 spectrofluorometer, utilizing a Starnacell Hellma 2 × 10 mm fluorescence cuvette, oriented such that the light passes through the shorter path.
Determine fluorescence quantum yields (ΦF) in dilute solutions with an absorbance below 0.1 at the excitation wavelength.
Quinine sulfate in 0.1 M H2SO4 (λex = 347 nm, ΦF = 0.57) serves as the standard.
All spectra were recorded with a Fluoromax-4 spectrophotometer at 23 °C. Quantum yields are calculated using the following equation:
ΦF=ΦR·(AR/A) ΦS·(AS/A)
Run the 1H-NMR and 13C-NMR spectra for the following listed synthesized molecules using an AVANCE III 500 MHz spectrometer (Bruker), with TMS as the internal standard. Chemical shift multiplicities are denoted using the following abbreviations: s = singlet, d = doublet, t = triplet, q = quartet, m = multiplet (denotes a complex pattern), dd = doublet of doublets, dt = doublet of triplets.
2-hydrazinyl-5-nitrophenol HCl salt
2-salicylaldehyde-5-nitrophenol
2-acetaldehyde-5-nitrophenol
Statistical analysis
Obtain all data from three independent experiments and present them as the mean ± SD (with error bars) for clarity.
Analyze the quantification of carbonylation in cell lysates using a two-tailed student t-test. Consider a p-value less than 0.05 as statistically significant.
Synthesis of 2-salicylaldehyde-5-nitrophenol
Synthesis of 2-acetaldehyde-5-nitrophenol
Protocol for Rf calculation using thin layer chromatography (TLC)
Materials needed:
Procedure
Percentage yield calculations: Calculate the percentage yield of each reaction based on the following equation:
% Yield = experimental yield/theoretical yield × 100
Passage of cell lines
Determination of cell number
Cryopreservation of cell lines
Thawing of cell lines
WST-1 cell proliferation assay
Labeling of carbonylation
Quantification of carbonylation in cell lysate
Cytotoxicity of 2-Hydrazine 5-Nitrophenol labeling
Reactive oxygen species detection assay
General calibration and maintenance protocol for fluorescence and UV-Vis experiments
Fluorescence experiments (FluoroMax-4)
UV-Vis experiments (UV-Vis spectrophotometer)
UV-Vis absorbance and emission analysis
Fluorescence quantum yield
NMR analysis
Validation of protocol
Erkan et al. [18]. Design of Fluorescent Probes for Bioorthogonal Labeling of Carbonylation in Live Cells. Sci Rep. 10 (1): 7668.
Acknowledgments
This protocol was adapted from our previous work, published in Sci Rep. 2020 [18].
The presented protocols and work have been partially supported by TUBITAK (113S812) and COST Action CM1004.
Competing interests
The authors declare no conflicts of interest.
Ethical considerations
No human or animal subjects were included in this study.
References
- Dilek, O. and Bane, S. L. (2011). Synthesis and Spectroscopic Characterization of Fluorescent Boron Dipyrromethene-Derived Hydrazones. J Fluoresc. 21(1): 347–354.
- Chen, X. and Wu, Y. W. (2016). Selective chemical labeling of proteins. Org Biomol Chem. 14(24): 5417–5439.
- Dalle-Donne, I., Rossi, R., Giustarini, D., Milzani, A. and Colombo, R. (2003). Protein carbonyl groups as biomarkers of oxidative stress. Clin Chim Acta. 329: 23–38.
- Dilek, O. (2022). Current Probes for Imaging Carbonylation in Cellular Systems and Their Relevance to Progression of Diseases. Technol Cancer Res Treat. 21: 153303382211373.
- Beatty, K. E., Liu, J. C., Xie, F., Dieterich, D. C., Schuman, E. M., Wang, Q. and Tirrell, D. A. (2006). Fluorescence Visualization of Newly Synthesized Proteins in Mammalian Cells. Angew Chem Int Ed. 45(44): 7364–7367.
- Brand, M. D. (2016). Mitochondrial generation of superoxide and hydrogen peroxide as the source of mitochondrial redox signaling. Free Radical Biol Med. 100: 14–31.
- Suzuki, Y. J., Carini, M. and Butterfield, D. A. (2010). Protein Carbonylation. Antioxid Redox Signal. 12(3): 323–325.
- Schieber, M. and Chandel, N. S. (2014). ROS Function in Redox Signaling and Oxidative Stress. Curr Biol. 24(10): R453–R462.
- Plass, T. and Schultz, C. (2011). Covalent Labeling of Biomolecules in Living Cells. In: Advanced fluorescence reporters in chemistry and biology III: applications in sensing and imaging. 225–261.
- Cairns, R. A., Harris, I. S. and Mak, T. W. (2011). Regulation of cancer cell metabolism. Nat Rev Cancer. 11(2): 85–95.
- Fedorova, M., Bollineni, R. C. and Hoffmann, R. (2013). Protein carbonylation as a major hallmark of oxidative damage: Update of analytical strategies. Mass Spectrom Rev. 33(2): 79–97.
- Mukherjee, K., Chio, T. I., Gu, H., Banerjee, A., Sorrentino, A. M., Sackett, D. L. and Bane, S. L. (2017). Benzocoumarin Hydrazine: A Large Stokes Shift Fluorogenic Sensor for Detecting Carbonyls in Isolated Biomolecules and in Live Cells. ACS Sens. 2(1): 128–134.
- Mukherjee, K., Chio, T. I., Sackett, D. L. and Bane, S. L. (2015). Detection of oxidative stress-induced carbonylation in live mammalian cells. Free Radical Biol Med. 84: 11–21.
- Moses, J. E. and Moorhouse, A. D. (2007). The growing applications of click chemistry. Chem Soc Rev. 36(8): 1249–1262.
- Sletten, E. and Bertozzi, C. (2009). Bioorthogonal Chemistry: Fishing for Selectivity in a Sea of Functionality. Angew Chem Int Ed. 48(38): 6974–6998.
- Patterson, D. M., Nazarova, L. A. and Prescher, J. A. (2014). Finding the Right (Bioorthogonal) Chemistry. ACS Chem Biol. 9(3): 592–605.
- Dirksen, A. and Dawson, P. E. (2008). Rapid Oxime and Hydrazone Ligations with Aromatic Aldehydes for Biomolecular Labeling. Bioconjugate Chem. 19(12): 2543–2548.
- Erkan, H., Telci, D. and Dilek, O. (2020). Design of Fluorescent Probes for Bioorthogonal Labeling of Carbonylation in Live Cells. Sci Rep. 10(1): 7668.
Article Information
Publication history
Received: Apr 5, 2024
Accepted: Sep 25, 2024
Available online: Oct 15, 2024
Published: Nov 20, 2024
Copyright
© 2024 The Author(s); This is an open access article under the CC BY-NC license (https://creativecommons.org/licenses/by-nc/4.0/).
How to cite
Readers should cite both the Bio-protocol article and the original research article where this protocol was used:
- Dilek, O., Telci, D. and Erkan-Candag, H. (2024). Small-Molecule Probe for Imaging Oxidative Stress–Induced Carbonylation in Live Cells. Bio-protocol 14(22): e5112. DOI: 10.21769/BioProtoc.5112.
- Erkan, H., Telci, D. and Dilek, O. (2020). Design of Fluorescent Probes for Bioorthogonal Labeling of Carbonylation in Live Cells. Sci Rep. 10(1): 7668.
Category
Biophysics > Microscopy > Two-photon laser scanning microscopy
Cell Biology > Cell imaging > Fluorescence
Do you have any questions about this protocol?
Post your question to gather feedback from the community. We will also invite the authors of this article to respond.