- Protocols

- Articles and Issues
- For Authors
- About
- Become a Reviewer

Semi-Automated Assessment of Long-Term Olfactory Habituation in Drosophila melanogaster Using the Olfactory Arena
Published: Vol 14, Iss 21, Nov 5, 2024 DOI: 10.21769/BioProtoc.5102 Views: 1574
Reviewed by: Geoffrey C. Y. LauRaghavendra Yelahanka NagarajaXiaochen Sun
Advertisement


Protocol Collections
Comprehensive collections of detailed, peer-reviewed protocols focusing on specific topics


Related protocols

Abstract
Long-lasting memories are a core aspect of an animal’s life. Such memories are characterized by unique molecular mechanisms and often unique circuitry, neither of which are completely understood in vivo. The deep knowledge of the identity and connectivity of neurons of the fruit fly Drosophila melanogaster, as well as the sophisticated genetic tools that allow in vivo perturbations and physiology monitoring, make it a remarkably useful organism in which to investigate the molecular mechanisms of long-term memories. In this protocol, we focus on habituation, a non-associative form of learning, and describe a reliable, semi-automated technique to induce and assess long-term olfactory habituation (LTH) in Drosophila using the olfactory arena, thus providing a method aligned with recent technological progress in behavioral measurement. Prior work has shown that LTH is induced by a 4-day exposure to an odorant and is characterized by a long-lasting (> 24 h) reduction in behavioral response to the exposed odorant, measured using a manual and skill-intensive Y-maze assay. Here, we present a semi-automated protocol for obtaining quantifiable measures of LTH, at the level of detail required for other investigators in the field. Unlike previously described methods, the protocol presented here provides quantitative and detailed behavioral measurements obtained by video recording that can be shared with the scientific community and allows sophisticated forms of offline analysis. We suggest that this procedure has the potential to advance our understanding of molecular and circuit mechanisms of olfactory habituation, its control via neuromodulation, and its interactions with other forms of memory.
Key features
• A protocol to induce olfactory aversive long-term habituation in Drosophila melanogaster.
• Video recording and analysis of Drosophila in an olfactory arena.
Keywords: Long-term habituationBackground
Habituation is a fundamental form of learning that reduces an animal’s behavioral response after continuous or multiple exposures to an innocuous stimulus [1,2]. This reduction in behavioral response is adaptive, allowing animals to dedicate cognitive resources to potentially salient elements of their environment [3]. A defining feature of habituation is that it can be instantly reversed, as revealed by an animal’s ability to reengage either volitionally or in a new context, with a familiar, previously ignored stimulus [4]. Habituation has also been described in Drosophila melanogaster using a wide range of sensory modalities—visual [5,6], gustatory [7–9], olfactory [10,11], or of other types of stimuli, such as shock [12] or courtship [13]. However, long-term forms of habituation (LTH) have only been studied for olfactory behavior [14–17]. LTH requires molecular mechanisms shared with other forms of long-term memory, notably de novo transcription and protein synthesis [12,15,18,19]. Hence, studies on LTH have the potential to reveal not only circuit mechanisms that flexibly gate stimulus responses but also in vivo molecular mechanisms, such as translational control of mRNAs, involved in the consolidation of long-term memories.
The protocol we describe for LTH is distinctive in its use of the olfactory arena [20–22], which allows flies to exhibit more naturalistic, non-binary behavioral responses. Being based on video recording and machine vision, this protocol also allows offline analyses of multiple aspects of flies’ behavior, with the potential to provide a broader and deeper understanding of circuit and molecular mechanisms for long-term habituation.
Materials and reagents
Biological materials
Canton S
Oregon R
Reagents
Malt extract (Muntons, amber malt extract, 25 kg, catalog number: 84260)
Polenta (Heera-Corn Meal Fine, 1.5 kg)
Golden Syrup (GEM, 7.26 kg)
Dry yeast (Oxioid, catalog number: LP0021)
Agar (Apollo Scientific-Micro Agar, catalog number: BIM1002)
Propionic acid (Thermo Fisher Scientific, catalog number: 149300010)
Methyl 4-hydroxybenzoate (Merck, catalog number: H5501-1KG)
Paraffin oil (Sigma-Aldrich, catalog number: 18512-2.5L)
Ethyl butyrate (Sigma-Aldrich, catalog number: E15701-500mL)
Methyl hexanoate (Sigma-Aldrich, catalog number: 259942-100mL)
3-octanol (Fluka Chemica, catalog number: 74870-50mL)
CO2 (BOC Gases Ireland Limited)
Agar for starvation vials (Sigma-Aldrich, catalog number: A1296-500)
Solutions
Fly food (see Recipes)
Starvation vials (see Recipes)
Recipes
Fly food
Reagent Quantity Malt extract 82 g Polenta 77 g Golden syrup 16 g Dry yeast 18 g Agar 11 g Propionic acid 4.5 mL 10% methyl 4-hydroxybenzoate (in ethanol) 10 mL Water Up to 1 L Starvation vials
Reagent Quantity Agar 0.75 g Water Up to 100 mL
Laboratory supplies
Fly vials (Regina Industries, catalog number: P1014T)
Fly bottles (Genesee Scientific, catalog number: 32-129F)
PCR tubes (Azenta, catalog number: 4TI-0790)
Microlance needles 21 G × 38 mm (BD, catalog number: 304432)
Copper wire (RS, catalog number: 779-0707)
PRO White PTFE Tape, 5 m × 12 mm × 0.2 mm (RS, catalog number: 231-964)
Equipment
Clear plastic box 1.6 L, dimensions 195 × 135 × 110 mm (Really Useful Boxes)
Incubators (Memmert, model: IPP 400)
Vortex-Genie 2 (Scientific Industries, Inc., catalog number: 103-SI-0256)
Waterproof silver and black blackout UV-protect water-resistant fabric (Amazon)
Climate box with red light bar (Con-Elektronik/Konrad Oechsner)
Odor delivery system
One olfactory arena for fruit flies [20]
Two mass flow controllers 0-500 SCCM (Omega Engineering Limited, catalog number: FMA5512A)
TYGON SE200 Tubing 1/16 (I.D.) × 1/8 (O.D.) (Fisher Scientific, catalog number: 11727293)
TYGON SE200 Tubing 1/8 (I.D.) × 1/4 (O.D.) (Fisher Scientific, catalog number: 15590275)
PTFE Tubing [50 ft (L) × 1/8 in. (O.D.) × 0.063 in (I.D.)] (Supelco, catalog number: 58699)
PTFE Tubing [25 ft (L) × 1/4 in. (O.D.) × 0.228 in (I.D.)] (Supelco, catalog number: 20533)
Flowmeter system, 65 mm direct reading flow tube for air; 500 mL/min (Fisher Scientific, catalog number: 15949117)
Vacuum pump (KNF LABOPORT, model: N 86 KT.18)
Connectors:
Diameter straight tube-to-tube connector, push in 3.2 mm to push in 6 mm (Radionics, catalog number: KQ2H23-06A)
Flangeless fittings 1/8" PK/5 (Supelco, catalog number: 58686)
Tee tube-to-tube adapter (3.2 mm OD tubing) (Radionics, catalog number: KQ2T23-00)
Fitting plug 1/4-28 (NResearch, catalog number: FITM128)
Luer to threaded fitting, straight adapter (1/16 female luer to 1/4-28 UNF thread) (Fisher Scientific, catalog number: 15196303)
Male luer with lock ring 1/16" ID (Fisher Scientific, catalog number: 14889980)
Y union barbed fitting 1/16" ID (Cole Parmer, catalog number: WZ-50111-30)
Barbed fitting 10:32 × 1/16" (NResearch, catalog number: FITM328)
Male pipe adapter barbed fittings (Fisher Scientific, catalog number: 15277536)
Two 5-port low-pressure manifold body, 0.062" bore, 1/8" OD tubing, 1/4-28 flat bottom; 1/EA (Cole Parmer, catalog number: P-155)
Six screw cap GL 14 for hose connection for Duran bottles (Duran Group, catalog number: 1129814)
Twelve insert for screw cap, GL 14, 3.2 mm (1/8 Zoll) ID (Duran Group, catalog number: 1129817)
Six 100 mL SCHOTT Duran bottles with GL45 neck (Sigma-Aldrich, catalog number: Z305170-10EA)
Two 3-way isolation valve 12VDC (NResearch, catalog number: 225T031)
Four 2-way normally closed isolation valve 12VDC (NResearch, catalog number: 225T011)
One CoolDriveSolo multi-board with IDC connectors (NResearch, CDSX8UK-IDC)
Six CoolDriveSolo Universal valve drivers (trigger voltages 4.5–24 VDC) (NResearch, catalog number: CDS-V01)
MAPLIN 36W switched mode DC variable voltage compact bench power supply 6 output (Amazon)
Insulated breadboard jumper wire (Radionics, catalog number: 791-6454)
Arduino MEGA 2560 (Radionics, catalog number: 715-4084)
USB cable, type A to B (for Arduino) (Radionics, catalog number: 282-4023)
One Point Grey Flea3 digital camera (ClearView Imaging, catalog number: FL3-U3-32S2M-CS)
Point Grey USB 3.0 cable, Type-A to Micro-B (ClearView Imaging, catalog number: ACC-01-2301)
Computar lens M0814-MP2 F1.4 f8 mm 2/3" (MultiPix imaging, catalog number: 2000034697)
Desktop computer (Windows PC, ≥8 GB RAM, nice GPU)
Software and datasets
Bonsai Visual reactive programming [Bonsai (2.8.0), 30/07/2023] [23]
MATLAB_R2023a [R2023a (9.14), 22/02/2023]
Prism 10 (GraphPad, 11/07/2023)
Setting up the olfactory arena
All details for manufacturing the various parts for the olfactory arena and the LED panel were obtained from the Janelia Farm Tech-Transfer office as described by Aso and Rubin [20]. Additionally, we developed an odor delivery system where saturated odor vapor can be independently delivered to two diagonally opposing quadrants (Figure 1). Two mass flow controllers ensured a constant flow rate of 100 mL/min in each quadrant. The airflow then converged to a central hole of the arena and was extracted at 400 mL/min with a vacuum pump. Odors were delivered to the arena by rapidly diverging the airflow stream to selected odor vials using solenoid valves. Experimenters could choose among three different odors to be delivered on two diagonally opposite quadrants of the arena.
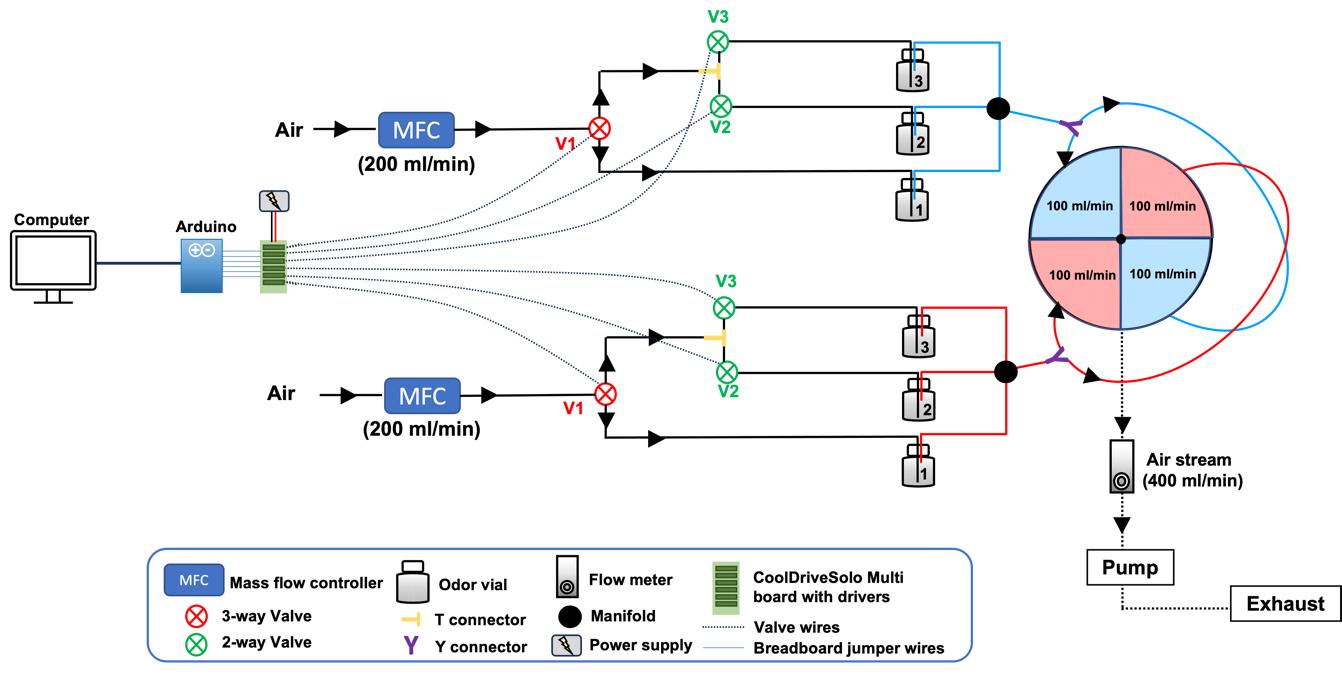
Figure 1. Schematic of the odor delivery system. Saturated odor stream, produced by bubbling the air stream through a selected odor vial (e.g., Odor 1) can be independently delivered to two diagonally opposing quadrants. The air stream can be rapidly diverged to odor vials 2 and 3 by simultaneously opening two solenoid valves (V1 and V2 or V1 and V3, respectively). A constant flow rate of 200 mL/min on each odor line is ensured by two mass flow controllers. This flow bifurcates prior to entering the arena such that each quadrant receives a constant flow rate of 100 mL/min. The airflow then converges to a central hole of the arena and is extracted at 400 mL/min with a vacuum pump. Valves are energized using a 12 V power supply via CoolDriveSolo valve drivers. Open and close commands are sent from the computer to the valves through an Arduino.
Connect each mass flow controller to solenoid valves (V1) using odor-inert PTFE tubing and connectors, as shown in Figure 2A and B. Push the 1/4" OD (outer diameter) tubing through the push connector of the mass flow controller. Then, using a different diameter straight connector, attach one end of the 1/8" OD tubing to this connector and the other end to the common port of the 3-way valves using the flangeless fittings (Figure 2B).
Connect 3-way solenoid valves and odor vials (odor vial 1). Attach one end of the 1/8" OD PTFE tubing to the normally open port of the 3-way valve using the flangeless fittings and pass the other end of the tubing through the odor bottle screw cap with the insert, making sure the tubing is close to the bottom of the odor vial (Figure 2C). Push a separate piece of tubing through the second screw cap and insert, ensuring the end protrudes slightly from the odor vial lid. Connect the other end of this last tube to the manifold using the flangeless fittings. We obtained similar success using either SCHOTT Duran bottles with lids or scintillation vials with rubber caps as odor vials.
To allow diversion of the air stream to other odor vials, connect the normally closed port of the 3-way valve with two 2-way valves (V2 and V3) by using a T connector to bifurcate the odor stream onto the two 2-way valves (Figure 2D). Connect the 2-way solenoid valves and odor vials (odor vial 2 and 3) as explained above, then connect the output tubing from odor vials with the manifold (Figure 2E). Each manifold can be connected to up to four different odor vials. Use a fitting plug to block the unused manifold port.
Attach the odor inert flexible tubing TYGON SE200 1/16" ID (inside diameter) to the output port of the manifold. Use the luer to thread and the male luer fittings to attach the tubing (Figure 2E). Then, connect the other end of the tubing to two opposing quadrants, first by bifurcating the tubing into two using a Y connector (Figure 2F) and then by attaching each of the two tube ends to the barbed fittings at two diagonally opposite quadrants of the arena (Figure 2K).
Connect the arena’s vacuum fitting and the flow meter using a TYGON SE200 flexible tubing (1/8" ID) and a male barbed fitting (Figure 2G–H), then connect the flow meter to the pump. Finally, direct the pump output to an extractor to prevent odor accumulation in the room.
Cut a piece of red and black hookup wire. Connect one end of each wire to the 12 V power supply and the other end to the CoolDriveSolo multi-board (Figure 2I). Make sure there are no exposed wires outside the mount housing. Insert the CoolDrive valve controller driver on the multi-board (Figure 2J). You will need as many drivers as valves, which means 6 in our case; each board allows independent operation of up to eight solenoid valves. Connect the two wires of the valve to the CoolDriveSolo multi-board. Connect the CoolDriveSolo multi-board to the Arduino via insulated breadboard jumper wires, then plug the Arduino with the computer.
Place a high-resolution camera with a lens above the arena to record behavior and plug it into the computer with a USB 3.0 cable (Figure 2K). A custom-made infra-red LED panel and LED controller, made as described by the Janelia Farm Tech-Transfer office [20], is used as a light source. A desktop Windows PC with at least 8 GB RAM is needed for managing the experimental session and controlling the camera, valves, and LED panel.
The arena and associated odor delivery system should be placed in a climate box covered with a blackout cloth. We highly recommend checking all the connections for potential air leakage before operating the arena for the first time. From our experience, the most common source of air leakage is the Duran bottles used to contain the odors. Ensure that the bottles are evenly closed and use PTFE tread seal tape around the neck of the Duran bottles to avoid air leakage. While checking that connections are tight, make sure that you do not overtighten the connections with the solenoid valves—they are made of soft Teflon and can easily be damaged if overtightened.
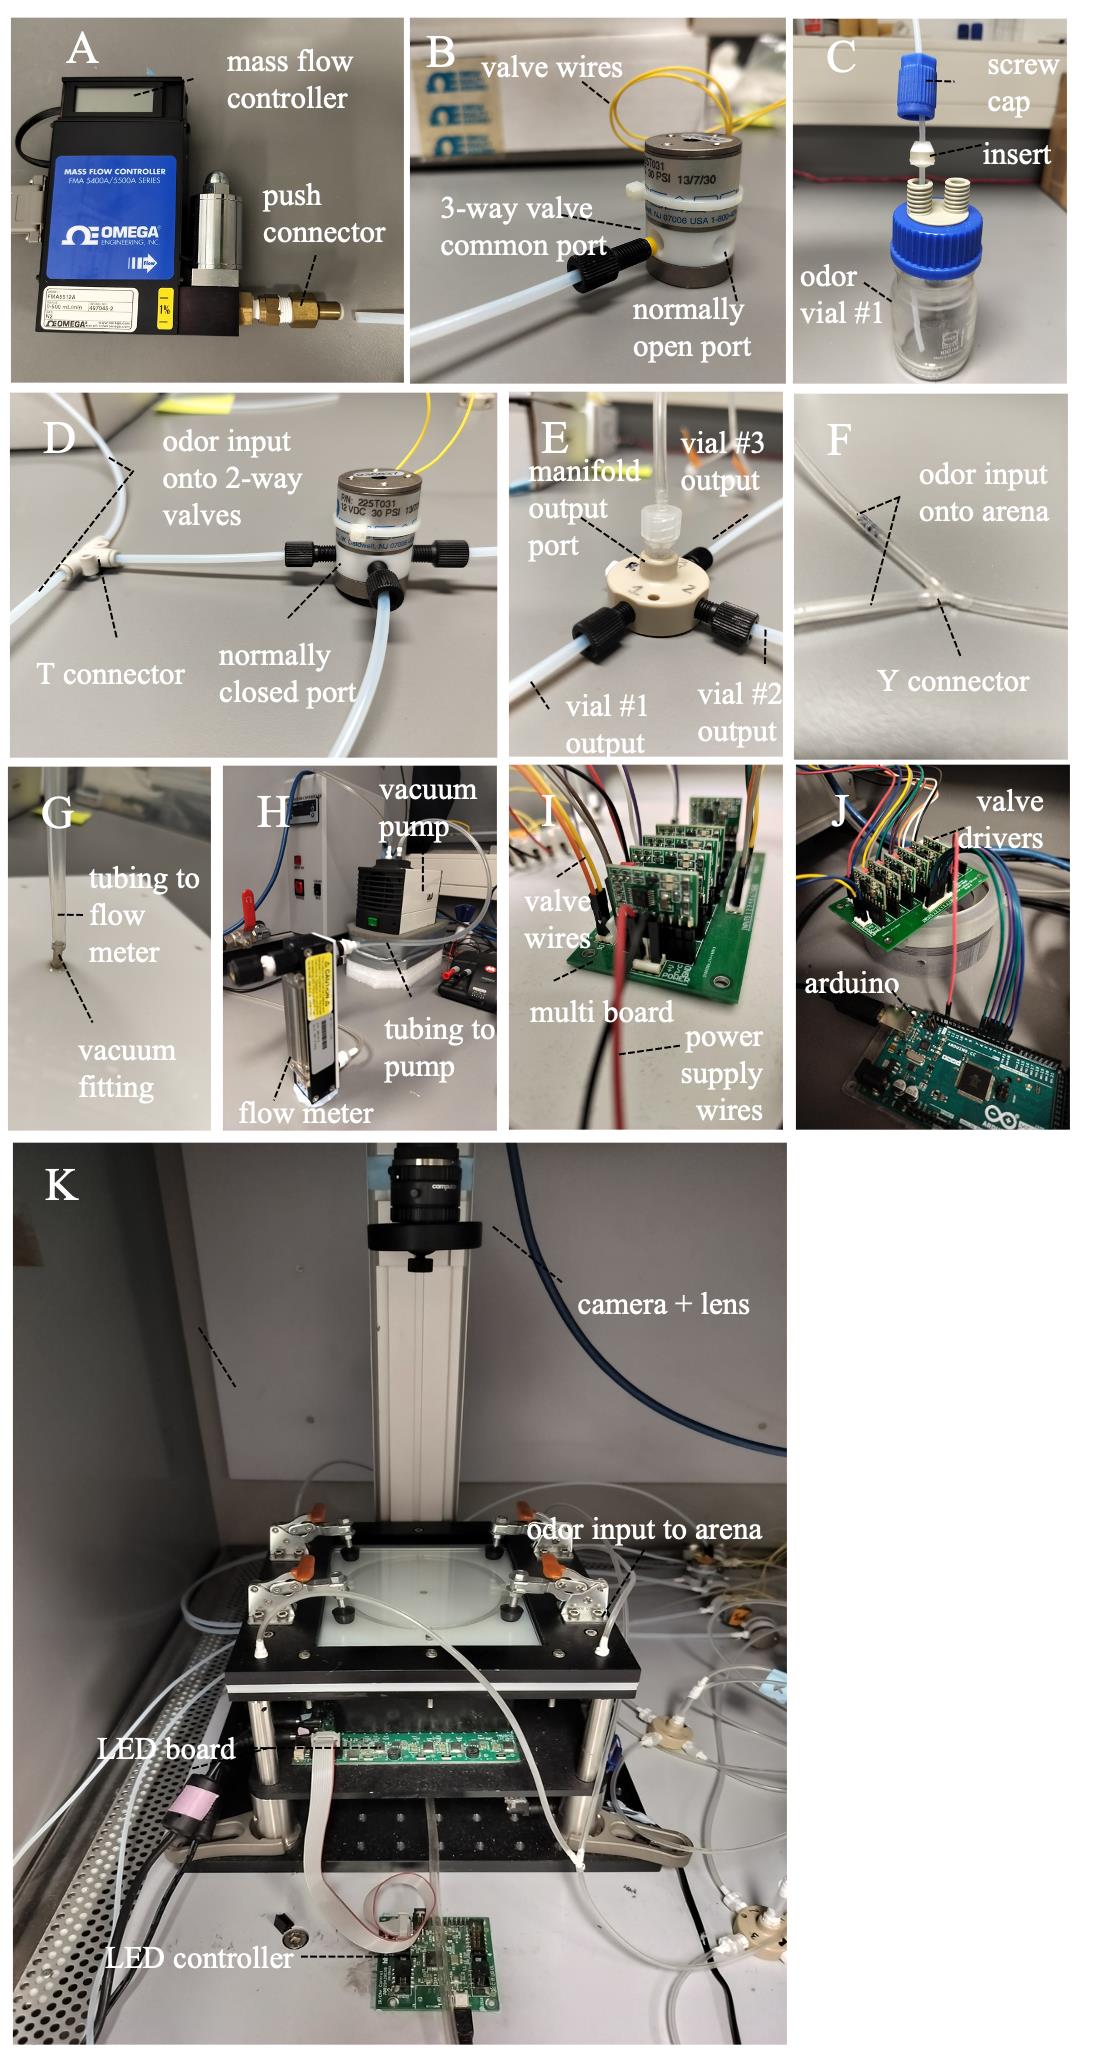
Figure 2. Odor delivery assembly steps. (A) Add a mass flow controller to the odor delivery system by pushing one end of the PTFE tubing through the push connector. (B) Connect the mass flow controller with the common port of the 3-way valve, and then connect the normally open port with odor vial 1. Valve wires will be connected to the MultiBoard as described further ahead in panel I. (C) Connection to odor vial #1 is established by passing the tubing through a screw cap and an insert. Make sure the input tubing is close to the bottom of the odor vial. (D) Using three separate pieces of tubing and a T connector, bifurcate the output from the normally closed port of the 3-way valve, and connect them with two 2-way valves. Each of the 2-way valves will then be connected to odor vials #2 and #3. (E and F) Connect the output from odor vials #1, #2, and #3 to individual ports of the manifold, and then connect the output port with the arena, making sure to use a Y connector to bifurcate the odor flow into two and then connecting each tubing end to diagonally opposed odor inputs in the arena. (G and H) Connect the arena vacuum fitting with a flow meter using a flexible and odor-inert piece of tubing, then connect the flow meter output with the vacuum pump using a separate piece of flexible tubing. (I) Plug the 12 V power supply wires in the MultiBoard, as well as the two valve wires from each valve. A total of six valves will be connected to the board (two 3-way valves and four 2-way valves). (J) Insert six valve drivers in the board, one for each valve, and then use insulated breadboard jumper wires to connect each driver to the Arduino. You will need an extra wire for ground connection. (K) After assembling the odor delivery, place an LED board below the arena and plug the LED controller for illumination. Insert a high-resolution camera and a lens on top of the arena for video recording.
Procedure
Fly preparation
Ten days before the experiment, cross 25–30 virgin D. melanogaster females of the desired genotype A with 10–12 males of the desired genotype B. Prepare at least four bottles containing 40–50 mL of fresh fly food for each group. Keep all the crosses in an incubator at 25 °C, with 60% relative humidity, and a 12/12 h light/dark cycle. Expand the crosses to new bottles every 7 days.
Note: Crosses can also be set at lower or higher temperatures, depending on experimental requirements.
Empty the bottles by discarding any adult fly the night before the collection to make sure only newly enclosed flies will be collected the morning after. LTH can only be induced in newly eclosed flies, no more than 12 h after eclosure [24].
Anesthetize flies using CO2 and sort between males and females of the desired genotype. Transfer 20–25 newly eclosed flies of either sex to fresh food vials and distribute vials among two groups: Control group, to be mock exposed, and Test group, to be odorant exposed (see section B for odorant preparation and section C for training protocol).
Induction of habituation
This protocol was established by exposing flies to either ethyl butyrate (EB) or methyl hexanoate (MH). It is possible that other odorants may be used to induce LTH, but their odor concentrations and efficacies will need to be standardized.
Prepare as many 200 μL PCR tubes as the total number of fly vials collected.
To induce habituation to EB, add 80 μL of paraffin oil (PO) and 20 μL of EB to the PCR tube, to obtain a final concentration of 20% EB. Alternatively, induce habituation to MH and add 20 μL of MH to 80 μL of PO. For the control group (mock exposed), prepare PCR tubes containing 100 μL of PO.
Mix the odorant by vortexing the PCR tube for 10–15 s at ~2,500 rpm. Cut off the lids of the PCR tubes and cover each of them with cling film squares (1.5 × 1.5 cm) (Figure 3A).
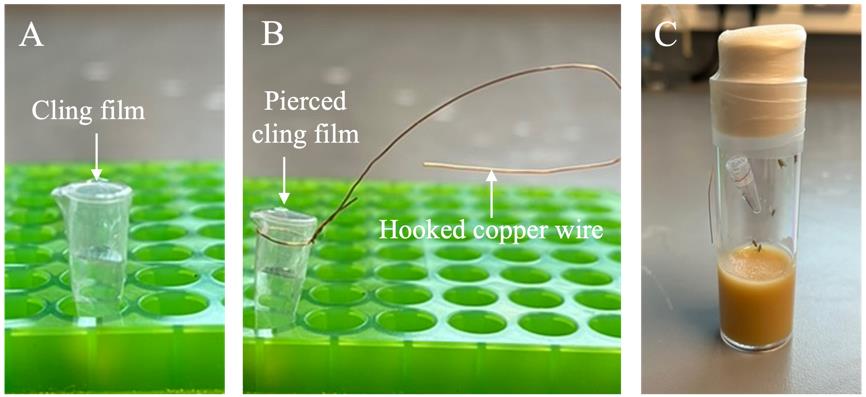
Figure 3. Odor preparation setup. (A) In a 200 µL PCR tube, prepare 100 µL of either paraffin oil (PO) for the mock-exposed or 20% ethyl butyrate (EB) in PO for the odor-exposed (steps B1–3). Remove the PCR cap and cover the PCR tube with cling film (step B4). (B) Wrap a piece of copper wire around the PCR tube neck and fold it in order to create a hook on the other end; pierce the cling film 10 times with a needle (step B5). (C) Hang the PCR tube containing the odor inside a fly vial using the copper hook and seal the vial by wrapping parafilm around the cap (step B6).Using approximately 5 cm of copper wire, wrap the wire around the top of the PCR tube and make a hook with the loose end (Figure 3B). Pierce the cling film with a Microlance needle 21 G × 38 mm approximately 10 times to allow the odor vapor to flow out of the vial.
Tap the flies to the bottom of the vial and quickly hang the PCR tube inside the fly vial using the wire hook (Figure 3C). Close the vial and seal it by wrapping the top of the vial with parafilm.
Transfer vials of each condition, mock and odor, onto the dedicated clear plastic box and put each box in separate incubators at 25 °C and a 12/12 h light/dark cycle. For experiments with TubGal80ts, incubators have to be set to higher temperatures to allow for gene expression during odor exposure.
Note: Keep in mind that the odor will leak from the odor-exposed box; so, it is important to keep the two conditions in separate incubators.
Incubate the flies with the odors for four consecutive days.
On the late afternoon/evening of the fourth day of odor exposure, transfer the flies onto starvation vials (see Recipes) in the absence of odors and incubate overnight in an odor-free incubator at 25 °C with 60% humidity and a 12/12 h light/dark cycle.
Habituation testing
Turn on the temperature of the climate chamber (or any other heating device) to 25 °C and allow it to reach the temperature for 1 h before starting the experiment.
Move the fly vials from the incubator to the testing room and let them acclimatize for 30 min before starting the experiment.
Prepare the odor bottles for the behavioral test by pipetting 20 mL of PO onto six odor vials and label four of them PO and the remaining two EB. Add 20 µL of EB to each EB-odor vial to obtain a final concentration of 1:1,000. For MH exposure, we also used a concentration of 1:1,000. Close the vials and vortex for a few seconds to mix. Remove the caps and connect the odor bottles to the arena by inserting the caps.
Ensure the arena is closed before you turn on the vacuum pump and confirm that the airflow is stable at 200 mL/min for two opposing quadrants (the flow rate should be 100 mL/min on each quadrant).
Turn on the computer and set the infrared light to 25% intensity. We use the command set originally obtained from Janelia Tech-Transfer office to communicate with the LED panel via Bonsai [23] software. This light intensity was empirically determined based on the overall quality of the acquired image and might have to be readjusted in a different apparatus/camera. In such a case, aim for low light intensity to prevent heat-related artifacts.
Adjust camera settings using the camera software. We used an image size of 1,552 × 1,552 pixels while the speed was set to 22 frames per second.
Open the acquisition protocol file (Figure 4). Our protocol was developed using the Bonsai programming language, but other software can be used for running a protocol and interfacing with the different hardware, namely the camera, LED board, and Arduino.
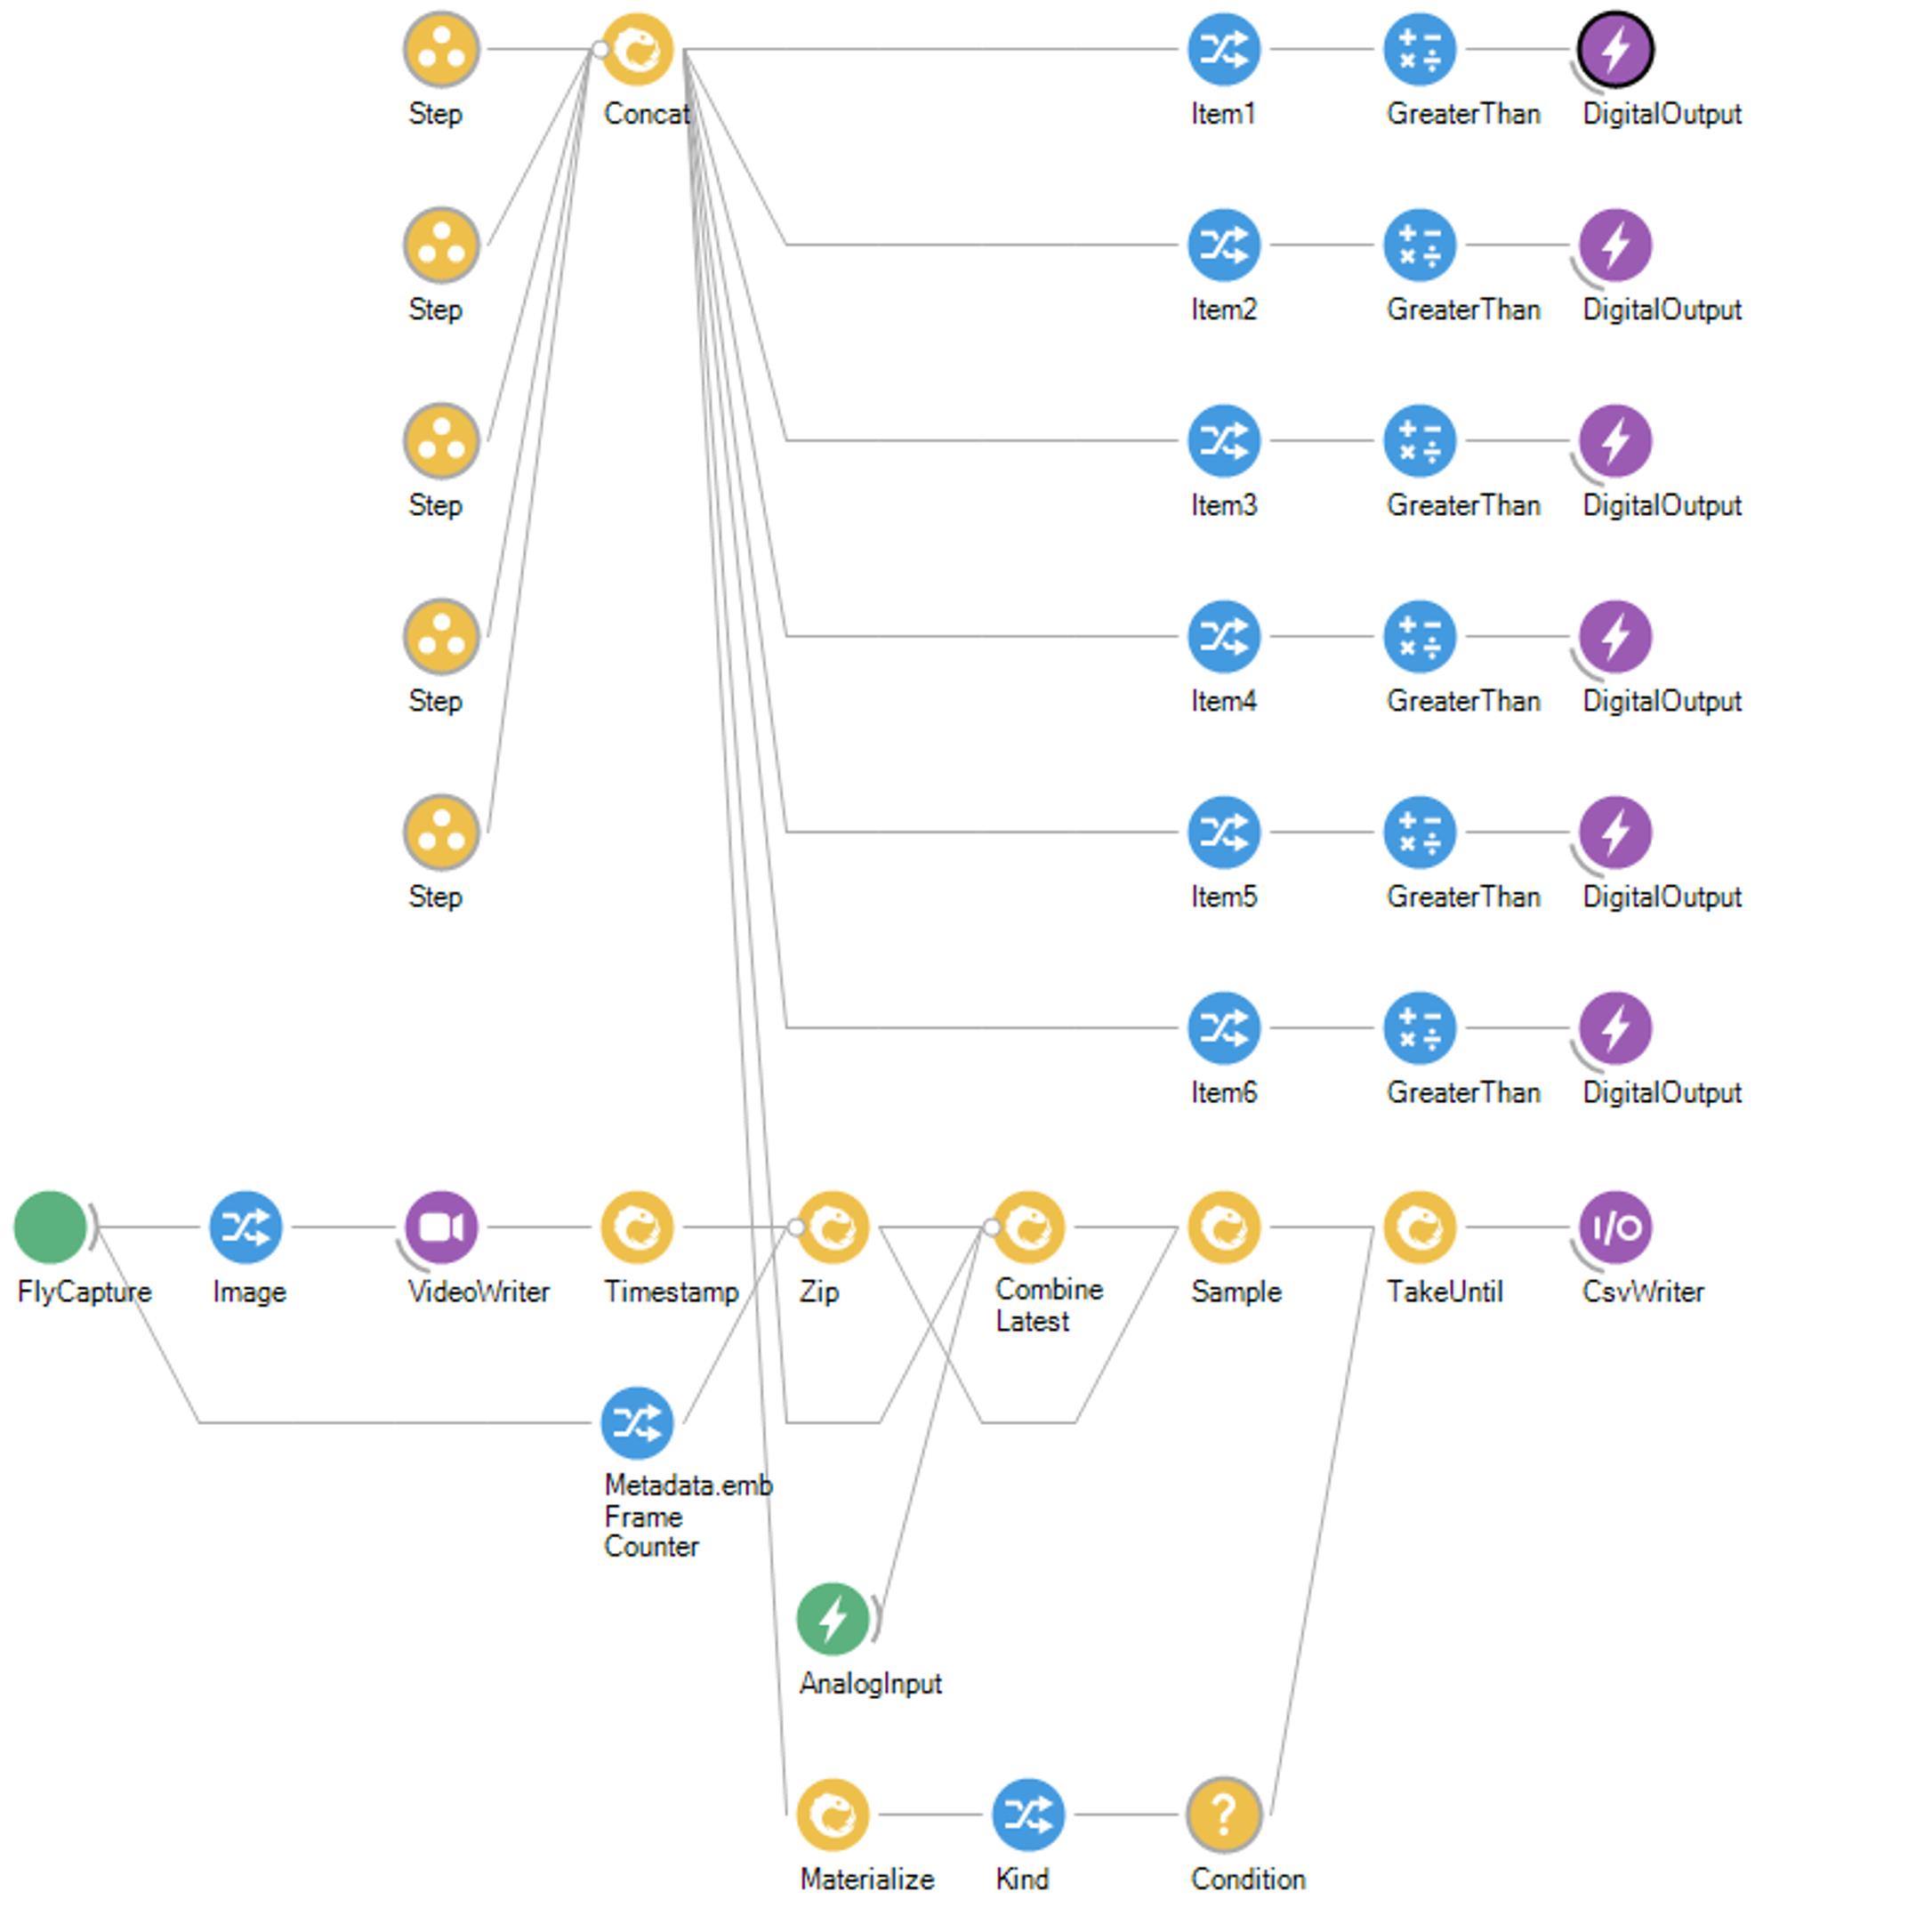
Figure 4. Acquisition protocol workflow. Bonsai workflow describing the different operations during the odor response test. To activate the valves, we communicate with the Arduino and send transistor-transistor-logic (TTL) signals using the Digital Output node. Each Step contains the status of each of the six valves for a given duration. For example, if the first minute of the protocol is composed of air stimulation, then the status of all valves in Step 1 will be 0 (closed) for a specified duration of 1 min. Upon odor stimulation, the valve status of the designated valve should change to 1 (open). We use the Fly Capture node to collect information from the camera and the VideoWriter operator to record the sequence of images collected. A Timestamp node was introduced to timestamp the stream of information, which is then outputted in a csv file via the CsvWriter node.Direct the airflow to each of the vials for 10 min by toggling the solenoid valves. This will ensure that the headspace of the odor vial is saturated with odor vapor. After priming each of the odor lines, turn off the pump and open the arena lid to start a behavioral test.
Using the fly aspirator, transfer approximately 20 flies of the same genotype from a vial into the arena and immediately slide the glass lid to prevent them from escaping. Close the four-field chamber by pushing down the clamps, turn on the vacuum pump, and cover the apparatus with the blackout cloth. Let the airflow stabilize to 100 mL/min in each quadrant while flies get acclimatized for 3 min and start the test.
The test is composed of three steps, each with 1 min duration (Figure 5). During step 1, a baseline is established by allowing the airflow to be directed toward two PO-containing bottles for 1 min such that all four quadrants are equally stimulated with the solvent-neutral odor. Flies should be equally distributed among the four quadrants during this time.
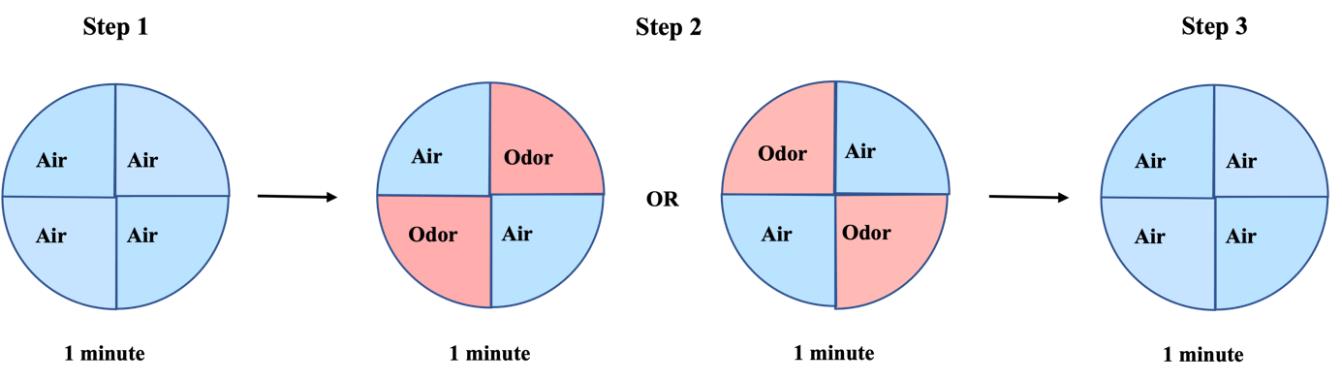
Figure 5. Habituation testing protocol. During the first minute of the test, flies are exposed to paraffin oil (PO) in all four quadrants to establish a baseline (step 1). To stimulate flies with odor, valves are opened for 1 min in two opposing quadrants (step 2). Finally, all valves are closed to allow the odor to be flushed out for another 1 min (step 3).Open the valves for 1 min at step 2 to stimulate flies with odor in two opposite quadrants of the olfactory arena. This is achieved by diverging the airflow into one PO bottle to stimulate two opposite quadrants, and into one EB-containing bottle (1:1,000 EB in PO) to stimulate the other two quadrants. The quadrants being stimulated with odor should be flipped in different experiments.
Close the valves at the third and last step of the protocol to allow airflow from PO-containing bottles in all four quadrants, washing out the odor used in step 2 from the arena.
Turn off the pump and carefully collect the flies with an aspirator under red light.
Confirm the existence of two output files at the end of a test—a recorded movie and a csv file containing the timestamps and valve status. They will be required for subsequent analysis.
Generate around 5–8 repeats for each condition.
Cleaning the setup
Clean the bottom of the chamber, the chamber spacer, and the covering glass with water and 70% ethanol between each run. Dry it out with a dry tissue and load a new set of flies.
At the end of the session:
Prepare six bottles with 70% ethanol and allow the airflow to go through all bottles for 5 min to clean the odor and remaining PO from the delivery system.
Discard the ethanol from the bottles and add water to each of them. Perform another round of cleaning by diverging the airflow to each bottle for 5 min.
Clean the bottom of the chamber, the chamber spacer, and the covering glass as indicated in section D point 1.
Dry all components with a dry tissue. Turn off the light, the power supply, and the computer.
Data analysis
Count the number of flies on each quadrant for each frame (or calculate the pixel area on each quadrant for each frame). We processed each acquired movie using a machine vision protocol in Bonsai to automatically extract the number of flies on each quadrant on each frame (Figure 6). This process entails background subtraction and thresholding, followed by counting the number of flies within previously defined regions of interest (ROI). Total pixel area selected after thresholding can also serve as a good measure for the number of flies.
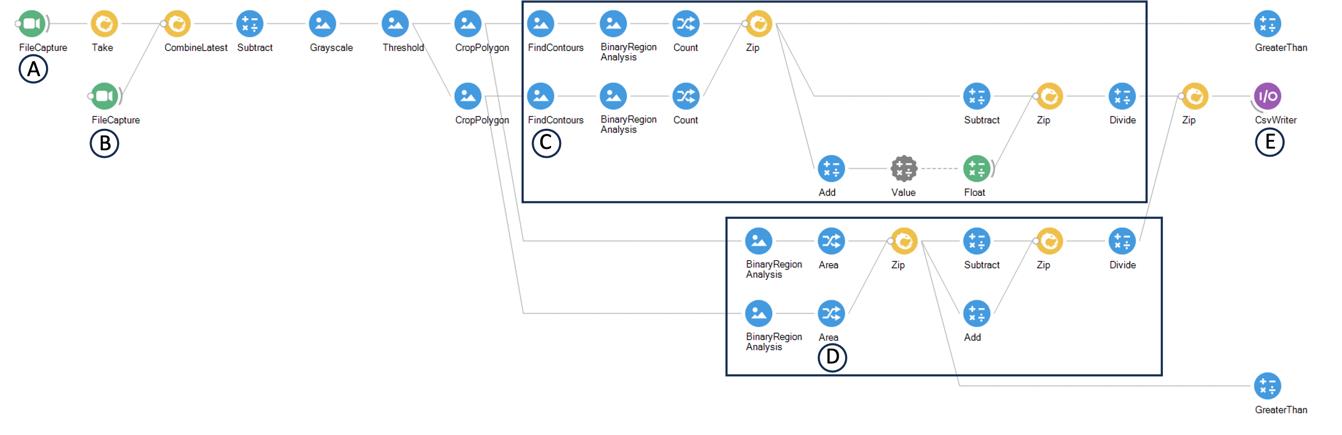
Figure 6. Screenshot of the Bonsai workflow used to analyze videos and calculate preference index. We start by uploading a movie of an empty arena (A) and a movie that we want to analyze (B) (FileCapture nodes). We will use one frame of the empty arena movie to perform background subtraction (Subtract node) followed by conversion of the input image into greyscale (Grayscale node). We then perform thresholding in order to have a well-defined foreground (Threshold node). The threshold value is empirical and may be adjusted depending on the image quality. We next define the areas of each of the two opposing quadrants, as dictated by the boundaries of the four quadrants, using the CropPolygon node. On each of the defined regions, we count the number of flies (C) (FindContours and Count) and calculate the pixel area (D) (Area). Both measures (number of flies per quadrant and pixel area per quadrant) are suitable for calculating a preference index, even though we choose to use the pixel area in our study. Finally, we compute the preference index by performing the arithmetic operations required to calculate the preference index as dictated by the following formula: (n° flies in odor quadrants − n° flies in air quadrants)/total n° flies. The square area depicts the preference index calculation using the number of flies per quadrant and the pixel area per quadrant. The calculated preference index is then loaded in a csv file (E) (CsvWriter), which is subsequently aligned with the valve status information using a MATLAB script.Calculate the preference index (PI) by subtracting the number (n°) of flies in the air quadrants from the number of flies in the odor quadrants and dividing by the total number of flies:
PI = (n° flies in odor quadrants − n° flies in air quadrants)/total n° flies.
The PI range is between +1 and -1. A positive PI occurs when the animals are attracted to the odor; a negative PI corresponds to repulsion; when PI is 0 the animals are equally distributed across the arena.
We used a single Bonsai workflow to automatically extract the number of flies, calculate the PI, and output a csv file with the PI on each frame. The Bonsai workflow for the analysis is depicted in Figure 6.
Using MATLAB, align the PI data with the valves’ onset and offset. Calculate the overall PI by averaging the PI of the last 30 s of the odor stimulation period. Flies take on average 20–30 s to react and stabilize at their final position upon odor stimulation. The PI of the last 30 s therefore reflects their final behavioral choice.
Calculate the average response index (RI) by reversing the sign of the overall PI (RI = −PI).
Statistical analyses were performed using Graph Pad Prism 8. Both unpaired t-test and 2-way ANOVA are used to compare two or more groups, followed by the Tukey-Kramer test for multiple comparisons.
Validation of protocol
To validate this protocol, we assessed whether wild-type strains, Canton S (CS) and Oregon R (OrR), could exhibit a reduction in the behavioral response to EB after four days of exposure to this odorant.
We observed that odor-exposed animals showed a 50% reduction in behavioral response (Video 1) in comparison to mock-exposed animals (Video 2) (Figure 7).

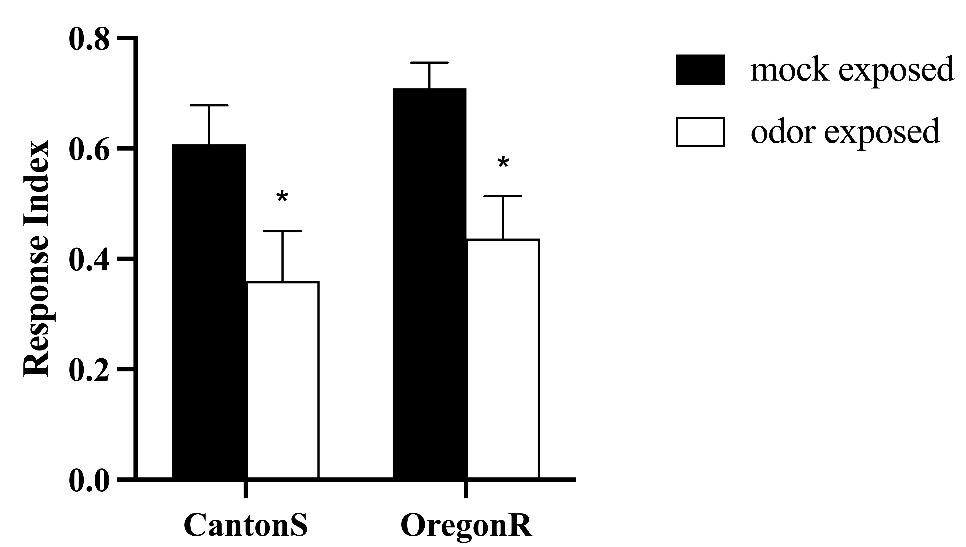
Figure 7. Wild-type strains Canton S (CS) and Oregon R (OrR) habituated to an odorant after long-term exposure. Naïve flies were either exposed to paraffin oil (PO) as control (mock-exposed, n = 7) or to 20% ethyl butyrate (EB) (odor-exposed, n = 6). Error bars show ± SEM. Two-way ANOVA: CS *p = 0.0451, OrR *p = 0.0264.
To test whether the protocol is functional with other aversive odors, we used another repulsive odor, methyl hexanoate (MH), to perform the training and testing (Figure 8). We observed that wild-type animals (CS) show a 60% decrease in behavioral response after MH-odor exposure in comparison to mock-exposed animals, confirming that this protocol can function with aversive odors other than EB.
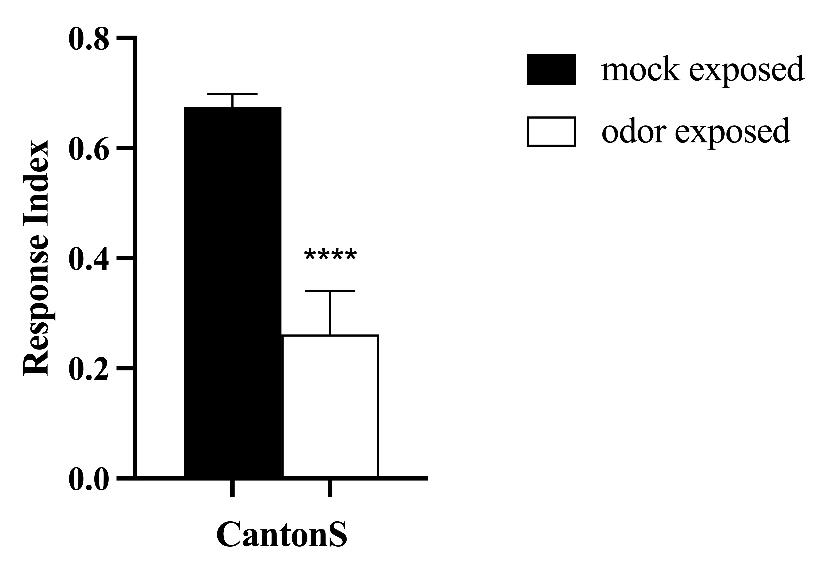
Figure 8. Prolonged exposure to methyl hexanoate (MH) results in olfactory long-term habituation (LTH). Canton S (CS) flies were exposed to either paraffin oil (PO) (mock-exposed, n = 8) as control or 20% MH (odor-exposed, n = 8). Their behavioral response after exposure was assessed using 1% MH. Bars represent the average response index (RI) of CS flies. Error bars show ± SEM. T-test. *** p value < 0.0001.
Subsequently, we wanted to test whether the canonical characteristics of habituation can be observed in this behavioral paradigm. The two characteristics tested were spontaneous recovery and specificity [1,2]. We first assessed spontaneous recovery, which looks at whether odor avoidance can be restored in odor-exposed animals after a certain number of days. We observed that animals tested 7 days after odor exposure do not show a decrease in behavioral response as they do at 1 day after odor exposure (Figure 9), arguing that the olfactory habituation undergoes spontaneous recovery.
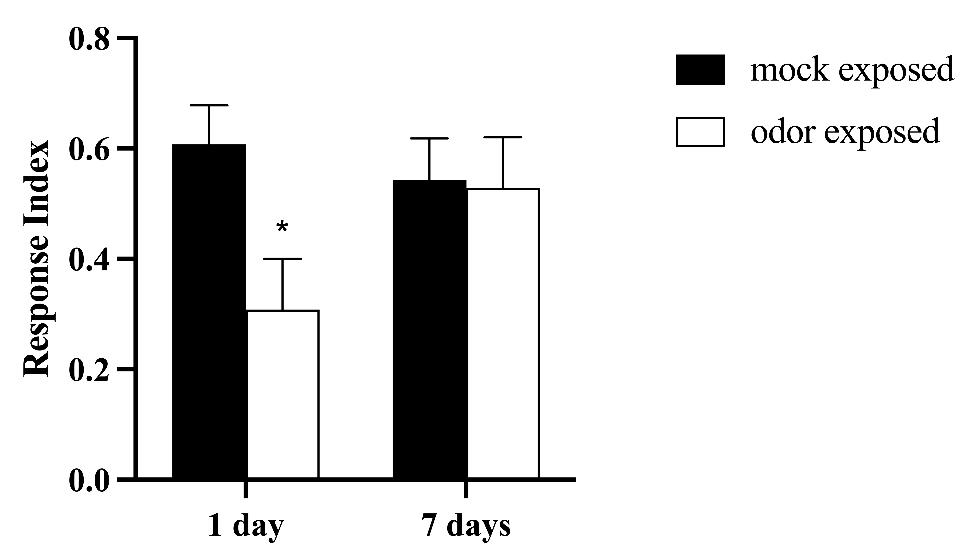
Figure 9. Avoidance to ethyl butyrate (EB) is restored 7 days after training. Canton S (CS) flies were either exposed to 20% ethyl butyrate (EB) (odor-exposed, n = 7) or to paraffin oil (PO) (mock-exposed, n = 7). Their behavioral response to 1% EB was tested 1 and 7 days after exposure. Error bars show ± SEM. Two-way ANOVA test. 1 day p-value *= 0.0352; 7 days p-value = 0.9915.
Lastly, we addressed the second characteristic of habituation, specificity. To investigate the specificity of decreased response, we exposed animals to EB but tested their behavior with two other different odors—CO2 and 3-octanol—to then confirm that the decreased behavioral response is only exhibited toward the exposed odorant. We observed that the behavioral response of EB-exposed flies was not different from mock-exposed animals when they were tested with CO2 and 3-OCT, suggesting that the behavioral decrease observed is selective for the training odorant (Figure 10).
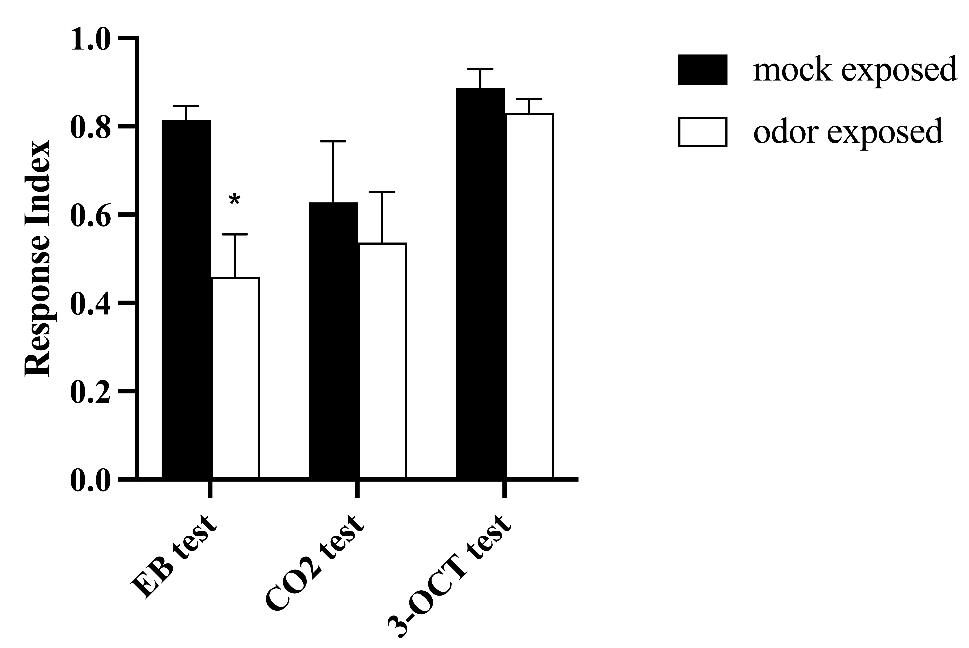
Figure 10. Habituation is specific for the training odor. Flies were either trained with 20% ethyl butyrate (EB) (odor-exposed) or with paraffin oil (PO) as control (mock-exposed) and tested with either 1% EB (n = 9), 0.2% CO2 (n = 7), or 1% 3-OCT (n = 5). Error bars show ± SEM. Two-way ANOVA EB test p-value *= 0.0141; CO2 p-value ns = 0.863; 3-OCT p-value ns = 0.978.
Discussion and conclusion
Habituation is a form of non-associative learning in which the animal filters out familiar inconsequential stimuli resulting in a reduction of behavioral response after continuous or multiple exposure to a stimulus. However, the exact molecular and neuronal mechanisms underlying habituation remain elusive.
Here, we establish an updated behavioral paradigm for long-term olfactory habituation in free-walking groups of adult Drosophila. Our training protocol consists of a 4-days passive-diffusion odor-training, which generates an olfactory memory that lasts 24 h. This protocol differs from previously established protocols for studying long-term olfactory habituation and overcomes behavioral measurement limitations by allowing quantitative and detailed behavioral measurements obtained by video recording with little interference or manual skill from the experimenter, which might be crucial for the purpose of circuit and molecular mapping.
General notes and troubleshooting
General notes
In this type of behavior, the genetic background of the animal plays a key role in its ability to form habituation. It appears that animals that have a white background are unable to form habituation. For this reason, the fly strains should be in a red-eye background, such as Canton S.
Troubleshooting
Unbalanced airflow in the four quadrants of the arena.
This can happen mainly because of two reasons: 1) Air leaks unexpectedly from connections or Duran bottles, or 2) airflow in one odor line is more difficult than in the other. Ensure that all odor bottles are securely sealed and the connectors are tightened to avoid air leaks. From our experience, the most common source of air leakage is the Duran bottles used to contain the odors. We recommend using PTFE tread seal tape around the neck of the Duran bottles to avoid air leakage. Make sure that the solenoid valves you choose provide the same flow once they are opened to avoid variations in airflow between the two odor lines. Select the solenoids that match because we observed slight differences in airflow between different solenoid valves.
Animals are not showing a decreased behavioral response in line with long-term habituation.
This could be due to the age of the animal when the training protocol started. LTH can only be induced in newly eclosed flies, less than 12 h from enclosure [24]. Make sure to collect just newly eclosed flies.
Acknowledgments
This protocol was adapted and modified from McCann et al. [15]. We thank Jens Hillebrand for help with the video editing and members of the Ramaswami lab for useful discussions. C.R. was funded by the Irish Research Council Postgraduate scholarship. M.R. acknowledges support from funded by a Wellcome Trust-SFI-HRB Investigator grant, an Irish Research Council Laureate Award and an SFI Frontiers for the Future grant.
Competing interests
The authors declare no competing interests.
References
- Rankin, C. H., Abrams, T., Barry, R. J., Bhatnagar, S., Clayton, D. F., Colombo, J., Coppola, G., Geyer, M. A., Glanzman, D. L., Marsland, S., et al. (2009). Habituation revisited: An updated and revised description of the behavioral characteristics of habituation. Neurobiol Learn Mem. 92(2): 135–138.
- Thompson, R. F. and Spencer, W. A. (1966). Habituation: A model phenomenon for the study of neuronal substrates of behavior. Psychol Rev. 73(1): 16–43.
- Cohen, R. A. (2011). Habituation. In: Kreutzer, J. S., DeLuca, J. and Caplan, B. (Eds.). Encyclopedia of Clinical Neuropsychology. Springer, New York, NY.
- Cooke, S. F. and Ramaswami, M. (2020). Ignoring the Innocuous: Neural Mechanisms of Habituation. Cogn Neurosci. 197–206.
- Engel, J. E. and Wu, C. F. (2009). Neurogenetic approaches to habituation and dishabituation in Drosophila. Neurobiol Learn Mem. 92(2): 166–175.
- Hammond, S. and O’Shea, M. (2007). Escape flight initiation in the fly. J Comp Physiol A. 193(4): 471–476.
- Duerr, J. S. and Quinn, W. G. (1982). Three Drosophila mutations that block associative learning also affect habituation and sensitization. Proc Natl Acad Sci USA. 79(11): 3646–3650.
- Paranjpe, P., Rodrigues, V., VijayRaghavan, K. and Ramaswami, M. (2012). Gustatory habituation in Drosophila relies on rutabaga (adenylate cyclase)-dependent plasticity of GABAergic inhibitory neurons. Learn Memory. 19(12): 627–635.
- Trisal, S., Aranha, M., Chodankar, A., VijayRaghavan, K. and Ramaswami, M. (2021). A Drosophila Circuit for Habituation Override. J Neurosci. 42(14): 2930–2941.
- Asztalos, Z., Asztalos, Z., Arora, N. and Tully, T. (2007).Olfactory jump reflex habituation in Drosophila and effects of classical conditioning mutations. J Neurogenet. 21: 1–18.
- Cho, W., Heberlein, U. and Wolf, F. W. (2004). Habituation of an odorant‐induced startle response in Drosophila. Genes, Brain Behav. 3(3): 127–137.
- Acevedo, S. F., Froudarakis, E. I., Kanellopoulos, A. and Skoulakis, E. M. (2007). Protection from premature habituation requires functional mushroom bodies in Drosophila. Learn Mem. 14(5): 376–384.
- Gailey, D. A., Jackson, F. R. and Siegel, R. W. (1982). Male courtship in Drosophila: the conditioned response to immature males and its genetic control. Genetics. 102(4): 771–782.
- Das, S., Sadanandappa, M. K., Dervan, A., Larkin, A., Lee, J. A., Sudhakaran, I. P., Priya, R., Heidari, R., Holohan, E. E., Pimentel, A., et al. (2011). Plasticity of local GABAergic interneurons drives olfactory habituation. Proc Natl Acad Sci USA. 108(36): E646–54.
- McCann, C., Holohan, E. E., Das, S., Dervan, A., Larkin, A., Lee, J. A., Rodrigues, V., Parker, R. and Ramaswami, M. (2011). The Ataxin-2 protein is required for microRNA function and synapse-specific long-term olfactory habituation. Proc Natl Acad Sci USA. 108(36): e1107198108.
- Papanikolopoulou, K., Roussou, I. G., Gouzi, J. Y., Samiotaki, M., Panayotou, G., Turin, L. and Skoulakis, E. M. (2019). Drosophila Tau Negatively Regulates Translation and Olfactory Long-Term Memory, But Facilitates Footshock Habituation and Cytoskeletal Homeostasis. J Neurosci. 39(42): 8315–8329.
- Sachse, S., Rueckert, E., Keller, A., Okada, R., Tanaka, N. K., Ito, K. and Vosshall, L. B. (2007). Activity-Dependent Plasticity in an Olfactory Circuit. Neuron. 56(5): 838–850.
- Sadanandappa, M. K., Redondo, B. B., Michels, B., Rodrigues, V., Gerber, B., VijayRaghavan, K., Buchner, E. and Ramaswami, M. (2013). Synapsin Function in GABA-ergic Interneurons Is Required for Short-Term Olfactory Habituation. J Neurosci. 33(42): 16576–16585.
- Sudhakaran, I. P., Hillebrand, J., Dervan, A., Das, S., Holohan, E. E., Hülsmeier, J., Sarov, M., Parker, R., VijayRaghavan, K., Ramaswami, M., et al. (2013). FMRP and Ataxin-2 function together in long-term olfactory habituation and neuronal translational control. Proc Natl Acad Sci USA. 111(1): E99–E108.
- Aso, Y. and Rubin, G. M. (2016). Dopaminergic neurons write and update memories with cell-type-specific rules. eLife. 5: e16135.
- Faucher, C., Forstreuter, M., Hilker, M. and de Bruyne, M. (2006). Behavioral responses of Drosophila to biogenic levels of carbon dioxide depend on life-stage, sex and olfactory context. J Exp Biol. 209(14): 2739–2748.
- Lin, C. C., Riabinina, O. and Potter, C. J. (2016). Olfactory Behaviors Assayed by Computer Tracking Of Drosophila in a Four-quadrant Olfactometer. J Visualized Exp.: e3791/54346.
- Lopes, G., Bonacchi, N., Frazão, J., Neto, J. P., Atallah, B. V., Soares, S., Moreira, L., Matias, S., Itskov, P. M., Correia, P. A., et al. (2015). Bonsai: an event-based framework for processing and controlling data streams. Front Neuroinform. 9: e00007.
- Chodankar, A., Sadanandappa, M. K., VijayRaghavan, K. and Ramaswami, M. (2020). Glomerulus-Selective Regulation of a Critical Period for Interneuron Plasticity in the Drosophila Antennal Lobe. J Neurosci. 40(29): 5549–5560.
Article Information
Publication history
Received: Jul 10, 2024
Accepted: Sep 8, 2024
Available online: Oct 13, 2024
Published: Nov 5, 2024
Copyright
© 2024 The Author(s); This is an open access article under the CC BY-NC license (https://creativecommons.org/licenses/by-nc/4.0/).
How to cite
Roselli, C., Ramaswami, M. and Aranha, M. M. (2024). Semi-Automated Assessment of Long-Term Olfactory Habituation in Drosophila melanogaster Using the Olfactory Arena. Bio-protocol 14(21): e5102. DOI: 10.21769/BioProtoc.5102.
Category
Neuroscience > Behavioral neuroscience > Learning and memory
Neuroscience > Behavioral neuroscience > Olfaction
Do you have any questions about this protocol?
Post your question to gather feedback from the community. We will also invite the authors of this article to respond.