- Protocols

- Articles and Issues
- For Authors
- About
- Become a Reviewer

Acutely Modifying Phosphatidylinositol Phosphates on Endolysosomes Using Chemically Inducible Dimerization Systems
Published: Vol 14, Iss 19, Oct 5, 2024 DOI: 10.21769/BioProtoc.5078 Views: 1818
Reviewed by: Ralph Thomas BoettcherAlexandros C KokotosAnonymous reviewer(s)
Original research article
The authors used this protocol in:
Jun 2023
Advertisement


Protocol Collections
Comprehensive collections of detailed, peer-reviewed protocols focusing on specific topics


Abstract
Phosphoinositides are rare membrane lipids that mediate cell signaling and membrane dynamics. PI(4)P and PI(3)P are two major phosphoinositides crucial for endolysosomal functions and dynamics, making them the lipids of interest in many studies. The acute modulation of phosphoinositides at a given organelle membrane can reveal important insights into their cellular function. Indeed, the localized depletion of PI(4)P and PI(3)P is a viable tool to assess the importance of these phosphoinositides in various experimental conditions. Here, we describe a live imaging method to acutely deplete PI(4)P and PI(3)P on endolysosomes. The depletion assay utilizes the GAI-GID1 or the FRB-FKBP inducible dimerization system to target the catalytic domain of the PI(4)P phosphatase, Sac1, or the PI(3)P phosphatase domain of MTM1 to the endolysosome for localized depletion of these phosphoinositides. By using the fluorescently tagged biosensors, 2xP4M and PX, we can validate and monitor the depletion of PI(4)P and PI(3)P, respectively, on endolysosomes in real-time. We discuss a method for normalizing the fluorescence measurements to appropriate the relative amount of these phosphoinositides in the organellar membranes (endolysosomes), which is required for monitoring PI(4)P or PI(3)P levels during the acute depletion assay. Since the localization of the dimerization partners is specified by the membrane targeting signal, our protocol will be useful for studying the signaling and functions of phosphoinositides at any membrane.
Key features
• Acute depletion and real-time monitoring of PI(3)P and PI(4)P on the endolysosomal membrane using chemically inducible dimerization systems.
• Modifiable and adaptable to modulate other phosphoinositides on different organellar membranes.
Keywords: PhosphoinositidesGraphical overview
Background
Phosphoinositides, such as PI(4)P and PI(3)P, are phosphorylated derivatives of phosphatidylinositol, a phospholipid found in the cytoplasmic leaflet of eukaryotic membranes. The inositol ring of the phosphatidylinositol headgroup can be phosphorylated by specific kinases, and dephosphorylated by phosphatases, in position 3, 4, and 5 for a total of seven different phosphoinositides [1]. Phosphoinositides are key signaling lipids that regulate organelle membrane identity and dynamics. They notably play major roles in orchestrating various endolysosomal functions and dynamic events such as tubulation and fission, which are required for the reformation of lysosomes at the end of the autophagic and endocytic processes [2–5].
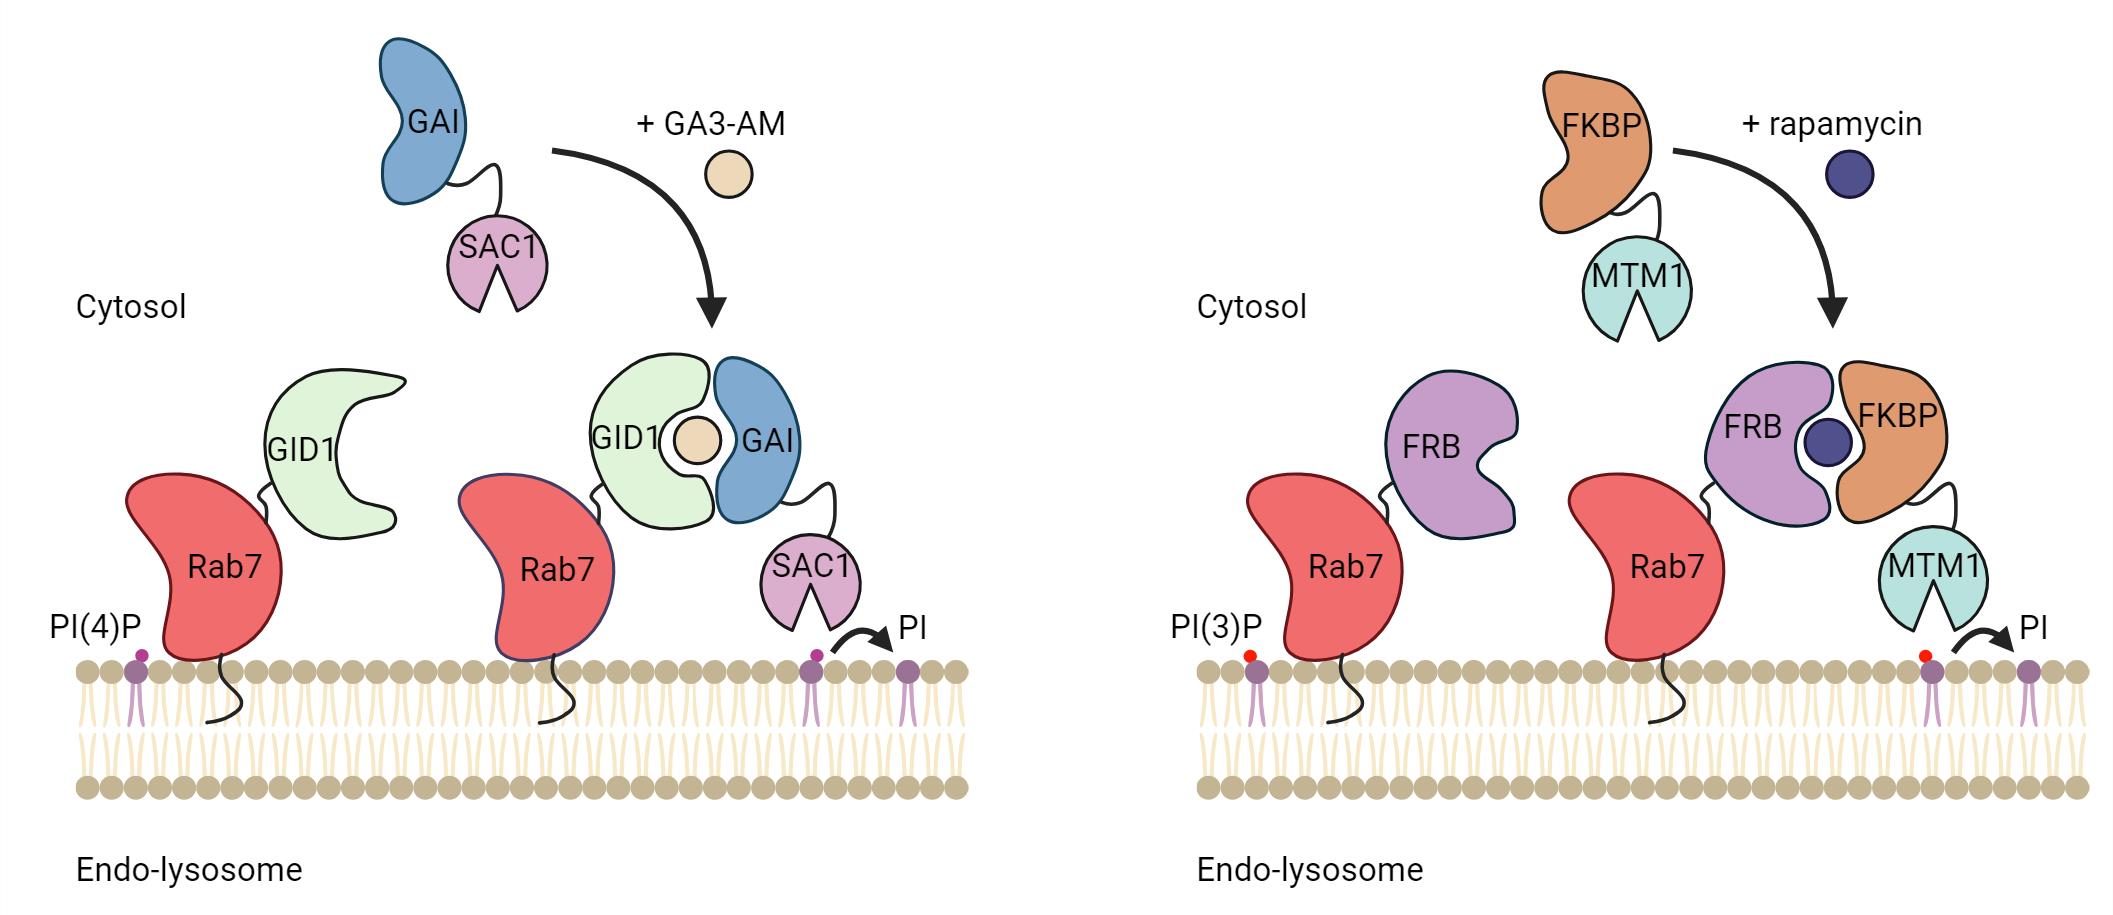
One elegant way to investigate the role of phosphoinositides in organelle biology is to modulate their levels at a given membrane. This can be done by specifically targeting phosphoinositide kinases or phosphatases to an organelle of interest. Targeting can be achieved by fusing the catalytic domain of kinases or phosphatases to a membrane-targeting domain (typically a transmembrane domain) of a resident membrane protein of the desired organelle. This allows for the constitutive depletion of the phosphoinositides upon the expression of the protein. However, to allow for temporal and acute regulation of the phosphoinositides species, the catalytic domain can be targeted using a chemically induced dimerization system. Here, one part of the dimer is anchored at a membrane of interest by fusing it to a transmembrane protein/targeting sequence, and the other is coupled to a cytosolic version of a phosphatase or kinase. Upon the addition of chemical inducers of dimerization, the binding affinity between the two-part dimerization system increases drastically, promoting the recruitment of the cytosolic part to the membrane-anchored part of the dimer. As a result, the recruited kinases and phosphatases actively phosphorylate and dephosphorylate the phosphoinositide substrate, respectively, depleting them from the organellar membrane.
In addition, the level of specific phosphoinositides at membranes in cells can be evaluated by the ectopic expression of genetically encoded phosphoinositides biosensors coupled to a fluorescent protein, such as GFP or mCherry. Over the last 20 years, high-affinity binding domains for specific phosphoinositides have been identified and used as biosensors to detect different phosphoinositide species [6]. Here, we present a protocol utilizing chemically induced dimerization systems to deplete specific phosphoinositides at endolysosomes and biosensors to detect their depletion. We describe how to use two different dimerization systems in cells, the GAI-GID1 and the FRB-FKBP, to deplete PI(4)P and PI(3)P, respectively, at Rab7-positive endolysosomes (hereafter referred to as endolysosomes). However, any of the two dimerization systems can be used to deplete the phosphoinositides on any other membrane-bound organelle of interest. In this protocol, we discuss the experimental setup to express these systems in mammalian cells and how to perform image acquisition and analysis to validate the depletion of PI(4)P or PI(3)P.
The FRB-FKBP dimerization system was invented in the 90’s [7] and relies on the dimerization of FRB and FKBP in the presence of rapamycin, a cell-permeant chemical most famous for its inhibitory effect on mTORC1 (mammalian target of rapamycin complex 1). The FRB and FKBP domains are relatively small (~10 kDa) and thus can be efficiently transfected and expressed, reducing the likeliness of impacting the function of the protein of interest fused to these domains. However, using rapamycin in the FRB-FKBP dimerization system may cause undesirable changes in certain mammalian biological processes such as autophagy and nutrient-sensing pathways, notably due to its effect on mTORC1. To circumvent this problem, rapalogs (rapamycin analogs) can be used to alleviate this cross-reactivity [8]. Another way to mitigate the complications of rapamycin is to use the plant-derived GA3-AM-inducible GAI-GID1 dimerization system since there is no known mammalian target of GA3-AM [9]. However, unlike the FRB-FKBP system, both GAI and GID1 are medium-sized protein domains (~59 and ~40 kDa, respectively) which may impede the efficient introduction or expression of proteins. Control experiments can then be performed to validate that tagging with dimerizing proteins does not impair the localization or the function of the protein of interest. Here, we present a protocol to target PI(4)P or PI(3)P phosphatases to endolysosomes and to validate phosphoinositides depletion using genetically encoded PI(4)P or PI(3)P biosensors.
Materials and reagents
Cell line
HeLa cells from ATCC (CCL-2) [here, HeLa cells are used. However, this can be used in any cell lines. The only difference may be the system to insert the necessary plasmid into the cell (transfections vs. transduction vs. electroporation, etc.)]
Plasmids (Table 1)
Table 1. Plasmids used in this protocol
| Plasmid | Addgene number | Reference |
|---|---|---|
| iRFP-GID1-Rab7 | Levin-Konigsberg et al. [10] | |
| CFP-GAI-Sac1 | Boutry and Kim [11] | |
| CFP-GAI-Sac1 C392S | Boutry and Kim [11] | |
| mCherry-2xP4M | Levin-Konigsberg et al. [10] | |
| Lamp1-mCherry | 45147 | Van Engelenburg and Palmer [12] |
| iRFP-FRB-Rab7 | 51613 | Hammond et al. [13] |
| mCherry-FKBP-MTM1 | 51614 | Hammond et al. [13] |
| mCherry-FKBP | 67514 | Varnai et al. [14] |
| PX-GFP | 19010 | Kanai et al. [15] |
| Lamp1-GFP | 16290 | Minin et al. [16] |
Reagents
DMEM, 4.5 g/L glucose, supplemented with L-glutamine and sodium pyruvate (Wisent, catalog number: 319-005 CL)
Fetal bovine serum (FBS) (Wisent, catalog number: 098150)
Trypsin-EDTA (0.05% Trypsin, 0.53 mM EDTA) (Wisent, catalog number: 325542105)
D-PBS (Wisent, catalog number: 311-45 CL)
Neon electroporation kit 100 μL (Invitrogen, catalog number: MPK10096)
Resuspension buffer R
Electrolytic buffer E2
Neon electroporation tips (100 µL)
Electroporation tubes
Rapamycin (Sigma-Aldrich, catalog number: 553210)
GA3-AM (Sigma-Aldrich, catalog number: SML1959)
Laboratory supplies
T75 cm2 cell culture flasks (Sarstedt Inc, catalog number: 50-809-261)
4-well Lab-Tek II chambered cover glass (Nunc, catalog number: 155382)
15 mL conical tubes
1.5 mL Eppendorf tubes
Equipment
Micropipette (P1000, P200, and P10)
Centrifuge with adaptors for 15 mL conical tubes
Tissue culture CO2 incubator
Standard inverted light microscope
Hemocytometer with cover glass
Inverted microscope (Plan-Apochromat 63×/1.40 oil objective) (Zeiss, model: Airyscan 2 LSM 980) with temperature- and CO2-controlled imaging chamber
Neon NxT Electroporation System (electroporation device, electroporation pipette and pipette station, electroporation tube, and tube chamber)
Software and datasets
ImageJ [17] or Fiji software [18] (both open source)
Procedure
Transfection
We found that lipofection-based methods of transfection can affect the morphology of endolysosomes. Therefore, we recommend electroporation methods such as the Neon electroporation system (Invitrogen) for these assays. The use of antibiotics and antimycotics should be avoided as it affects cell viability after electroporation.
Culture HeLa cells in T75 cm2 flasks in DMEM containing 10% FBS (complete media) until cells reach 70%–80% confluency.
Remove media and wash with D-PBS. Add 2 mL of trypsin-EDTA per flask and incubate for 5 min at 37 °C or until cells are detached.
Add 8 mL of complete media to stop trypsin activity.
Place a clean cover glass on top of the hemocytometer (counting chamber facing up). Transfer 10 µL of the cell suspension into the counting chamber by capillary action and view under a standard inverted light microscope. The hemocytometer chamber is composed of nine large, gridded squares, each containing 0.1 mm3 space (= 0.1 µL). Count the cells in every gridded square and average them. Estimate the cell density by dividing the average number of cells per gridded square by 1 mm3 or 0.1 µL.
Transfer 0.5 × 10⁶ cells to a new 15 mL conical tube per transfection.
Spin cells at 300× g for 5 min, remove supernatant, and resuspend with 10 mL of D-PBS.
Spin at 300× g for 5 min and remove the supernatant. Resuspend the cell pellet in 100 µL of Neon electroporation R buffer and transfer to a 1.5 mL Eppendorf tube.
Add DNA (dissolved in water or Tris-EDTA elution buffer) to cells. The manufacturer recommends adding 5 µg of total DNA per 100 µL of cells resuspended in R buffer. The DNA amount is plasmid-dependent and may require optimization.
For PI(4)P depletion using the GAI-GID1 system:
An equal amount of iRFP-GID1-Rab7 + CFP-GAI-Sac1 or CFP-GAI-Sac1 C392S (catalytically dead Sac1 used as a negative control). Co-transfection with an equal amount of PI(4)P biosensor mCherry-2xP4M to assess PI(4)P depletion or Lamp1-mCherry to assess the effect of PI(4)P depletion on endolysosomal morphology.
For PI(3)P depletion using the FKBP-FRB dimerization system:
An equal amount of iRFP-FRB-Rab7 + mCherry-FKBP-MTM1 or mCherry-FKBP (used as a negative control). Co-transfection with an equal amount of PI(3)P biosensor PX-GFP to monitor for PI(3)P depletion or Lamp1-GFP to assess the effect of PI(3)P depletion on endolysosomes.
Fill the electroporation tube with 3 mL of buffer E2. Insert the tube into the tube chamber.
Ensure that the electroporation parameters are customized according to the manufacturer’s protocol (https://www.thermofisher.com/ca/en/home/life-science/cell-culture/transfection/neon-transfection-system/neon-transfection-system-cell-line-data.html). For HeLa cells, set the pulse number to 2, voltage at 1,005 V, and width at 35 ms. Start the electroporation.
Dilute the electroporated cell suspension with 2.4 mL of warm complete media.
Seed 0.5 mL of the diluted cell suspension (equivalent to 0.1 × 10⁶ cells) per cell chamber (Lab-tek II chambered cover glass, 1.7 cm2 per well).
Incubate the cell chamber in the tissue culture CO2 incubator for 12–36 h for plasmid expression.
Imaging and dimerization
Perform live microscopy imaging 24 h post-electroporation. On the day of imaging, prepare an aliquot of complete media supplemented with either 20 µM GA3-AM or 200 nM rapamycin (2× concentration, to a final concentration of 10 µM GA3-AM or 100 nM rapamycin). For each condition, prepare 300 µL of solutions (sufficient to cover a 1.7 cm2 cell chamber).
This protocol uses the Zeiss Airyscan 2 LSM 980 inverted microscope with Plan-Apochromat 63×/1.40 oil objective at 37 °C in a 5% CO2-controlled imaging chamber. Before imaging, ensure the appropriate lasers and filters setup according to the wavelengths (λ) of the excitation (Ex)/emission (Em) maxima of the fluorescent proteins listed in Table 2. Furthermore, ensure that the stage temperature is stable.
Table 2. Excitation/emission maxima of the fluorescent proteins used in this protocol
Fluorescent protein Ex maximum λ (nm) Em maximum λ (nm) Laser Ex λ (nm)* Em filter* iRFP 690 713 640 LP660 CFP 456 480 488 BP420-500 GFP 488 507 488 BP495-555 mCherry 587 610 561 BP570-620 *Note: The laser Ex λ and Em filters setup is based on our Airyscan 2 LSM 980 system. Similar lasers and filters can be used on other systems.
Replace each cell chamber with 300 µL of fresh complete media.
Secure the cell chamber slide on the stage with the appropriate adaptor.
Using ZEN microscopy software, add “time series” and “Z-stacks” to the acquisition parameters to record stacks of time-lapse images. Dimerization should occur within 10 min after adding the inducing agents (GA3-AM or rapamycin). We suggest capturing a 10-min video with an interval of 1 min for kinetic assays. For end-point assays, capture images up to 1 h after induction.
For kinetic assays, move the stage to a field of monolayer cells and start the acquisition using the parameters as described in step 5. After acquiring the first stacks, wait for 30 s and carefully pipette an equal volume (300 µL) of the solution prepared from step B1 into the cell chamber well (the final volume is now 600 µL). The acquisition should continue automatically as preconfigured in the software.
For end-point assays, image the cells before induction. Then, add an equal volume of the solution and incubate for at least 10 min and up to 1 h followed by another round of post-induction imaging.
Data analysis
Here, we present analysis pipelines to assess (1) the recruitment of the phosphatases to endolysosomes (= dimerization efficiency) and (2) the subsequent specific phosphoinositides level changes caused by this recruitment. The dimerization efficiency is monitored by quantifying the colocalization between the phosphatase and the Rab7 constructs used to recruit phosphatases to endolysosomes. We find that the GAI-GID1 and FKBP-FRB systems display very similar recruitment kinetics, leading to an efficient dimerization within minutes. The depletion of phosphoinositides, here PI(4)P and PI(3)P, is monitored by measuring the levels of specific biosensors [2xP4M for PI(4)P and PX for PI(3)P] at endolysosomes normalized to either plasma membrane (PM) levels of 2xP4M and cytosolic background for PX. We use Fiji, an open-source software for this analysis. Other software such as Volocity and CellProfiler can be used. When opening the raw ZEN files using Fiji, drag the file onto the Fiji main control panel. When the Bio-Formats Import Options window pops up, ensure that the Color mode option is set to Default, which opens the images with the channels split (Figure S1). By default, the ZEN files are in 16-bit depths.
(1) Validation of GAI or FKBP recruitment to endolysosomes
Open the raw ZEN files using Fiji. In this example, for simplicity, the endolysosomal marker channel is designated as Channel 1 (Ch1) and the GAI- or FKBP-fused fluorescence channel is designated as Channel 2 (Ch2).
Specify (Edit > Selection > Specify…) a subregion for analysis. Here, a Z-slice of a ROI of 15 × 15 µm square region (highlighted in yellow) containing resolvable endolysosomes was selected (Figure S2, box A).
Crop (Image > Crop) or duplicate (Image > Duplicate…) this subregion for subsequent analysis.
Split the channels (Image > Color > Split Channels).
Select Ch1 window (Figure S2, box B). Threshold (Image > Adjust > Threshold…) the image to accurately mark the endolysosomal regions. Click Apply and this will automatically binarize the image and convert it to 8-bit (Figure S2, box C).
Create a mask using the Create Selection (Edit > Selection > Create Selection) and the Add to Manager (Edit > Selection > Add to Manager) commands. Here, the mask is outlined in yellow (Figure S3, box A) and the selected mask is registered at the ROI manager (Figure S3, box B).
Switch to Ch2 window (Figure S3, box C).
Select the registered ROI (from step 6) and use the Measure command (Analyze > Measure) to acquire the mean intensity of fluorescent protein-fused GAI or FKBP in the specified endolysosomal regions (Figure S3, box D). If there is no “Mean” column displayed in the Results window, execute the Set Measurements… command (Analyze > Set Measurements…). Tick the Mean gray value checkbox and rerun the Measure command.
Repeat the measurement (steps 3–8) for all the time-lapse slices, if any.
The measured fluorescence intensity after the induction (F) is normalized to the first slice (F0, before the addition of GA3-AM or rapamycin). Use the equation below to calculate the normalized endolysosomal GAI or FKBP fluorescence intensity (Ch2norm) of each slice:
The change in the GAI or FKBP fluorescence intensity on the endolysosomal mask over time indicates the recruitment efficiency. Plot the Ch2norm value against time to obtain the kinetics curve as shown in Figure 1.
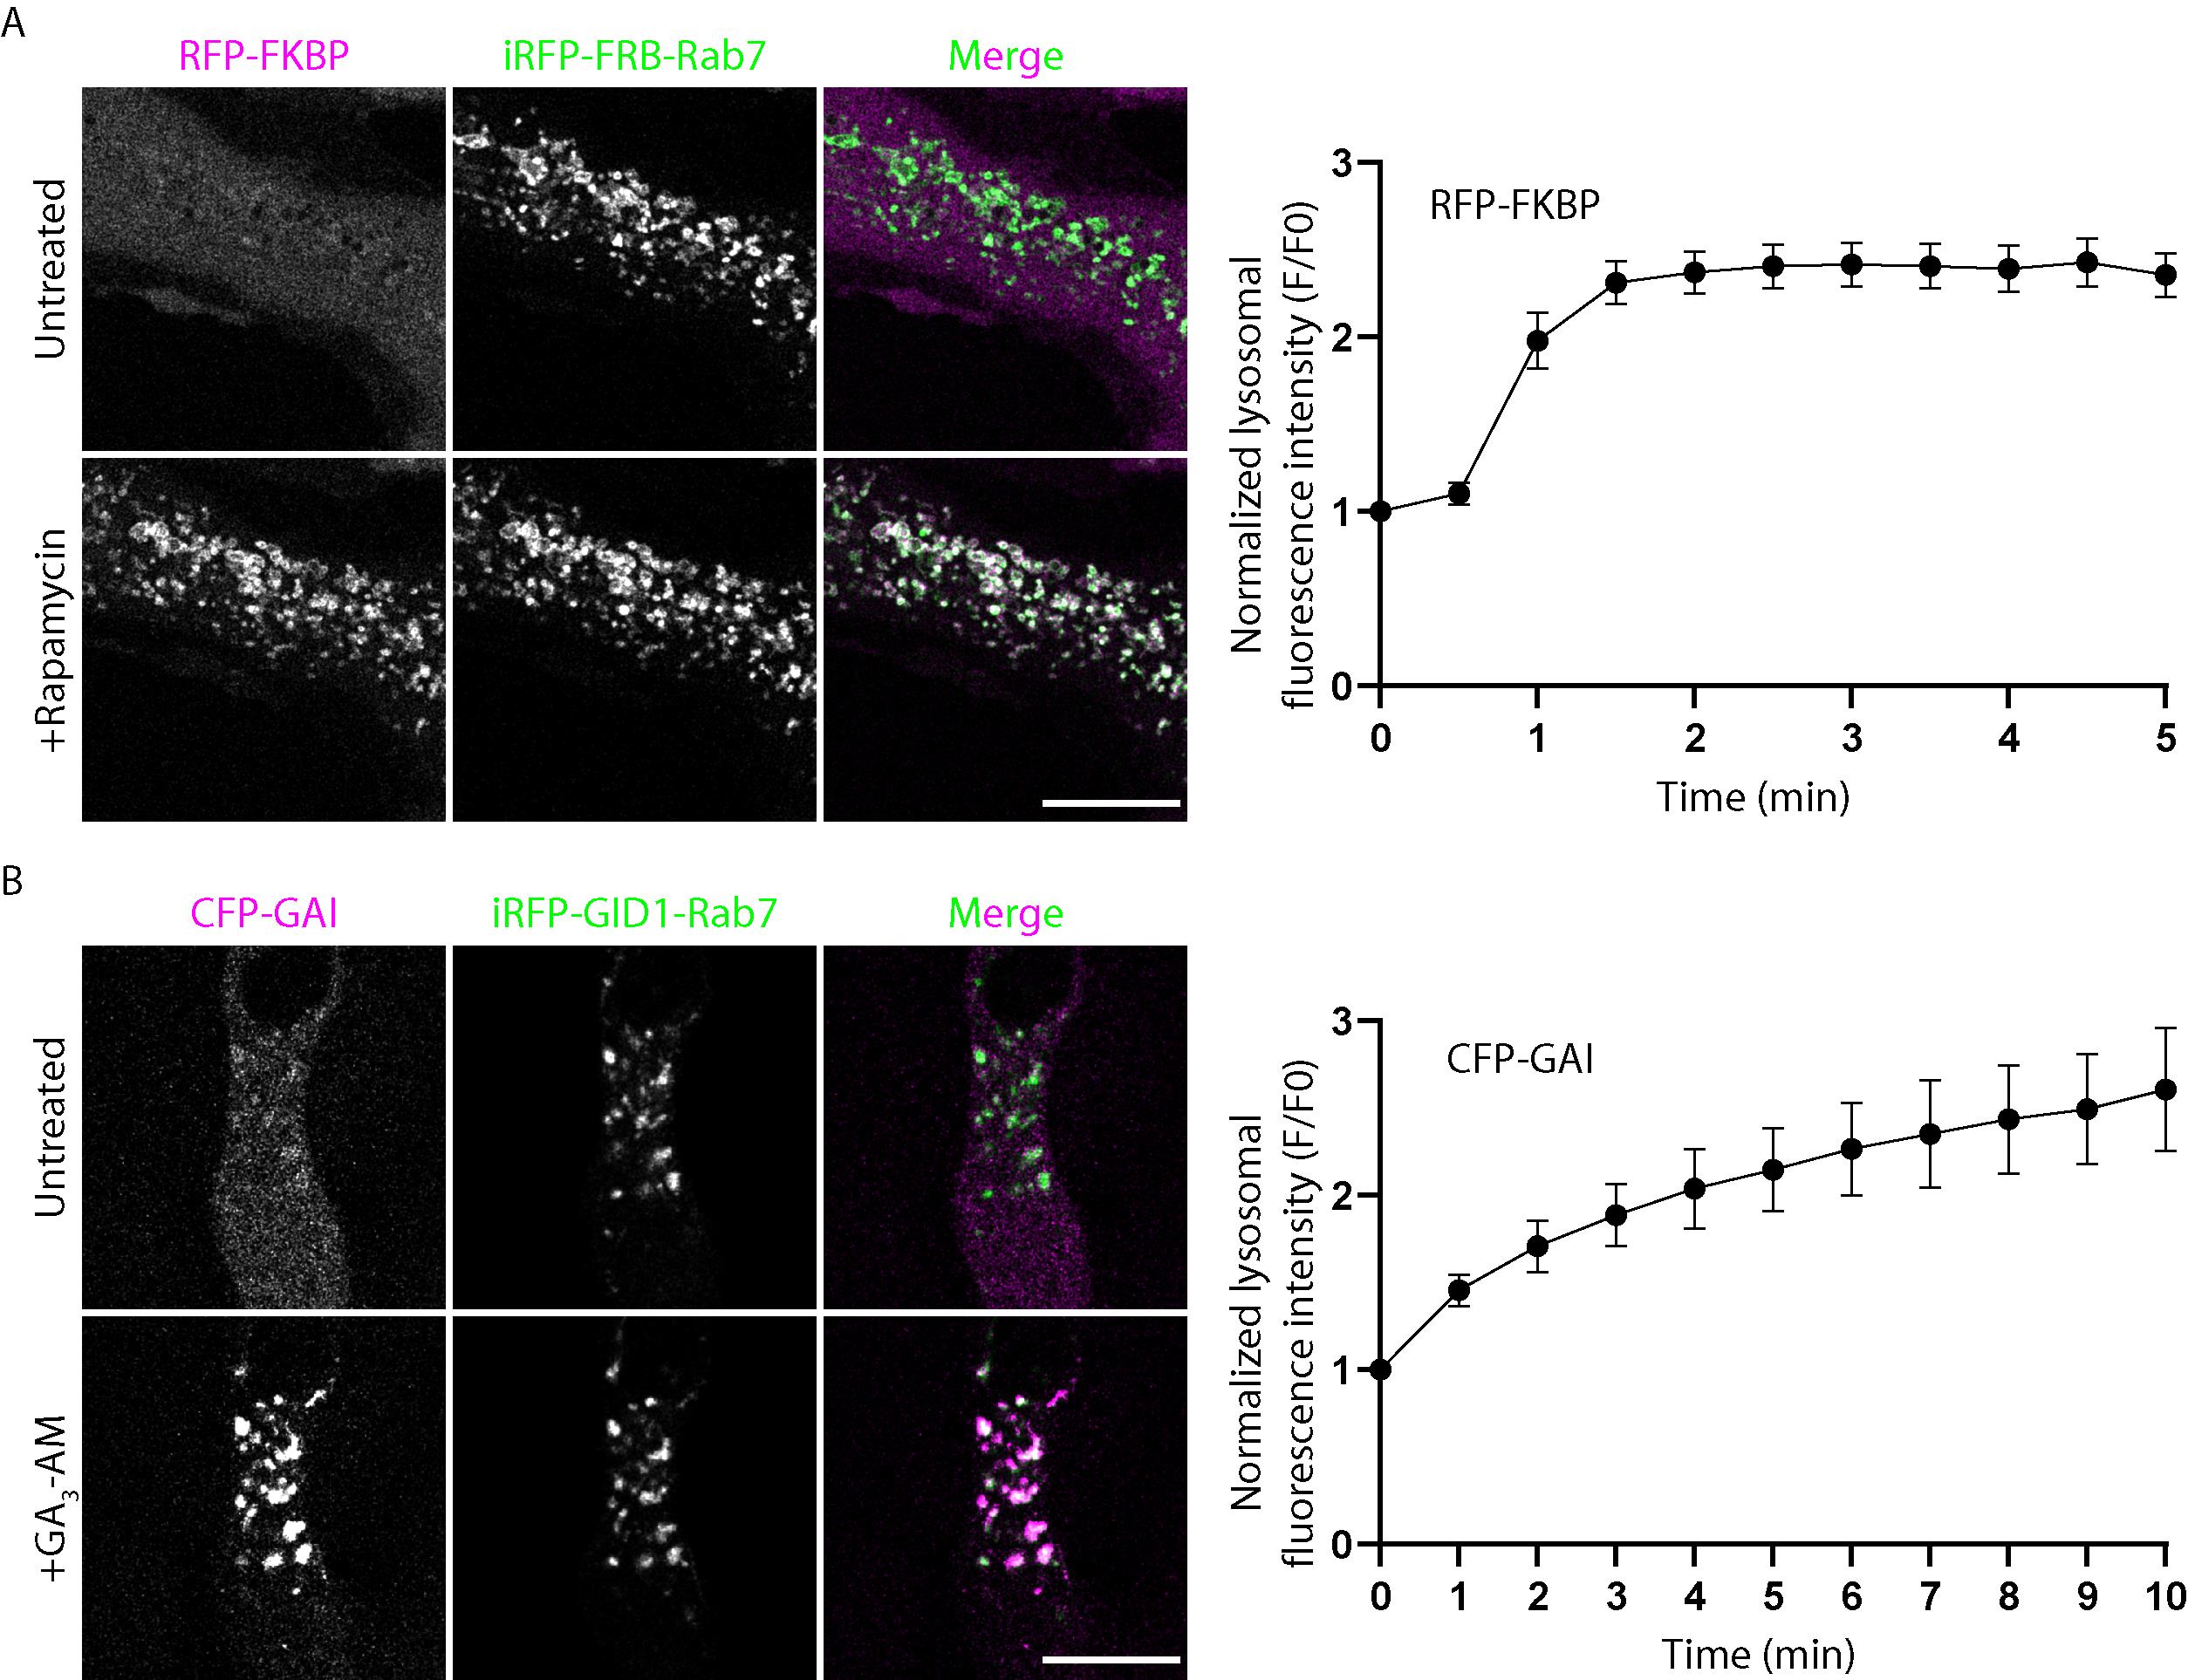
Figure 1. Validation of GAI or FKBP recruitment to endolysosomes and its efficiency. (A) Representative live images of HeLa cells co-expressing RFP-FKBP (purple) and iRFP-RFB-Rab7 (green) before and after dimerization induction with 100 nM rapamycin. Scale bar, 15 µm. The right panel shows the dimerization kinetics of the endo-lysosomal targeting FRB-FKBP system in this assay. Error bar = SEM. Cells from three independent experiments, n = 11. (B) Representative live images of HeLa cells co-expressing CFP-GAI (purple) and iRFP-GID1-Rab7 (green) before and after dimerization induction with 10 µM GA3-AM. Scale bar, 15 µm. The right panel shows the dimerization kinetics of the endolysosomal targeting GAI-GID1 system in this assay. Error bar = SEM. Cells from three independent experiments, n = 10.
(2) Validating phosphoinositides depletion at endolysosomes:
Validation of PI(4)P depletion at endolysosomes
Open the raw ZEN files using Fiji. In this example, for simplicity, the mCherry-2xP4M channel is designated as Ch1, and the Rab7 endolysosomal marker channel is designated as Ch2.
The PM contains a great amount of PI(4)P (and therefore high 2xP4M fluorescence intensity) and is not expected to change upon the induced recruitment of Sac1 to the endolysosomes, making the PM 2xP4M signal a great reference for normalization. Measure PM mCherry-2xP4M signal intensity by performing line scans perpendicularly across three PM regions in Ch1. Record the maximum intensity (do not record the mean intensity as the signal is expected to be enriched only at the PM but not in the cytosol and extracellular region) using the Plot Profile command (Analyze > Plot Profile). Average these three values.
Switch to Ch2, specify a 15 × 15 µm square region, and threshold the image. Create a mask of Rab7-positive endolysosomes and add it to the ROI manager.
To measure the mean intensity of endolysosomal mCherry-2xP4M, switch back to Ch1 and select the ROI registered from step 3. Record the mean intensity.
Divide the mean lysosomal mCherry-2xP4M intensity obtained from step 4 by the mean PM mCherry-2xP4M intensity from step 2 to calculate the normalized lysosomal PI(4)P level:
An example of such an analysis is shown in Figure 2A.
(3) Validation of PI(3)P deletion at endolysosomes
Open the raw ZEN files using Fiji. In this example, for simplicity, the PX-GFP channel is designated as Ch1, and the Rab7 endolysosomal marker channel is designated as Ch2.
Specify a 15 × 15 µm square region for analysis. Avoid any area outside of the cell as it will affect normalization.
In Ch1, measure the mean intensity. This value will be used as background normalization.
Switch to Ch2 and threshold the image. Make a mask of the Rab7-positive endolysosome and add it to the ROI manager.
Switch back to Ch1 and specify the ROI registered from step 4. Measure the mean intensity.
Divide the mean lysosomal PX-GFP intensity obtained from step 5 by the overall mean PX-GFP intensity to calculate the normalized lysosomal PI(3)P level:
An example of such an analysis is shown in Figure 2B.

Figure 2. Validation of endolysosomal PI(4)P or PI(3)P depletion. (A) Representative live images of HeLa cells co-expressing mCherry-2XP4M (purple) and iRFP-GID1-Rab7 (green) in addition to GAI-Sac1 or GAI-Sac1(C392S) expression. Images were acquired after dimerization induction with 10 µM GA3-AM. Scale bar, 15 µm. Right panel shows the quantification of the lysosomal 2XP4M signal normalized to the PM 2XP4M signal. Statistical significance was calculated from the Student’s t-test. Error bar = SEM. n = 31 cells (GAI-Sac1) and n = 30 cells (GAI-Sac1 C392S) from three independent experiments. (B) Representative live images of HeLa cells co-expressing PX-GFP (purple) and iRFP-FRB-Rab7 (green) in addition to FKBP-MTM1 or FKBP expression. Images were acquired after dimerization induction with 100 nM rapamycin. Scale bar, 15 µm. Right panel shows the quantification of the lysosomal PX signal normalized to the cytosolic PX signal. Statistical significance was calculated from the Student’s t-test. Error bar = SEM. n = 31cells (FKBP-MTM1) and n = 31 cells (FKBP) from three independent experiments.
Validation of protocol
This protocol or parts of it has been used and validated in the following research article(s):
Boutry et al. [5]. Arf1-PI4KIIIβ positive vesicles regulate PI(3)P signaling to facilitate lysosomal tubule fission. J Cell Biol (Figure 6, panels D–J).]
Boutry and Kim. [11]. ORP1L mediated PI(4)P signaling at ER-lysosome-mitochondrion three-way contact contributes to mitochondrial division. Nature Communications (Figure 3, panels I–N; Figure 4, panel M; Figure 5, panels I–L; Figure 7, panels A–C and I–K; Supplementary Figure 8, panels A–I).
Acknowledgments
Infrastructure for the Kim Laboratory was provided by a John Evans Leadership Fund grant from the Canadian Foundation for Innovation and the Ontario Innovation Trust. This work was supported by operating grants from the Canadian Institutes of Health Research to P.K. Kim (PJT#180476); M. Boutry was supported by a Restracomp Fellowship from the Hospital for Sick Children and a Canadian Institutes of Health Research Postdoctoral fellowship. This protocol was used in: Boutry et al. J Cell Biol (2023), DOI: 10.1083/jcb.202205128 and Boutry and Kim. Nat Commun (2021), DOI: 10.1038/s41467-021-25621-4 and was adapted from Miyamoto et al. Nat Chem Biol (2012), DOI: 10.1038/nchembio.922 and Spencer et al. Science (1993), DOI: 10.1126/science.7694365.
Competing interests
The authors declare that they have no competing interests.
References
- Balla, T. (2013). Phosphoinositides: Tiny Lipids With Giant Impact on Cell Regulation. Physiol Rev. 93(3): 1019–1137.
- Sridhar, S., Patel, B., Aphkhazava, D., Macian, F., Santambrogio, L., Shields, D. and Cuervo, A. M. (2012). The lipid kinase PI4KIIIβ preserves lysosomal identity. EMBO J. 32(3): 324–339.
- Rong, Y., Liu, M., Ma, L., Du, W., Zhang, H., Tian, Y., Cao, Z., Li, Y., Ren, H., Zhang, C., et al. (2012). Clathrin and phosphatidylinositol-4,5-bisphosphate regulate autophagic lysosome reformation. Nat Cell Biol. 14(9): 924–934.
- Jani, R. A., Di Cicco, A., Keren-Kaplan, T., Vale-Costa, S., Hamaoui, D., Hurbain, I., Tsai, F. C., Di Marco, M., Macé, A. S., Zhu, Y., et al. (2022). PI4P and BLOC-1 remodel endosomal membranes into tubules. J Cell Biol. 221(11): e202110132.
- Boutry, M., DiGiovanni, L. F., Demers, N., Fountain, A., Mamand, S., Botelho, R. J. and Kim, P. K. (2023). Arf1-PI4KIIIβ positive vesicles regulate PI(3)P signaling to facilitate lysosomal tubule fission. J Cell Biol. 222(9): e202205128.
- Hammond, G. R. and Balla, T. (2015). Polyphosphoinositide binding domains: Key to inositol lipid biology. Biochim Biophys Acta Mol Cell Biol Lipids. 1851(6): 746–758.
- Spencer, D. M., Wandless, T. J., Schreiber, S. L. and Crabtree, G. R. (1993). Controlling Signal Transduction with Synthetic Ligands. Science. 262(5136): 1019–1024.
- Bayle, J. H., Grimley, J. S., Stankunas, K., Gestwicki, J. E., Wandless, T. J. and Crabtree, G. R. (2006). Rapamycin Analogs with Differential Binding Specificity Permit Orthogonal Control of Protein Activity. Chem Biol 13(1): 99–107.
- Miyamoto, T., DeRose, R., Suarez, A., Ueno, T., Chen, M., Sun, T. p., Wolfgang, M. J., Mukherjee, C., Meyers, D. J., Inoue, T., et al. (2012). Rapid and orthogonal logic gating with a gibberellin-induced dimerization system. Nat Chem Biol. 8(5): 465–470.
- Levin-Konigsberg, R., Montaño-Rendón, F., Keren-Kaplan, T., Li, R., Ego, B., Mylvaganam, S., DiCiccio, J. E., Trimble, W. S., Bassik, M. C., Bonifacino, J. S., et al. (2019). Phagolysosome resolution requires contacts with the endoplasmic reticulum and phosphatidylinositol-4-phosphate signalling. Nat Cell Biol. 21(10): 1234–1247.
- Boutry, M. and Kim, P. K. (2021). ORP1L mediated PI(4)P signaling at ER-lysosome-mitochondrion three-way contact contributes to mitochondrial division. Nat Commun. 12(1): 5354.
- Van Engelenburg, S. B. and Palmer, A. E. (2010). Imaging type-III secretion reveals dynamics and spatial segregation of Salmonella effectors. Nat Methods. 7(4): 325–330.
- Hammond, G. R., Machner, M. P. and Balla, T. (2014). A novel probe for phosphatidylinositol 4-phosphate reveals multiple pools beyond the Golgi. J Cell Biol. 205(1): 113–126.
- Varnai, P., Thyagarajan, B., Rohacs, T. and Balla, T. (2006). Rapidly inducible changes in phosphatidylinositol 4,5-bisphosphate levels influence multiple regulatory functions of the lipid in intact living cells. J Cell Biol. 175(3): 377–382.
- Kanai, F., Liu, H., Field, S. J., Akbary, H., Matsuo, T., Brown, G. E., Cantley, L. C. and Yaffe, M. B. (2001). The PX domains of p47phox and p40phox bind to lipid products of PI(3)K. Nat Cell Biol. 3(7): 675–678.
- Minin, A. A., Kulik, A. V., Gyoeva, F. K., Li, Y., Goshima, G. and Gelfand, V. I. (2006). Regulation of mitochondria distribution by RhoA and formins. J Cell Sci. 119(4): 659–670.
- Schneider, C. A., Rasband, W. S. and Eliceiri, K. W. (2012). NIH Image to ImageJ: 25 years of image analysis. Nat Methods. 9(7): 671–675.
- Schindelin, J., Arganda-Carreras, I., Frise, E., Kaynig, V., Longair, M., Pietzsch, T., Preibisch, S., Rueden, C., Saalfeld, S., Schmid, B., et al. (2012). Fiji: an open-source platform for biological-image analysis. Nat Methods. 9(7): 676–682.
Supplementary information
The following supporting information can be downloaded here:
- Figure S1. Import options in the Bio-Formats Import Options used in this protocol.
- Figure S2. Thresholding pipeline to make a mask of endolysosomal regions.
- Figure S3. Measuring the fluorescence intensity in the GAI- or FKBP-fused fluorescence channel within the mask of endolysosomal regions.
Article Information
Publication history
Received: May 25, 2024
Accepted: Aug 7, 2024
Available online: Sep 13, 2024
Published: Oct 5, 2024
Copyright
© 2024 The Author(s); This is an open access article under the CC BY-NC license (https://creativecommons.org/licenses/by-nc/4.0/).
How to cite
Readers should cite both the Bio-protocol article and the original research article where this protocol was used:
- Yap, W. S., Kim, P. K. and Boutry, M. (2024). Acutely Modifying Phosphatidylinositol Phosphates on Endolysosomes Using Chemically Inducible Dimerization Systems. Bio-protocol 14(19): e5078. DOI: 10.21769/BioProtoc.5078.
- Boutry, M., DiGiovanni, L. F., Demers, N., Fountain, A., Mamand, S., Botelho, R. J. and Kim, P. K. (2023). Arf1-PI4KIIIβ positive vesicles regulate PI(3)P signaling to facilitate lysosomal tubule fission. J Cell Biol. 222(9): e202205128.
Category
Cell Biology > Cell imaging > Live-cell imaging
Cell Biology > Cell imaging > Confocal microscopy
Cell Biology > Cell structure > Cell organelle
Do you have any questions about this protocol?
Post your question to gather feedback from the community. We will also invite the authors of this article to respond.