
- Submit a Protocol
- Receive Our Alerts
- EN

- Protocols

- Articles and Issues
- For Authors
- About
- Become a Reviewer

Endothelin-1-Induced Persistent Ischemia in a Chicken Embryo Model
(*contributed equally to this work) Published: Vol 14, Iss 17, Sep 5, 2024 DOI: 10.21769/BioProtoc.5061 Views: 527
Reviewed by: Xiaokang WuIbrahim AlabriAnonymous reviewer(s)

Protocol Collections
Comprehensive collections of detailed, peer-reviewed protocols focusing on specific topics


Related protocols
Abstract
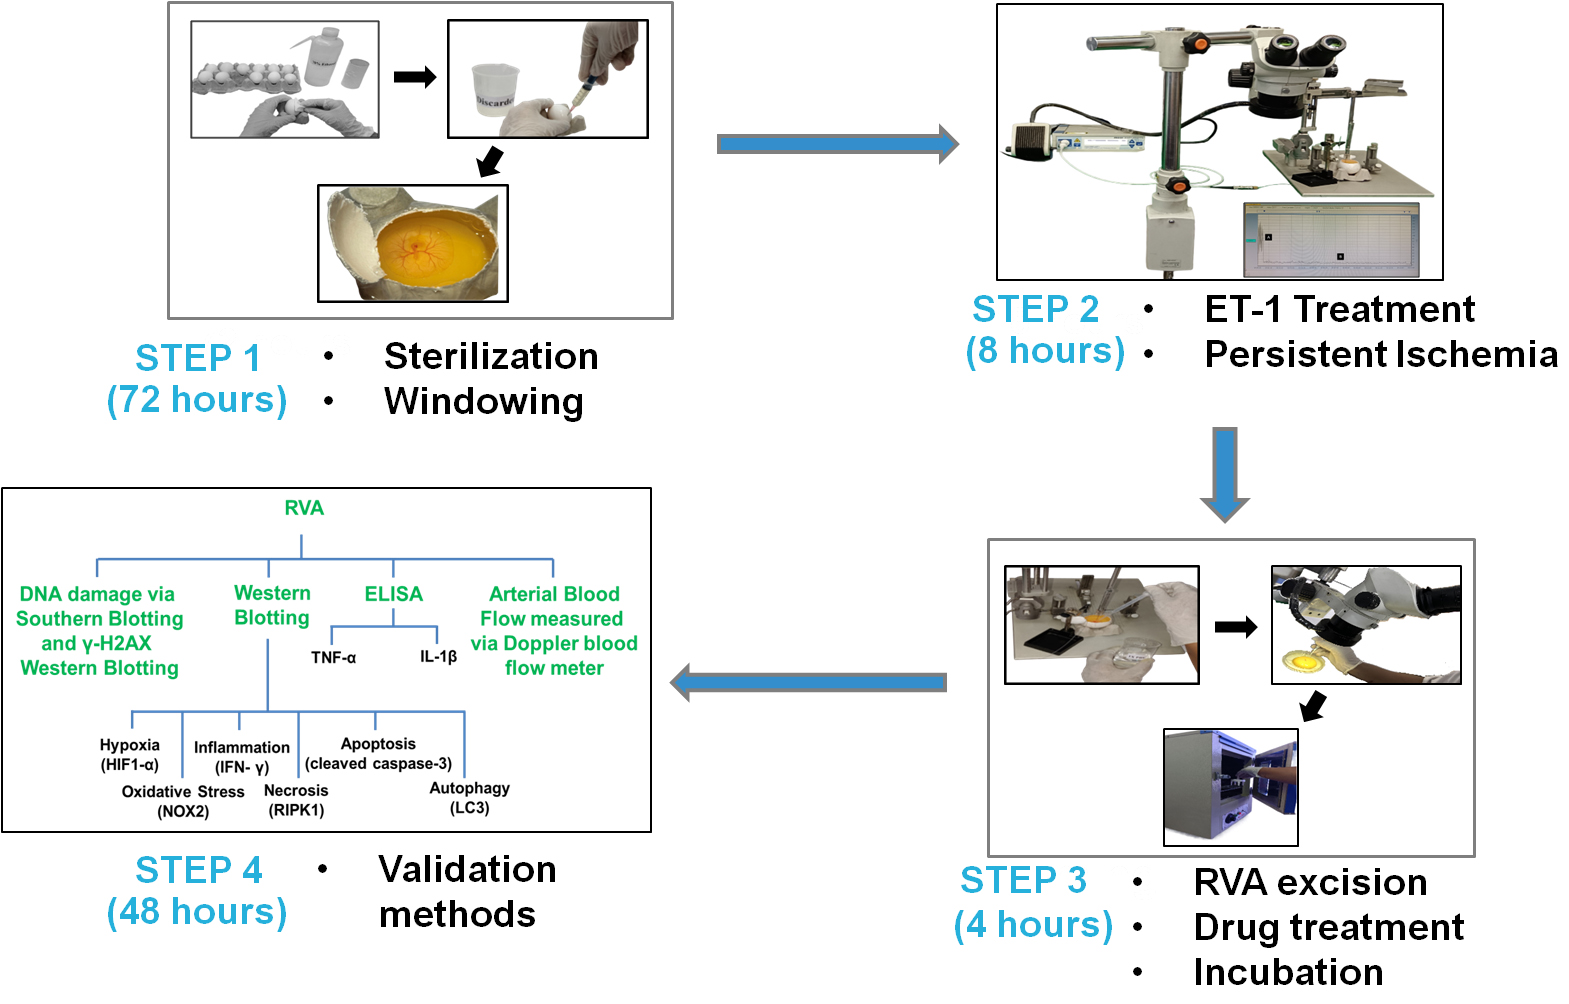
Current ischemic models strive to replicate ischemia-mediated injury. However, they face challenges such as inadequate reproducibility, difficulties in translating rodent findings to humans, and ethical, financial, and practical constraints that limit the accuracy of extensive research. This study introduces a novel approach to inducing persistent ischemia in 3-day-old chicken embryos using endothelin-1. The protocol targets the right vitelline arteries, validated with Doppler blood flow imaging and molecular biology experiments. This innovative approach facilitates the exploration of oxidative stress, inflammatory responses, cellular death, and potential drug screening suitability utilizing a 3-day-old chicken embryo.
Key features
• This model enables the evaluation and investigation of the pathology related to persistent ischemia.
• This model allows for the assessment of parameters like oxidative stress, inflammation, and cellular death.
• This model enables quantification of molecular changes at the nucleic acid and protein levels.
• This model allows for the efficient screening of drugs and their targets.
Keywords: IschemiaGraphical overview
Background
Ischemia, derived from the Greek words "to restrain" and "blood," refers to a critical situation in which insufficient blood supply to an organ or tissue causes nutritional, oxygen, and waste depletion, resulting in cellular and physiological problems [1,2]. It arises from various factors, including vascular obstruction, low blood pressure, or decreased circulation, and significantly contributes to multiple disorders [3–6].
Endothelin-1 (ET-1) is undeniably a powerful vasoactive peptide that is well-known for its capacity to cause blood vessel constriction, which in turn leads to a reduction in the amount of blood flow [7–9]. ET-1's vasoconstrictive properties make it useful in experimental studies to induce ischemia [10–12], helping to explore physiological and pathological responses. While ET-1-induced ischemia is commonly used in in vivo research, it has never been examined in an in ovo model. This study is the first to investigate its effect in ovo.
Doppler blood flow imaging, a crucial tool in ischemic research [13,14], assesses reduced blood flow in various organs like the heart [15], brain [16], and limbs [17]. For instance, in cardiac ischemia, it evaluates coronary artery blood flow [18,19], while in cerebral ischemia, it detects brain artery blood flow changes [20,21]. Furthermore, it detects abnormal blood flow patterns in the context of peripheral vascular and renal ischemia [22] to identify stenosis [23]. Given the utility of this instrument, we incorporated it into our experiment to validate our ischemic model. Additionally, we employed Southern blotting, western blotting, and ELISA for further validation of the model.
Materials and reagents
Biological materials
Fertilized White Leghorn chicken, provided by the Central Avian Research Institute in Bareilly, Uttar Pradesh, India, and reared in our on-campus poultry farm
Reagents
γ-H2AX, 1:500 (Fine Test, catalog number: FNab10441)
HIF-1α, 1:1,000 (Novus Biological, catalog number: NB100-449)
NOX2, 1:500 (Fine Test, catalog number: FNab05804)
IFN-γ, 1:1,000 (Abcam, catalog number: ab133566)
RIPK1, 1:500 (Cloud-Clone Corp., catalog number: MAE640Hu21)
Cleaved caspase-3, 1:500 (ImmunoTag, catalog number: ITT07022)
LC3 l/ll, 1:1,000 (Cell Signaling Technology, catalog number: 4108S)
GAPDH, 1:1,000 (Cloud-Clone Corp.,catalog number: MAB932Hu21)
Anti-mouse IgG, 1:3,000 (Cell Signaling Technology, catalog number: 7076S)
Anti-rabbit IgG, 1:10,000 (Jackson Immuno Research Laboratories, catalog number: 711-035-152)
ELISA Kit, TNF-α (Fine Test, catalog number: EH0302)
ELISA Kit, IL-1β (Fine Test, catalog number: ECH0040)
SDS-PAGE (Invitrogen, catalog number: A25977)
Endothelin-1 (ET-1), 1 pM (Sigma-Aldrich, catalog number: E7764)
N-Acetyl-L-Cysteine (NAC), 100 µM (Sigma-Aldrich, catalog number: A7250)
Solutions
70% ethanol (see Recipes)
1× phosphate buffer saline (PBS) (see Recipes)
Ringer’s solution (see Recipes)
ET-1 (see Recipes)
N-Acetyl-L-Cysteine (NAC) solution (see Recipes)
Recipes
70% ethanol (100 mL)
Combine 30 mL of sterile water with 70 mL of 200 proof/LR grade ethanol to make a final volume of 100 mL.
Reagent Final concentration Amount Ethanol n/a 70 mL Distilled Water n/a 30 mL Total n/a 100 mL 1× phosphate buffer saline (PBS) (100 mL)
To make 100 mL of 1× PBS, combine all reagents with 70 mL of distilled water. Completely dissolve the reagents and adjust to the final volume. Autoclave the solution for 15 min at 121 °C. If needed, adjust the pH to 7.4 by adding a few drops of 0.1 N HCl or 0.1 N NaOH. Divide the solution into 10 mL aliquots and store them at room temperature (RT) in sterile 15 mL centrifuge tubes. Store at RT for up to 12 months.
Reagent Final concentration Amount Na2HPO4·7H2O 5.37 mM 0.144 g NaCl 136.8 mM 0.8 g KCl 26.8 mM 0.2 g KH2PO4 14.6 mM 0.2 g H2O n/a 100 mL Total n/a 100 mL Ringer’s solution (100 mL)
Mix NaCl, CaCl2, and KCl in 70 mL of sterile distilled water. Adjust the pH to 7.4. Let it dissolve completely and autoclave. Then, filter through a 0.22 µm filter and aliquot into single-use amounts (approximately 10 mL). Store at 4 °C for up to 1–2 months.
Reagent Final concentration Amount NaCl 123 mM 0.72 g CaCl2 1.53 mM 0.017 g KCl 4.96 mM 0.037 g H2O n/a 100 mL pH n/a 7.4 Total n/a 100 mL ET-1
To make a 1 mM stock solution, dissolve 2.49 mg of ET-1 in 1 mL of Milli-Q water. Take 1 µL of the 1 mM ET-1 solution and mix it with 999 µL of Milli-Q water to make a 1 µM concentration solution. To achieve a 1 nM concentration, transfer 1 µL of the 1 µM solution into 999 µL of Milli-Q water. Lastly, dissolve 1 µL of the 1 nM solution in 999 µL of Milli-Q water to achieve a final concentration of 1 pM.
Reagent Final concentration Amount ET-1 1 mM 2.49 mg Milli-Q n/a 1 mL Total 1 mM 1 mL N-Acetyl-L-Cysteine (NAC) solution
Dissolve 1.63 mg of NAC in 1 mL of Ringer's solution to make a 10 mM stock concentration. Titrate the stock solution to 1 mM by adding 100 µL of the 10 mM NAC solution to 900 µL of Ringer's solution. Further dilute the resulting 1 mM concentration to 100 µM by combining 100 µL of the 1 mM NAC solution with 900 µL of Ringer's solution.
Reagent Final concentration Amount NAC 10 mM 1.63 mg Ringer's solution n/a 1 mL Total n/a 1 mL
Laboratory supplies
Egg incubator (Gentek, catalog number: GL-100)
Pointed sharp curved scissors (Stoelting, catalog number: 52132-11)
Hamilton glass syringe (Hamilton, catalog number: 80087)
Needle 26G–26 × 1/2 (0.45 mm × 13 mm) (Dispovan, catalog number: 30722D
Needle 18G–18G × 1.5 (1.25 mm × 38 mm) (Romsons, catalog number: 13990)
Syringe (5 mL) (Dispovan, catalog number: 653054NE1)
Tube stand (1.5 mL) (TARSONS)
Ocular forceps (Stoelting, catalog number: 52100-52)
Ocular iris (Stoelting, catalog number: 52130-00)
Packaging tape (Sunrise)
Autoclaved tissue roll (Texam Technologies Pvt. Ltd.)
Overhead projection pens (OHP) Marker (Camlin)
Autoclaved bag (TARSONS, catalog number: 550022)
Petri dish (TARSONS, catalog number: 460050)
Egg rack
Sharp waste container (TARSONS, catalog number: 882210)
Centrifuge tube (1.5 mL) (TARSONS, catalog number: 500010X)
Beaker (100 mL) (GLASSCO, catalog number: 23.205.03)
Pasteur pipette (3 mL) (TARSONS, catalog number: 940050)
Equipment
New standardTM stereotaxic rat and mouse surgery apparatus (Stoelting, catalog number: 51500)
Laser Doppler blood flow meter (Moor instruments, catalog number: moorVMS-LDF1)
Stereo zoom microscope (Olympus, catalog number: SZ2-STU3)
Software and datasets
SPSS Statistics Software IBM 29.0
moorVMS-LDF1
GraphPad Prism 5 Software
Procedure
Inducing persistent ischemia
Day 1:
Using tissue paper wipes, clean the 0-day eggs with 70% ethanol. To clean, spray 1 mL of 70% ethanol onto the tissue wipe and then use the dampened wipe to clean the egg (Figures 1 and 2) (see General notes 1, 2).
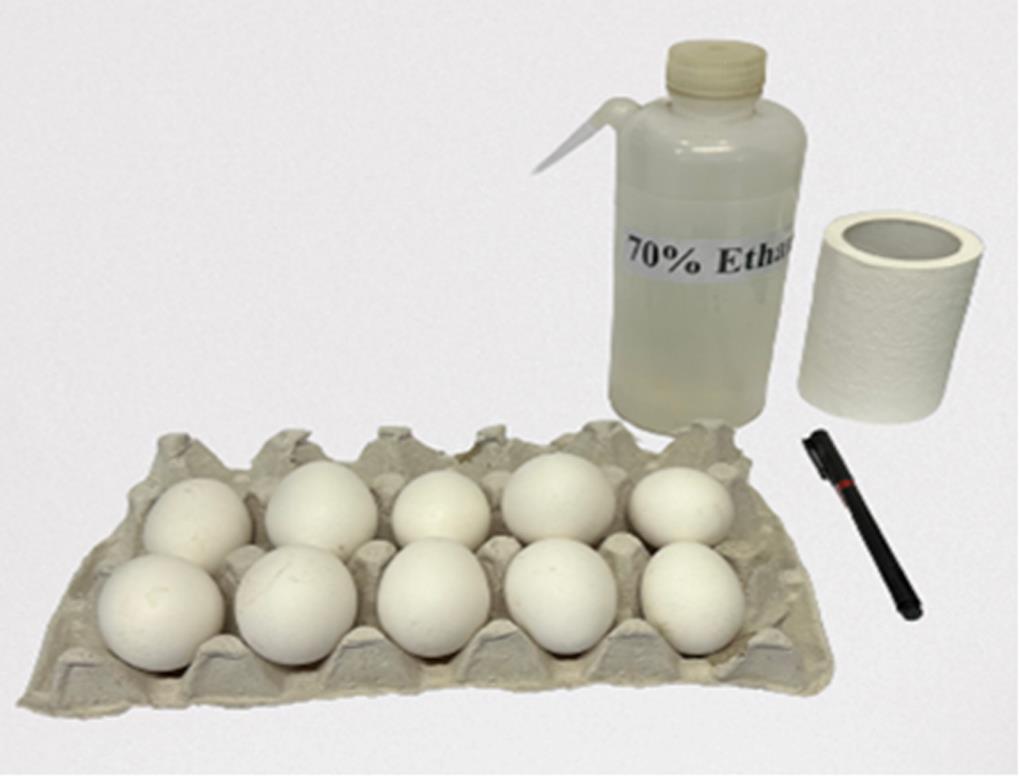
Figure 1. Arrangement for the sterilization process. First, eggs were placed in the egg rack for the sterilization process. A 70% ethanol solution was used to disinfect the eggshell surfaces. A marker was used for labeling the eggs.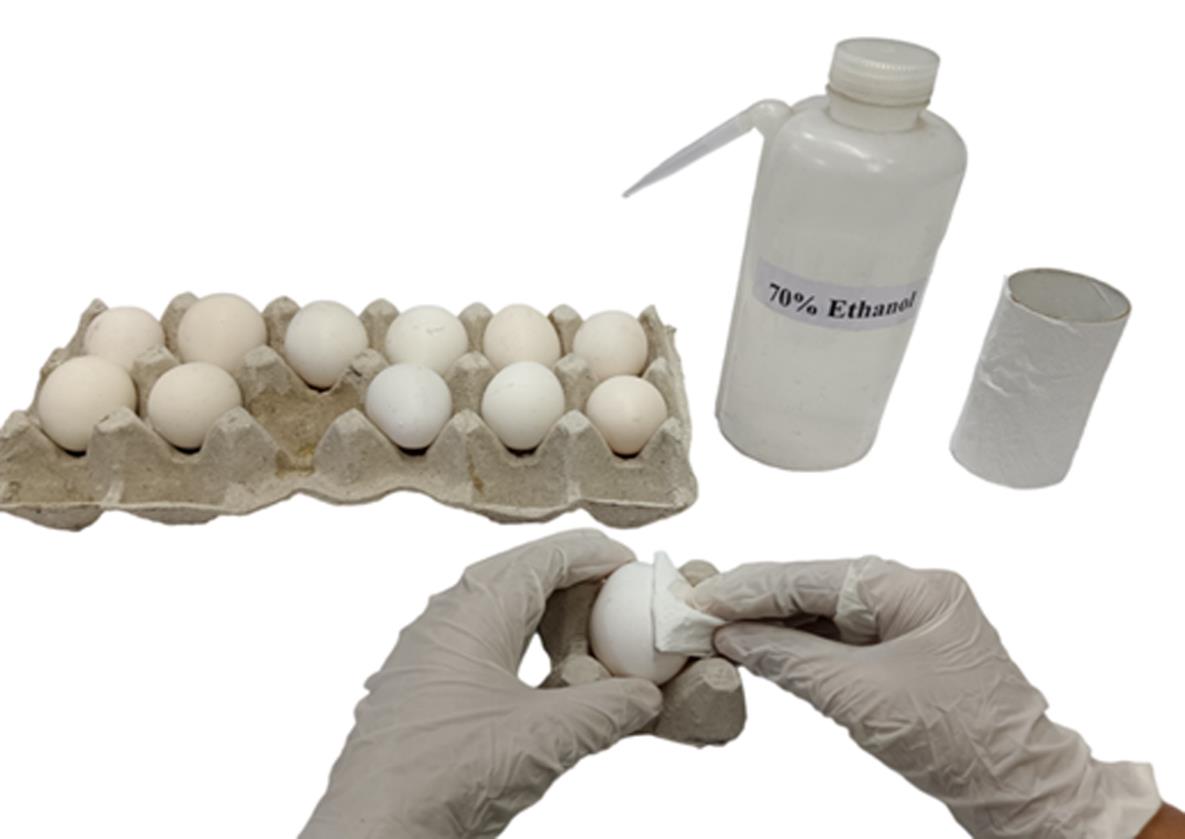
Figure 2. Sterilizing 0-day eggs using 70% ethanol for disinfection. This figure illustrates the process of sterilizing 0-day eggs using 70% ethanol for disinfection. The eggs were arranged in a rack, and 70% ethanol was used to disinfect eggshell surfaces. Eggs were wiped with tissue soaked in 70% ethanol, ensuring that the surface was adequately disinfected.Use an OHP marker to write the current date and ID number on each egg (Figure 3) (see General notes 3, 4).
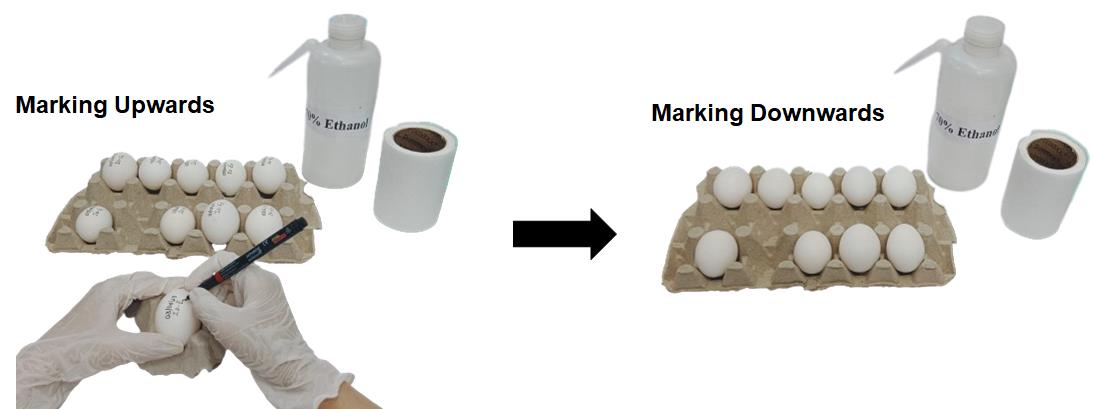
Figure 3. Marking eggs with the date. The left-side figure depicts the labeling of eggs on their upper side using a marker. The right-side figure shows the eggs with markings facing downward in the egg rack. This method helps to ensure that the marks remain legible and protected during handling and storage.Place the egg in the egg incubator with the temperature and humidity maintained at 37 ± 1 °C and 60%–65%, respectively, for 24 h (Figure 4) (see General note 5).
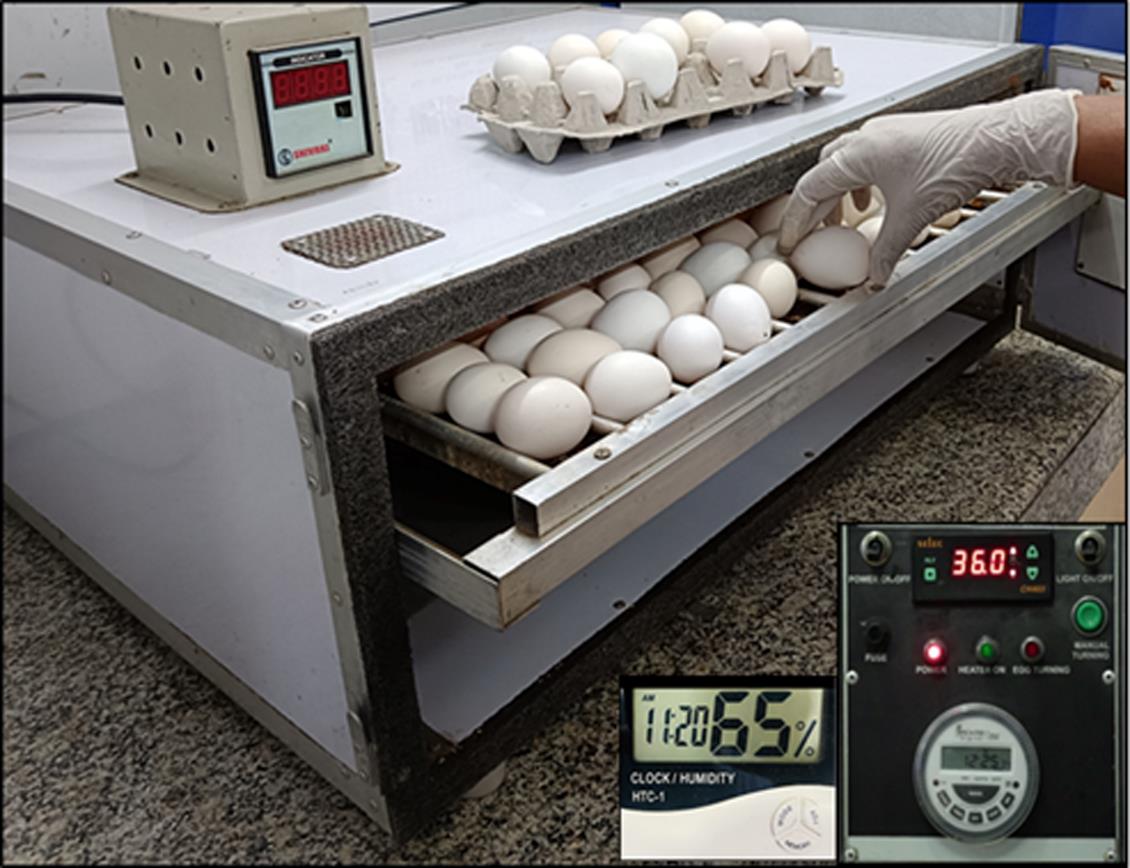
Figure 4. Storing a 0-day egg in a 37 ± 1 °C egg incubator. This image shows an egg incubation setup. The inset images highlight the control panel and humidity meter. The control panel indicates temperature and humidity settings. The setup demonstrates the precision and care required while placing the eggs in the incubator to ensure successful hatching.Day 2:
Apply a small piece of packaging tape to the egg's edge (approximately 10 mm in length and width) (Figure 5, 6A, 6B).
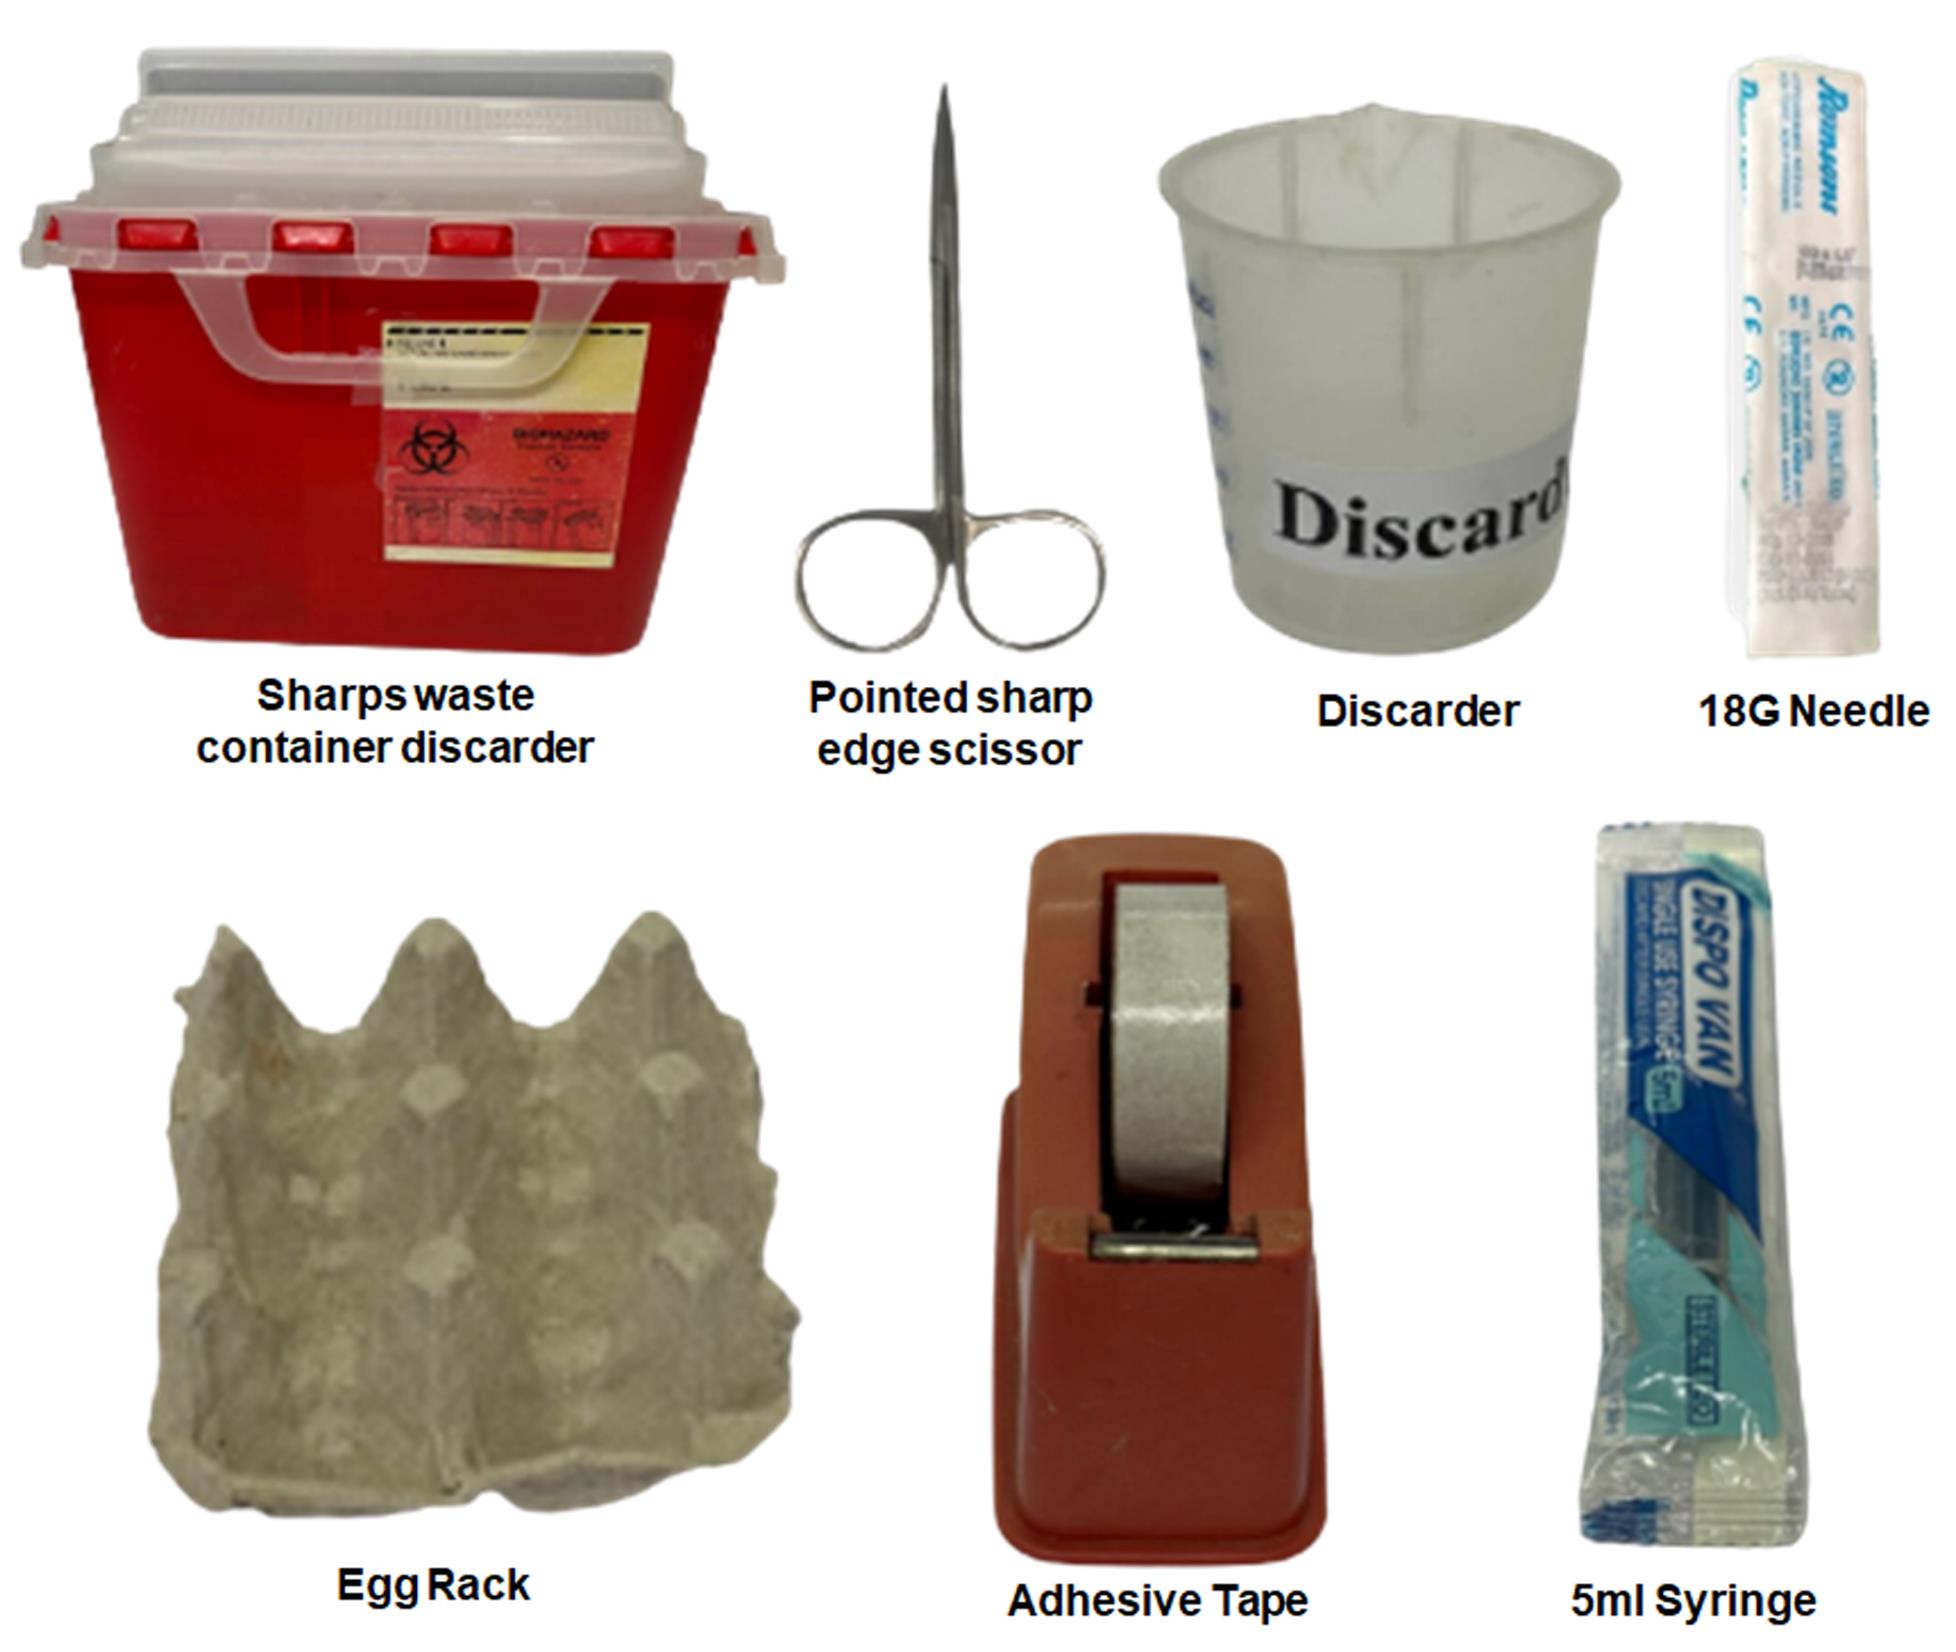
Figure 5. Requirements for albumin removal. This image depicts the essential tools and equipment required for the albumin removal process. Included in the setup are: a sharps waste container for the safe disposal of sharp instruments, a pointed sharp edge scissors used for precise cutting during the procedure, and a discarder for disposing of non-sharp waste. Additionally, we use an 18G needle to pierce the egg and facilitate albumin extraction, an egg rack to secure the egg during the process, packaging tape to tape the egg, and a 5 mL syringe to accurately measure and extract the albumin. These tools are critical to ensure safety and efficiency in the albumin removal process.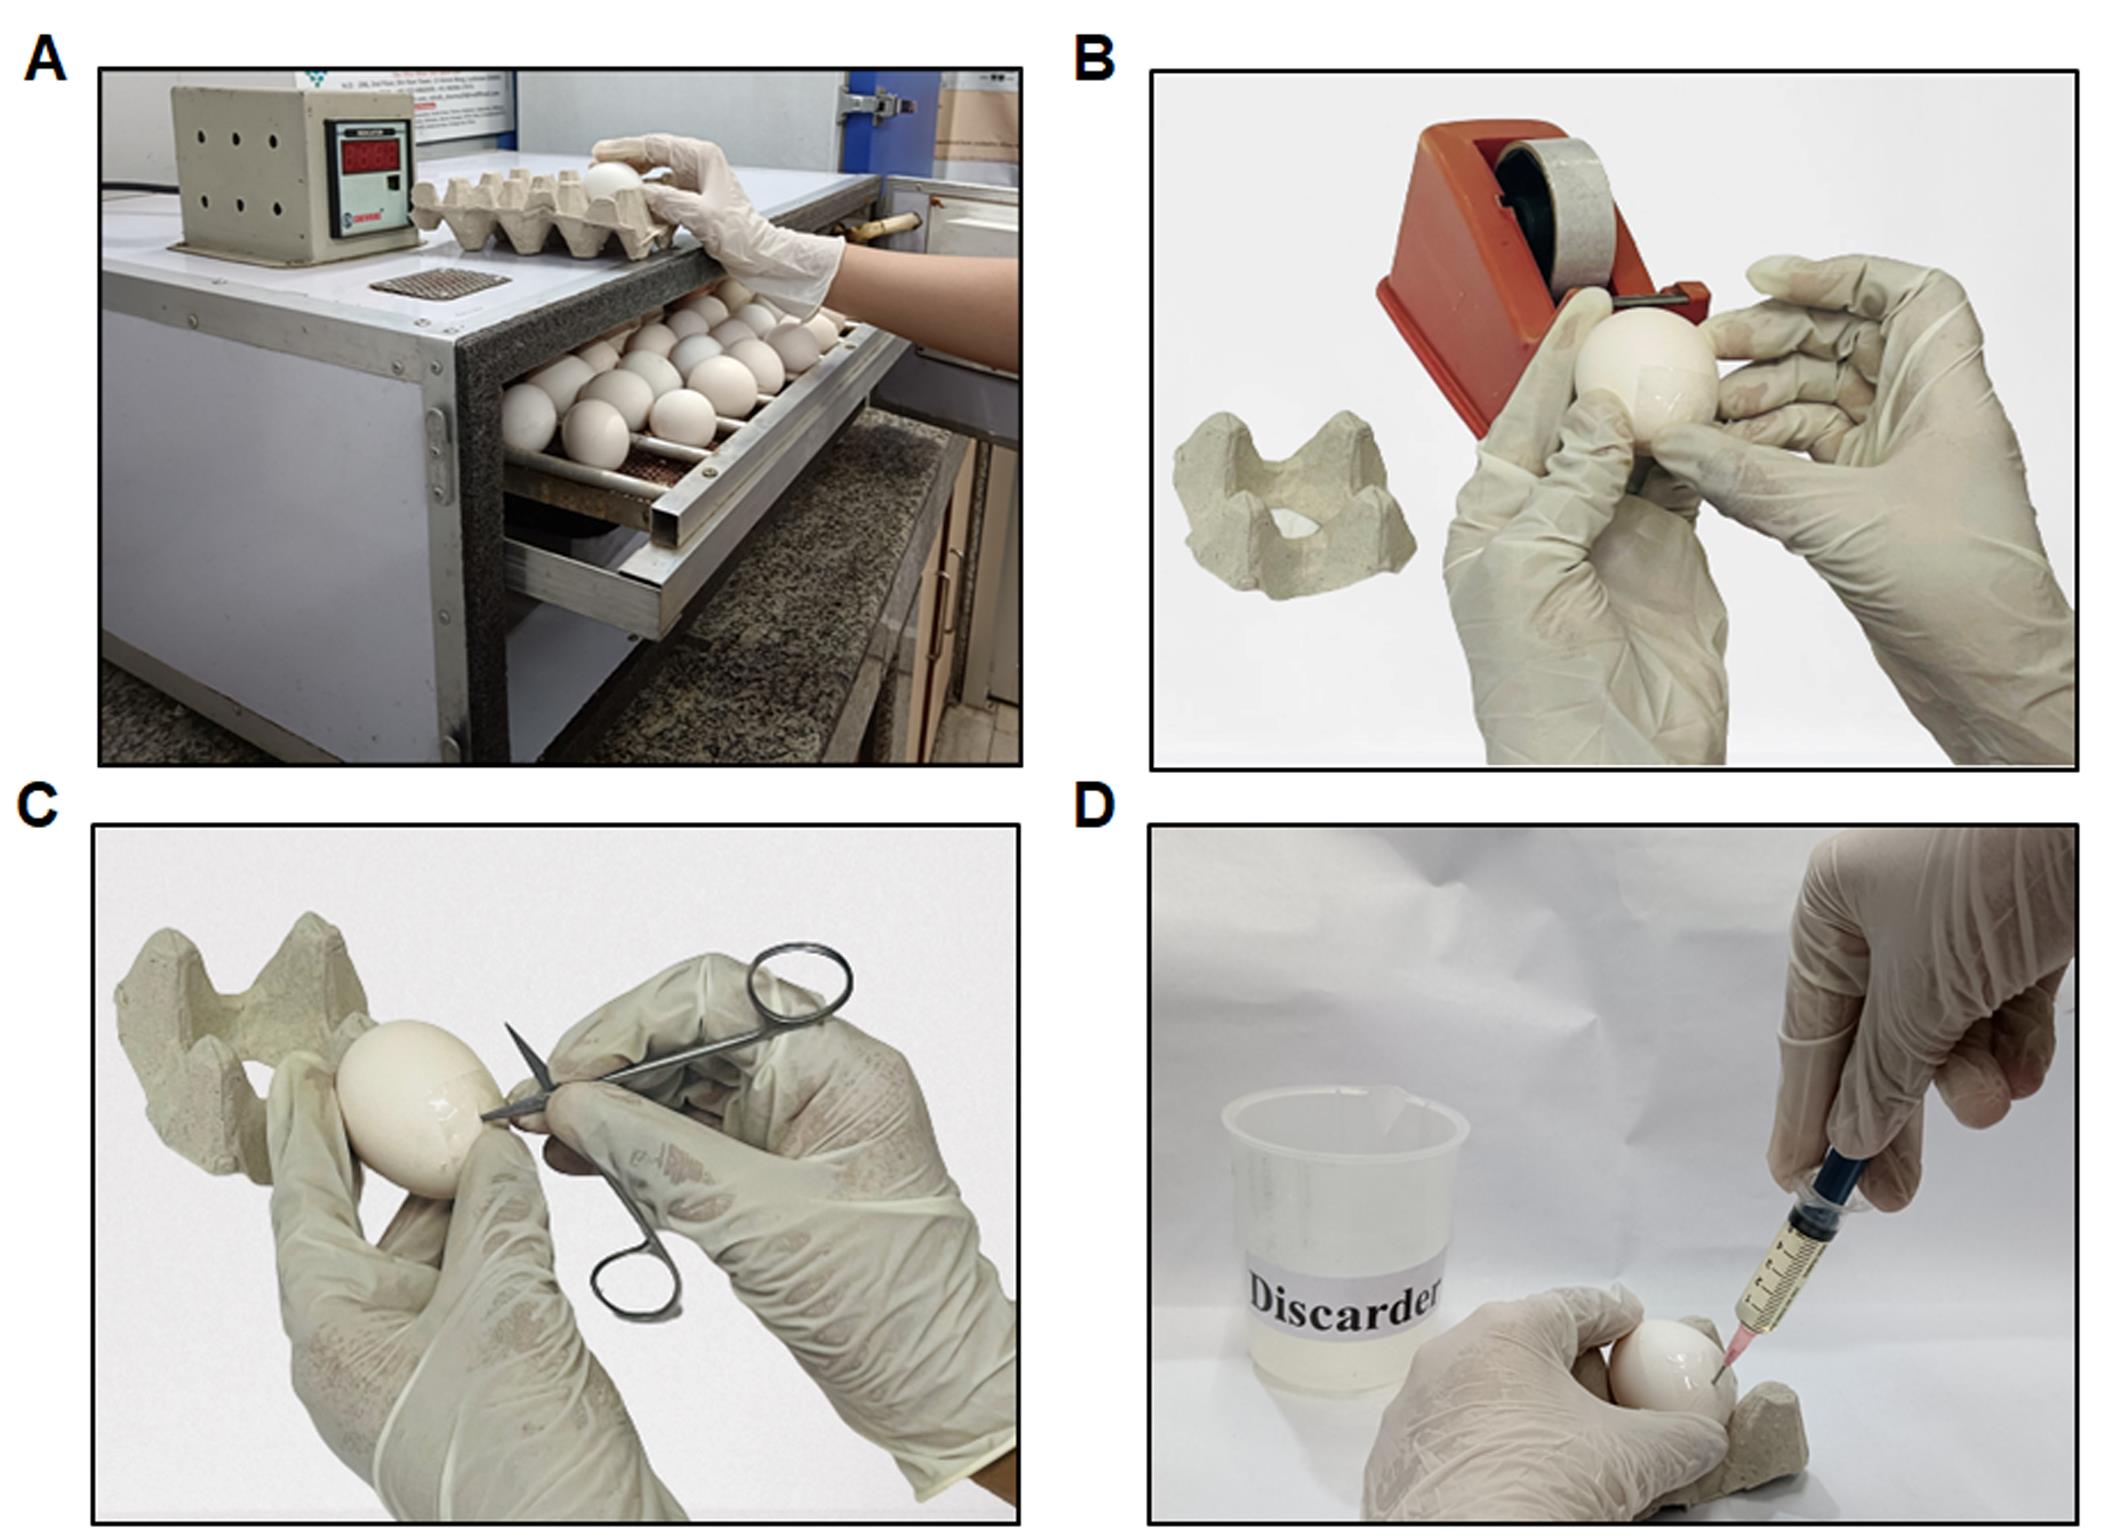
Figure 6. Steps in layering (A–D). (A) Retrieving eggs from the egg incubator set at 37 ± 1 °C to remove the albumin. (B) An illustration of packaging tape applied to the eggshell for albumin removal. (C) Demonstrating the creation of a small hole at the eggshell's edge using pointed scissors. (D) Depiction of the removal of the thin albumin layer from the egg.Using pointed, sharp, curved scissors, cut a small hole in the eggshell's edge exactly where the packaging tape is located (Figure 6C).
Insert a 5 mL syringe at a 60–70° angle (see General note 6).
Slowly withdraw 5–6 mL of albumin by inserting the needle inside the eggshell and pulling up the required thin albumin (Figure 6D).
After albumin removal, dispose of the syringe in the syringe discarder (see General notes 7–9).
After removing the albumin, cover the needle-piercing area with packaging tape.
Incubate the eggs for 48 h at 37 ± 1 °C in the egg incubator (see General note 10).
Day 3:
After 72 h of incubation, the egg should be removed from the 37 ± 1 °C incubator, and the windowing procedure should be initiated.
Place transparent packaging tape on one side of the eggshell (Figure 7) (see General note 11).
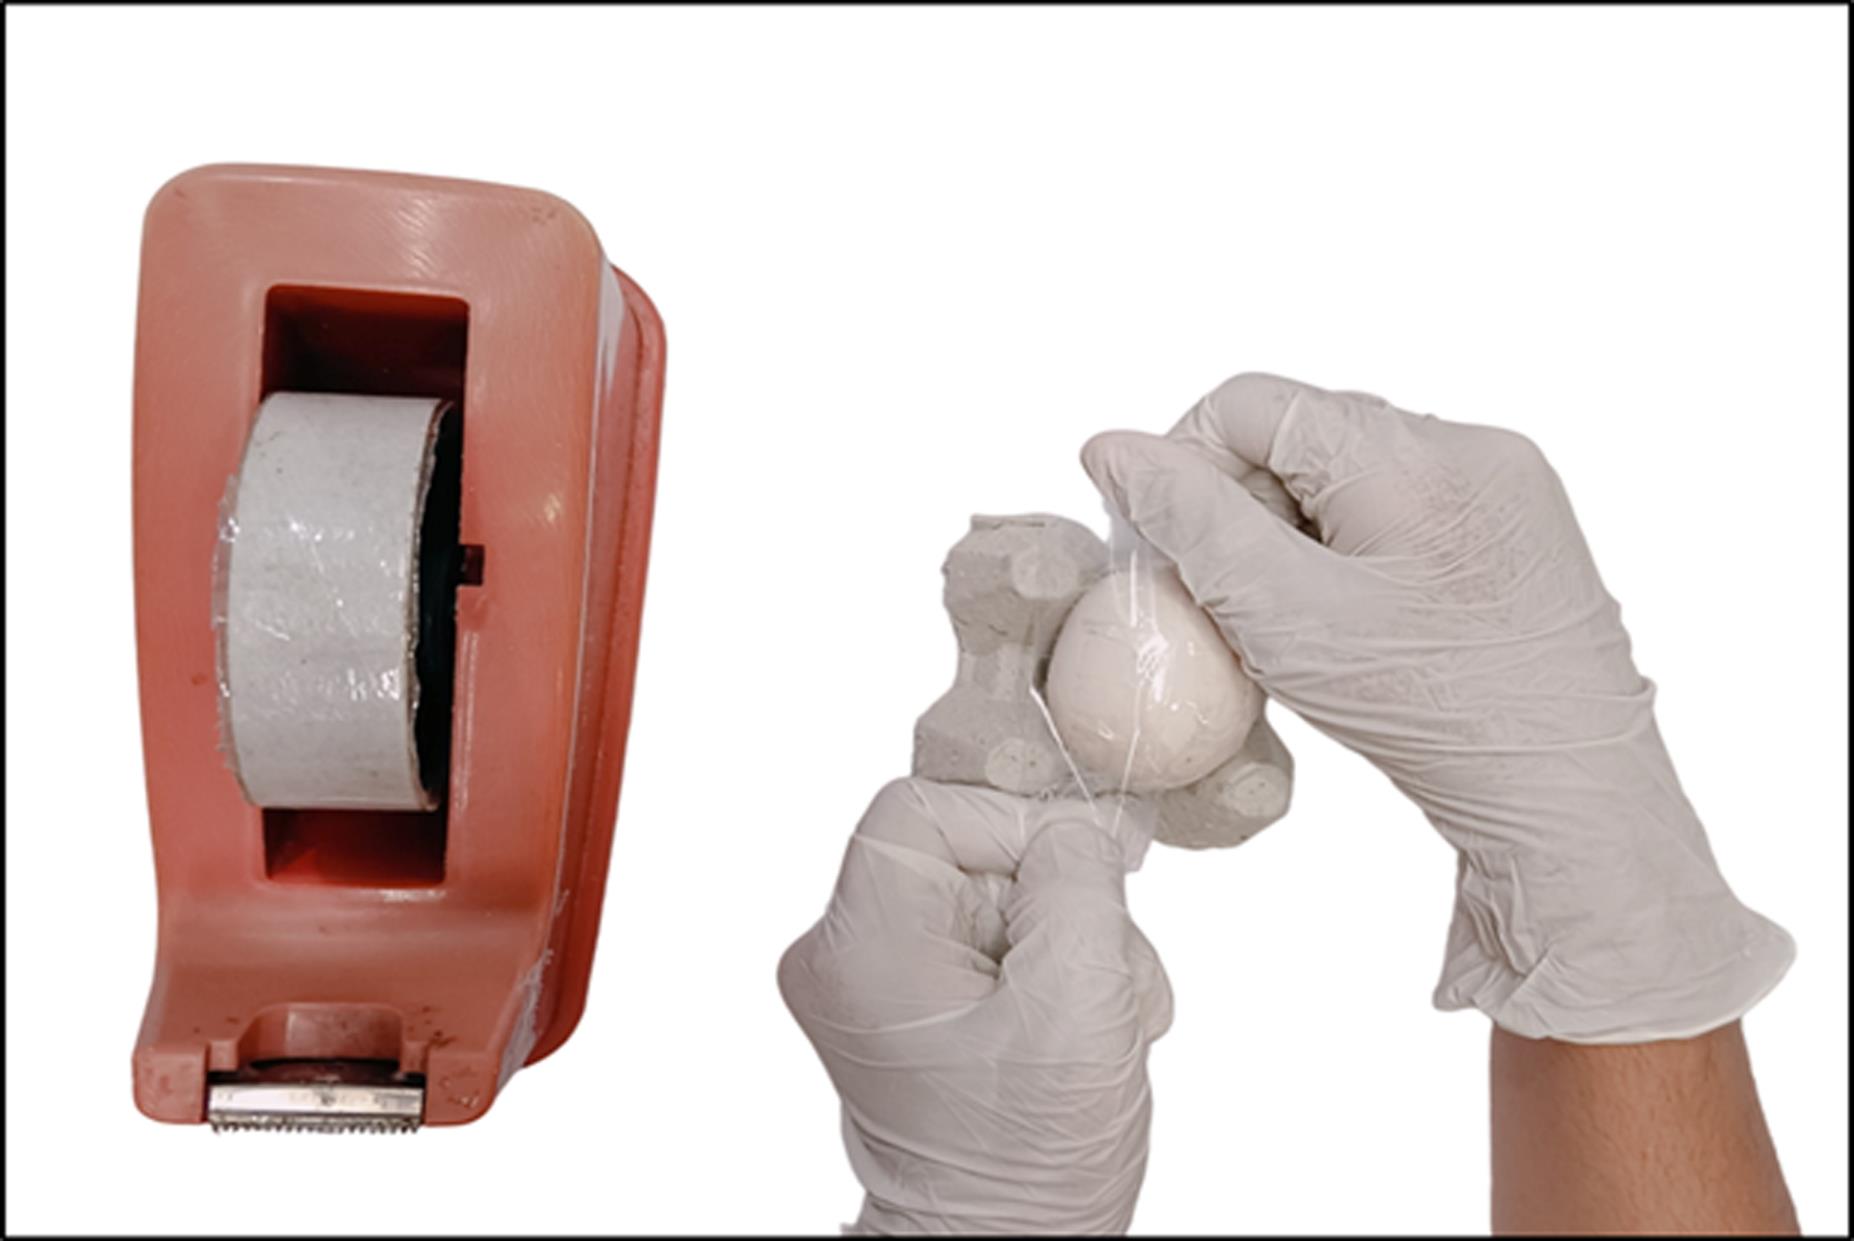
Figure 7. Using packaging tape before creating the window. The depicted figure illustrates the application of transparent packaging or packaging tape onto the eggshell.Use pointed, sharp, curved scissors to make a small hole in the eggshell at the desired windowing site (Figure 8A); then, carefully cut a circular opening.
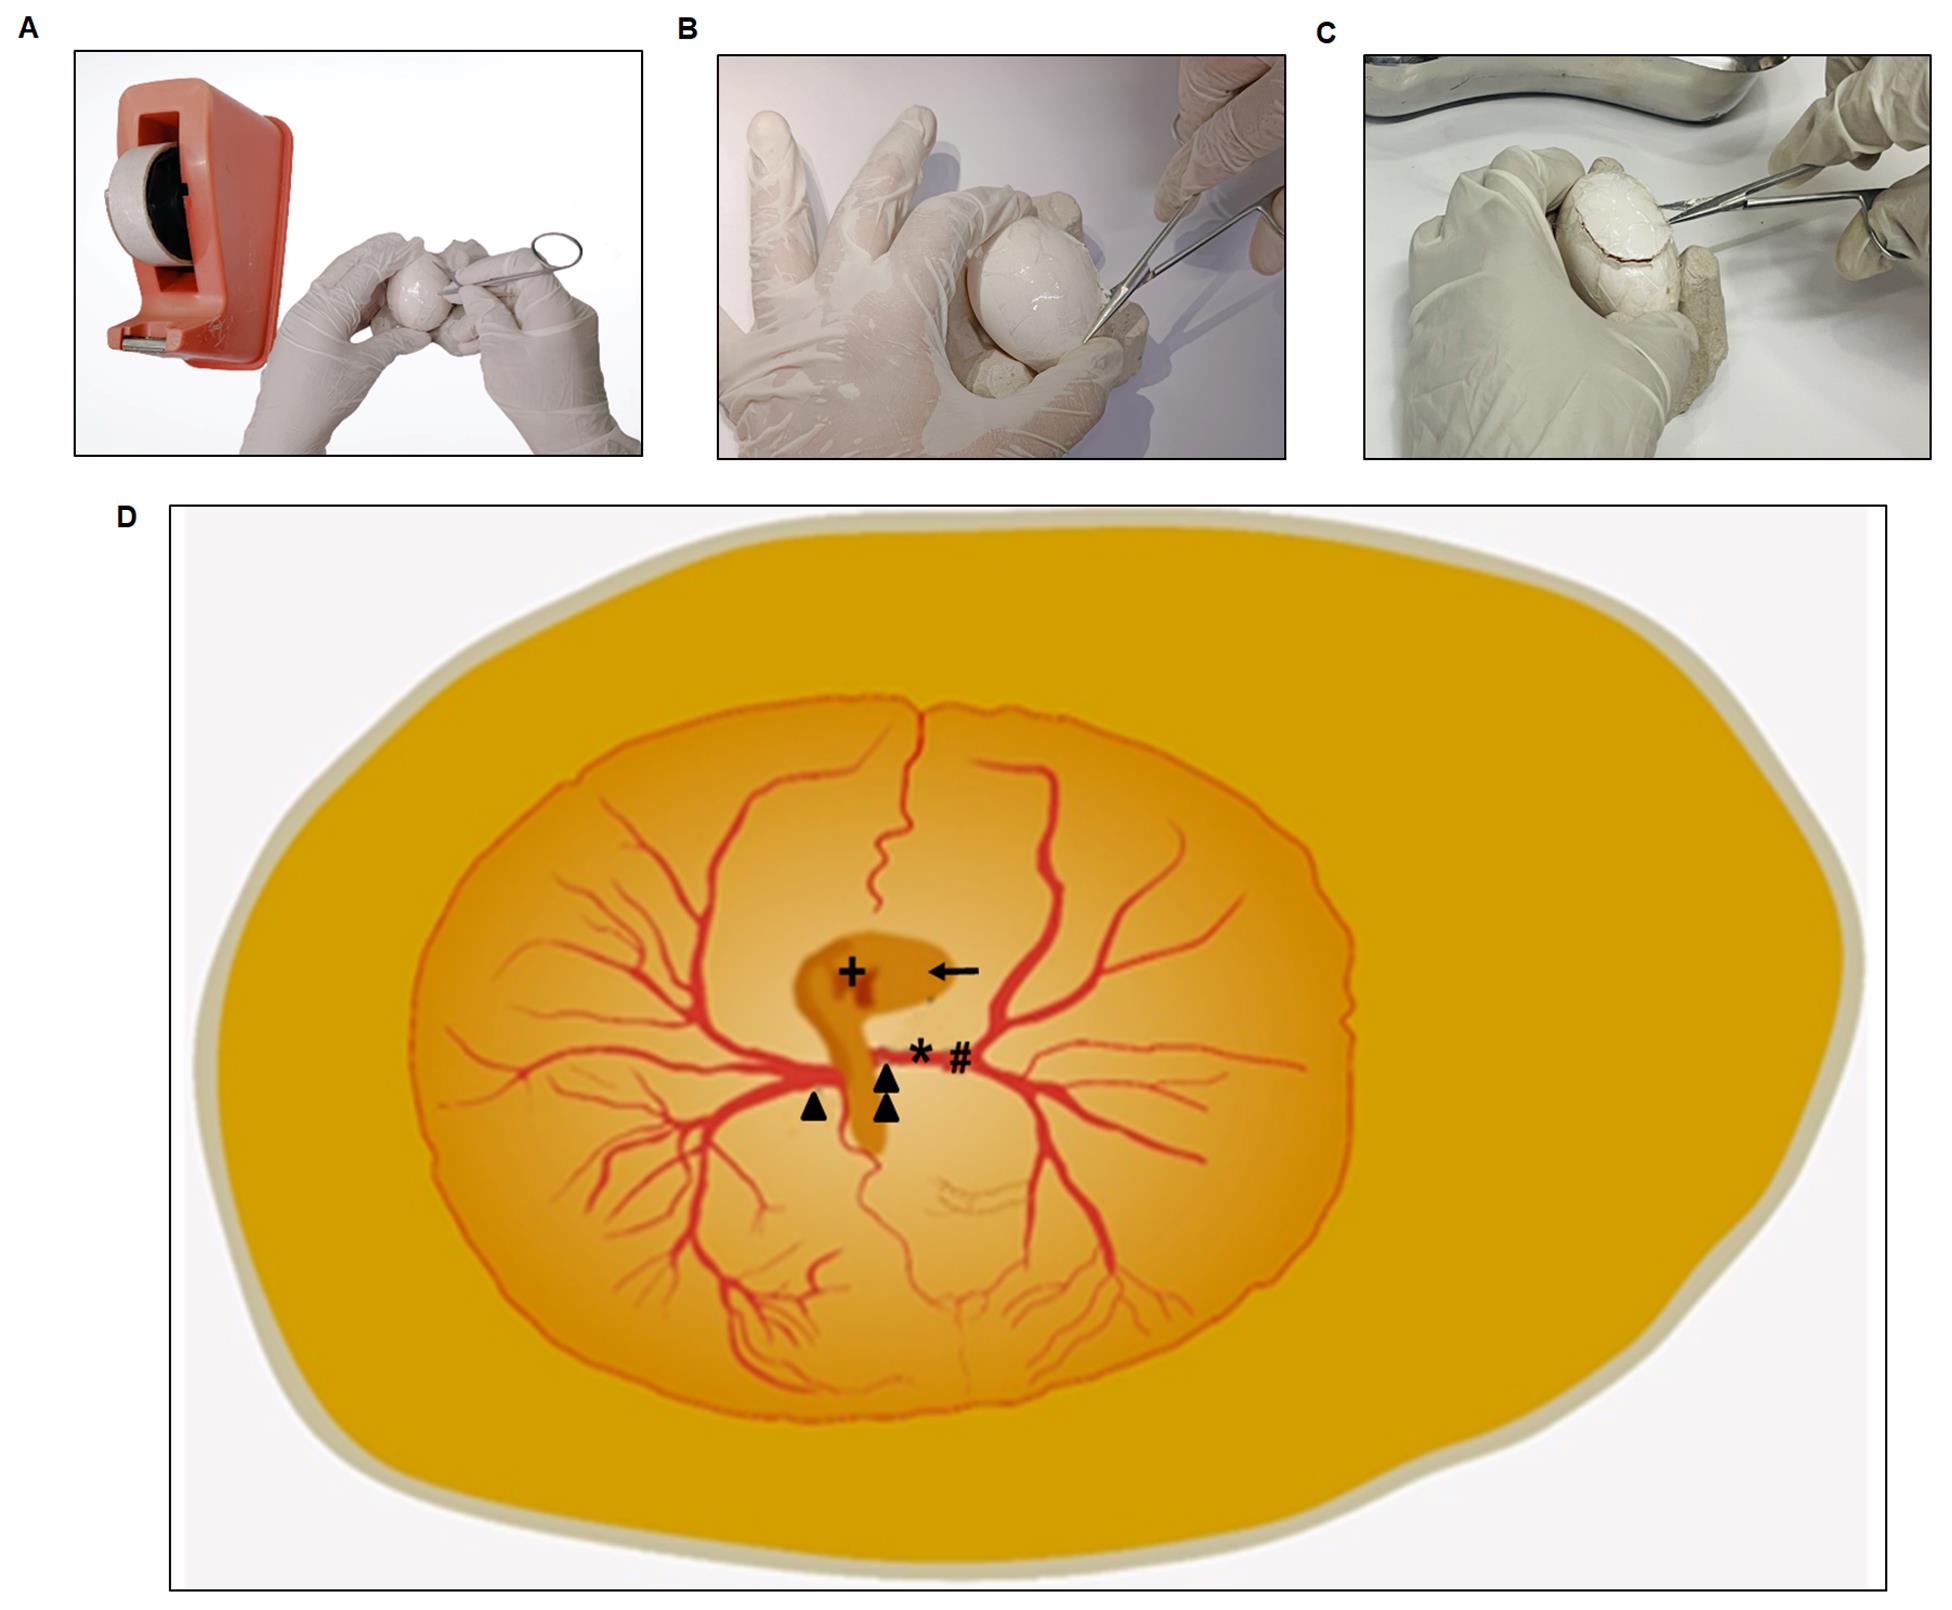
Figure 8. Windowing procedure steps. Before beginning the windowing operation, make a hole in the middle of the eggshell on the packaging tape region (A). Remove the eggshells in a spherical shape, ensuring one end remains attached to the shell (B and C). (D) represents an enlarged image of an egg. Take note of the formation of well-organized vitelline arteries ( ) Double-arrow represents the right vitelline artery; (▲) arrowhead represents the left vitelline artery; (*) star represents the site of ischemia; (#) hash represents the placement of the Doppler blood flow meter probe; (+) plus represents the heart; (←) arrow represents the eyeball (D).
Cut an oval-shaped window. This approach is generally known as "windowing" (Figures 8B and C).
Next, locate the right vitelline artery (RVA) using a stereo zoom surgical microscope (see General notes 12–16).
Just above the RVA, place the Doppler flow meter's probe. The probe should be 5 ± 1 mm away from the vasoconstriction area, i.e., toward the distal end of the RVA (Figure 9).
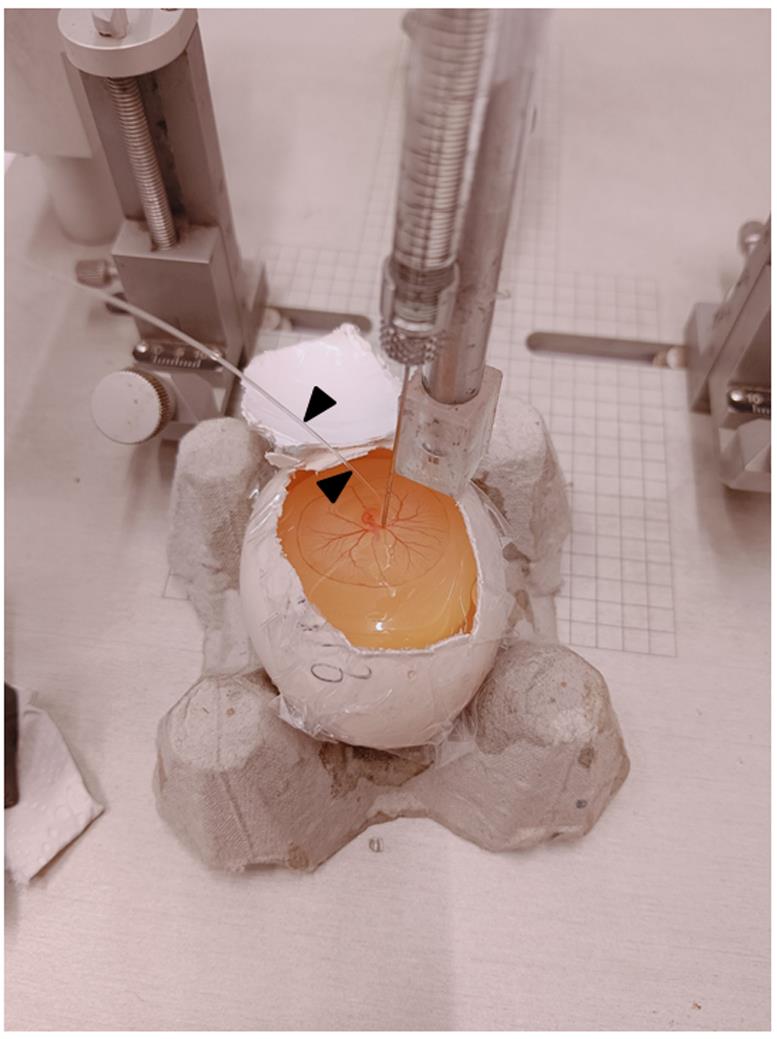
Figure 9. A typical image during ischemia. The figure depicts a Hamilton’s syringe attached to the stereotaxic setup for the controlled release of ET-1 onto the RVA. Black arrowheads indicate the probe.Once the Doppler probe is fixed to the RVA through the probe holding stand, make sure that the probe wire transfers the laser ray directly onto the RVA. At this point, the Doppler flux readings display the blood flow readings (this is the phase of normoxia).
Next, treat the RVA with 1 µL of ET-1 at a concentration of 1 pM (diluted in Milli-Q, as described in Recipe 4) with the help of a Hamilton syringe (ET-1 was administered at 0 min only once over a period of 8 h) attached to a New standardTM stereotaxic rat and mouse apparatus directly onto the RVA, as shown in Figures 10 and 11A and B. In summary, place the egg within the egg holder and position it directly below the Hamilton syringe, attached to the stereotaxic arm through the packaging tape. The stereotaxic arm allows for unrestricted movement in both horizontal and vertical directions. To administer the ET-1, slowly lower the tip of the Hamilton syringe approximately 2 mm above the intended position of the RVA, and then gradually release 1 µL of ET-1 from the syringe (the site of ET-1 release should be considered the point of occlusion) (see General notes 17–23).
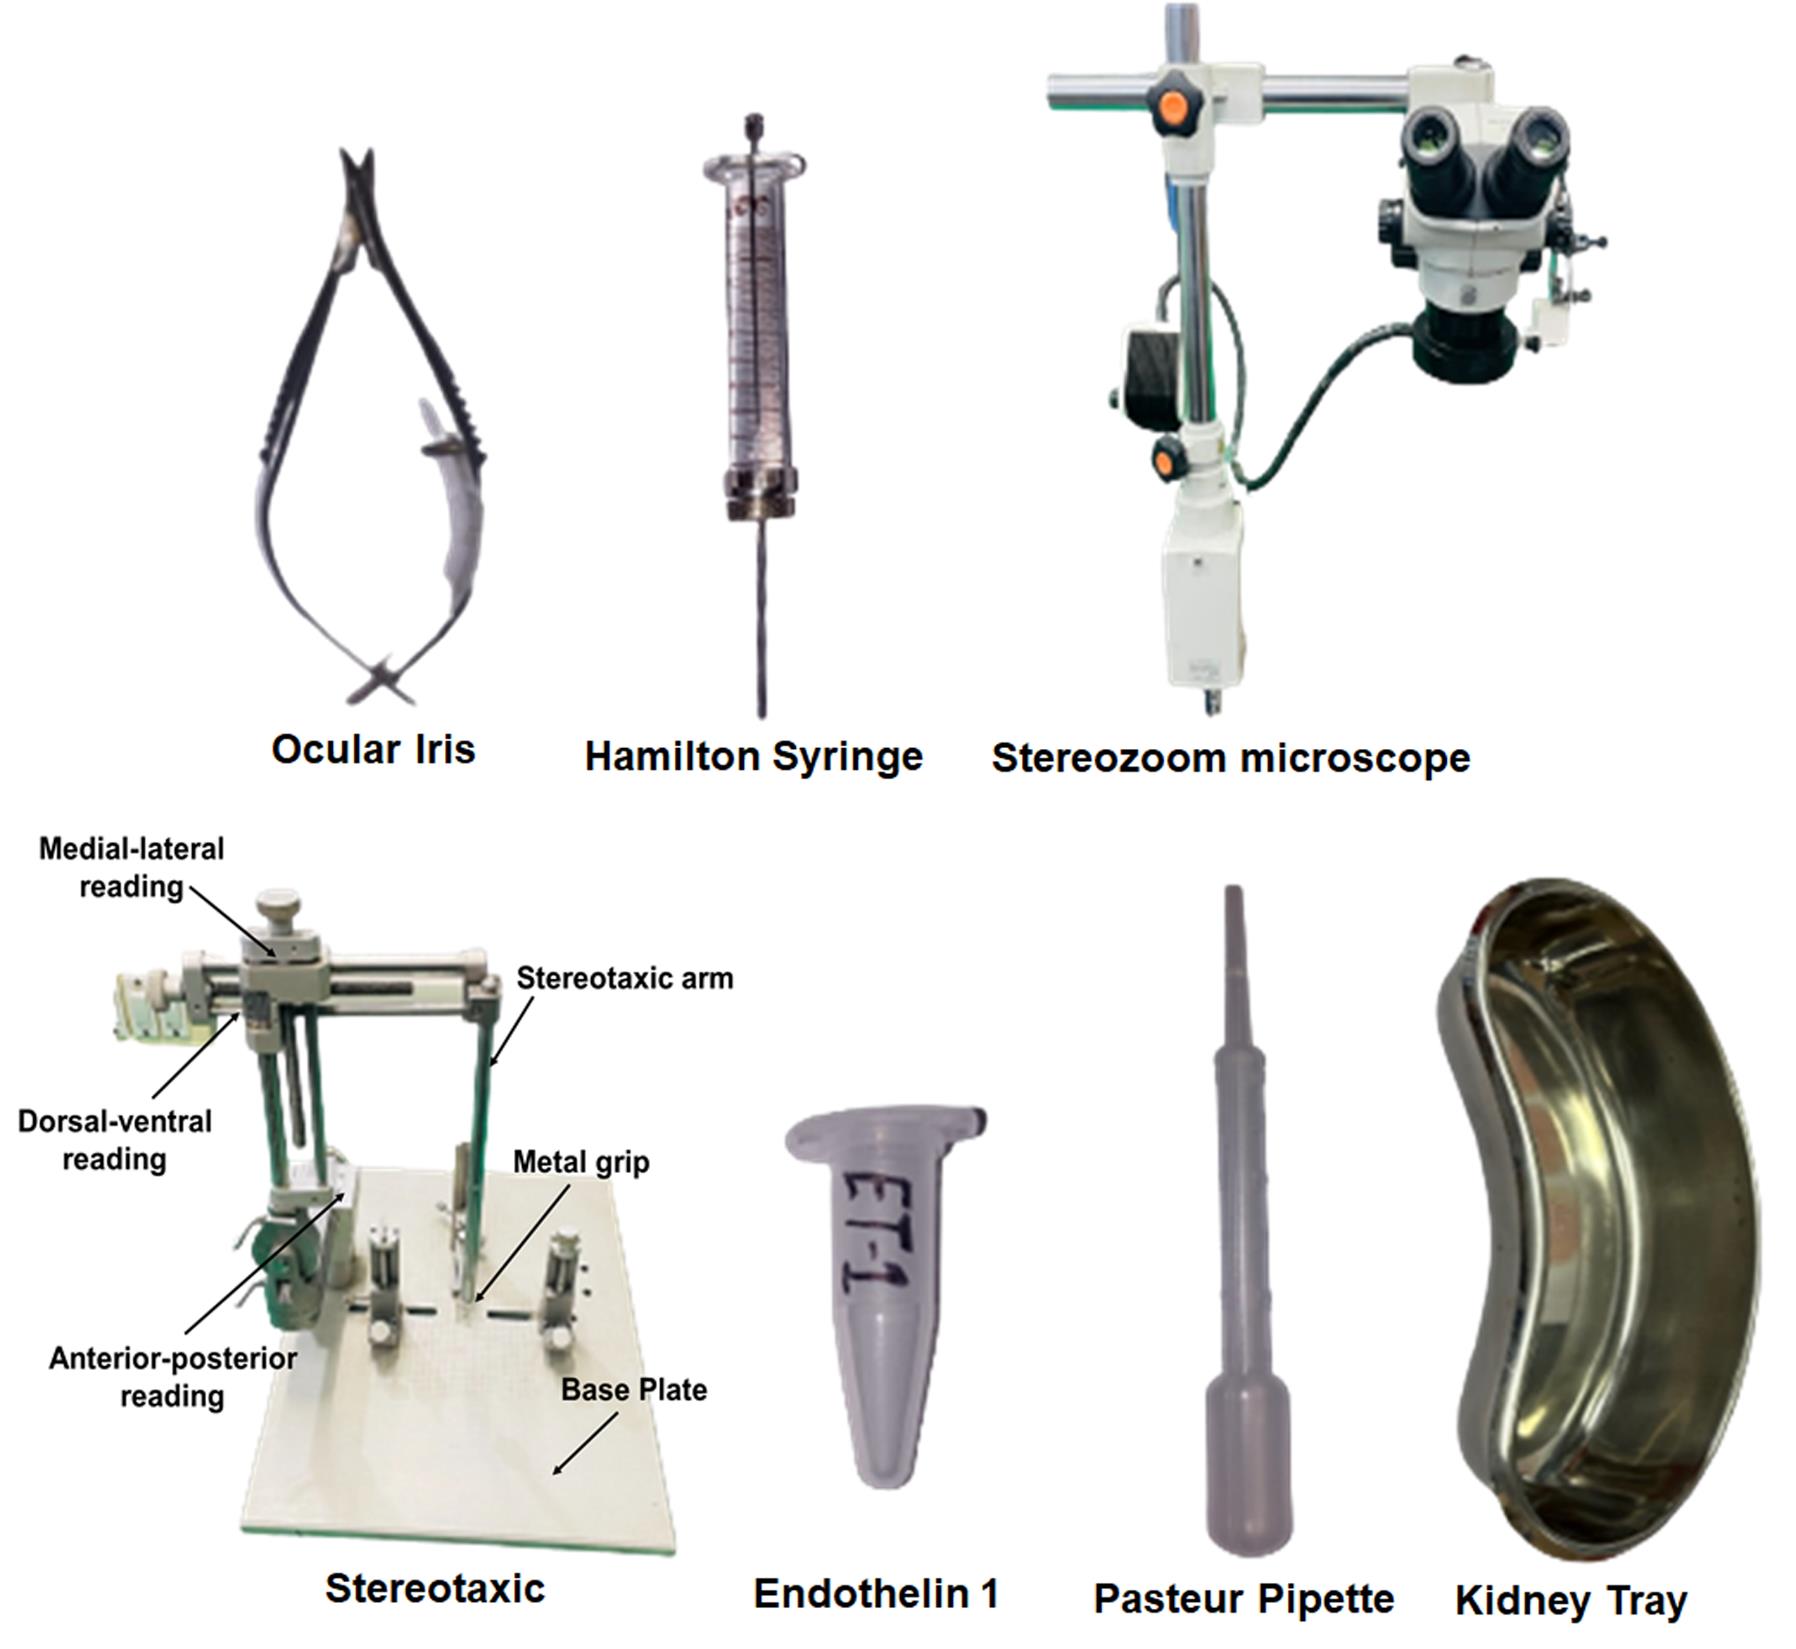
Figure 10. Tools used during the ET-1 treatment procedure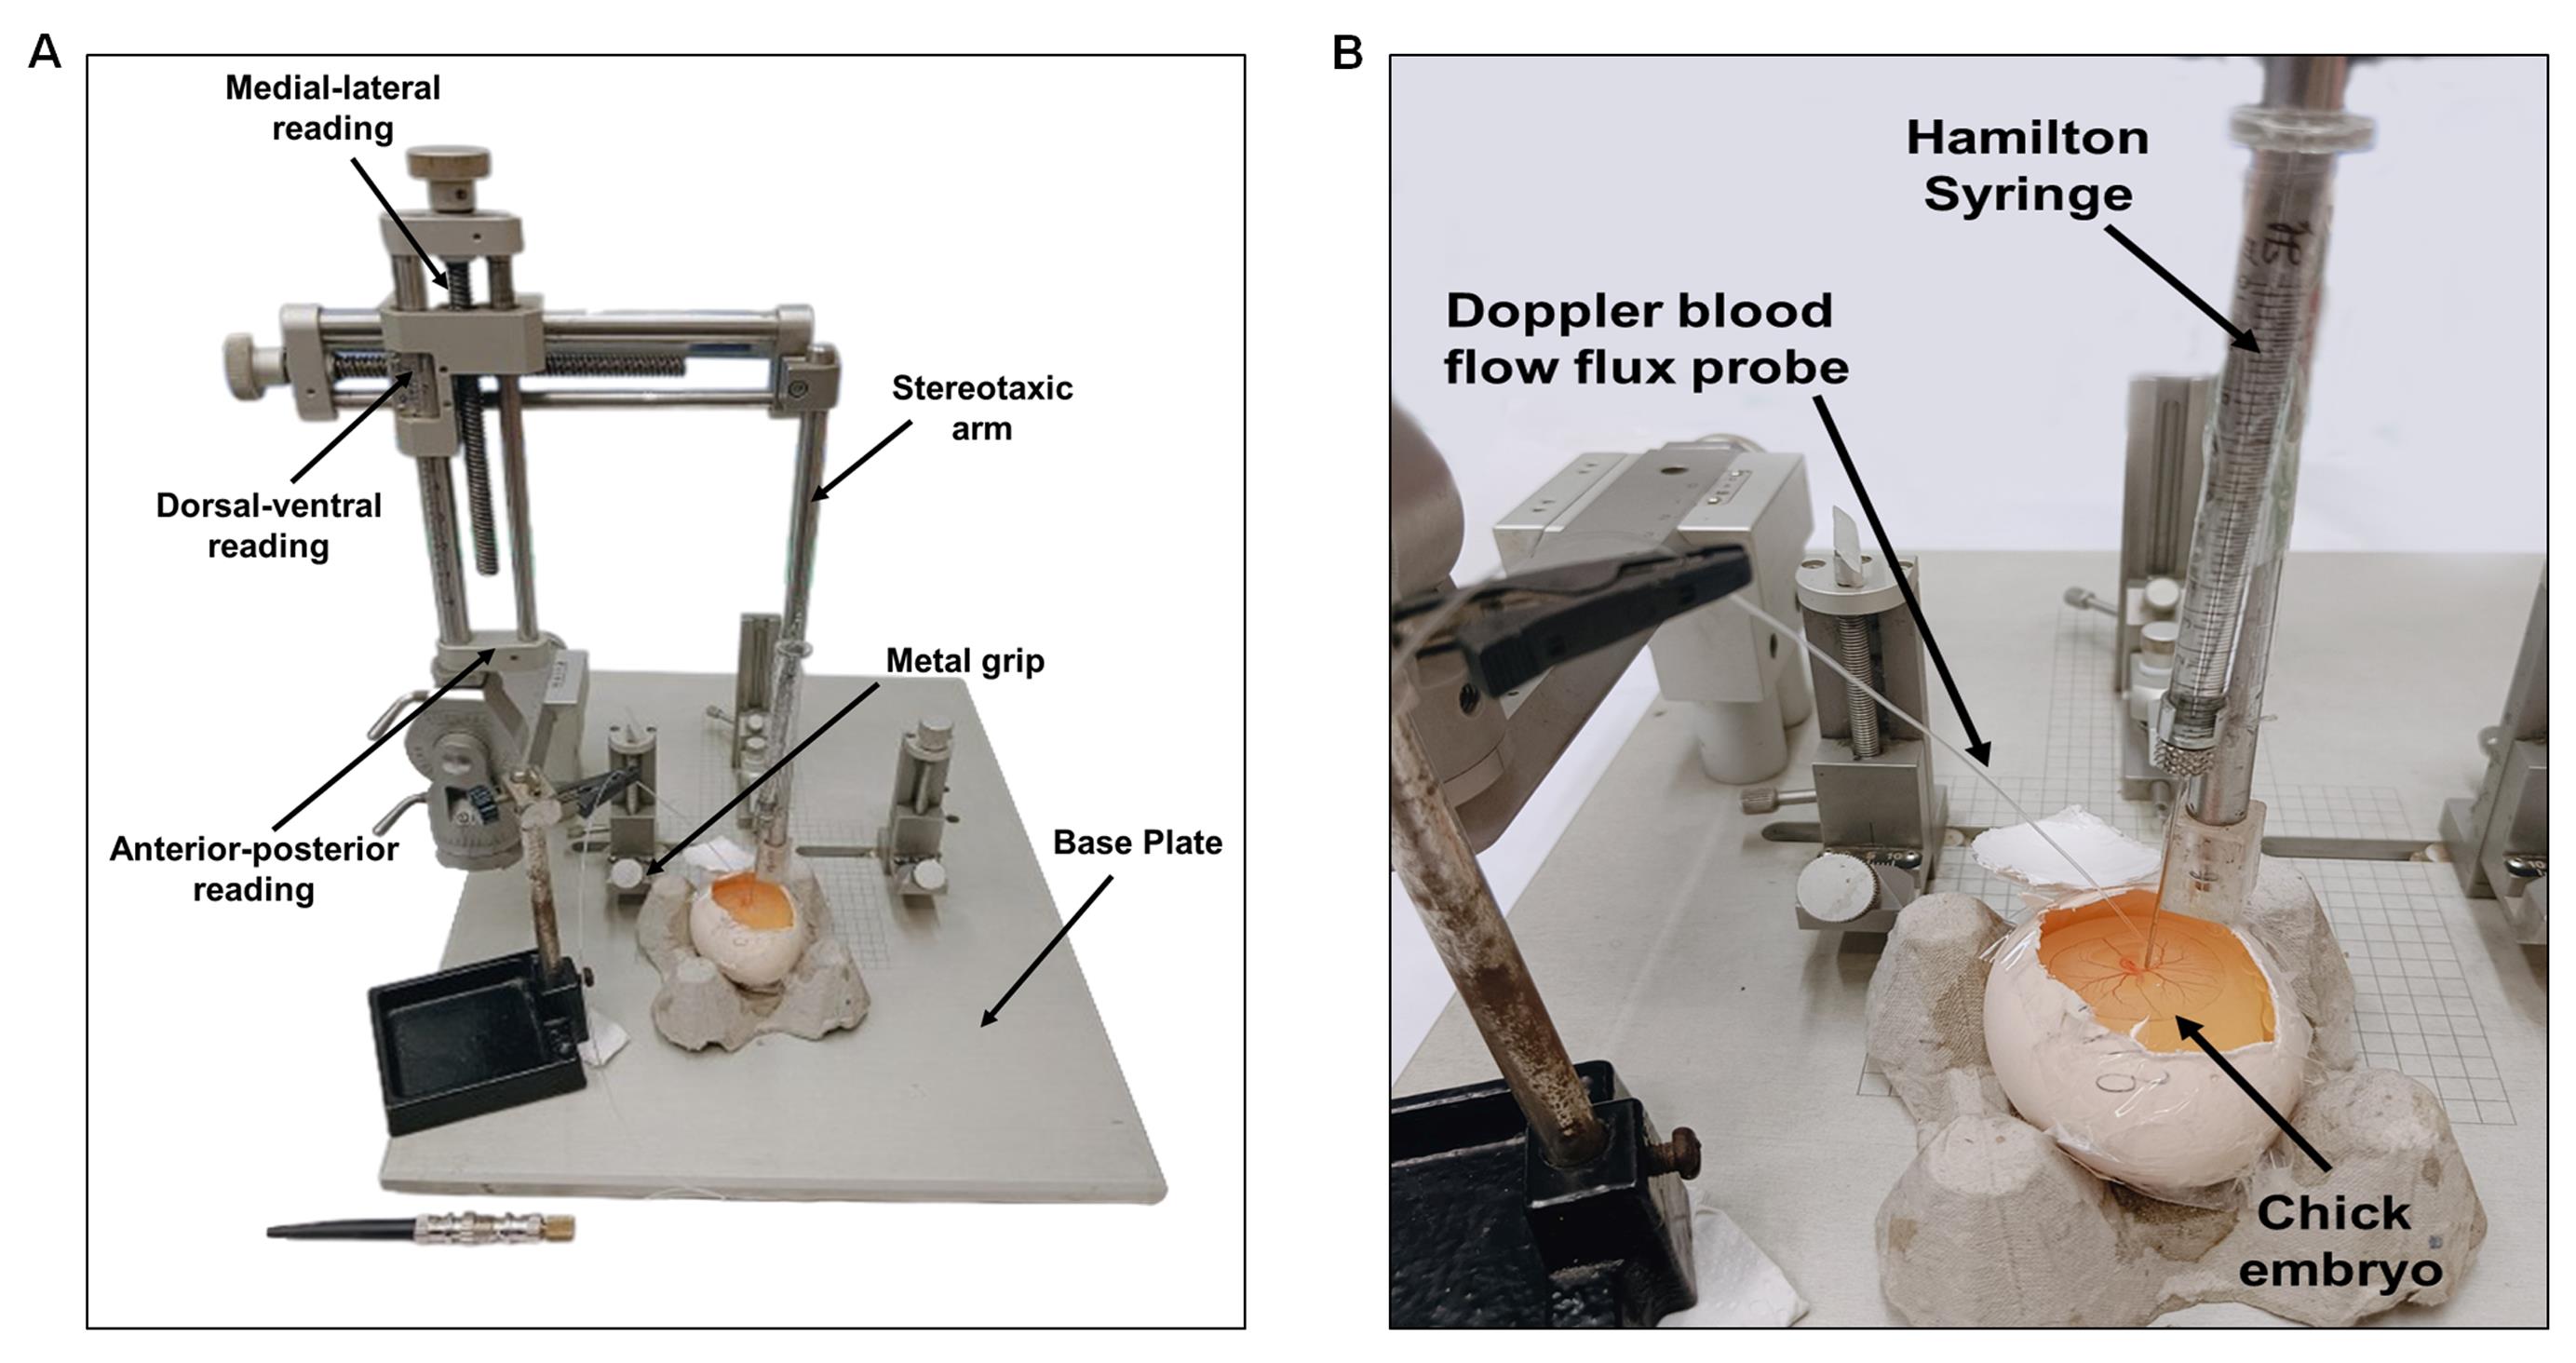
Figure 11. Typical setup for injecting ET-1. ET-1 is administered using a Hamilton's syringe connected to a stereotaxic device that precisely guides the needle onto the artery of interest (A). An enlarged view shows the injection of ET-1 into the artery (B). All experiments used the same needle, Doppler probe, and RVA positions.After ET-1 therapy, the use of Doppler blood flow meter to track the effects of vasoconstrictions at RT is recommended. Using the stereotaxis device's measurement scale, make sure that the probe is positioned 5 ± 1 mm from the vasoconstriction site. During the persistent ischemic period (a prolonged and continuous restriction or absence of blood supply), the Doppler flow meter should show a significant reduction in flux, reaching up to 70% of the baseline value (Figure 12).
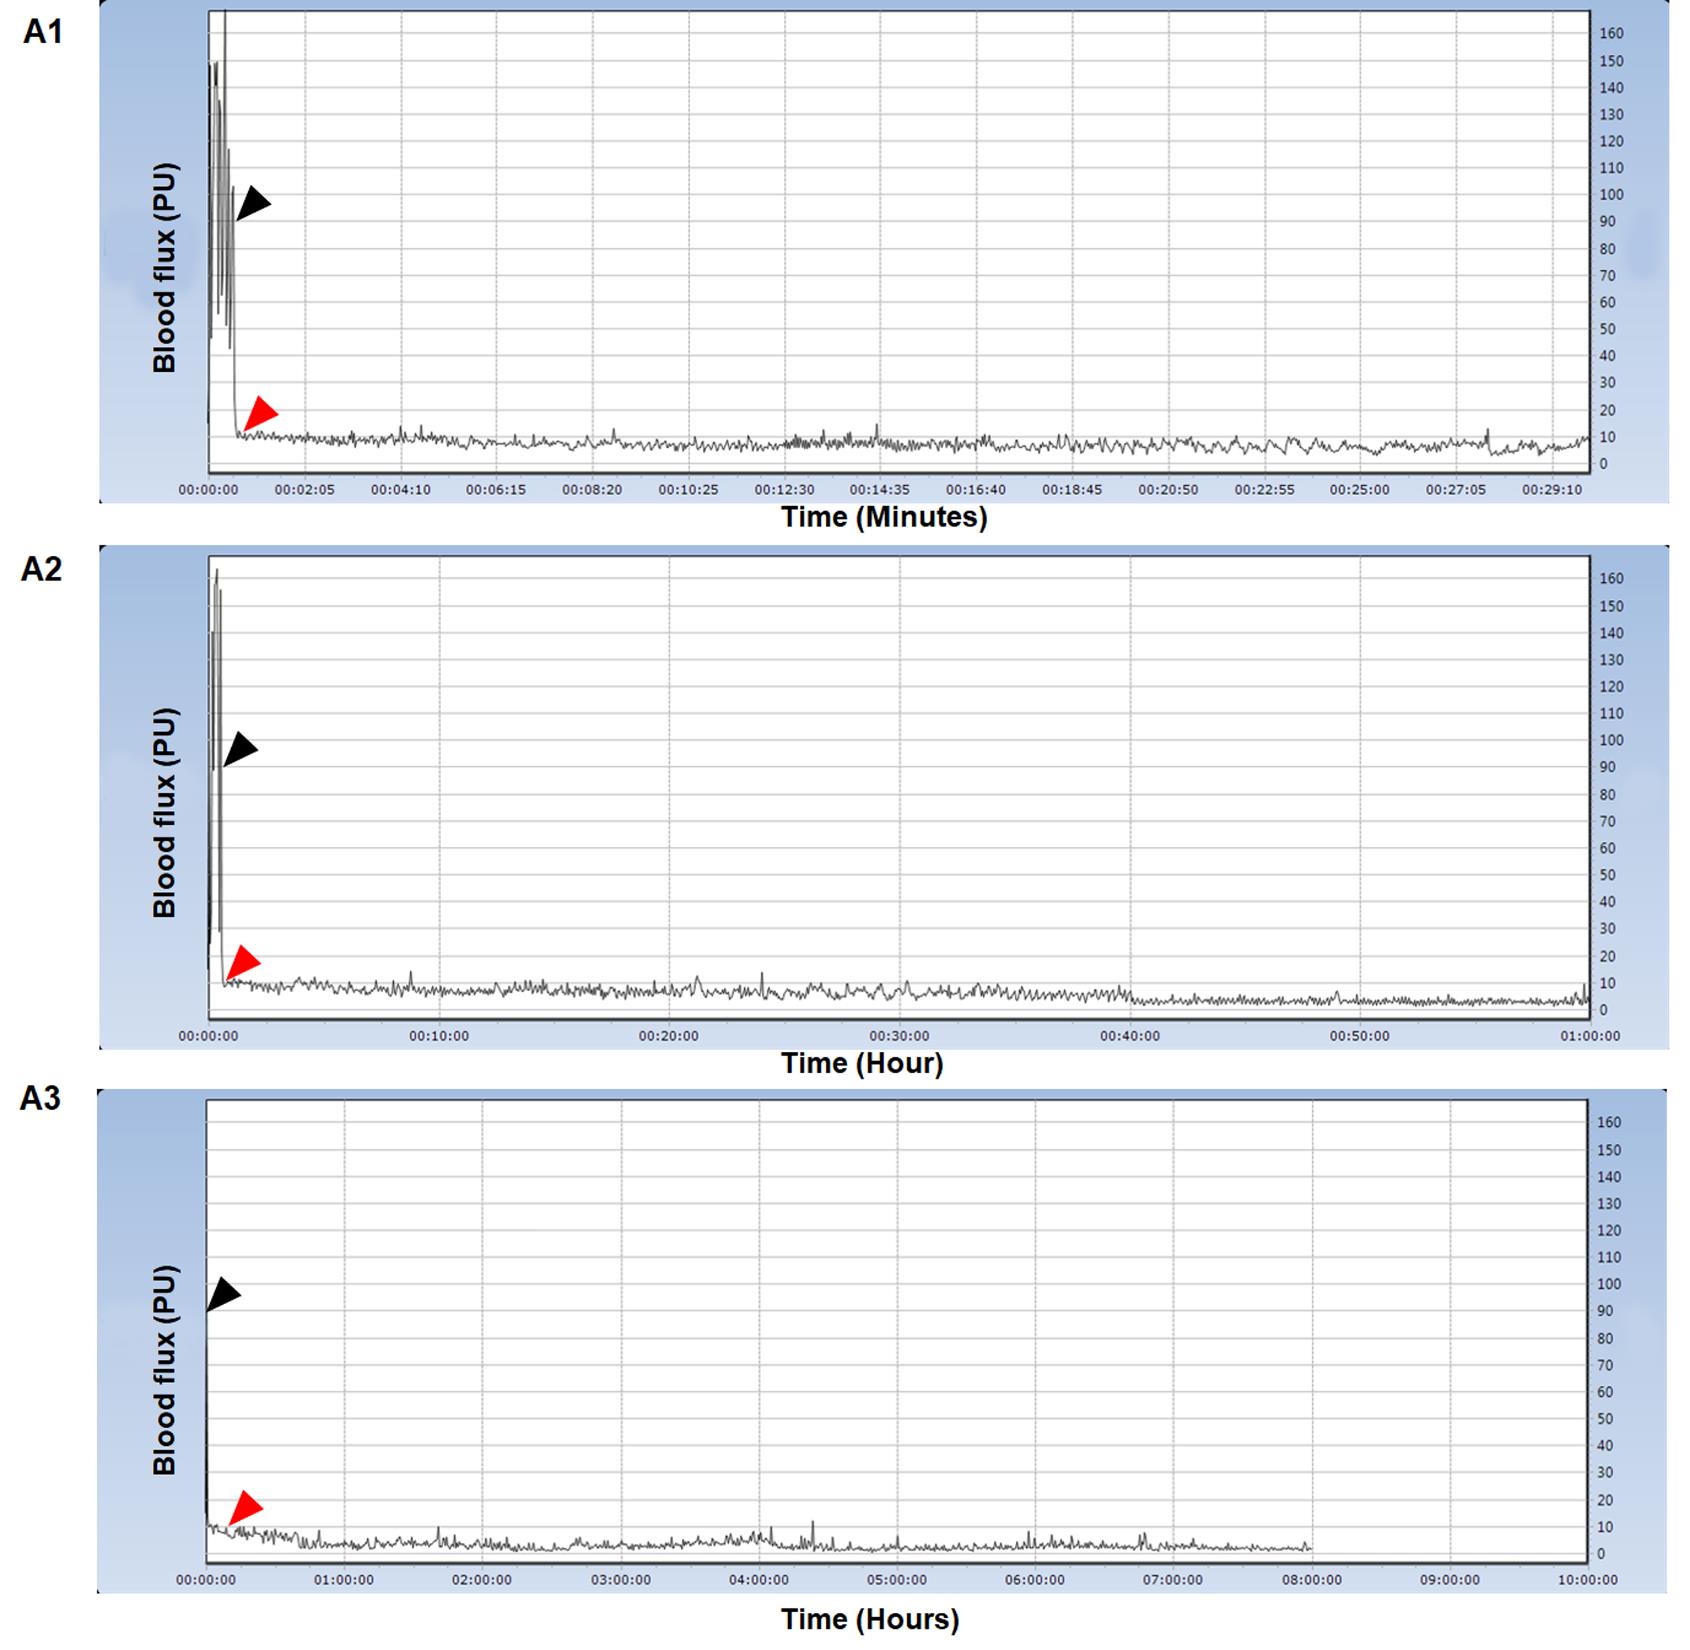
Figure 12. Typical Doppler blood flow flux readings during the ischemia phase. In minute counts, image A1 illustrates the flux transition from normoxia to the ischemia phase. A2 shows the changes in flux over the course of an hour. For up to 8 h, A3 displays flux readings. The black arrow represents flux under normoxia, while the red arrow represents flux measurement under ischemia. We conducted all Doppler blood flow flux experiments at RT following the windowing process. The y-axis represents blood flow flux measured in perfusion units, while the x-axis represents time.For all embryos, monitor the Doppler blood flow reading until 8 h (see General note 24).
The duration of ET-1 treatment should be maintained from the onset of ischemia until 8 h (a persistent ischemic period, a non-reperfusion phase) (the period of no restoration of blood flow to RVA). This suggests that the treatment induces a persistent ischemic effect as evidenced by a 70% reduction in flux intensity from its baseline level (Videos 1 and 2 show the embryo's arterial system prior to and 8 h after ET-1 injection, respectively). After the ischemic procedure, carefully apply a few drops (two to three) of 1× PBS to the embryo using a 10 mL plastic Pasteur tube (Figure 13) (see General notes 25–27).
 Video 1. Arterial system of 3-day-old chicken embryo before injecting ET-1 Video 2. Arterial system of 3-day-old chicken embryo after 8 h of injecting ET-1
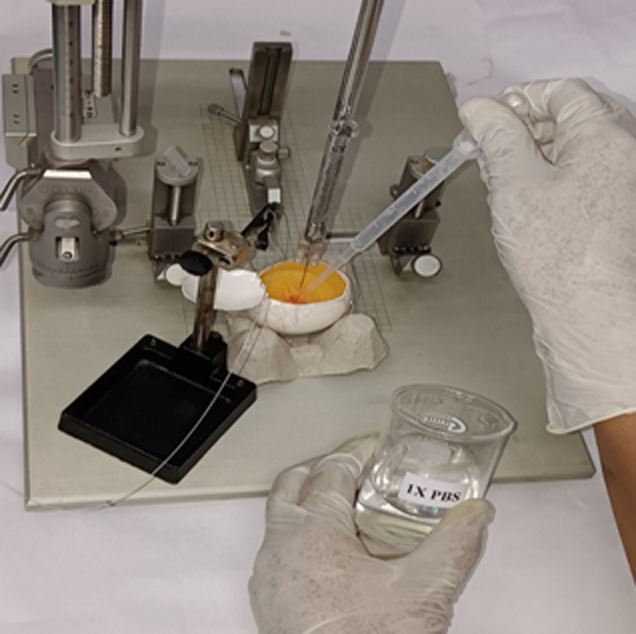
Figure 13. Adding 1× PBS to prevent dehydration. This figure illustrates the periodic (at 2 h intervals) addition of a few drops of 1× PBS to prevent embryo desiccation during the ischemic period.Following an 8 h ischemia period, proceed with RVA excision according to the protocol specified for drug treatment and downstream studies (see General note 28).
After 8 h of ischemia with ET-1, remove the eggshells and proceed with the designated treatment protocol.
Place the egg gently on a 90 mm Petri dish (see General note 29).
After placing the embryo on the Petri dish, locate and collect the RVA under the supervision of a stereo zoom surgical microscope (Figure 14B). Make sure the RVA's excision is up to 15 mm ± 1 mm (distal from the trunk), 5 mm ± 1 mm on each of the artery's left and right sides, and 2 mm ± 1 mm toward the trunk (Figure 14C). Measure the area that needs removal using a ruler (optional). Measure all distances from the point of occlusion.
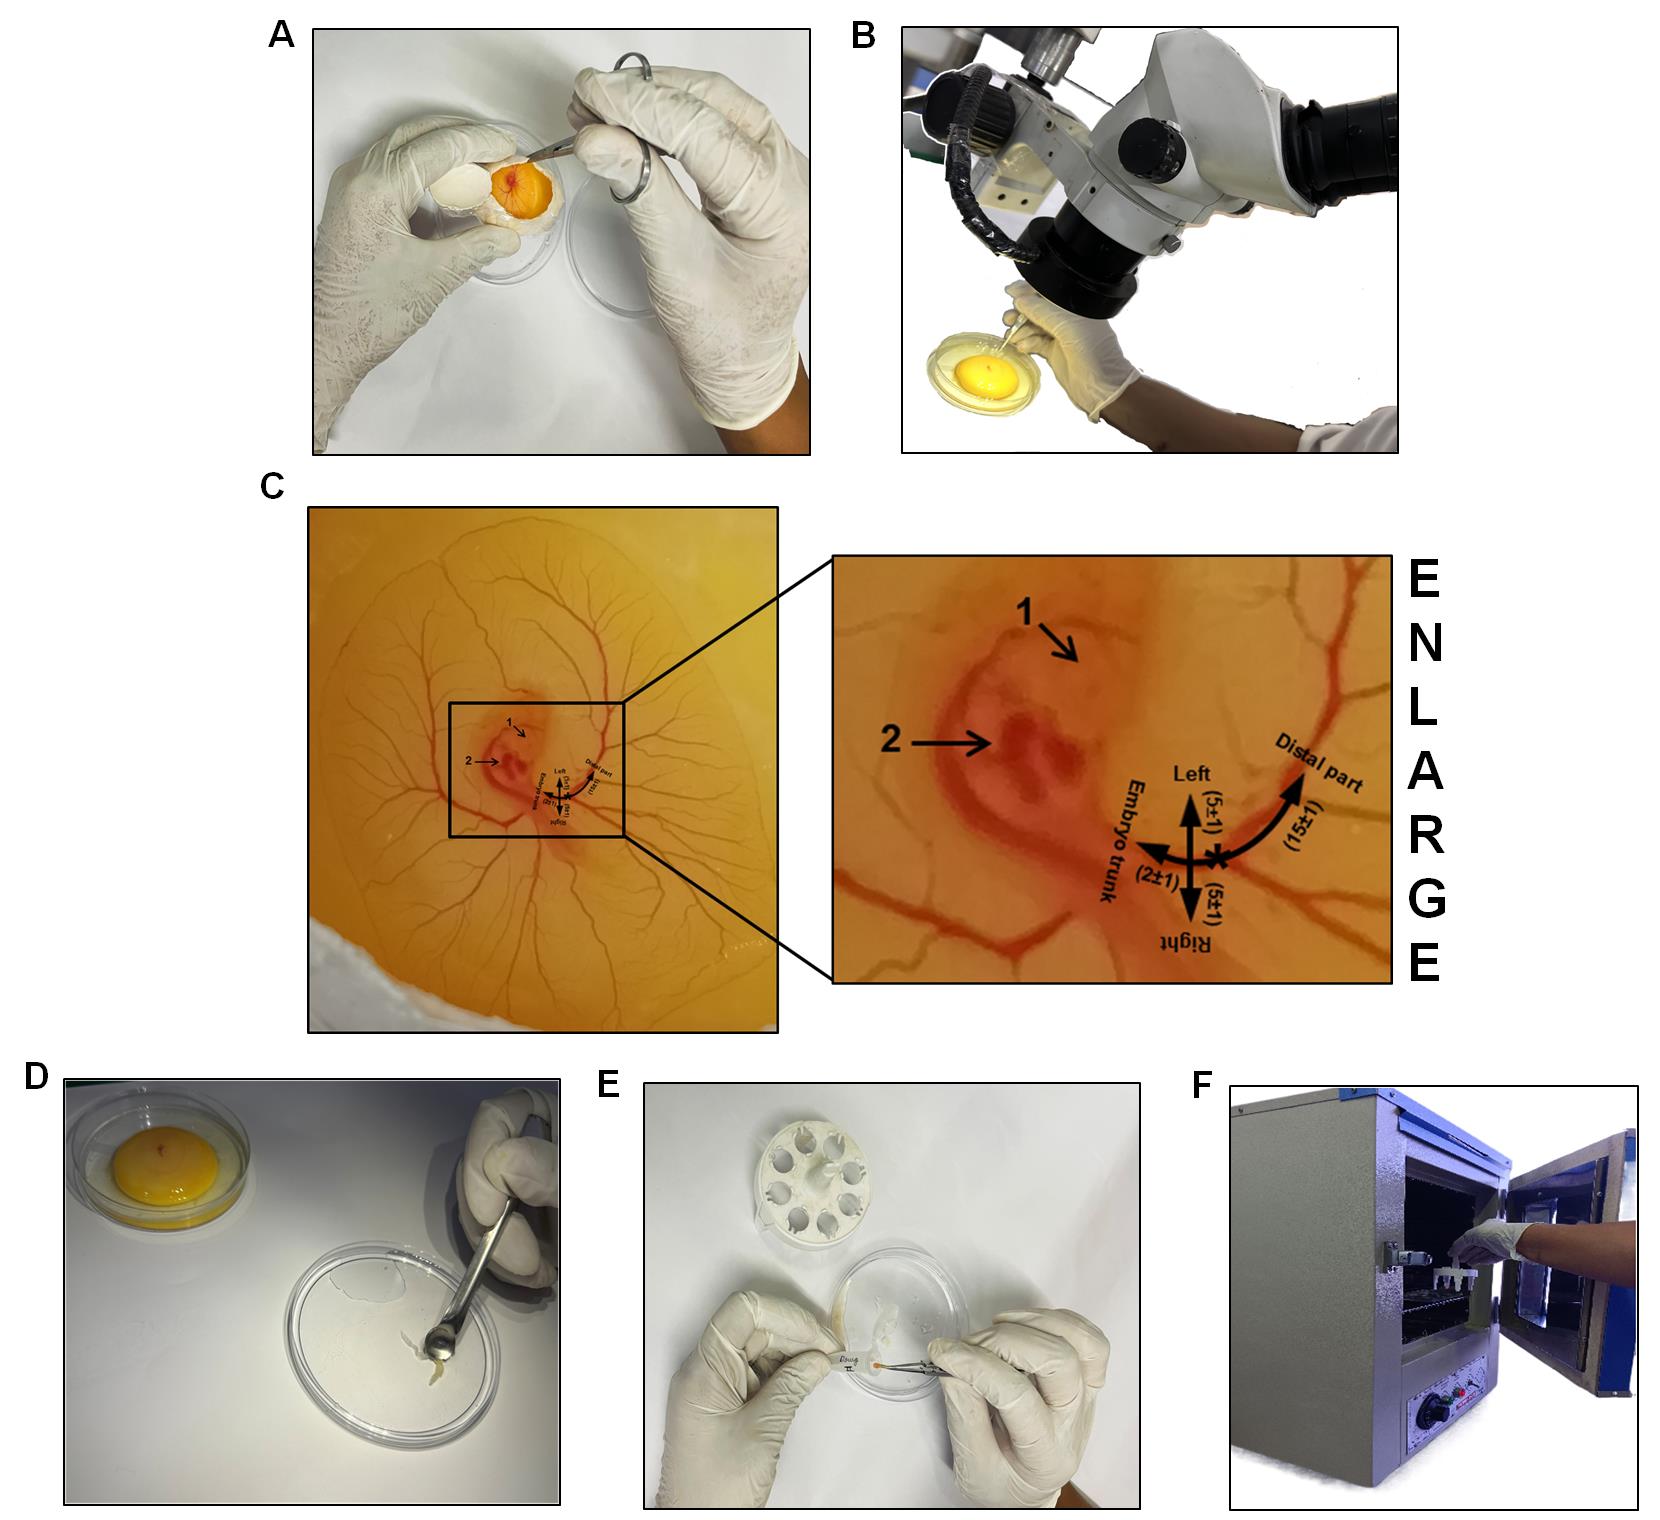
Figure 14. Steps of RVA Isolation. To isolate the RVA, remove the eggshell (A). (B) shows the transfer of an egg embryo into a 90 mm Petri dish, followed by the isolation of the RVA using an ocular iris under a stereo zoom microscope. (C) shows a schematic image of the right side of a chicken embryo, illustrating the region of tissue excision around the RVA (for downstream studies). The annotation "1" represents the eye, and "2" represents the heart. The half-black circular line denotes the RVA's emergence from the embryo's thorax. The vertical line's asterisk indicates the location of the laser Doppler blood flow device installation. The intersection (in black lines) denotes the occlusion site. 1× PBS was used to wash RVA (D). RVA is collected and placed in a 1.5 mL centrifuge tube with 500 µL of Ringer's solution (E). The accompanying treatment process involved placing the RVA in a 37 °C laboratory incubator and incubating it for 4 h (F).Rinse the excised RVA once in a sterile Petri dish containing 1× PBS (Figure 14D) before proceeding to the post-excision incubation step.
A control should be provided with a similar treatment to the ET-1+NAC-treated RVAs but no NAC.
Place the excised artery in a 1.5 mL centrifuge tube containing 500 µL of Ringer's solution, both with and without the selected drug, using ocular forceps (Figure 14E).
Subsequently, place the individual tubes containing the excised RVA, with or without the drug, in a laboratory incubator at 37 ± 1 °C for 4 h without agitation (Figure 14F) (see General note 30).
Following the 4 h incubation treatment, carefully remove the RVA from the tube with ocular forceps and rinse it twice in two consecutive tubes containing 500 µL of 1× PBS, each for 30 s (see General note 31).
Remove the tube from the incubator post-incubation and move on to process the artery for subsequent research tasks, such as Western blotting, ELISA, etc. To delicately remove the artery, use ocular forceps on aluminum foil. Subsequently, weigh the artery for protein estimation in preparation for downstream studies.
DNA isolation from RVAs
Crush 10 mg of tissue in 1 mL of absolute alcohol (see General note 32).
Transfer the homogenate into a fresh 1.5 mL centrifuge tube (see General note 33).
Centrifuge at 12,000× g for 10 min at 4 °C. Discard the supernatant.
Next, add 500 µL of lysis buffer (Table S1) containing proteinase K to the pellet. Resuspend and incubate at 55 °C for 2 h (see General note 34).
Next, centrifuge at 12,000× g for 10 min at 4 °C.
Transfer the supernatant to a fresh 1.5 mL centrifuge tube. Discard the pellet (see General note 35).
Next, add 200 µL of 3 M chilled sodium acetate to the sample. Incubate on ice for 15 min. Centrifuge at 12,000× g for 10 min at 4 °C.
Transfer the supernatant to a fresh 1.5 mL centrifuge tube.
Add an equal volume of phenol:chloroform:isoamyl alcohol, 25:24:1 (PCI) (see General note 36).
Mix properly by inverting the tube 15–20 times. Centrifuge at 12,000× g for 10 min at 4 °C.
Collect the aqueous phase.
Add an equal volume of isopropanol. Incubate for 30 min at 4 °C.
Centrifuge at 12,000× g for 10 min at 4 °C. Discard the supernatant.
Wash the pellet with 75% ethanol.
Dry the pellet properly (see General note 37).
Dissolve the pellet in 50 µL of TE buffer.
Finally, use a NanoDrop spectrophotometer to quantify the isolated DNA.
Agarose gel electrophoresis
Put a middle mold in the gel holder.
To prepare a 0.2% agarose gel, dissolve 0.14 g of agarose in 70 mL of 1× TAE buffer. To make the 1× TAE buffer, combine 20 mL of 50× TAE with enough distilled water to make a total volume of 1 L.
Heat it in the microwave for 3–4 min at a power of 300 watts; stir it occasionally.
Let it cool down to 50 °C and then add 14 µL of ethidium bromide.
Pour the agarose mixture into the mold, fill it with a comb, and let it solidify for 20 min.
After removing the gel from the comb and holder, place it in the electrophoresis chamber, and add enough 1× TAE buffer to cover the gel with a 2 mm layer of buffer.
Place the gel sample and the 3 µL marker into the agarose gel combs.
Run the gel for 1–2 h at 50 V (see General note 38).
Finally, analyze the gel in the Gel Doc system.
Western blotting
Preparation of the sample: In a lysis buffer containing protease and phosphatase inhibitors, homogenize RVA samples (see General note 39).
Next, maintain constant agitation for 30 min at 4 °C and isolate the protein using a high-speed centrifuge at 16,000× g for 30 min.
Place the tubes on ice after gently removing them from the centrifuge, collect the supernatant, transfer it to a new tube, and discard the pellet.
Next, determine the protein concentration using the Pierce BCA protein assay kit (see General note 40).
To prepare the resolving gel (Table S2), mix the constituents (acrylamide, resolving buffer, Milli Q, ammonium persulphate, and tetramethylethylenediamine) according to the desired gel percentage resulting in a total volume of 8 mL (see General note 41).
To prepare the stacking gel (Table S3), mix the constituents (acrylamide, stacking buffer, Milli Q, ammonium persulphate, and tetramethylethylenediamine) resulting in a total volume of 3 mL.
Load 20–30 μg of total protein and Laemmli buffer (for 5×). Then, incubate each sample for 5 min at 95–100 °C.
Subsequently, load an equivalent protein amount onto a commercially available SDS-PAGE gel and conduct the gel electrophoresis (Table S4) (run the gel at about 70 V) until the protein band nearly reaches the bottom of the gel (see General notes 42, 43).
Next, using wet transfer equipment, transfer proteins from the gel to a PVDF membrane.
For 2 min, place the gel in 1× transfer buffer (Table S5) to equilibrate; remove excess SDS, exchange buffers, and ensure better contact with the transfer membrane for efficient protein transfer.
Activate the PDVF membrane in methanol for 3–5 min prior to transfer.
Next, assemble the transfer sandwich, ensuring there are no trapped air bubbles.
Place the cassette in the transfer tank, along with an ice pack, and transfer at 90 V for 100 min (see General note 44).
To avoid non-specific antibody binding, soak the PVDF membrane in a 5% blocking solution for 1 h (see General note 45).
Subsequently, transfer the membrane to a refrigerator set at 4 °C and allow it to undergo overnight incubation in the presence of primary antibodies (see General notes 46, 47).
The next day, commence the washing procedure by thoroughly rinsing the membrane three times with 1× TBS-T (Table S6), each rinse lasting 3 min.
Next, incubate the membrane for 1 h at RT with secondary antibodies.
Next, rinse the membrane three times, for 3 min each (see General note 48).
Next, incubate the membrane with ECL for 10–15 s (see General note 49).
Using a Chemidoc (see General notes 50, 51), capture the image.
Using image analysis software, analyze the captured image to quantify band intensities and compare expression levels between samples. Evaluate the results in comparison with controls included in the experiment (e.g., GAPDH) for validation and interpretation (see General note 52).
ELISA
Place the artery on ice. Proceed to wash the tissue using the pre-cooled 1× PBS buffer (0.01 M, pH = 7.4).
Use lysate to grind artery homogenates on ice.
Centrifuge the homogenates at 5,000× g for 5 min. Next, collect the supernatant.
For data analysis, determine total protein concentration by BCA kit (taking reagent B:A in a 1:50 ratio) and add 190 µL to each well. Usually, the total protein concentration for the ELISA assay should be within 1–3 mg/mL.
Next, place the sample (10 µL) and control (blank) wells on the pre-coated plate and measure the samples. We recommend measuring each standard and sample in duplicate to reduce experimental errors.
In each standard well, aliquot 100 µL of stock solution on a dilution of ½ into five consecutive tubes. Additionally, add 100 µL of sample dilution buffer to the control (blank) well. Then, add 100 µL of test samples to each sample well. Seal the plate and incubate it for 90 min at 37 °C. Add the solution to the bottom of each well. Gently combine the mixture without touching the sidewall.
Allow the liquid to absorb in the plate or tap the plate on clean absorbent paper two or three times. Without immersion, add 350 µL of wash buffer to each well. Discard the liquid in the well and tap on the absorbent paper again. Repeat the washing steps twice.
In each well, add 100 µL of biotin-labeled antibody working solution. Seal the plate and incubate it for 60 min at 37 °C.
Repeat step E7.
In each well, add 100 µL of HRP-Streptavidin conjugate working solution. Seal the plate and incubate for 30 min at 37 °C.
Next, proceed to wash the plate five times using the wash buffer.
Add 90 µL of 3,3',5,5'-Tetramethylbenzidine substrate into each well, seal the plate, and incubate at 37 °C in the dark for 10–20 min.
After staining, keep the liquid in the well. Add 50 µL of stop solution to each well. The color will turn yellow immediately.
Read the absorbance at 450 nm in a microplate reader immediately and calculate.
Data analysis
The data distribution was checked by the Shapiro-Wilk test of normality. A one-way analysis of variance (ANOVA) with the Mann-Whitney test was used to compare the differences between the two groups and Tukey’s test was used to analyze the data for multiple comparison using SPSS Statistics 29.0 software (IBM). Statistics were judged significant at 0.001 (*/**/***P < 0.05/0.01/0.001 compared to the control/ET-1-treated group; #/##/###P < 0.05/0.01/0.001 compared to the ET-1/ET-1+NAC-treated group). The error bars represent the mean ± SD, at least n = 4.
Validation of protocol
This protocol aims to ascertain the success and reproducibility of ET-1-induced persistent ischemia in 3-day-old chicken embryos. Standard laboratory procedures employed in ischemic research globally were used, including Doppler blood flow imaging measurements [24,25], gel electrophoresis [26,27], ELISA [28,29], and western blotting [30] for model validation. In brief, first, we assess the model's efficacy via Doppler blood flow imaging, a well-established technology for detecting blood flow [31,32]. The comparative study began by comparing data from the control group to the ET-1 groups (Figure 15) (see General note 53).
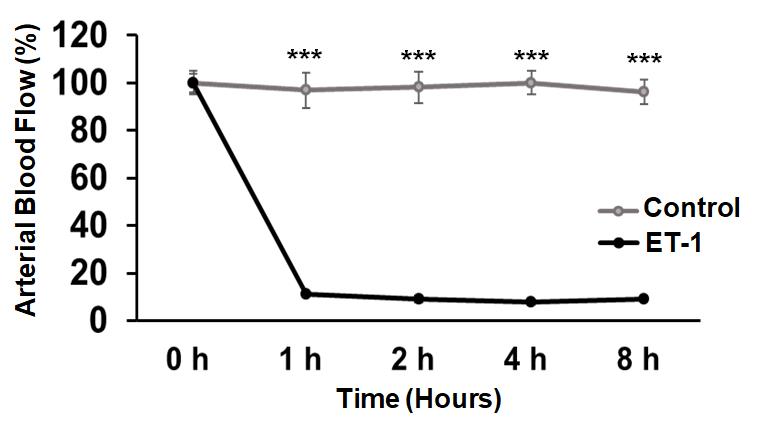
Figure 15. Overlay graph comparing control vs. ET-1-treated ischemic RVAs. The ET-1 treatment demonstrates a significant reduction in flux overlay when compared to values observed in control-treated RVAs. The statistical analysis reveals a highly significant difference (Control vs. ET-1 ***P < 0.001) across all time points. The Shapiro-Wilk test of normality was used to check the data distribution. We used SPSS Statistics 29.0 software (IBM) to perform a one-way analysis of variance (ANOVA) with the Mann-Whitney test to compare the differences between the two groups. Statistics were judged significant at 0.001 (***P < 0.001 compared to the control/ET-1-treated group). The error bars represent the mean ± SD, n = 10.
This study confirmed ET-1's ability to induce persistent ischemia in 3-day-old chicken embryos. Subsequent molecular analyses included Southern blotting [33] (Figure 16A), ELISA (for TNF-α [34–36] and IL-1β [37,38]), and western blotting (for γ-H2AX [39,40], HIF-1α [41,42], NOX2 [43,44], IFN-γ [45,46], RIPK1 [47,48], cleaved caspase-3 [49,50], and LC3 [51,52] expression) (Figure 16B). Along the preceding lines, the model's efficiency in exploring hypoxia (Figure 17), oxidative stress [53,54] (Figure 18), inflammatory stress [55,56] (Figure 19A–C), necrosis [57], apoptosis [58] (Figure 20A), and autophagy [59] (Figure 20B) pathways was in line with the previous findings. Notably, pharmacological treatment with NAC in the ET-1 group outperformed ET-1 treatment alone [60], indicating the model's applicability for drug screening studies. In conclusion, our model has proven useful for analyzing persistent ischemia processes and has the potential to be used in research into tissue injury, inflammation, cell death, and drug screening applications.
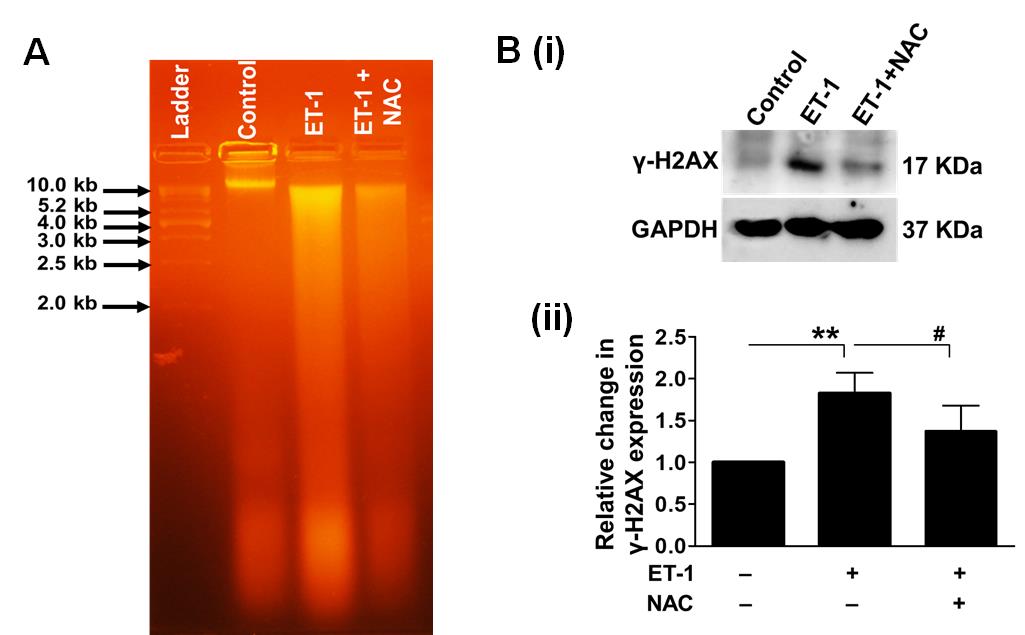
Figure 16. Effect of prolonged ischemia, mediated by ET-1, on DNA damage. We used agarose gel electrophoresis to assess the DNA damage in 3-day-old chicken embryos treated with ET-1. The results confirmed the degradation of genomic DNA in ET-1 samples. NAC, an inhibitor of antioxidant therapy, significantly reduced DNA damage. A 1 kb DNA ladder was utilized as a size marker (A). Next, we employed western blot analysis to quantitatively analyze the expression of γ-H2AX in the presence and absence of NAC to further examine the ischemic stress reaction on DNA damage (B). The treatment with ET-1 significantly increased the expression of the DNA damage marker γ-H2AX. Notably, the use of NAC greatly reduced the reported effects. As an internal control, GAPDH was used (**P < 0.01 compared to the control/ET-1-treated group; #P < 0.05 compared to the ET-1/ET-1+NAC-treated group). Error bars represent the mean ± SD, n = 4.
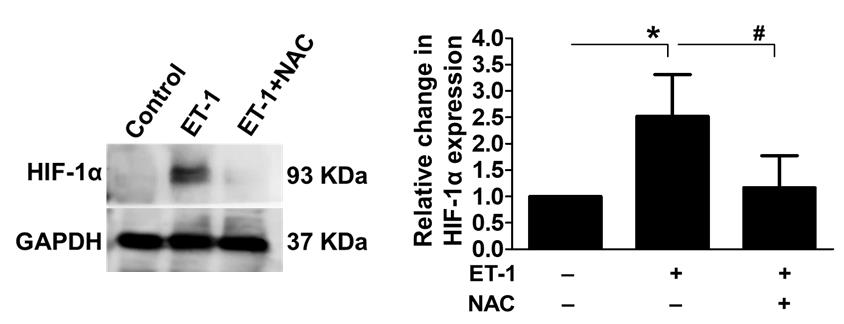
Figure 17. Influence of ET-1-induced ischemia on HIF-1α expression. We used western blotting to look at the expression levels of the hypoxia marker HIF-1α to see whether ET-1-induced ischemia affected hypoxia or not. The results showed an increase in HIF-1α expression after ET-1 therapy; the use of NAC greatly reduced the reported effects, thus confirming ischemic development. GAPDH was used as an internal control (*P < 0.05 compared to the control/ET-1-treated group; #P < 0.05 compared to the ET-1/ET-1+NAC-treated group). Error bars represent the mean ± SD, n = 4.
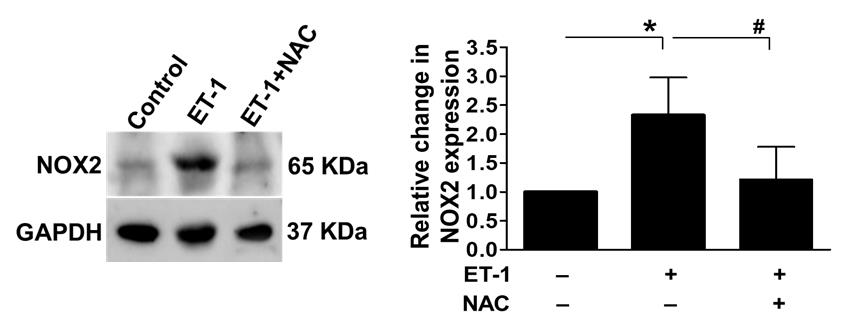
Figure 18. Effect of persistent ischemia on oxidative stress. To assess the oxidative stress response during persistent ischemia, we used western blot analysis to look at the levels of NOX2 expression in the presence and absence of NAC. ET-1 treatment dramatically raised the expression of oxidative stress markers, indicating a considerable increase in oxidative stress in chicken embryos. Notably, the administration of NAC, an antioxidant, significantly reduced the observed effects. GAPDH was used as an internal control (*P < 0.05 compared to the control/ET-1-treated group; #P < 0.05 compared to the ET-1/ET-1+NAC-treated group). Error bars represent the mean ± SD, n = 4.
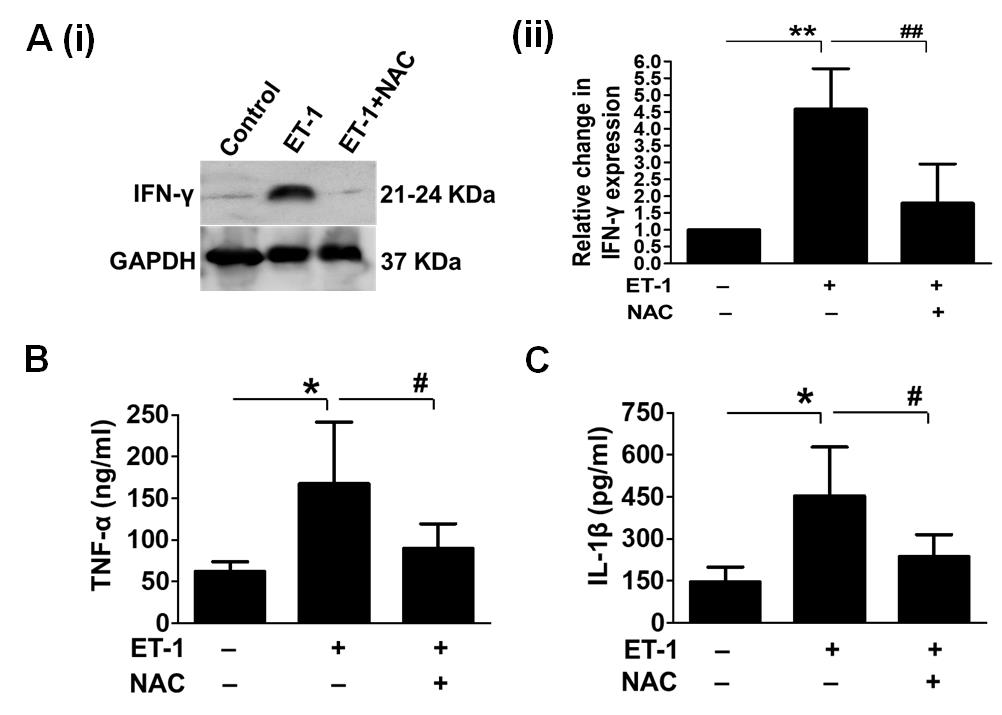
Figure 19. Effect of persistent ischemia on inflammation. To assess the inflammatory response after chronic ischemia, we used western blot analysis to examine IFN-γ expression levels in the presence and absence of NAC (A). We also used ELISA to evaluate TNF-α and IL-1β levels in the presence and absence of NAC (B and C, respectively). The expression of these inflammatory markers was dramatically increased by ET-1 treatment, indicating a significant rise in inflammation in embryos. GAPDH was used as an internal control (*/**P < 0.05/0.01 compared to the control/ET-1-treated group; #/##P < 0.05/0.01 compared to the ET-1/ET-1+NAC-treated group). Error bars represent the mean ± SD, n = 4.
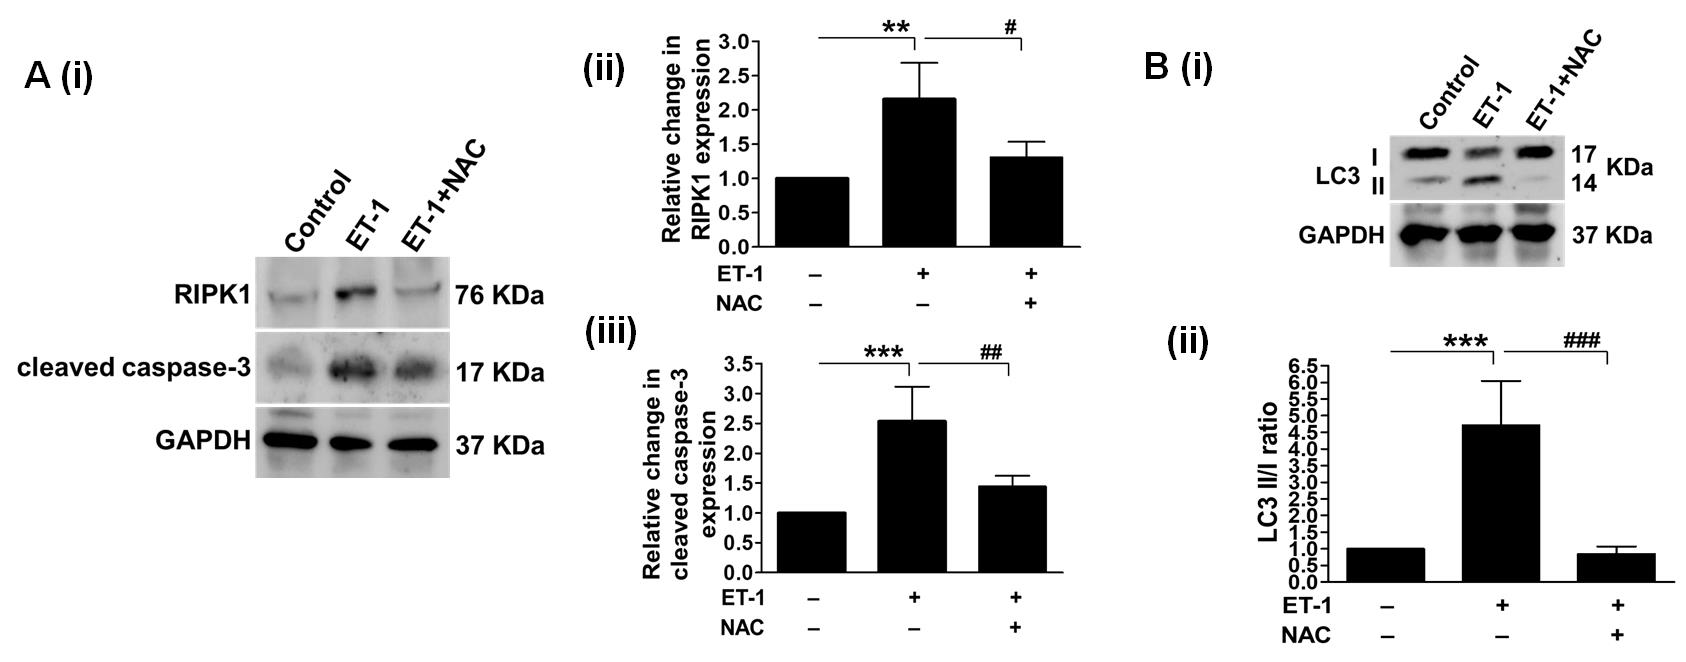
Figure 20. Impact of persistent ischemia on cell death pathways. (A) depicts necrosis and apoptosis. By measuring the levels of RIPK1 expression, we first looked into the activation of prolonged cell death due to insufficient blood supply. We examined it both with and without NAC (Aii). The results showed that RIPK1 expression went up after ET-1 treatment, which suggests that ET-1 treatment induces necrosis. In addition, administering NAC reversed the observed effects, providing evidence for the involvement of oxidative stress. Through examining cleaved caspase-3 expression, our investigation focused on the induction of apoptosis following the administration of ET-1 (Aiii). ET-1 treatment increased the expression of cleaved caspase-3. (B) Subsequently, we analyzed the levels of LC3II/I expression to evaluate autophagy activation in response to prolonged ischemia. The administration of ET-1 markedly increased LC3II expression, while NAC therapy reduced it. The internal control utilized in the experiment was GAPDH (**/***P < 0.01/0.001 compared to the control/ET-1-treated group; #/##/###P < 0.05/0.01/0.001 compared to the ET-1/ET-1+NAC-treated group). Error bars represent the mean ± SD, n = 4.
General notes and troubleshooting
Eggs that are either newly laid (0-day) or stored for around 15 days under refrigeration can be employed. Older eggs might not successfully develop into embryos. Eggs that are freshly laid can be refrigerated at temperatures ranging from 15 to 16 °C for about two weeks. However, opting for a recently laid egg can enhance embryo viability and development potential.
Sterilization of eggs is recommended, as it will assist in removing any germs or microbes on the eggshell (Figures 1 and 2).
It is important to write the dates on the egg because it facilitates identification.
Once each egg has received a date and an ID, arrange the eggs on the egg rack in such a way that the written portions are at the bottom. This technique greatly aids in determining the embryo's orientation during windowing.
It is critical to set the egg incubator's temperature and humidity at 37 ± 1 °C and 60%–65%, respectively, as deviations from these optimal limits may result in inadequate or no growth.
A 5 mL syringe and an 18 G needle are recommended to facilitate the removal of albumin.
Albumin removal is necessary for all eggs, including both control and experimental eggs.
Albumin removal prevents its overspill while creating a window besides providing a development bed for the embryo. Further, the removal of albumin reduces the possibility of embryo injury during windowing because it prevents the embryo from sticking to the membrane adjacent to the inner surface of the shell.
To prevent damage to the yolk, insert the 18 G needle at a 60–70° angle. Puncturing the yolk significantly reduces egg survival. Hence, when removing albumin, it is essential to move slowly and concentrate on the thin outer layer. Extracting the viscous albumin can cause the embryo to rotate or change position. Obtaining dense albumin is a critical step that has the potential to significantly alter the embryo's position, emphasizing the importance of meticulous precision in procedure execution. By accounting for complex factors that influence embryo behavior, they enhance scientific accuracy and increase the likelihood of desired results. Recognizing and incorporating these insights is integral to a comprehensive and effective protocol implementation.
All eggs, including both control and experimental eggs, will undergo incubation.
A transparent packaging tape will help in reducing unwanted breakage of the shell during the cutting of the eggshell in an oval shape, besides helping in reducing the free fall of pieces of eggshell onto the embryo bed.
An oval-shaped window cutting provides a more stable platform for subsequent procedures.
Make sure the oval cut is large enough to provide straightforward access to the embryo from any direction. If necessary, adjust the egg's location to accommodate the embryo's position.
Use considerable caution during the surgical operation to prevent injuring the RVA or any neighboring arteries. If the RVA sustains damage by accident, remove the egg from the study.
A well-developed embryo should be visible at 72 h (Figure 8D).
All eggs, encompassing both control and experimental eggs, will go through the process of egg windowing.
For the experiment, precise standardization of ET-1 dosage and timing is critical. Following the settings outlined in this protocol, a concentration of 1 pM at the 8 h mark should yield similar results as indicated in the protocol.
Do not inject more than 1 µL of ET-1; doing so can cause the excess ET-1 to spill over in an unwanted area or across the embryo's extremes or ends, which would cause the embryo to die.
To maintain the integrity of the data, any eggs that were inadvertently exposed to more than 1 µL of ET-1 were promptly excluded and eliminated from the study. The Hamilton syringe, equipped with gradations, allows for precise dispensing of ET-1 dissolved in MilliQ.
Investigations should only consider embryos that exhibit a flux reading drop of at least 70% post-ET-1 treatment.
Although minor fluctuations may occur during normoxia, they are significantly less noticeable than the sharp decline observed after ET-1 treatment. Importantly, these minor fluctuations will not impact the statistical calculations when comparing the normoxia and ischemic phases.
The precision required for ET-1 injection and embryo handling may hinder reproducibility.
During incubation, it is critical to maintain constant humidity and temperature; any changes may impact the embryo's growth and the induction of ischemia.
Precise positioning of the Doppler probe (Figure S1) is essential for reliable blood flow measurements; even minor deviations can lead to conflicting results.
ET-1 after an 8 h period could result in mortality escalation of roughly 35%–40% until 12 h, with death rates increasing to 60%–70% within 24 h of ET-1 administration. As a result, it is best to conduct investigations within 8 h (Figure S2). The ET-1 used in these trials is 1 µL of 1 pM.
Use a 10 mL plastic Pasteur tube to apply 2–3 drops of 1× PBS every 2 h during ET-1 treatment until the experiment is over to maintain the embryo's moisture and prevent dehydration.
The standardized composition, buffering capacity, well-defined ionic composition, and osmolality of 1× PBS as an isotonic solution contribute to maintaining a stable pH environment and preventing osmotic stress, ensuring consistent conditions for proper embryonic development.
The process for control eggs will be the same as for ischemic eggs but without ET-1 treatment.
To remove the eggshell without disturbing the yolk or embryo, a precise incision is made in the middle of the pre-existing oval-shaped window cut on the shell using sterilized scissors (Figure 14A). Then, the upper region of the eggshell is carefully cut, allowing the contents of the egg to be gently poured into a dish. Throughout this process, the utmost care is taken to avoid any unnecessary shaking or disturbance, ensuring a smooth transfer of the yolk and embryo with minimal disruption.
Regardless of whether the excised RVA has undergone drug incubation, immerse all RVAs in Ringer's solution, the standard control for drug interventions, within a laboratory incubator.
At this point, the experiment can proceed as specified or, alternatively, the artery can be directly frozen at -80 °C for future use.
To achieve effective homogenization, ensure that the tissue is thoroughly and consistently crushed with absolute alcohol.
Avoid disturbances during supernatant removal. Repeat the centrifugation and washing processes, modifying the parameters as necessary, if the supernatant removal is not sufficient.
Ensure thorough resuspension and consistent incubation.
Check for efficient supernatant transfer to a new tube, while ensuring minimal pellet contamination. If the supernatant is not sufficiently washed, repeat the centrifugation and washing processes, modifying parameters as necessary.
To ensure successful DNA isolation, confirm the addition of PCI solution in equal volume and thorough mixing by inversion (15–20 times). Avoid insufficient mixing.
It is critical to dry the pellet properly. Methods for overcoming the problem include extended centrifugation, air drying, vacuum concentration, and optimizing the washing conditions by changing the ethanol content.
Consistently monitor the run time and voltage to prevent overheating and ensure proper separation of DNA fragments.
Ensure thorough homogenization in the lysis buffer with protease and phosphatase inhibitors to extract a representative protein sample.
Verify protein concentration using a protein assay and ensure samples are properly prepared and denatured.
Use freshly prepared or properly stored gels. Ensure there are no air bubbles in the gel during polymerization.
To guarantee appropriate separation during electrophoresis, it is imperative to load a precise and comparable quantity of protein onto the gel.
Verify the composition of the running buffer and ensure that the gel runs at the proper time and voltage.
To achieve optimal transfer without excessive heating, precise timing and voltage adjustments are required. During the transfer procedure, use an ice pack to preserve the transfer unit's low temperature.
Use an appropriate blocking agent (e.g., 5% BSA or non-fat dry milk) for sufficient time to reduce non-specific binding.
Optimizing incubation temperature and duration for specific antibodies to ensure effective binding is equally important in the current protocols.
Antibody concentration and specificity are crucial for accurate detection.
Thorough washing is essential to eliminate surplus secondary antibodies and minimize background. If the current washing is insufficient, consider increasing the number of washes or extending the washing process's duration.
Use fresh and high-quality enhanced chemiluminescence (ECL) reagents. Optimize exposure time to avoid underexposure.
Capture the image promptly using a Chemidoc to avoid signal decay and ensure accurate documentation.
If bands are still not visible, repeat critical steps (e.g., transfer, blocking, and antibody incubation) to identify potential errors.
Use a loading control (e.g., β-actin or GAPDH) to confirm equal protein loading across lanes.
To ensure the reproducibility and accuracy of model validation, the following key markers can be used: γ-H2AX for double-stranded DNA breaks; HIF-1α for hypoxia; ORP150, NOX2, and SOD1 for oxidative stress; TNF-α, NF-kβ, and IFN-γ for inflammatory stress; RIPK1 for necrosis; cleaved caspase-1, cleaved caspase-3, Apaf-1, Bax, and BCl2 for apoptosis; LC3, p62, Beclin1, Ambra1, LAMP1, and Cathepsin B for autophagy.
Acknowledgments
The authors thank the Department of Science and Technology-Science Engineering Research Board (Grant No. YSS/2015/01731), New Delhi, for providing the funds to purchase a Doppler blood flow meter. Arshi Waseem is thankful to the Uttar Pradesh Council of Science and Technology for providing a junior research assistant fellowship (Project ID 2837, reference no. CST/D-1544). We thank Prof. Joanki Sen of the Indian Institute of Technology's Bioscience and Bioengineering department for critically examining the article and providing input.
Competing interests
The authors declare no competing interest.
References
- Rink, C. and Khanna, S. (2011). Significance of Brain Tissue Oxygenation and the Arachidonic Acid Cascade in Stroke. Antioxid Redox Sign. 14(10): 1889–1903.
- Patel, P. M., Connolly, M. R., Coe, T. M., Calhoun, A., Pollok, F., Markmann, J. F., Burdorf, L., Azimzadeh, A., Madsen, J. C., Pierson, R. N., et al. (2021). Minimizing Ischemia Reperfusion Injury in Xenotransplantation. Front Immunol. 12: e681504.
- Mihalovic, M. and Tousek, P. (2021). Myocardial Injury after Stroke. J Clin Med. 11(1): 2.
- Severino, P., D’Amato, A., Netti, L., Pucci, M., Infusino, F., Maestrini, V., Mancone, M. and Fedele, F. (2019). Myocardial Ischemia and Diabetes Mellitus: Role of Oxidative Stress in the Connection between Cardiac Metabolism and Coronary Blood Flow. J Diabetes Res. 2019: 1–16.
- Kawabori, M. and Yenari, M. (2015). Inflammatory Responses in Brain Ischemia. Curr Med Chem. 22(10): 1258–1277.
- Kalogeris, T., Baines, C. P., Krenz, M. and Korthuis, R. J. (2012). Cell Biology of Ischemia/Reperfusion Injury. Int Rev Cell Mol Bio. 298 :229–317.
- Nishiyama, S. K., Zhao, J., Wray, D. W. and Richardson, R. S. (2017). Vascular function and endothelin-1: tipping the balance between vasodilation and vasoconstriction. J Appl Physiol. 122(2): 354–360.
- Maguire, J. J. and Davenport, A. P. (2015). Endothelin Receptors and Their Antagonists. Semin Nephrol. 35(2): 125–136.
- Salvatore, S. and Vingolo, E. M. (2010). Endothelin-1 Role in Human Eye: A Review. J Ophthalmol. 2010: 1–10.
- Chavda, V., Patel, S., Alghamdi, B. S. and Ashraf, G. M. (2021). Endothelin-1 induced global ischaemia in adult zebrafish: A model with novel entity of stroke research. J Chem Neuroanat. 118: 102025.
- Dai, P., Huang, H., Zhang, L., He, J., Zhao, X., Yang, F., Zhao, N., Yang, J., Ge, L., Lin, Y., et al. (2017). A pilot study on transient ischemic stroke induced with endothelin-1 in the rhesus monkeys. Sci Rep. 7(1): 45097.
- Ansari, S., Azari, H., Caldwell, K. J., Regenhardt, R. W., Hedna, V. S., Waters, M. F., Hoh, B. L. and Mecca, A. P. (2013). Endothelin-1 Induced Middle Cerebral Artery Occlusion Model for Ischemic Stroke with Laser Doppler Flowmetry Guidance in Rat. J Visualized Exp.: 50014.
- Oglat, A., Matjafri, M., Suardi, N., Oqlat, M., Abdelrahman, M. and Oqlat, A. (2018). A review of medical doppler ultrasonography of blood flow in general and especially in common carotid artery. J Med Ultrasound. 26(1): 3–13.
- Sarkar, S., Ghosh, S., Ghosh, S. K. and Collier, A. (2007). Role of transcranial Doppler ultrasonography in stroke. Postgrad Med J. 83(985): 683–689.
- Purkayastha, S. and Sorond, F. (2013). Transcranial Doppler Ultrasound: Technique and Application. Semin Neurol. 32(4): 411–420.
- Jarrett, C. L., Shields, K. L., Broxterman, R. M., Hydren, J. R., Park, S. H., Gifford, J. R. and Richardson, R. S. (2020). Imaging transcranial Doppler ultrasound to measure middle cerebral artery blood flow: the importance of measuring vessel diameter. Am J Physiol-Reg Integr Comp Physiol 319(1): R33–R42.
- Billinger, S. A. and Kluding, P. M. (2009). Use of Doppler Ultrasound to Assess Femoral Artery Adaptations in the Hemiparetic Limb in People with Stroke. Cerebrovasc Dis. 27(6):552–558.
- Everaars, H., de Waard, G. A., Driessen, R. S., Danad, I., van de Ven, P. M., Raijmakers, P. G., Lammertsma, A. A., van Rossum, A. C., Knaapen, P., van Royen, N., et al. (2018). Doppler Flow Velocity and Thermodilution to Assess Coronary Flow Reserve. JACC-Cardiovasc Inte. 11(20): 2044–2054.
- Vijayan, S., Barmby, D. S., Pearson, I. R., Davies, A. G., Wheatcroft, S. B. and Sivananthan, M. (2017). Assessing Coronary Blood Flow Physiology in the Cardiac Catheterisation Laboratory. Curr Cardiol Rev. 13(3): 232–243.
- Willie, C., Colino, F., Bailey, D., Tzeng, Y., Binsted, G., Jones, L., Haykowsky, M., Bellapart, J., Ogoh, S., Smith, K., et al. (2011). Utility of transcranial Doppler ultrasound for the integrative assessment of cerebrovascular function. J Neurosci Methods. 196(2): 221–237.
- Li, L., Ke, Z., Tong, K. Y. and Ying, M. (2010). Evaluation of Cerebral Blood Flow Changes in Focal Cerebral Ischemia Rats by Using Transcranial Doppler Ultrasonography. Ultrasound Med Biol. 36(4): 595–603.
- Andersen, S. B., Taghavi, I., Hoyos, C. A. V., Søgaard, S. B., Gran, F., Lönn, L., Hansen, K. L., Jensen, J. A., Nielsen, M. B., Sørensen, C. M., et al. (2020). Super-Resolution Imaging with Ultrasound for Visualization of the Renal Microvasculature in Rats Before and After Renal Ischemia: A Pilot Study. Diagnostics 10(11): 862.
- Granata, A., Fiorini, F., Andrulli, S., Logias, F., Gallieni, M., Romano, G., Sicurezza, E. and Fiore, C. (2009). Doppler ultrasound and renal artery stenosis: An overview. J Ultrasound. 12(4): 133–143.
- Fan, J. L., Nogueira, R. C., Brassard, P., Rickards, C. A., Page, M., Nasr, N. and Tzeng, Y. C. (2021). Integrative physiological assessment of cerebral hemodynamics and metabolism in acute ischemic stroke. J Cerebr Blood F Met. 42(3): 454–470.
- Shahripour, R. B., Azarpazhooh, M. R., Akhuanzada, H., Labin, E., Borhani‐Haghighi, A., Agrawal, K., Meyer, D., Meyer, B. and Hemmen, T. (2021). Transcranial Doppler to evaluate postreperfusion therapy following acute ischemic stroke: A literature review. J Neuroimaging. 31(5): 849–857.
- Melake, A. and Berhane, N. (2023). Angiotensin-converting enzyme gene insertion/deletion polymorphism and risk of ischemic stroke complication among patients with hypertension in the Ethiopian population. Front Neurol. 14: e1093993.
- Tong, Y., Yin, X., Wang, Z., Zhan, F., Zhang, Y., Ye, J., Hou, S., Geng, Y., Li, Y., Guan, X., et al. (2013). A tailed primers protocol to identify the association of eNOS gene variable number of tandem repeats polymorphism with ischemic stroke in Chinese Han population by capillary electrophoresis. Gene. 517(2): 218–223.
- Li, X., Zhang, J., Wang, Q., Xiang, L. and Dong, J. (2023). Rehabilitation Training Can Significantly Increase the Serum IL-11 Levels and Improve the Prognosis in Ischemic Stroke Patients. Mediators Inflammation. 2023: 1–7.
- Pei, X., Li, Y., Zhu, L. and Zhou, Z. (2019). Astrocyte-derived exosomes suppress autophagy and ameliorate neuronal damage in experimental ischemic stroke. Exp Cell Res. 382(2): 111474.
- Chen, A. Q., Fang, Z., Chen, X. L., Yang, S., Zhou, Y. F., Mao, L., Xia, Y. P., Jin, H. J., Li, Y. N., You, M. F., et al. (2019). Microglia-derived TNF-α mediates endothelial necroptosis aggravating blood brain–barrier disruption after ischemic stroke. Cell Death Dis. 10(7): 487.
- D’Andrea, A., Sperlongano, S., Pacileo, M., Venturini, E., Iannuzzo, G., Gentile, M., Sperlongano, R., Vitale, G., Maglione, M., Cice, G., et al. (2020). New Ultrasound Technologies for Ischemic Heart Disease Assessment and Monitoring in Cardiac Rehabilitation. J Clin Med. 9(10): 3131.
- Correale, M., Totaro, A., Ieva, R., Ferraretti, A., Musaico, F. and Di Biase, M. (2012). Tissue Doppler Imaging in Coronary Artery Diseases and Heart Failure. Curr Cardiol Rev. 8(1): 43–53.
- Li, P., Hu, X., Gan, Y., Gao, Y., Liang, W. and Chen, J. (2011). Mechanistic Insight into DNA Damage and Repair in Ischemic Stroke: Exploiting the Base Excision Repair Pathway as a Model of Neuroprotection. Antioxid Redox Sign. 14(10): 1905–1918.
- Li, W., Liu, D., Xu, J., Zha, J., Wang, C., An, J., Xie, Z. and Qiao, S. (2022). Astrocyte-Derived TNF-α-Activated Platelets Promote Cerebral Ischemia/Reperfusion Injury by Regulating the RIP1/RIP3/AKT Signaling Pathway. Mol Neurobiol. 59(9): 5734–5749.
- Mo, Z. T., Zheng, J. and Liao, Y. l. (2021). Icariin inhibits the expression of IL-1β, IL-6 and TNF-α induced by OGD/R through the IRE1/XBP1s pathway in microglia. Pharm Biol. 59(1): 1471–1477.
- Rendevski, V., Aleksovski, B., Stojanov, D., Mihajlovska-Rendevska, A., Aleksovski, V., Baneva–Dolnenec, N., Nikodijevic, D. and Gudeva-Nikovska, D. (2017). Validation of the ELISA Method for Quantitative Detection of TNF-α in Patients with Intracerebral Hemorrhage. Open Access Maced J Med Sci. 5(6): 703–707.
- Pan, J., Peng, J., Li, X., Wang, H., Rong, X. and Peng, Y. (2023). Transmission of NLRP3-IL-1β Signals in Cerebral Ischemia and Reperfusion Injury: from Microglia to Adjacent Neuron and Endothelial Cells via IL-1β/IL-1R1/TRAF6. Mol Neurobiol.: 2749–2766.
- Xu, D., Kong, T., Shao, Z., Liu, M., Zhang, R., Zhang, S., Kong, Q., Chen, J., Cheng, B., Wang, C., et al. (2021). Orexin-A alleviates astrocytic apoptosis and inflammation via inhibiting OX1R-mediated NF-κB and MAPK signaling pathways in cerebral ischemia/reperfusion injury. BBA-Mol Basis Dis. 1867(11): 166230.
- Ko, S. F., Sung, P. H., Yang, C. C., Chiang, J. Y. and Yip, H. K. (2023). Combined therapy with dapagliflozin and entresto offers an additional benefit on improving the heart function in rat after ischemia-reperfusion injury. Biomed J. 46(3): 100546.
- Yip, H. K., Yuen, C. M., Chen, K. H., Chai, H. T., Chung, S. Y., Tong, M. S., Chen, S. Y., Kao, G. S., Chen, C. H., Chen, Y. L., et al. (2016). Tissue plasminogen activator deficiency preserves neurological function and protects against murine acute ischemic stroke. Int J Cardiol. 205: 133–141.
- Liu, J., Luo, Q., Ke, J., Zhang, D., Xu, Y., Liao, W., Chen, X. and Zhang, X. (2023). Enriched Environment Attenuates Ferroptosis after Cerebral Ischemia/Reperfusion Injury via the HIF-1α-ACSL4 Pathway. Oxid Med Cell Longevity. 2023: 1–14.
- Fu, Z. J., Wang, Z. Y., Xu, L., Chen, X. H., Li, X. X., Liao, W. T., Ma, H. K., Jiang, M. D., Xu, T. T., Xu, J., et al. (2020). HIF-1α-BNIP3-mediated mitophagy in tubular cells protects against renal ischemia/reperfusion injury. Redox Biol. 36: 101671.
- Baldari, B., De Simone, S., Cipolloni, L., Frisoni, P., Alfieri, L., D’Errico, S., Fineschi, V., Turillazzi, E., Greco, P., Vitagliano, A., et al. (2023). Oxidative Stress Markers in Human Brain and Placenta May Reveal the Timing of Hypoxic-Ischemic Injury: Evidence from an Immunohistochemical Study. Int J Mol Sci. 24(15): 12221.
- Yingze, Y., Zhihong, J., Tong, J., Yina, L., Zhi, Z., Xu, Z., Xiaoxing, X. and Lijuan, G. (2022). NOX2-mediated reactive oxygen species are double-edged swords in focal cerebral ischemia in mice. J Neuroinflammation. 19(1): 184.
- Peng, X. Y., Yuan, B., Li, X. L., Bao, Y. C., Luo, W. J., Zhang, Y. J., Zhao, M. and Wang, J. H. (2023). [Study on alleviating neuroinflammatory injury in ischemic stroke rats by electrical stimulation with scalp acupuncture based on IFN-γ mediated JAK/STAT1 signaling pathway]. Zhen Ci Yan Jiu [Chinese]. 48(9): 852–859.
- Zhu, H., Jian, Z., Zhong, Y., Ye, Y., Zhang, Y., Hu, X., Pu, B., Gu, L. and Xiong, X. (2021). Janus Kinase Inhibition Ameliorates Ischemic Stroke Injury and Neuroinflammation Through Reducing NLRP3 Inflammasome Activation via JAK2/STAT3 Pathway Inhibition. Front Immunol. 12: e714943.
- Li, W., Gou, X., Xu, D., Zhou, L., Li, F., Ye, A., Hu, Y. and Li, Y. (2022). Therapeutic effects of JLX001 on neuronal necroptosis after cerebral ischemia–reperfusion in rats. Exp Brain Res. 240(12): 3167–3182.
- Zhao, G., Zhao, L., Li, Y., Wang, L. and Hu, Z. (2022). Influences of edaravone on necroptosis-related proteins and oxidative stress in rats with lower extremity ischemia/reperfusion injury. Cell Mol Biol. 68(7): 95–100.
- Yilmaz, U., Tanbek, K., Gul, S., Gul, M., Koc, A. and Sandal, S. (2023). Melatonin Attenuates Cerebral Ischemia/Reperfusion Injury through Inducing Autophagy. Neuroendocrinology. 113(10): 1035–1050.
- Hosseini, A., Pourheidar, E., Rajabian, A., Asadpour, E., Hosseinzadeh, H. and Sadeghnia, H. R. (2022). Linalool attenuated ischemic injury in PC12 cells through inhibition of caspase‐3 and caspase‐9 during apoptosis. Food Sci Nutr. 11(1): 249–260.
- Tan, Z., Dong, F., Wu, L., Feng, Y., Zhang, M. and Zhang, F. (2023). Transcutaneous Electrical Nerve Stimulation (TENS) Alleviates Brain Ischemic Injury by Regulating Neuronal Oxidative Stress, Pyroptosis, and Mitophagy. Mediat Inflamm. 2023: 1–13.
- Ma, Y., Li, C., He, Y., Fu, T., Song, L., Ye, Q. and Zhang, F. (2022). Beclin-1/LC3-II dependent macroautophagy was uninfluenced in ischemia-challenged vascular endothelial cells. Genes Dis. 9(2): 549–561.
- Chen, Y., He, W., Wei, H., Chang, C., Yang, L., Meng, J., Long, T., Xu, Q. and Zhang, C. (2023). Srs11‐92, a ferrostatin‐1 analog, improves oxidative stress and neuroinflammation via Nrf2 signal following cerebral ischemia/reperfusion injury. CNS Neurosci Ther. 29(6): 1667–1677.
- Shu, B., Wan, J., Li, X., Liu, R., Xu, C., An, Y. and Chen, J. (2022). Preconditioning with Trehalose Protects the Bone Marrow-Derived Mesenchymal Stem Cells Under Oxidative Stress and Enhances the Stem Cell-Based Therapy for Cerebral Ischemic Stroke. Cell Reprogram. 24(3): 118–131.
- Yao, X., Yang, W., Ren, Z., Zhang, H., Shi, D., Li, Y., Yu, Z., Guo, Q., Yang, G., Gu, Y., et al. (2021). Neuroprotective and Angiogenesis Effects of Levetiracetam Following Ischemic Stroke in Rats. Front Pharmacol. 12: e638209.
- Svensson, M., Rosvall, P., Boza-Serrano, A., Andersson, E., Lexell, J. and Deierborg, T. (2016). Forced treadmill exercise can induce stress and increase neuronal damage in a mouse model of global cerebral ischemia. Neurobiol Stress. 5: 8–18.
- Zhang, Y. Y., Liu, W. N., Li, Y. Q., Zhang, X. J., Yang, J., Luo, X. J. and Peng, J. (2019). Ligustroflavone reduces necroptosis in rat brain after ischemic stroke through targeting RIPK1/RIPK3/MLKL pathway. Naunyn-Schmiedeberg's Arch Pharmacol. 392(9): 1085–1095.
- Ji, W., Ren, Y., Wei, X., Ding, X., Dong, Y. and Yuan, B. (2023). Ischemic stroke protected by ISO-1 inhibition of apoptosis via mitochondrial pathway. Sci Rep. 13(1): 2788.
- Luo, H., Huang, D., Tang, X., Liu, Y., Luo, Q., Liu, C., Huang, H., Chen, W. and Qi, Z. (2022). Beclin‑1 exerts protective effects against cerebral ischemia‑reperfusion injury by promoting DNA damage repair through a non‑autophagy‑dependent regulatory mechanism. Int J Mol Med. 49(5): e5117.
- Amalia, L., Sadeli, H. A., Parwati, I., Rizal, A. and Panigoro, R. (2020). Hypoxia-inducible factor-1α in acute ischemic stroke: neuroprotection for better clinical outcome. Heliyon. 6(6): e04286.
Supplementary information
The following supporting information can be downloaded here:
- Figure S1. An illustrative schematic of the Doppler blood flow imaging system, accompanied by annotations
- Figure S2. Picture showing the arterial system of a 3-day-old chicken embryo before injecting ET-1 and at 1 h intervals until 8 h of ischemia
- Table S1. Lysis buffer
- Table S2. Resolving gel preparation
- Table S3. Stacking gel preparation
- Table S4. 1× running buffer
- Table S6. 10× TBS-T buffer
- Table S5. 1× transfer buffer
Article Information
Publication history
Received: May 21, 2024
Accepted: Jul 24, 2024
Available online: Aug 9, 2024
Published: Sep 5, 2024
Copyright
© 2024 The Author(s); This is an open access article under the CC BY-NC license (https://creativecommons.org/licenses/by-nc/4.0/).
How to cite
Kumari, N., Prakash, R., Siddiqui, A. J., Waseem, A., Khan, M. A. and Raza, S. S. (2024). Endothelin-1-Induced Persistent Ischemia in a Chicken Embryo Model. Bio-protocol 14(17): e5061. DOI: 10.21769/BioProtoc.5061.
Category
Medicine > Cardiovascular system
Cell Biology > Tissue analysis > Tissue imaging
Cell Biology > Model organism culture > Embryo selection
Do you have any questions about this protocol?
Post your question to gather feedback from the community. We will also invite the authors of this article to respond.
![]() Tips for asking effective questions
Tips for asking effective questions
+ Description
Write a detailed description. Include all information that will help others answer your question including experimental processes, conditions, and relevant images.