- Protocols

- Articles and Issues
- For Authors
- About
- Become a Reviewer

Quantitative Measurement of Plasma Membrane Protein Internalisation and Recycling in Heterogenous Cellular Samples by Flow Cytometry
Published: Vol 14, Iss 9, May 5, 2024 DOI: 10.21769/BioProtoc.4986 Views: 2253
Reviewed by: Keisuke TabataYu Hui KangAndrea GramaticaAnonymous reviewer(s)
Original research article
The authors used this protocol in:

Sep 2022

Protocol Collections
Comprehensive collections of detailed, peer-reviewed protocols focusing on specific topics


Related protocols
Abstract
Plasma membrane proteins mediate important aspects of physiology, including nutrient acquisition, cell–cell interactions, and monitoring homeostasis. The trafficking of these proteins, involving internalisation from and/or recycling back to the cell surface, is often critical to their functions. These processes can vary among different proteins and cell types and states and are still being elucidated. Current strategies to measure surface protein internalisation and recycling are typically microscopy or biochemical assays; these are accurate but generally limited to analysing a homogenous cell population and are often low throughput. Here, we present flow cytometry–based methods involving probe-conjugated antibodies that enable quantification of internalisation or recycling rates at the single-cell level in complex samples. To measure internalisation, we detail an assay where the protein of interest is labelled with a specific antibody conjugated to a fluorescent oligonucleotide-labelled probe. To measure recycling, a specific antibody conjugated to a cleavable biotin group is employed. These probes permit the differentiation of molecules that have been internalised or recycled from those that have not. When combined with cell-specific marker panels, these methods allow the quantitative study of plasma membrane protein trafficking dynamics in a heterogenous cell mixture at the single-cell level.
Key features
• These assays allow sensitive quantification of internalised or recycled surface molecules using oligonucleotide or cleavable biotin-conjugated probes, respectively, and detected by flow cytometry.
• They can be adapted to any membrane protein that transits via the cell surface and for which a specific purified antibody is available.
• The dynamics of a cell surface protein can be measured in heterogenous cell populations simultaneously, including various cellular activation states.
• The internalisation assay builds upon the method developed by Liu et al. [1,2] and extends its application to heterogenous human peripheral blood mononuclear cells.
• These assays have been extensively used on suspension cells but have not been tested on adherent cells.
Keywords: Plasma membraneBackground
Cell surface proteins mediate many important physiological functions. How long they dwell at the cell surface is critical to their activity, and this is defined by a dynamic process of internalisation and often recycling from within the endosomal compartment back to the plasma membrane. For example, diverse cells display major histocompatibility complex (MHC) proteins, which allow patrolling T lymphocytes to monitor for pathogens or cancer [3]. MHC proteins are regulated by distinct mechanisms, and this can vary depending on the cell type or activation state [4–6]. Such protein trafficking is still being understood for diverse cell types; therefore, accurate methods are required.
Two major strategies to accurately quantify surface protein internalisation and recycling are microscopy-based or biochemical assays, but these have limitations. Microscopy allows the visualisation of subcellular localisation of the labelled surface molecule. However, it can be challenging to track molecules of low abundance or to differentiate internalised from surface molecules, especially at low resolution [7]. Further, microscopy can only accommodate a limited number of cells, and biochemical methods generally observe the sum of a single-cell population, making the analysis of specific cells in heterogenous samples impractical.
Here, we describe methods to quantitate the internalisation and recycling of membrane proteins in different cell types using functional probes conjugated to specific antibodies and detected by flow cytometry [4]. When combined with specific markers to differentiate cell types, protein dynamics can be analysed in a complex cell mixture at the single-cell level. Similar flow cytometry–based assays involve acid stripping the cell surface, but these have been shown to be harsh on cells, destroying some epitopes that prevent cell phenotyping, and lead to undesired cellular activation [8–11]. Here, we detail assays that allow gentle, rapid, and quantitative measurement of cell surface protein trafficking.
For internalisation, we detail the method developed by Liu et al. [1,2]. A fluorophore-labelled oligonucleotide is conjugated to a surface protein-specific antibody, termed the fluorescent internalisation probe (FIP) (Figure 1A). Cells are labelled and then allowed to internalise their labelled surface cargo. The fluorescence of the FIP-labelled proteins remaining on the cell surface is quenched with a complementary oligonucleotide-conjugated quencher, leaving only the internalised molecules fluorescent. Hence the cellular fluorescence remaining after quenching reflects the internalised molecules at each time point (Figure 1A).
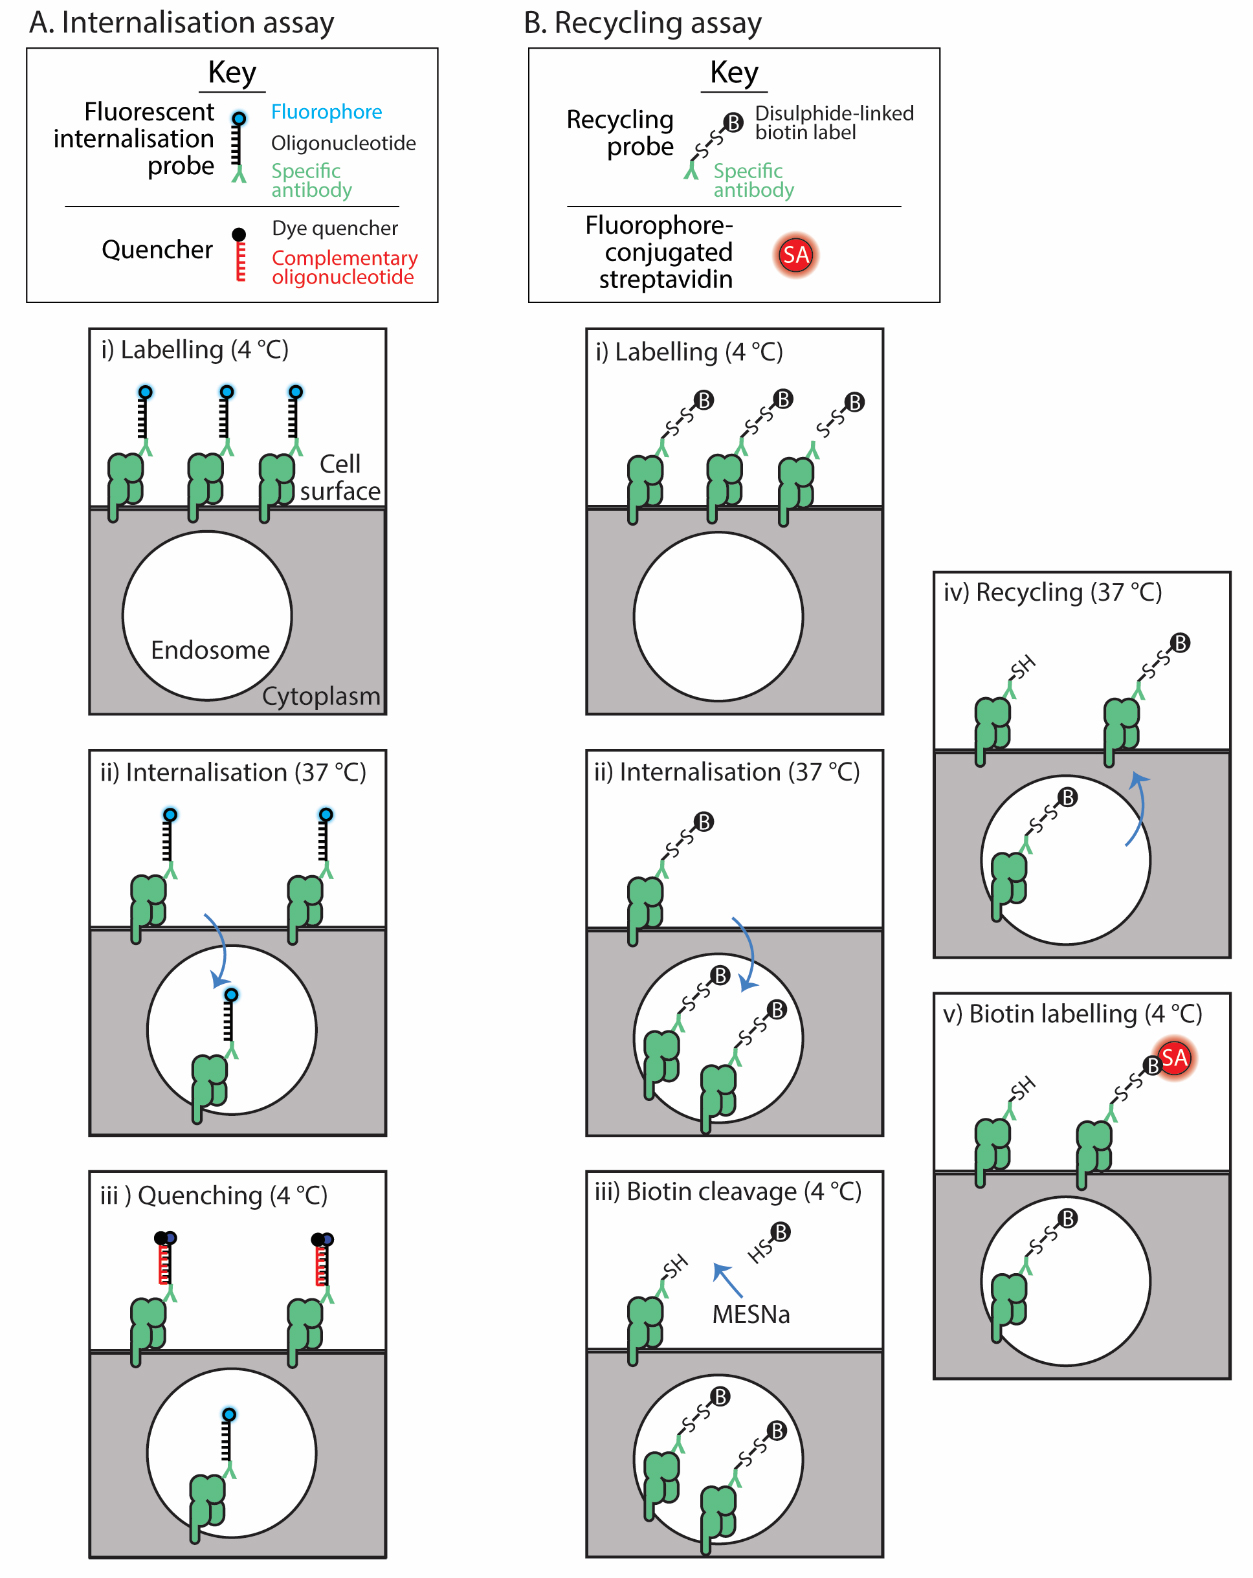
Figure 1. Assay schematics. The internalisation assay (A) employs the fluorescent internalisation probe to label the surface protein of interest (i); then, after a cohort of these internalise (ii), a quencher distinguishes those that remain on the surface from those internalised (iii). The recycling assay (B) uses a recycling probe to label the surface protein (i); then, these are allowed to internalise (ii). The label on the probe bound to those remaining on the surface is cleaved (iii) and then recycling is allowed to occur (iv). Finally, those molecules that recycled are detected with fluorescently labelled streptavidin (SA) (v).
For recycling, a biochemical assay is adapted for flow cytometry [12,13]. Surface proteins are labelled with an antibody conjugated to a cleavable biotin group (Figure 1B). Proteins are allowed to internalise; then, the biotin tag is cleaved from non-internalised proteins with a membrane-impermeable reducing reagent. Proteins are allowed to recycle, and then any biotin probe–labelled proteins that re-emerge from inside the cell are detected with fluorophore-conjugated streptavidin. This assay then calculates the proportion of original surface molecules that recycle after a defined period of internalisation [4,14].
With these methods, we have measured the internalisation and recycling of the MHC class I-related protein 1 (MR1) and transferrin receptor in a range of cell types including peripheral blood mononucleated cells (PBMC) [4,14]. These methods can be used to study any membrane protein of interest in suspension cells but may also be adapted to adherent cells.
Materials and reagents
Biological materials
Human peripheral mononucleated cells (PBMCs) are isolated from buffy coats using Ficoll Paque PLUS (Cytiva, catalog number: 17144002) according to the manufacturer’s instructions. Buffy coats from healthy human donors were obtained from the Australia Red Cross Blood Service with written and informed consent and with ethics approval from the University of Melbourne Human Research and Ethics Committee (#1035100).
Reagents
RPMI 1640 medium (Gibco, catalog number: 11875093)
Fetal bovine serum (FBS) (Gibco, catalog number: 5256701). Heat-inactivate at 56 °C for 30 min with interval mixing and store at -20 °C
Ethylenediaminetetraacetic acid-balanced salt solution (EDTA-BSS): 147 mM NaCl, 3.6 mM KCl, 0.01 mM KH2PO4, 0.02 mM K2HPO4, 14.5 mM HEPES, 6 mM EDTA (prepared in-house by dissolving each chemical in distilled water)
Phosphate buffered saline (PBS), pH 7.4 (Thermo Fisher, catalog number: 10010023)
10 mM sodium bicarbonate, pH 8.0, diluted from 1 M (Thermo Fisher Scientific, catalog number: J62495.AP)
Purified antibody specific for the cell surface protein to be assessed for internalisation or recycling (at a concentration of at least 2 mg/mL)
Cell type–specific surface markers for cell phenotyping, e.g.:
PerCP conjugated anti-CD3 (BD, catalog number: 345766)
BUV805 conjugated anti-CD14 (BD Horizon, catalog number: 612902)
Fixable viability dye eFluor780 (eBioscience, catalog number: 65-0865-14)
Click-iTTM sDIBO Alkynes (Invitrogen, catalog number: C20025), dissolved in anhydrous DMSO at 1 mg/mL
Cy5-oligo-azide (5' Cy5-TCA GTT CAG GAC CCT CGG CT-N3 3') (Integrated DNA Technologies), dissolved at 150 μM in nuclease-free water and stored at -20 °C
Quencher (5' AGC CGA GGG TCC TGA ACT GA-BHQ2 3') (Integrated DNA Technologies), dissolved at 600 μM in nuclease-free water and stored at -20 °C
EZ-LinkTM Sulfo-NHS-SS-Biotin (Thermo Fisher Scientific, catalog number: 21331)
Streptavidin-phycoerythrin (PE) (BioLegend, catalog number: 405203)
1 M Tris buffer, pH 8.0 (prepared in-house by dissolving Tris in distilled water and then adjusting pH with 1 M hydrochloric acid)
Sodium chloride (NaCl) (Spectrum Chemical, catalog number: SO160)
0.5 M EDTA, pH 8.0 (prepared in-house by stirring the required amount of EDTA powder in distilled water and then adjusting pH with solid sodium hydroxide pellets)
Bovine serum albumin (BSA) (Sigma-Aldrich, catalog number: A7906)
Sodium 2-mercaptoethanesulfonate (MESNa) (Sigma-Aldrich, catalog number: M1511)
Zeba spin desalting column (7K, MWCO 0.5 mL) (Thermo Fisher Scientific, catalog number: 89882)
Amicon Ultra centrifugal filters (30 kDa, MWCO 0.5 mL) (Millipore, catalog number: UFC5030)
Low-protein binding 1.5 mL centrifuge tubes (Thermo Scientific, catalog number: 90410)
Round bottom 96-well plates (Corning, catalog number: 3799)
Cell culture media (see Recipes)
Staining buffer (see Recipes)
Recycling assay buffer 1 (see Recipes)
Recycling assay buffer 2 (see Recipes)
MESNa incubation buffer (see Recipes)
Cell surface marker staining solution (see Recipes)
Recipes
Cell culture media (500 mL)
Note: Store at 4 °C.
Reagent Final concentration Quantity or Volume RPMI 1640 n/a 450 mL FBS 10% (v/v) 50 mL Total n/a 500 mL Staining buffer (510 mL)
Note: Store at 4 °C.
Reagent Final concentration Quantity or Volume EDTA-BSS n/a 500 mL FBS 2% (v/v) 10 mL Total n/a 510 mL Recycling assay buffer 1 (500 mL)
Note: Dissolve the NaCl completely in milli-Q water before adding to the solution. Store at room temperature.
Reagent Final concentration Quantity or Volume 1 M Tris buffer, pH 8.0 50 mM 25 mL NaCl 100 mM 2.9 g 0.5 M EDTA, pH 8.0 1 mM 1 mL Milli-Q water Top up to 500 mL Total n/a 500 mL Recycling assay buffer 2 (50 mL)
Note: Prepare on the day of the assay. Scale down or up as required.
Reagent Final concentration Quantity or Volume Recycling assay buffer 1 n/a 50 mL BSA 0.2 % (w/v) 0.1 g Total n/a 50 mL MESNa incubation buffer (2 mL)
Note: Prepare on the day of the assay. Scale down or up as required.
Reagent Final concentration Quantity or Volume Recycling assay buffer 2 n/a 2 mL MESN 100 mM 0.033 g Total n/a 2 mL Cell surface marker staining solution
Note: Prepare on the day of the assay. Scale down or up as required. Replace with antibodies to differentiate your cells of interest.
Reagent Dilution Volume PerCP conjugated anti-CD3 1:50 20 μL BUV805 conjugated anti-CD14 1:200 5 μL Fixable viability dye 1:1,000 1 μL Staining buffer n/a 1,000 μL
Equipment
Air-cooled benchtop centrifuge (Beckman Coulter, model: Microfuge 22R Centrifuge)
Cell culture incubator at 37 °C and 5%–10% CO2 (dependent on the recommended CO2 level for your cells or media)
Flow cytometer (BD, model: LSR Fortessa FACS Calibur)
Software and datasets
FlowJo (version 10.4, 09/15/2017); can be purchased and downloaded online from https://www.flowjo.com/solutions/flowjo/downloads
Graph Pad Prism (version 10.1.0, 10/19/2023); can be purchased and downloaded online from https://www.graphpad.com
Procedure
Probe preparation
FIP
Overview: FIP is prepared by conjugating the antibody with Cy5-oligo using click chemistry of Click-iTTM sDIBO Alkyne and the azide group.
Dilute 200 μg of antibody to 2 mg/mL in 10 mM sodium bicarbonate (pH 8.0).
Add 7 μL of Click-iTTM sDIBO Alkyne and incubate for 2 h at 4 °C.
Remove the bottom closure of 7K Zeba spin desalting column and place it in a 1.5 mL tube.
Centrifuge the column at 1500× g for 1 min and discard the storage solution.
Add 300 μL of PBS to the column and centrifuge at 1500× g for 1 min. Discard flowthrough. Repeat twice.
Place the column in a 1.5 mL low-protein binding tube and add the protein-DIBO solution.
Centrifuge at 1500× g for 2 min and collect the eluate (containing the DIBO-labelled antibody eluate).
Add 20 μL of Cy5-oligo-azide to the eluate and incubate for at least 2 h (or ideally overnight) at 4 °C. This allows the reaction of conjugating the Cy5-oligo-azide to the DIBO-antibody forming the FIP.
Equilibrate the Amicon Ultra centrifugal filter by adding 500 μL of PBS and centrifuging at 13,000× g for 1 min. Discard flowthrough and any remaining PBS in the filter.
Top up the FIP solution (from step A8) to 500 μL in total with PBS.
Add to the Amicon Ultra centrifugal filter and centrifuge at 13,000× g for 5 min to remove excess unconjugated reagents. Discard flowthrough.
Repeat step A11 by rinsing the filter with 500 µL of PBS until the flowthrough is clear (approximately three washes).
Recover the purified FIP by placing the filter upside down in a new 2 mL tube and centrifuge at 1,000× g for 2 min.
Store the FIP in the dark at 4 °C for short-term use (<2 weeks) or aliquot and store at -20 °C for long-term storage.
FIP should be titrated to find the optimal staining dilution prior to beginning the assay as for normal flow cytometry antibodies (See Troubleshooting 2).
Recycling probe
Overview: Recycling probe is prepared by biotinylating antibody with EZ-LinkTM Sulfo-NHS-SS-Biotin that reacts with the primary amines on the antibody.
Dilute 200 μg of antibody to 2 mg/mL in PBS.
Prepare a 10 mM solution of Sulfo-NHS-SS-Biotin according to the manufacturer’s instructions.
Add 2.7 μL of Sulfo-NHS-SS-Biotin to the antibody (step B1).
Incubate the reaction on ice for 2 h to allow the conjugation of the Sulfo-NHS-SS-Biotin to the antibody.
Remove the bottom closure of 7K Zeba spin desalting column and place it in a 1.5 mL tube.
Centrifuge the column at 1,500× g for 1 min and discard the storage solution.
Add 300 μL of PBS, centrifuge at 1,500× g for 1 min, and discard flowthrough. Repeat twice.
Place column in a 1.5 mL low-protein binding tube and add the protein/Sulfo-NHS-SS-Biotin solution. Centrifuge at 1,500× g for 2 min and collect the antibody-SS-Biotin (the recycling probe) in the eluate.
Store the recycling probe in the dark at 4 °C for short-term use (<2 weeks) or aliquot and store at -20 °C for long-term storage.
Recycling probe should be titrated to find the optimal staining dilution prior to beginning the assay as for normal flow cytometry antibodies (See Troubleshooting 2).
Surface protein labelling
Prechill the centrifuge, plates, tubes, and solutions at 4 °C.
Add cells in 2 million cells per millilitre of suspension in cell culture media to a 1.5 mL centrifuge tube. Centrifuge at 620× g for 2 min. Wash cells once with staining buffer after removing supernatant.
Stain the cells with FIP diluted in staining buffer on ice for 20 min.
Wash the cells twice with ice-cold staining buffer.
Resuspend the cells in prechilled cell culture media at 2 million cells per millilitre.
Internalisation at 37 °C
Transfer 100 µL of the cell suspension (200,000 cells) into the appropriate wells of 96-round-bottom plates, on ice. Use two plates and perform each sample/time point in triplicate:
Plate 1 (control plate, always on ice) requires two control samples:
Tint = 0 –Q: Cells are not allowed to internalise and are not treated with quencher (Q).
Tint = 0 +Q: Background control—cells are not allowed to internalise and are treated with Q.
Plate 2 (internalisation plate, always in incubator at 37 °C).
Tint = X +Q: Internalisation sample where cells are allowed to internalise for X time. Repeat for each time point.
Keep Plate 1 on ice. Incubate Plate 2 at 37 °C for the desired duration for internalisation to occur.
Transfer Tint = X +Q samples from Plate 2 to Plate 1 (on ice) at the end of each time point, terminating internalisation for that sample.
Quenching the un-internalised labelled protein and cell phenotyping surface marker staining
At this point, only Plate 1 remains. Wash the cells by adding 150 μL of ice-cold staining buffer to each well. Centrifuge the plate at 300× g for 5 min. Decant the supernatant. Repeat the wash.
Resuspend the cells in cell surface marker staining solution with or without Q (dilution 1/1,000) as indicated and incubate on ice for 15 min.
Wash twice with ice-cold staining buffer.
Measuring the percentage of internalised protein of interest
Run the cells on a flow cytometer.
Measure the geometric mean fluorescent intensity (gMFI) of the Cy5 (FIP) for each cell population using FlowJo (refer to Figure 2 for typical results). Calculate internalisation (see Data Analysis 1).
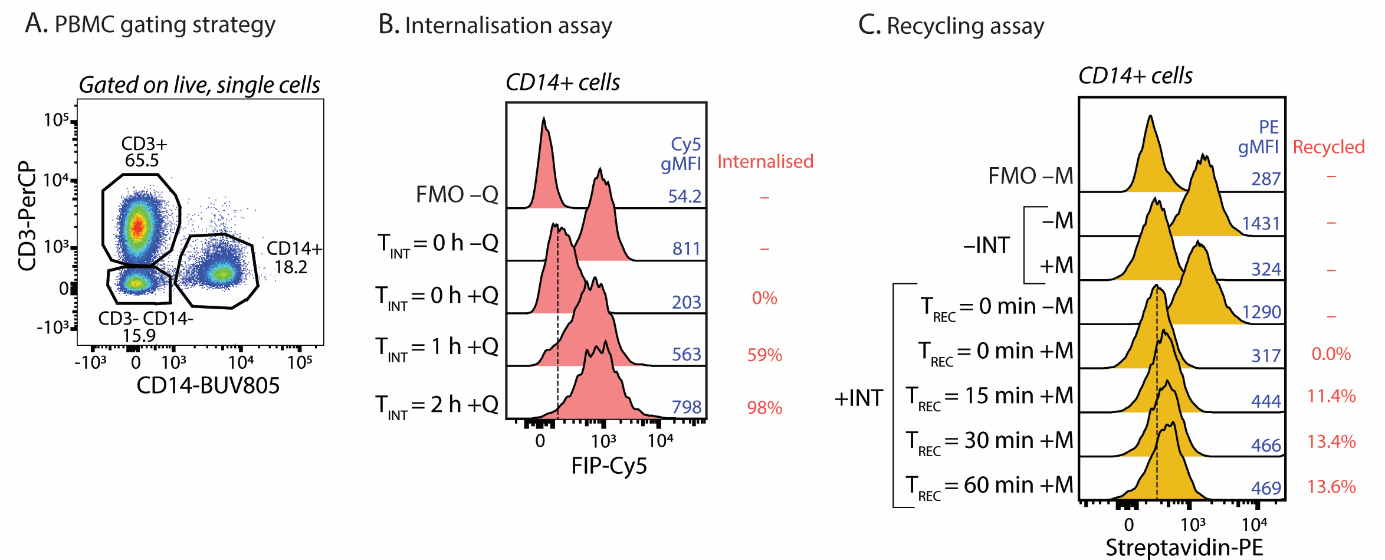
Figure 2. Results from the internalisation or recycling assays for major histocompatibility complex (MHC) class I related protein 1 (MR1) using human peripheral blood mononucleated cells (PBMCs). (A) T cells and monocytes can be differentiated based on markers CD3 and CD14. The percentage of each population is shown in the plot. After identifying the cell population, (B) the fluorescence internalisation probe Cy5 signal (FIP-Cy5, using the antibody clone 8F2.F9 specific for MR1) for the internalisation assay or (C) the recycling probe–labelled Streptavidin-PE (using antibody clone 8F2.F9) for the recycling can be measured by flow cytometry. With the corresponding controls [Tint = 0 with and without quencher (Q) or MESNa cleavage (M)], the percentage of internalised or recycled molecules can be calculated. TINT indicates internalisation time. TREC indicates recycling time. Fluorescence minus one (FMO) indicates where the cells were stained with cell phenotyping antibodies and secondary staining but not FIP-Cy5 (B) or recycling probe (C). FMO served as the background control for the spread of signal in the multicolour panel and to know the quenching or cleaving effect in internalisation and recycling assays, respectively. Shown here for each assay, the typical results of one experiment (representing > 10) are shown by the geometric mean fluorescence (gMFI) and the calculated proportion of molecules that have been internalised (B) or recycled (C).
Recycling assay
Surface protein labelling
Prechill the centrifuge, plates, tubes, and solutions at 4 °C.
Add cells in 2 million cells per millilitre of suspension in cell culture media to a 1.5 mL centrifuge tube. Centrifuge at 620× g for 2 min. Wash cells once with staining buffer after removing the supernatant.
Stain the cells with staining buffer with the recycling probe on ice for 20 min.
Wash the cells twice with ice-cold staining buffer.
Resuspend the cells in prechilled cell culture media at 2 million cells per millilitre.
Internalisation at 37 °C
Transfer 100 µL of the cell suspension (200,000 cells) into the appropriate wells of 96-round-bottom plates, on ice. Use two plates and perform each sample/time point in triplicate:
Plate 1 (control plate, always on ice) requires one control sample:
–INT –M: Cells are not allowed to internalise (INT) and are not treated with MESNa (M).
Plate 2 (internalisation/recycling plate, always in incubator at 37 °C except for Step C).
+INT +M Trec = 0: Background control—Cells are allowed to internalise, treated with M, but not allowed to recycle.
+INT +M Trec = X: Cells are allowed to internalise, treated with M, and then allowed to recycle for time X. Repeat for each time point.
Keep Plate 1 on ice. Incubate Plate 2 at 37 °C for the desired duration for internalisation to occur (typically 20–120 min). The optimal time for internalisation is the time required for a significant amount to be internalised—typically ~50%–100%; for MR1, this is 1 h (Figure 2B). This should be empirically tested for each molecule and cell type.
Cleaving biotin from the un-internalised labelled protein
Note: This step is conducted on all +M samples in plate 1 and 2 on ice.
Wash the +M samples once by pelleting down the cells by centrifuging at 300× g for 5 min and adding 200 µL of ice-cold recycling assay buffer 1 to the cell pellet in each well. Centrifuge again and decant the supernatant.
Resuspend the +M samples in 40 µL of ice-cold MESNA incubation buffer.
Incubate for 10 min on ice.
Wash the +M samples once with ice-cold recycling assay buffer 2.
Repeat steps C2–C4 once.
Wash once with culture media. Resuspend cells in culture media.
Transfer +INT +M Trec = 0 samples from Plate 2 to Plate 1 (on ice) at the end of the internalisation and keep on ice.
Recycling at 37 °C
Note: At this point, only Trec = X samples remain in Plate 2.
Incubate samples remaining in Plate 2 at 37 °C for time X, to allow recycling of the protein to occur.
At the end of each incubation, transfer the samples to Plate 1 on ice.
Staining of the recycled labelled protein and cell phenotyping surface marker staining
Wash all the samples twice with ice-cold staining buffer.
Resuspend the cells in cell phenotyping staining solution including Streptavidin-PE (1:200) and incubate on ice for 15 min.
Wash twice with ice-cold staining buffer.
Measuring the percentage of internalised protein of interest
Run the cells on flow cytometer.
Measure the gMFI of PE of each cell population using FlowJo (refer to Figure 2 for typical results). Calculate recycling (see Data Analysis 2).
Data analysis
Calculate the percentage of protein internalisation and recycling based on the ratio of the signal measured at the desired time point comparing to the total signal collected at time point 0 (when no internalisation/recycling occurs). Remove background signal in the calculation by subtracting the background control from these values.
Calculate the percentage of internalised protein at each internalisation time point (TINT = X) as a fraction of the surface level before internalisation, subtracting the background signal (TINT = 0+Q); where Q = quencher:

Calculate the percentage of recycled protein at each recycling time point (Trec = X) as a fraction of the surface level before internalisation (–INT –M), subtracting the background signal (+INT +M Trec = 0); where M = MESNa; INT = internalisation step:

Plot a time-course line graph using Graph Pad Prism if membrane protein internalisation or recycling are examined at multiple time points.
Validation of protocol
This protocol or parts of it has been used and validated in the following research article(s):
Lim et al. [15] “A specialized tyrosine-based endocytosis signal in MR1 controls antigen presentation to MAIT cells”, (Journal of Cell Biology), Figure 1A-C, 2D-E, 2H, 3F-G, 7B-C. Performed on human PBMC, human B lymphoblast cells line C1R cells and human monocyte cell line THP-1 cells.
McWilliam et al. [16] “The intracellular pathway for the presentation of vitamin B–related antigens by the antigen-presenting molecule MR1” (Nature Immunology), Figure 5A. Performed on human C1R cell line.
Howson et al. [17] “Absence of mucosal-associated invariant T cells in a person with a homozygous point mutation in MR1” (Science Immunology), Figure 5C. Performed on human C1R cell line.
General notes and troubleshooting
General notes
These methods can be adapted to study different surface proteins in suspension cells from different hosts.
These methods are not suitable for adherent cell lines. Adherent cells may attach to the plate during the incubation at 37 °C. Trypsin treatment for the cell lifting may alter the cell behaviour and cell membrane biology, leading to inaccurate measurement in the assay.
The choices of fluorophores mentioned are those used by our studies; however, other fluorophores can also be used.
The recycling assay here measures the percentage of the originally labelled surface molecules that are recycled back to the cell surface after a period of internalisation. For the interpretation of the results, it is important to keep in mind that this rate is dependent on both the rate of recycling and the length of time used for the internalisation step. Hence, the length of time used for the internalisation step should be reported for this assay.
It has not been determined if fixation affects the performance of these assays. It is possible that fixing the cells after the assay is compatible with accurate measurements of internalisation and recycling, but this should be verified first by comparing the results of fixed vs. unfixed cells.
The protocol here uses the gMFI of the probes to measure the internalisation or recycling rate for the whole population of interest. It is possible, however, to use other measures or calculations distinct from gMFI to determine if there are heterogenous rates of internalisation within each population.
Troubleshooting
Problem 1: Too few cells acquired during flow cytometry.
Possible cause: Cells are lost during the washing steps, or the assay started with a low number of cells.
Solution: Increase the number of cells used in the assay.
Problem 2: Signal from positive controls (–Q or –M) is low.
Possible cause: The probes (FIP or recycling) are too diluted during the staining, or the expression of the protein being studied has a low abundance.
Solution: Optimise the concentration of the probe for the staining, until a stronger signal is gained. Use the best dilution of probes that give best signal (–Q or –M) to background (+Q or +M) ratio.
Problem 3: Inconsistent results.
Possible cause: Plates used for storing samples or controls are not kept cold and increase in temperature, hence internalisation or recycling occurs during washing or staining.
Solution: Use a prechilled centrifuge, consumables, and solutions throughout the assay unless specified to prevent internalisation and recycling after the time points have ended.
Problem 4: No recycled molecule detected in recycling assay.
Possible cause: Insufficient or extended time for the internalisation to occur.
Solution: Adjust the duration for internalisation at 37 °C in the way that the gMFI of +INT –M Trec = 0 is a lower signal than the gMFI of –INT –M, yet higher than that of +INT +M Trec = 0.
Acknowledgments
The work was supported by a National Health and Medical Research Council (NHMRC) Ideas Grant (2003192). The internalisation assay detailed in this protocol was adapted from the internalisation method developed by Liu et al. [1,2]. The recycling assay was adapted for flow cytometry from a biochemical assay previously used [12,13]. We acknowledge the pioneering work of these authors.
Competing interests
The authors declare no competing interest.
Ethical considerations
Human blood from healthy human donors was obtained from the Australia Red Cross Blood Service with written and informed consent and with ethics approval from the University of Melbourne Human Research and Ethics Committee (#1035100).
References
- Liu, H., Dumont, C., Johnston, A. P. R. and Mintern, J. D. (2016). Analysis of Intracellular Trafficking of Dendritic Cell Receptors for Antigen Targeting. In: Segura, E., Onai, N. (eds) Dendritic Cell Protocols. In Methods in Molecular Biology, vol 1423. Humana Press, New York, NY. https://doi.org/10.1007/978-1-4939-3606-9_15
- Liu, H. and Johnston, A. P. (2013). A programmable sensor to probe the internalization of proteins and nanoparticles in live cells. Angew. Chem. Int. Ed. Engl. 52(22): 5744–5748. https://doi.org/10.1002/anie.201301243.
- Murphy, K. and Weaver, C. (2017). Janeway's immunobiology. Garland Science/Taylor & Francis Group, LLC. New York, NY. ISBN: 9780815345053.
- Lim, H. J., Wubben, J. M., Garcia, C. P., Cruz-Gomez, S., Deng, J., Mak, J. Y. W., Hachani, A., Anderson, R. J., Painter, G. F., Goyette, J., et al. (2022). A specialized tyrosine-based endocytosis signal in MR1 controls antigen presentation to MAIT cells. J. Cell Biol. 221(12). https://doi.org/10.1083/jcb.202110125.
- Liu, H., Jain, R., Guan, J., Vuong, V., Ishido, S., La Gruta, N. L., Gray, D. H., Villadangos, J. A. and Mintern, J. D. (2016). Ubiquitin ligase MARCH 8 cooperates with CD83 to control surface MHC II expression in thymic epithelium and CD4 T cell selection. J. Exp. Med. 213(9): 1695–1703. https://doi.org/10.1084/jem.20160312.
- Villadangos, J. A., Schnorrer, P. and Wilson, N. S. (2005). Control of MHC class II antigen presentation in dendritic cells: a balance between creative and destructive forces. Immunol. Rev. 207: 191–205. https://doi.org/10.1111/j.0105-2896.2005.00317.x.
- Hernández Pérez, S. and Mattila, P. (2022). A specific hybridisation internalisation probe (SHIP) enables precise live-cell and super-resolution imaging of internalized cargo. Sci. Rep. 12. https://doi.org/10.1038/s41598-021-04544-6.
- Shunji, S., Toru, A. and Katsuo, K. (1987). A simple method to eliminate the antigenicity of surface class I MHC molecules from the membrane of viable cells by acid treatment at pH 3. J. Immunol. Methods 100(1): 83–90. https://doi.org/https://doi.org/10.1016/0022-1759(87)90175-X.
- Meinke, S., Sandgren, P., Mörtberg, A., Karlström, C., Kadri, N., Wikman, A. and Höglund, P. (2016). Platelets made HLA deficient by acid treatment aggregate normally and escape destruction by complement and phagocytes in the presence of HLA antibodies. Transfusion 56(2): 370–382. https://doi.org/https://doi.org/10.1111/trf.13350.
- He, W., Gea-Mallorquí, E., Colin-York, H., Fritzsche, M., Gillespie, G. M., Brackenridge, S., Borrow, P. and McMichael, A. J. (2023). Intracellular trafficking of HLA-E and its regulation. J. Exp. Med. 220(8). https://doi.org/10.1084/jem.20221941.
- Ma, W., Zhang, Y., Vigneron, N., Stroobant, V., Thielemans, K., van der Bruggen, P. and Van den Eynde, B. J. (2016). Long-Peptide Cross-Presentation by Human Dendritic Cells Occurs in Vacuoles by Peptide Exchange on Nascent MHC Class I Molecules. J. Immunol. 196(4): 1711–1720. https://doi.org/10.4049/jimmunol.1501574.
- O’Reilly, M. K., Tian, H. and Paulson, J. C. (2011). CD22 Is a Recycling Receptor That Can Shuttle Cargo between the Cell Surface and Endosomal Compartments of B Cells. J. Immunol. 186(3): 1554–1563. https://doi.org/10.4049/jimmunol.1003005.
- Barral, D. C., Cavallari, M., McCormick, P. J., Garg, S., Magee, A. I., Bonifacino, J. S., De Libero, G. and Brenner, M. B. (2008). CD1a and MHC Class I Follow a Similar Endocytic Recycling Pathway. Traffic 9(9): 1446–1457. https://doi.org/10.1111/j.1600-0854.2008.00781.x.
- McWilliam, H. E., Eckle, S. B., Theodossis, A., Liu, L., Chen, Z., Wubben, J. M., Fairlie, D. P., Strugnell, R. A., Mintern, J. D., McCluskey, J., et al. (2016). The intracellular pathway for the presentation of vitamin B-related antigens by the antigen-presenting molecule MR1. Nat. Immunol. 17(5): 531–537. https://doi.org/10.1038/ni.3416.
- Lim, H. J., Wubben, J. M., Garcia, C. P., Cruz-Gomez, S., Deng, J., Mak, J. Y. W., Hachani, A., Anderson, R. J., Painter, G. F., Goyette, J., et al. (2022). A specialized tyrosine-based endocytosis signal in MR1 controls antigen presentation to MAIT cells. J. Cell Biol. 221(12). https://doi.org/10.1083/jcb.202110125.
- McWilliam, H. E. G., Eckle, S. B. G., Theodossis, A., Liu, L., Chen, Z., Wubben, J. M., Fairlie, D. P., Strugnell, R. A., Mintern, J. D., McCluskey, J., et al. (2016). The intracellular pathway for the presentation of vitamin B–related antigens by the antigen-presenting molecule MR1. Nat. Immunol. 17(5): 531–537. https://doi.org/10.1038/ni.3416.
- Howson, L. J., Awad, W., von Borstel, A., Lim, H. J., McWilliam, H. E. G., Sandoval-Romero, M. L., Majumdar, S., Hamzeh, A. R., Andrews, T. D., McDermott, D. H., et al. (2020). Absence of mucosal-associated invariant T cells in a person with a homozygous point mutation in MR1. Sci. Immunol. 5(49). https://doi.org/10.1126/sciimmunol.abc9492.
Article Information
Copyright
© 2024 The Author(s); This is an open access article under the CC BY-NC license (https://creativecommons.org/licenses/by-nc/4.0/).
How to cite
Readers should cite both the Bio-protocol article and the original research article where this protocol was used:
- Lim, H. J. and McWilliam, H. E. G. (2024). Quantitative Measurement of Plasma Membrane Protein Internalisation and Recycling in Heterogenous Cellular Samples by Flow Cytometry. Bio-protocol 14(9): e4986. DOI: 10.21769/BioProtoc.4986.
- Lim, H. J., Wubben, J. M., Garcia, C. P., Cruz-Gomez, S., Deng, J., Mak, J. Y. W., Hachani, A., Anderson, R. J., Painter, G. F., Goyette, J., et al. (2022). A specialized tyrosine-based endocytosis signal in MR1 controls antigen presentation to MAIT cells. J. Cell Biol. 221(12). https://doi.org/10.1083/jcb.202110125.
Category
Cell Biology > Cell-based analysis > Endocytosis
Cell Biology > Cell-based analysis > Flow cytometry
Cell Biology > Cell signaling > Intracellular Signaling
Do you have any questions about this protocol?
Post your question to gather feedback from the community. We will also invite the authors of this article to respond.