- Protocols

- Articles and Issues
- For Authors
- About
- Become a Reviewer

Streamlining Protein Fractional Synthesis Rates Using SP3 Beads and Stable Isotope Mass Spectrometry: A Case Study on the Plant Ribosome
Published: Vol 14, Iss 9, May 5, 2024 DOI: 10.21769/BioProtoc.4981 Views: 2869
Reviewed by: Alba BlesaPiao YangOm Prakash Narayan
Original research article
The authors used this protocol in:

Nov 2022
Advertisement


Protocol Collections
Comprehensive collections of detailed, peer-reviewed protocols focusing on specific topics


Related protocols
Abstract
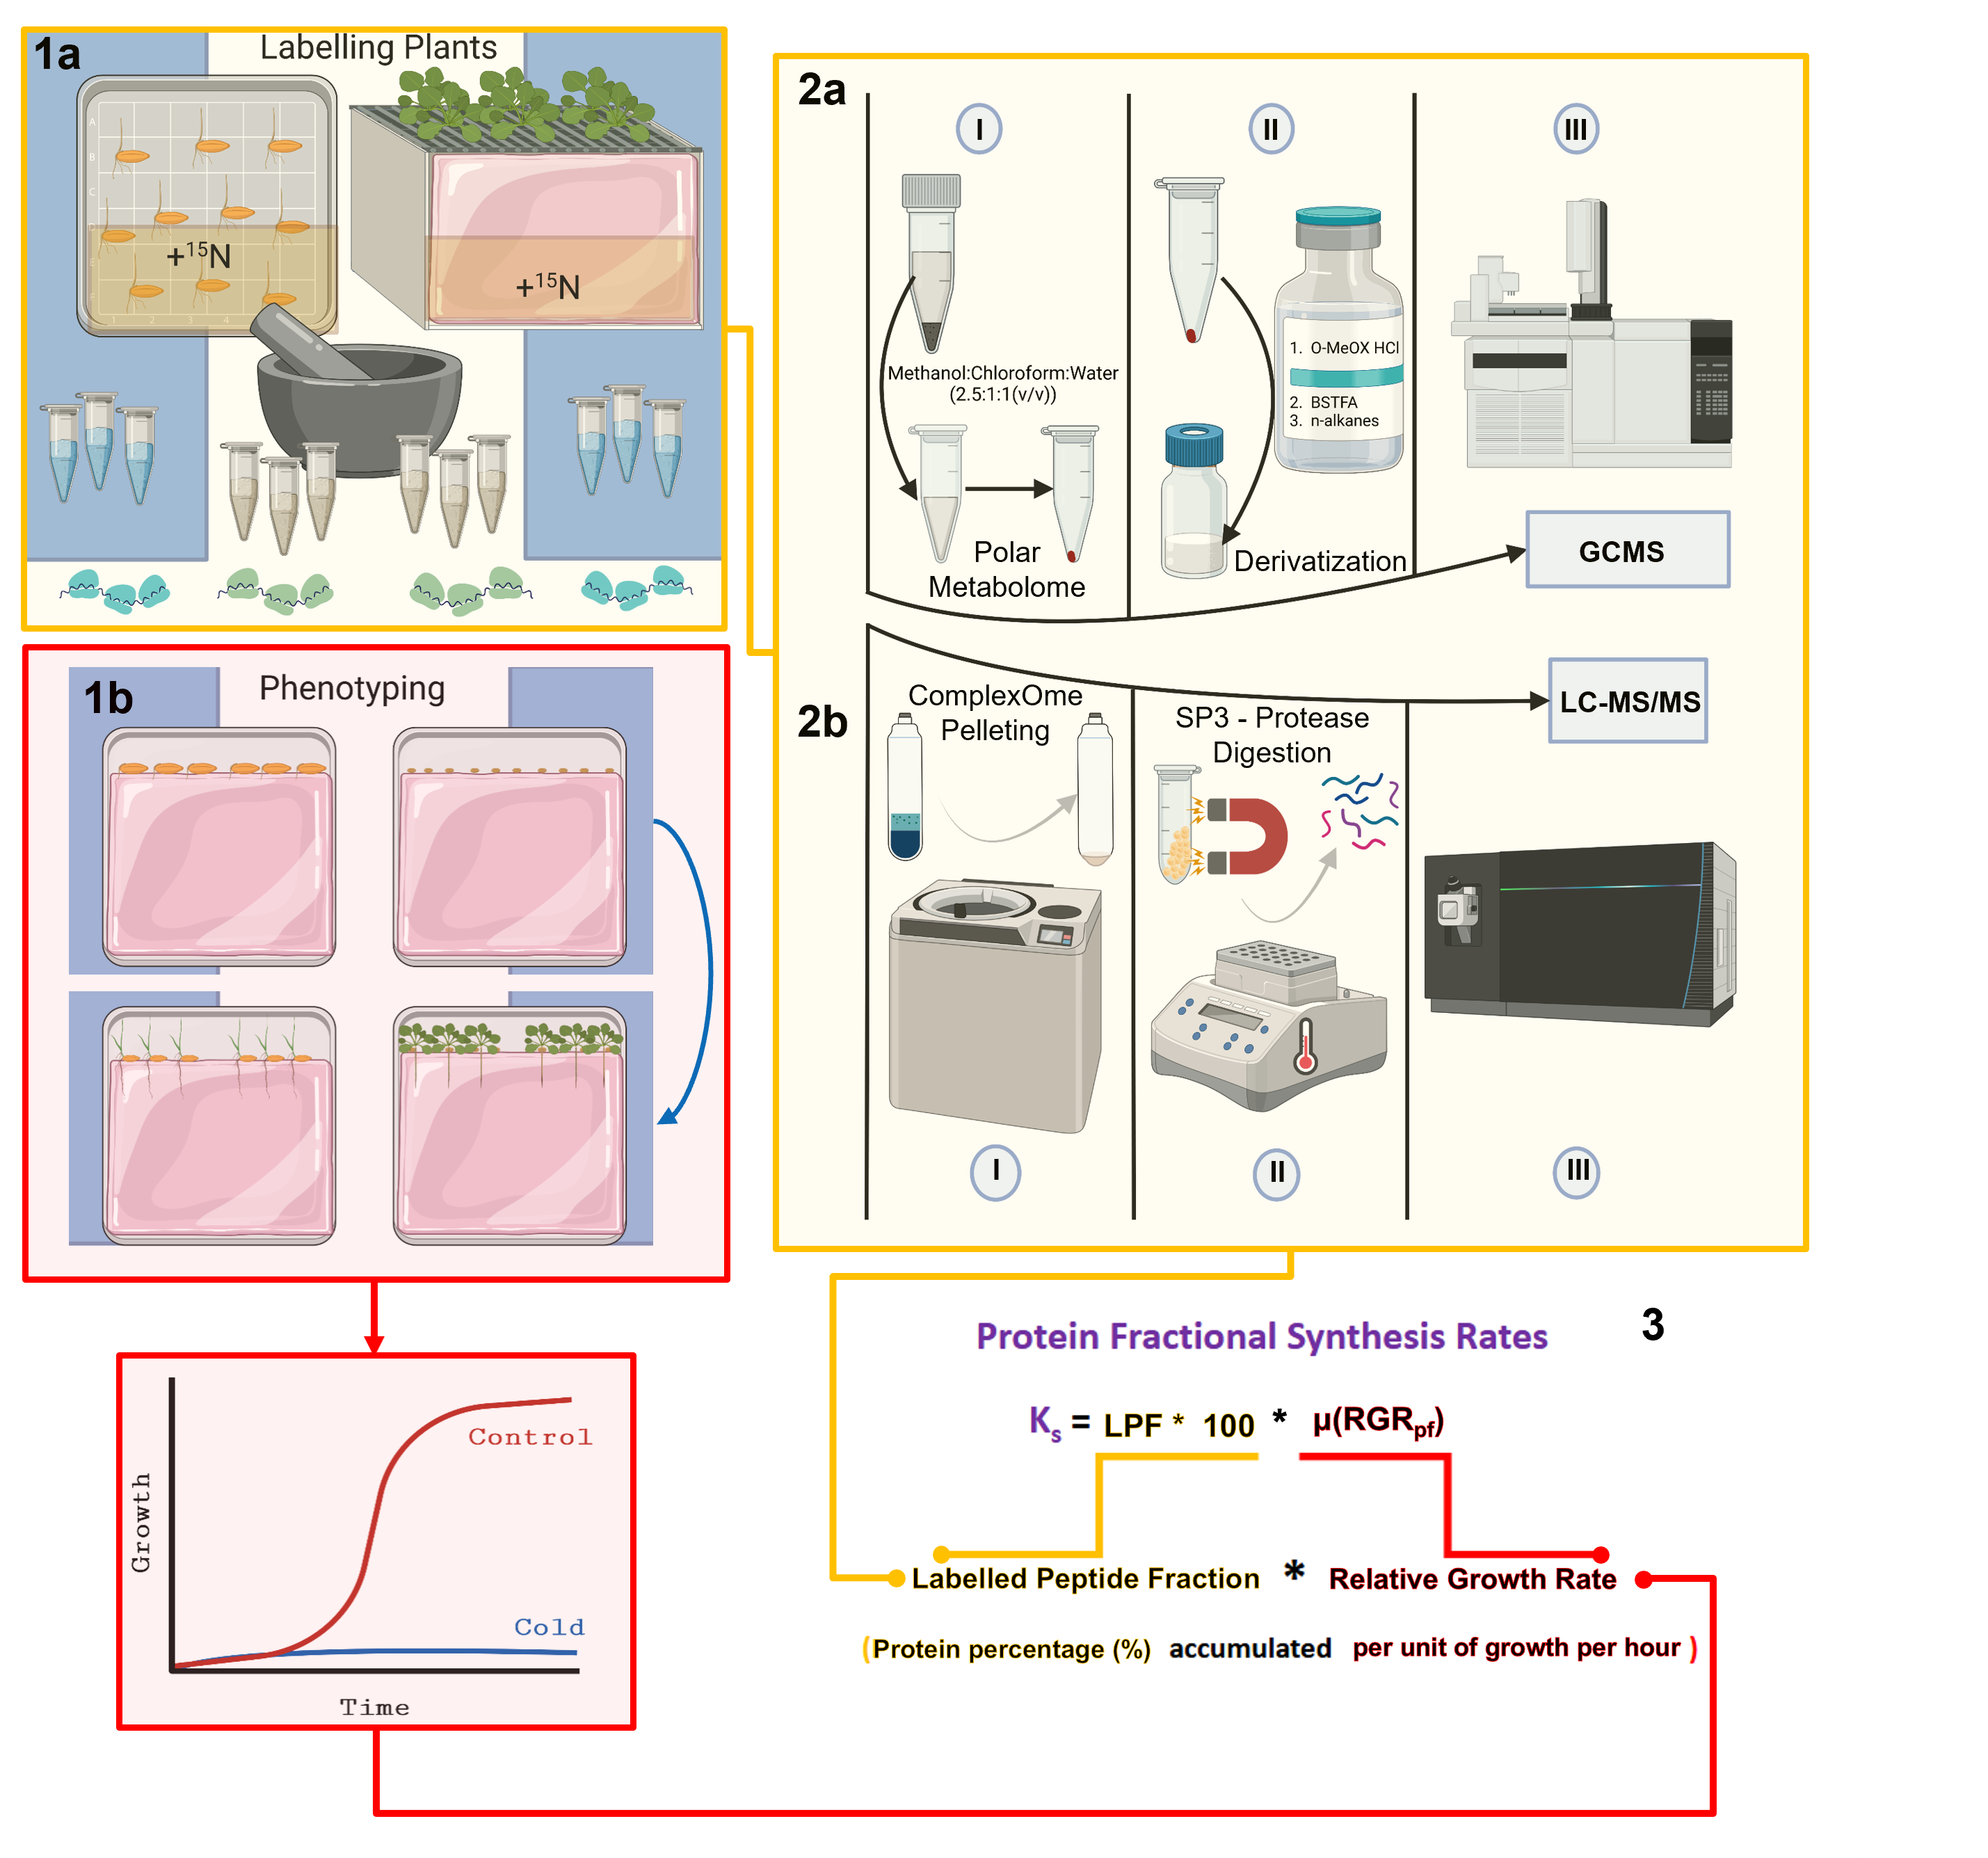
Ribosomes are an archetypal ribonucleoprotein assembly. Due to ribosomal evolution and function, r-proteins share specific physicochemical similarities, making the riboproteome particularly suited for tailored proteome profiling methods. Moreover, the structural proteome of ribonucleoprotein assemblies reflects context-dependent functional features. Thus, characterizing the state of riboproteomes provides insights to uncover the context-dependent functionality of r-protein rearrangements, as they relate to what has been termed the ribosomal code, a concept that parallels that of the histone code, in which chromatin rearrangements influence gene expression. Compared to high-resolution ribosomal structures, omics methods lag when it comes to offering customized solutions to close the knowledge gap between structure and function that currently exists in riboproteomes. Purifying the riboproteome and subsequent shot-gun proteomics typically involves protein denaturation and digestion with proteases. The results are relative abundances of r-proteins at the ribosome population level. We have previously shown that, to gain insight into the stoichiometry of individual proteins, it is necessary to measure by proteomics bound r-proteins and normalize their intensities by the sum of r-protein abundances per ribosomal complex, i.e., 40S or 60S subunits. These calculations ensure that individual r-protein stoichiometries represent the fraction of each family/paralog relative to the complex, effectively revealing which r-proteins become substoichiometric in specific physiological scenarios. Here, we present an optimized method to profile the riboproteome of any organism as well as the synthesis rates of r-proteins determined by stable isotope-assisted mass spectrometry. Our method purifies the r-proteins in a reversibly denatured state, which offers the possibility for combined top-down and bottom-up proteomics. Our method offers a milder native denaturation of the r-proteome via a chaotropic GuHCl solution as compared with previous studies that use irreversible denaturation under highly acidic conditions to dissociate rRNA and r-proteins. As such, our method is better suited to conserve post-translational modifications (PTMs). Subsequently, our method carefully considers the amino acid composition of r-proteins to select an appropriate protease for digestion. We avoid non-specific protease cleavage by increasing the pH of our standardized r-proteome dilutions that enter the digestion pipeline and by using a digestion buffer that ensures an optimal pH for a reliable protease digestion process. Finally, we provide the R package ProtSynthesis to study the fractional synthesis rates of r-proteins. The package uses physiological parameters as input to determine peptide or protein fractional synthesis rates. Once the physiological parameters are measured, our equations allow a fair comparison between treatments that alter the biological equilibrium state of the system under study. Our equations correct peptide enrichment using enrichments in soluble amino acids, growth rates, and total protein accumulation. As a means of validation, our pipeline fails to find “false” enrichments in non-labeled samples while also filtering out proteins with multiple unique peptides that have different enrichment values, which are rare in our datasets. These two aspects reflect the accuracy of our tool. Our method offers the possibility of elucidating individual r-protein family/paralog abundances, PTM status, fractional synthesis rates, and dynamic assembly into ribosomal complexes if top-down and bottom-up proteomic approaches are used concomitantly, taking one step further into mapping the native and dynamic status of the r-proteome onto high-resolution ribosome structures. In addition, our method can be used to study the proteomes of all macromolecular assemblies that can be purified, although purification is the limiting step, and the efficacy and accuracy of the proteases may be limited depending on the digestion requirements.
Key features
• Efficient purification of the ribosomal proteome: streamlined procedure for the specific purification of the ribosomal proteome or complex Ome.
• Accurate calculation of fractional synthesis rates: robust method for calculating fractional protein synthesis rates in macromolecular complexes under different physiological steady states.
• Holistic ribosome methodology focused on plants: comprehensive approach that provides insights into the ribosomes and translational control of plants, demonstrated using cold acclimation [1].
• Tailored strategies for stable isotope labeling in plants: methodology focusing on materials and labeling considerations specific to free and proteinogenic amino acid analysis [2].
Keywords: Ribo-proteomeGraphical overview
Some of the illustrations in the graphical abstract were created and exported under a paid license with BioRender
Background
Throughout the tree of life (TOL), ribosomes play a pivotal role in synthesizing all proteins by decoding mRNA [3]. The most precise representations of the TOL to date have been crafted using aligned genomic sequences of ribosomal RNA (rRNA) and ribosomal proteins (r-proteins) [4–7]. This centrality underscores the significance of ribosomal components, many of which feature prominently in the universal gene set of life (UGSL) [8]. The UGSL comprises orthologous genes conserved across the phylogenetic TOL, altered only through speciation while retaining their fundamental functions [9–11]. The interaction of r-proteins and rRNAs throughout the TOL has necessitated a conserved, basic, structural riboproteome. In opisthokonts, the complex has significantly increased in size, both in terms of rRNA expansion segments and in number of associated r-proteins [3]. The r-proteins themselves have become more complex and, in many cases, acquired new functions. Among acquired functionality, ribosomes have gained the ability to selectively decide which transcripts to translate, a concept known as ribosome specialization [12,13]. For example, ribosomal populations enriched in RPL10 translate transcripts subsets [14], and ribosomes lacking RPS26 preferentially translate transcripts from stress-response pathways [15]. To what extent and what proportion of the r-proteome has acquired these types of adaptations remains unknown. Nevertheless, it is becoming increasingly clear that the composition of riboproteomes at a given time reflects structural and functional features of ribosomes [15–17] and grants them the ability to control translational output and shape protein expression.
The field of structural systems biology has progressed greatly in recent years due to the convergence of atomic structures, which provide an average scaffold of macromolecular complexes, and omics studies, which elucidate the relative or absolute abundances of their structural components in vivo [18]. Ribosomes have driven the convergence of these methods due to their ubiquitous and essential nature in the cellular environment. Ribosome structures can currently be highly resolved, reaching near-atomic resolution [19–21]. On the other hand, omics methods lag in providing tailored solutions to fully decipher the general status of riboproteomes. Although methods such as transcriptomics or translatomics can monitor gene expression in a significant percentage of the expressed genome, a gap remains between transcriptional regulation and the abundance of active protein pools [22]. Recent efforts include advanced mass spectrometry methods to elucidate different features of r-proteins [23], such as absolute quantification using synthetic peptide standards [14]. These examples make it clear that multiplexing methods will help to overcome the limitation of studying riboproteomes at the ribosome population level.
We focused on three major obstacles that currently prevent the thorough investigation of r-proteins. First, multiplexing requires the purification of riboproteomes in a pseudo-native state that conserves protein features to elucidate different aspects of their biology. Second, the analysis of r-proteins following protease digestion requires careful consideration of the amino acid composition, which includes many basic peptide stretches required for interacting with rRNA. Finally, many translational studies often fail to bridge the gap between translatome and proteome. Currently, the best method to monitor the translational output from ribosomes is Ribo-Seq [24], which has been optimized in plant systems [25] but fails to provide measurements of de novo synthesized proteins. Moreover, typical translational studies deal with organisms that transition between biological steady states. These transitions complicate the use of technologies such as in vivo stable-isotope labeling and mass spectrometry to monitor protein synthesis, as quantification of tracer incorporation assumes steady-state conditions.
Here, we set out to provide a standardized methodology to overcome these three limitations while addressing a previously unsolved biological question in plant translation [1]. To deal with the first limitation, we developed a strategy to purify the r-proteome as close as possible to its native state by using a chaotropic agent to dissociate r-proteins from rRNA. Our purification strategy enhances both top-down and bottom-up proteomics methods, as previously described by others [23], by capturing r-proteins with paramagnetic SP3 beads [26–28]. To bypass the second limitation, we carefully consider our choice of an optimal protease to digest ribosomal proteins across the TOL. We validate that our protease yields larger peptides and thus allows for a more comprehensive profiling of the r-proteome from bacteria to higher metazoans. To address the third limitation, we provide an R package called ProtSynthesis (https://github.com/MSeidelFed/ProtSynthesis), in which we developed physiological and data-based assumptions required to quantify tracer incorporation and fractional protein synthesis rates in organisms shifting between biological states, using plant cold acclimation as an example [1,29,30]. Our method uses organismal physiology in the treated vs. non-treated condition to make fractional synthesis rates comparable. First, we quantify the enrichment percentage in soluble amino acid pools and use them to constrain the maximum amount of nitrogen atoms that could have incorporated the label in specific peptide sequences, thus correcting for biases in 15N incorporation into soluble amino acid pools across conditions. Secondly, treatments often induce differences in growth, and we calculate relative growth rates to normalize fractional protein synthesis. Finally, because the most direct measurement of translation is protein content, we correct our relative growth rates to reflect the percentage of protein accumulated per unit of time. In summary, our calculations comprehensively incorporate organism physiology to enhance the comparison between fractional protein synthesis rates across different biological steady states, such as cold-acclimated plants vs. plants reared at optimal temperatures. Beyond cold acclimation, there are plant examples in which biological steady state shifts occur concomitantly to surmised translational reprogramming, which could profit from our methodology. For instance, 3',5'-cAMP supplementation induces spatially constrained rearrangements of the r-proteome in Arabidopsis [31]. Similarly, flg22 induces dissociation of the P-Stalk via the activation of Mitogen-activated protein kinase 6 pathway, influencing plant immunity to bacteria [16]. These examples set an ideal stage for inquiring about changes in the synthesis and assembly of the r-proteome and how it affects protein synthesis, i.e., what is the functional translational implication of remodeling the r-proteome. To summarize, we provide a comprehensive methodology to couple the most accurate methodology to study translational efficiencies (Ribo-Seq) to r-protein and proteome-wide fractional protein synthesis rates.
Summary
Our method contains five steps that are depicted in the graphical abstract. Step 1a entails labeling the biological specimens in a manner tailored to each organism. The required methodology, including materials and labeling considerations for plants, is discussed in detail elsewhere [2]. Step 1b entails a detailed phenotypic analysis of the organism of interest upon applying a specific treatment that produces a shift from the previous biological steady state. For phenotyping and growth analyses of plants, we use and recommend the classical definition of relative growth rates that has been discussed extensively in the literature over the last century [32–34] based on the first postulation of an efficiency index by Blackman, 1919 [35], which is equivalent to the relative growth rate. Step 2a accounts for differential labeling efficiency in soluble amino acid pools at the onset of the investigated physiological transition. The methodology for obtaining the primary metabolome and measuring metabolite abundances by gas chromatography–mass spectrometry has been described elsewhere [2]. The contents of the manuscript detail the procedure to purify and profile a complexOme or ribosomal proteome (Step 2b) and elaborate on the data analyses and further considerations needed to calculate protein fractional synthesis rates from protein components of isolated complexes (Step 3).
Materials and reagents
Biological materials
Apical root meristems of germinating seedlings from Barley (Hordeum vulgare cultivar Keel) obtained from The University of Melbourne from previous studies [36] (Note 1)
Escherichia coli 70S ribosomes (New England BioLabs, catalog number: P0763S); one tube of 1 mg is enough as internal standard for the protocol detailed below
Guanidine hydrochloride (GuHCl) (Sigma-Aldrich, catalog number: G3272)
Trifluoracetic acid (TFA) (Thermo Fisher Scientific, catalog number: 85183)
PierceTM BCA Protein Assay kit (Thermo Fisher Scientific, catalog number: 23227)
Water, molecular biology grade, DNase and RNase free (Research Products International, catalog number: 248700)
Triethylammonium bicarbonate buffer (TEAB) (Sigma-Aldrich, catalog number: T7408)
Tris(2-carboxyethyl) phosphine hydrochloride (TCEP) (Macherey-Nagel, catalog number: 740395.107)
Iodoacetamide (IAA) (Sigma-Aldrich, catalog number: I5161)
Acetonitrile (Acn) (Sigma-Aldrich, catalog number: 271004)
Sera-MagTM SpeedBad carboxilated-modified magnetic particles [GE Healthcare, catalog number: 45152105050250 (hydrophilic); 65152105050250 (hydrophobic)]
Ethanol absolute, suitable for HPLC, ≥99.8% (Sigma-Aldrich, catalog number: 34852-M)
Endoproteinase Lys-C (New England Biolabs, catalog number: P8109S)
Trizma(R)-hydrochloride solution, pH 9.0, RNase free (Sigma-Aldrich, catalog number: 1185-53-1)
Nuclease-Free Water, for Molecular Biology (Sigma-Aldrich, 7732-18-5)
Potassium chloride (KCl) (2 M), RNase free (Sigma-Aldrich, catalog number: AM9640G)
EGTA (sigma-Aldrich, catalog number: 324626)
Magnesium chloride solution (MgCl2) (1 M), RNase free (Sigma-Aldrich, catalog number: M1028)
Chloramphenicol (Cm) (Sigma-Aldrich, catalog number: C0378)
Cycloheximide (CHX) (Research Products International, catalog number: 50488631)
Dithiothreitol (DTT) (Sigma-Aldrich, catalog number: D0632)
Protease inhibitor cocktail (Pi) (Sigma, catalog number: P9599)
Phenylmethylsulphonyl fluoride (PMSF) (Thermo Fisher Scientific, catalog number: 36978)
Resuspension buffer (see Recipes)
6 M GuHCl (see Recipes)
50% (v/v) TFA (see Recipes)
500 mM TCEP (see Recipes)
55 mM IAA (see recipes)
Digestion buffer and endoproteinase Lys C working solution (see Recipes)
80% Acn, 0.1% TFA (v/v) (see Recipes)
Recipes
Resuspension buffer (10 mL)
*Prepare all necessary stocks before starting the protocol. The recommendation is to prepare a pre-resuspension buffer and store at 4 °C; all stocks, except for the small molecules, must be filtered through a 0.22 μm filter or autoclaved. Subsequently, just before usage in resuspension, add the translational stallers and reducing agents, i.e., Cm, CHX, DTT, PMSF, and Pi.
Reagent Final concentration Volume TRIS HCl (1 M, pH 9.0) 200 mM 2 mL KCl (2 M) 200 mM 1 mL EGTA (500 mM, pH 8.0) 25 mM 500 μL MgCl2 (1 M) 35 mM 350 μL RNase-free water n/a 5.94 mL CHX (180 mM) 0.18 mM 10 μL DTT (1 M) 5 mM 50 μL PMSF (200 mM) 1 mM 50 μL Pi (100×) 1× 100 μL Total n/a 10 mL 6 M GuHCl (10 mL)
*Prepare fresh every time.
Reagent Final concentration Quantity GuHCl 6 M 5.73 g RNase-free water n/a Up to 10 mL Total n/a 10 mL 50% TFA (1 mL)
*Prepare fresh every time. Caution: prepare in fume hood.
Reagent Final concentration Volume TFA 50% 500 μL RNase-free water n/a 500 μL Total n/a 1 mL 500 mM TCEP (750 μL)
*Prepare working solution of reducing agent TCEP according to manufacturer instructions. Dissolving the material in water might take several minutes; mix several times. After reconstitution, the solution should be stored at -20 °C and is stable for at least six months.
Reagent Final concentration Quantity TCEP 500 mM 107 mg RNase-free water n/a 750 μL Total n/a 750 µL 55 mM IAA (3 mL)
* IAA is light sensitive. The solution should be freshly prepared, and the incubations should be performed in the dark.
Reagent Final concentration Quantity IAA 55 mM 56 mg TEAB (1 M) 25 mM 3 mL Total n/a 3 mL Digestion buffer and endoproteinase Lys-C
*The quantity of endoproteinase Lys-C needed depends on the number of samples and the protein amount in each sample. Consider that, even if the Lys-C protease stock is the same, the volume of 25 mM TEAB can be different if the amount of protein in the samples is different.
Reagent Final concentration Quantity or Volume TEAB (1 M) 25 mM 10:1 (v/w) TEAB/protein Endoproteinase Lys-C (20 µg) n/a 1:20 (w/w) Lys-C/protein Total n/a n/a 80 % Acn, 0.1 % TFA (75 mL)
Reagent Final concentration Quantity or Volume Acn 80% 60 mL TFA (50 %) 0.1% 150 µL RNase-free water n/a 14,850 µL Total n/a 75 mL
Laboratory supplies
Ice
Ice bucket
Pipettes: 10 μL, 200 μL, 1,000 μL
Tips: 10 μL, 200 μL, 1,000 μL
Ultracentrifugation tubes, 1 mL, open-top thickwall polycarbonate (Beckman Coulter, catalog number: 343778)
Ultracentrifugation tubes (Beckman Coulter, catalog number: 326819)
2 mL safe-lock tubes (Eppendorf, catalog number: 0030120094)
1.5 mL safe-lock tubes (Eppendorf, catalog number: 0030120086)
96-well plates (Sarstedt, catalog number: 1581100)
Aluminum foil
pH indicator paper (Macherey-Nagel, catalog number: 90204)
Solid phase extraction (SPE) cartridges (Waters, catalog number: 186000383)
Equipment
-80 °C deep freezer (SANYO, model: MDF-U 72 V)
Balance XS105 (Mettler-Toledo, catalog number: 30132870)
SW55 Ti rotor (Beckman Coulter, Krefeld, model: 55 Ti)
Ultracentrifuge (Beckman Coulter, Krefeld, model: Optima XPN)
Optima MAX-XP ultracentrifuge (Beckman Coulter, catalog number: 393315)
MLA-130 fixed angle rotor (Beckman Coulter, model: Krefeld, model: MLA-130)
Vortex mixer (Bender & Hobein, model: G560-E)
Fume hood (Waldner, model: Airflow Controller AC2)
High-speed centrifuge (Eppendorf, model: 5417R)
Incubation room set to 37 °C (Note 2)
Thermomixer (Eppendorf, catalog number: 5382000015)
Microplate reader (BioTek Elisa ELx808, model: 25-315S)
Magnetic rack (Invitrogen, DynaMag-2, model: 12321D)
Speed-vac (LaboGene, model: SCANVAC CoolSafe100-9 PROSuperior XS)
Freeze-dryer (Christ, model: Alpha 2-4 LSCbasic)
Orbitrap mass spectrometer (Thermo Fisher Scientific, model: Eclipse) equipped with a nanoflow HPLC (Ultimate 3000 RSLC, Dionex)
Software and datasets
Absorbance plate reader software (BioTek, Gen5 2.09, 04/2022)
Microsoft Office software (Microsoft)
MaxQuant (above version 2.4, 04/2022)
R statistical language (above version 3.10, 06/2023)
R package ProtSynthesis (https://github.com/MSeidelFed/ProtSynthesis) (Access date, 05/2022)
Python (above version 3, 04/2021)
Python Script IsotopeEnrichment (https://github.com/mgleeming/isotopeEnrichment) (Access date, 05/2022)
Procedure
Pelleting of the polysome fractions
Plant monosome or polysome fractions can be purified in sucrose gradients [16,37,38].
Take polysome fractions previously isolated in the presence of known translational stallers such as chloramphenicol and cycloheximide. If stored at -80 °C, thaw on ice for 5 min (Note 3).
Transfer the polysome fractions to 1 mL, open-top thickwall polycarbonate ultracentrifugation tubes, and mix thoroughly (Note 4).
Add resuspension buffer up to 1 mL and resuspend thoroughly by pipetting up and down until the solution is clear (Note 5).
Tare all tubes with resuspended polysomes on a scale using resuspension buffer (standard deviation of 5 µg).
Centrifuge for 2 h at 110,000 RPM at 4 °C in an MLA-130 fixed angle rotor [g-force (avg) of 616,616× g, maximum 731,808× g, and K-Factor of 8] mounted on an Optima MAX-XP ultracentrifuge (Note 6).
Immediately after centrifugation, discard the supernatant by decanting while taking care not to disturb the pellet and acting quickly to avoid the possibility of resuspending the pellet in the buffer.
Place the tubes upside down on clean absorbent paper for 1 min to remove most of the supernatant, allowing the pellets to air-dry during this time interval. To fully dry excess liquid, briefly introduce absorbent paper inside the tubes without disturbing the pellet at the bottom. The polysome pellet has a flat jelly-like appearance at the bottom of the tube (Figure 1).
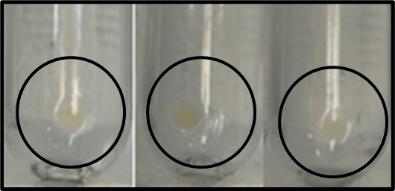
Figure 1. Ribosome pelletsImmediately transfer the tubes to ice and use or store the pellets at -80 °C until further use.
Resuspension for r-protein dissociation (Note 7)
Take the tubes containing polysome pellets from Step A8 and place them on ice.
Resuspend the ribosome pellets by adding 60 µL of 6 M GuHCl to the samples and slowly pipetting up and down until the pellet disappears.
Transfer the resuspension using a P1000 to 2 mL safe-lock tubes.
Acidify each sample by pipetting into the solution 1.2 µL 50% (v/v) TFA to reach a 1% (v/v) final volume.
Vortex briefly each sample.
Centrifuge at full speed (21,400× g) for 20 min at 4 °C to precipitate and remove the RNA.
Carefully transfer the supernatant using a P200 to a new 2 mL safe-lock tube without disrupting the pellet (Note 8), store the tubes on ice, and continue to the next section where protein contents are measured.
Determination and adjustment of r-protein concentration for beads and protease requirements
The following steps measure the total protein content of all samples using the classical BCA Protein Assay kit and an absorbance plate reader. Some of the steps have been modified within the ranges offered by the assay manual to fit the pipeline.
Take 6 µL from each sample to a 96 well-plate (e.g., Figure 2) and dilute at least 1× with RNase-free water to reach a concentration smaller or equal to 3 M GuHCl, which is below the compatibility threshold for the Pierce BCA Protein Assay.
Follow the Pierce BCA Protein Assay protocol to prepare the diluted BSA standards and working reagent and to determine the unknown protein concentration of each sample (Note 9).
First, pipette 10 µL of each standard in three replicates into a 96-well plate.
Add 200 µL of the working reagent to each well and mix the plate thoroughly on a plate shaker for 30 s.
Cover plate with aluminum foil and incubate at 37 °C for 30 min.
Cool plate at room temperature for 10 min. Measure the absorbance at or near 562 nm on a plate reader.
Subtract the average 562 nm absorbance measurement of the blank standard replicates (either protein-free buffer measurements or water, depending on the chosen procedure) from the 562 nm measurements of all other individual standard and unknown samples.
Prepare a standard curve by plotting the average blank-corrected 562 nm measurement for each BSA standard vs. its concentration in µg/mL. Use the standard curve to determine the unknown protein concentration of each sample.
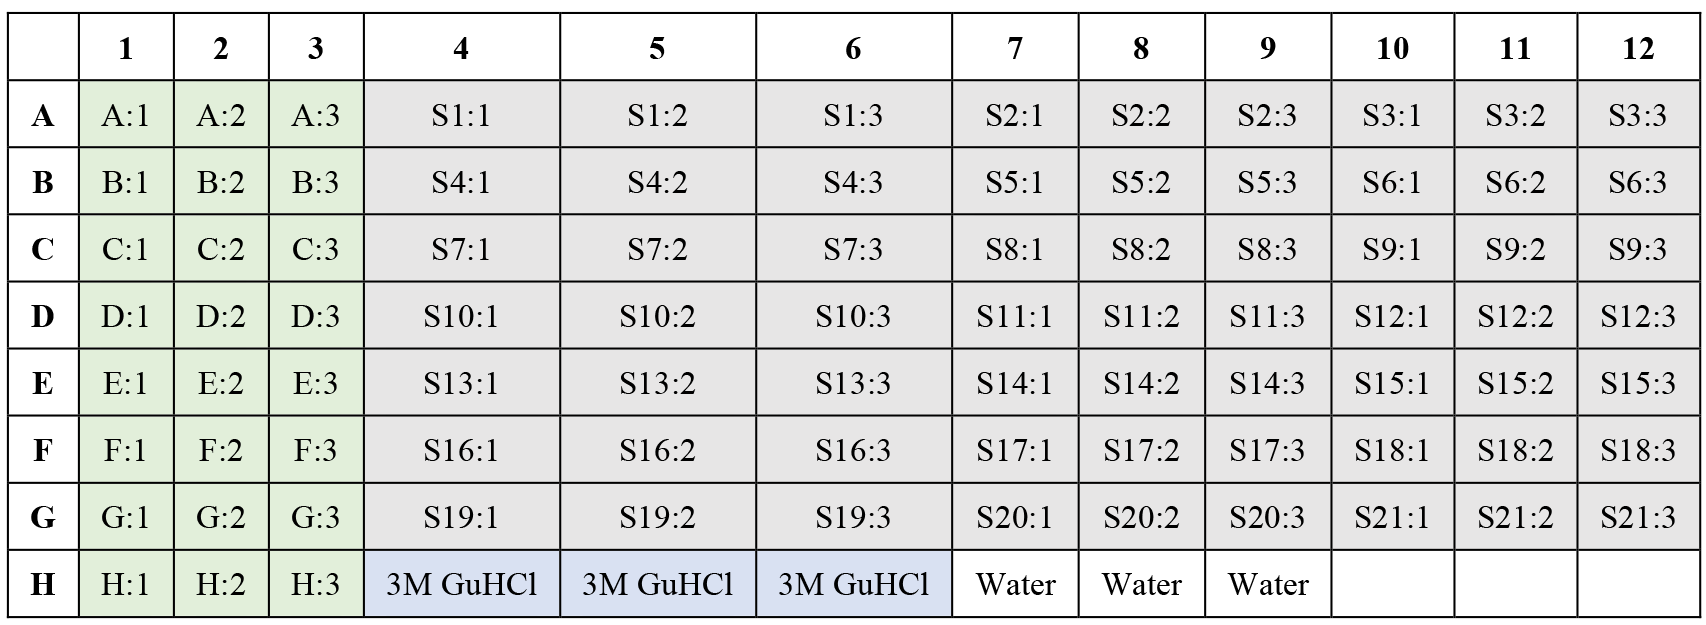
Figure 2. 96-well plate layout. Columns in green refer to the three replicates of BSA standards and columns in gray represent up to 21 samples and their three technical replicates.
Determine and take the volume corresponding to 10 µg of protein for each sample.
Pipette the determined volumes into new 2 mL Eppendorf tubes and top up to 50 µL with 6 M GuHCl, 1% (v/v) TFA to standardize protein concentrations in all samples.
Increase the pH of the standardized protein solutions from acidic to approximately 8 by adding 10 µL of 1 M TEAB to each sample.
Monitor the pH of each sample by adding 1 µL to pH strips.
SP3 bead working solution
Remove the beads stocks A & B from 4 °C and let them equilibrate to room temperature for approximately 10 min. Stocks A & B correspond to the 45152105050250 (hydrophilic) and 65152105050250 (hydrophobic) parts that come together in the Sera-Mag SpeedBad carboxilated-modified magnetic particles kit. Mix both stocks by gently shaking to homogenize and allow the beads to come into suspension.
In a 2 mL Eppendorf tube, mix 100 µL of hydrophilic beads stock A with 100 µL of hydrophobic beads stock B and add 800 µL of RNase-free H2O.
Allow the beads to separate from the solution by placing the tubes in a magnetic rack for approximately 1 min and immediately discard the supernatant carefully without disturbing the beads.
To wash the magnetic beads, remove the tubes from the magnetic rack and add 1 mL of RNase-free H2O. Mix thoroughly by pipetting and place the tubes back in the magnetic rack. Let the beads separate and discard the supernatant after 1 min by removing it with a pipette without disturbing the beads. Repeat the washing step three times.
To obtain the working solution (20 µg/µL), add 500 µL of RNase-free H2O to the beads after removing the supernatant from the last wash. Working solution can be stored at 4 °C for a month.
Reduction, alkylation, and digestion
Considerations for the choice of a protease to digest a ribosomal proteome: RNA-protein binding domains are rich in amino acid residues such as histidine, arginine, and lysine, which are all basic amino acids. Basic amino acids populate ribosomal proteomes throughout the TOL because r-proteins must bind to rRNA. In fact, many of the r-protein interactions are directly mediated by rRNA. The nature of riboproteomes defines a clear expectation for tailored protease treatments to obtain adequate representation of all r-proteins. The protease trypsin is known to digest peptide sequences at the C-terminus of lysine and arginine. Therefore, cleavage of r-proteins could yield many small trypsinogenic peptides. In contrast, Lys-C digests protein sequences only at the C-terminus of lysine residues. According to in silico analyses, Lys-C cuts most r-proteins into significantly longer peptide pieces than trypsin (Figure 4). As a result, a better representation of the riboproteome can be achieved using Lys-C as compared with the tested proteases.
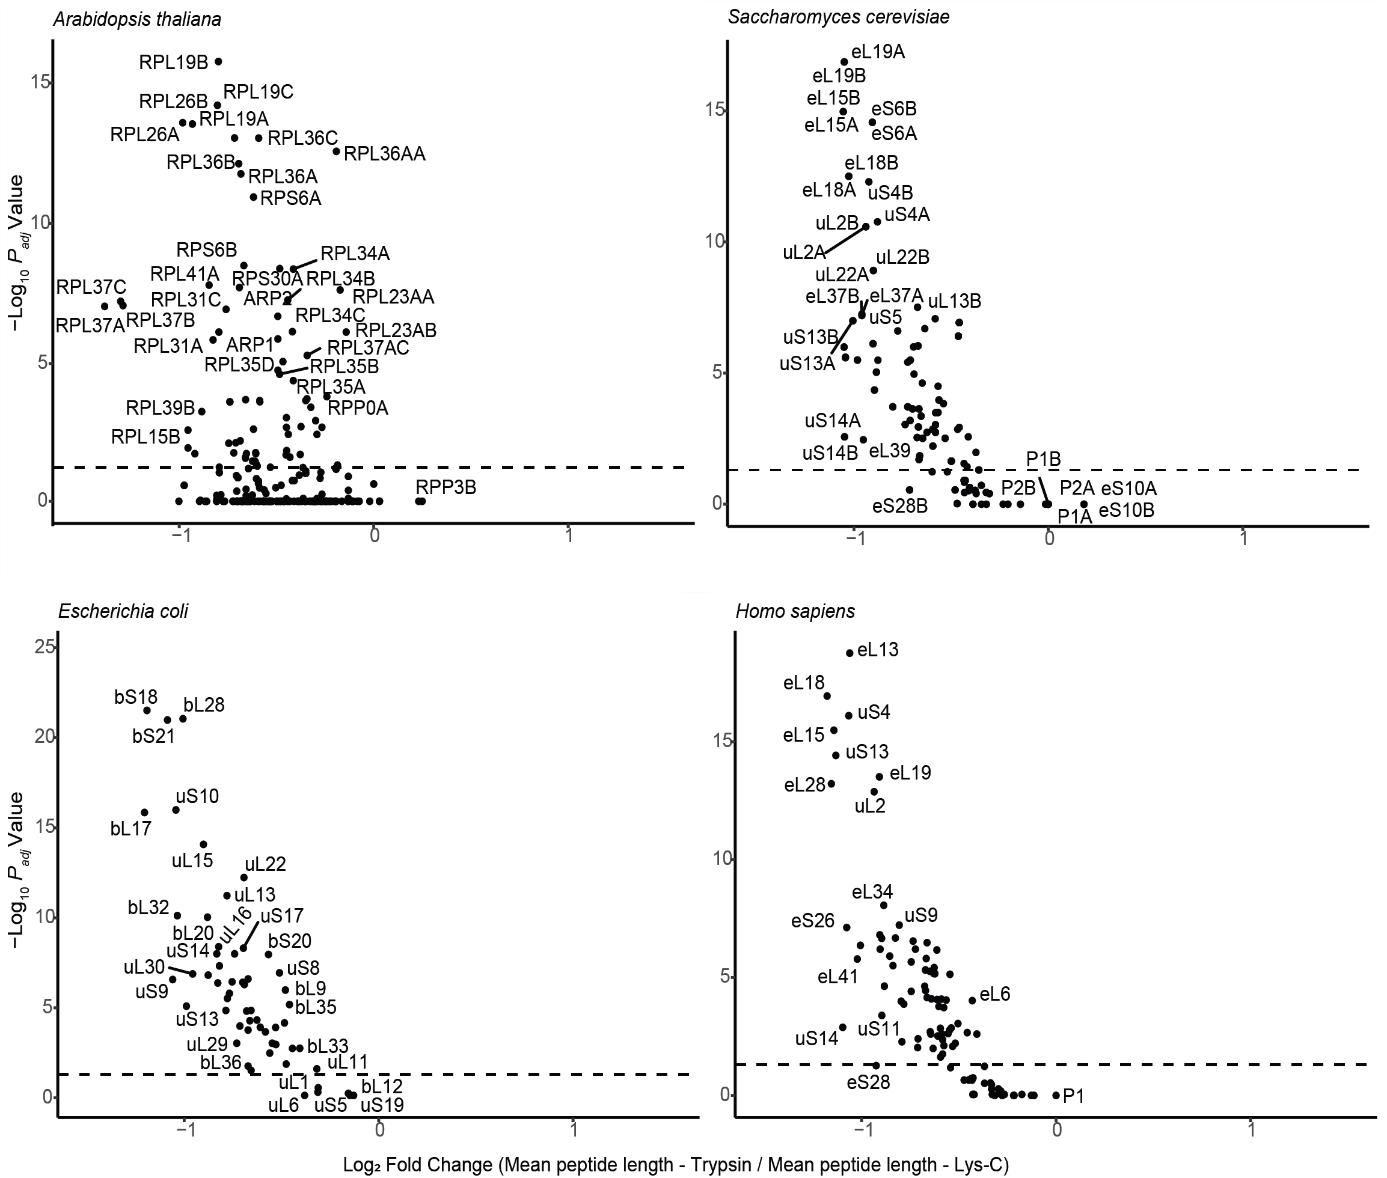
Figure 4. Volcano plot outlining the differences in mean peptide length produced with Lys-C compared with trypsin by in silico protease digestion applied to the ribosomal proteome of the model organisms across the tree of life. Related to Supplemental Table 1. In silico protease digestion was performed with the software Protein-Digestion-Simulator (https://github.com/PNNL-Comp-Mass-Spec/Protein-Digestion-Simulator). The resulting plot from analyzing the digestions contains, in the x-axis, the log2 of the ratio between mean peptide lengths from trypsin and Lys-C digestion. The y-axis contains the -log10 of the adjusted P value (Padj) from the statistical comparison of mean peptide lengths per each specific ribosomal protein. Note that in eukaryotic models mostly P-Stalk acidic proteins have x values > than 0; all the other ribosomal proteins have shorter mean peptide lengths when digested with trypsin as compared with Lys-C. The horizontal dotted line signals the significance boundary (P ≤ 0.05) transformed using a -Log10 function; thus, all the proteins above the line have significantly shorter mean peptide lengths when digested with Trypsin as compared with Lys-C.Add 1.2 µL of 0.5M TCEP to each sample to reach a 10 mM concentration and shake with an incubator at 800 RPM and 37 °C for 45 min.
Work quickly: add 60 µL of freshly prepared IAA and shake in the dark or covered with aluminum foil with an incubator at 800 RPM and 37 °C for 45 min.
Add 160 µL of Acn to each sample to reach a 70% (v/v) final concentration.
Add 10:1 bead to protein ratio to each sample and mix thoroughly by pipetting to create a uniform solution.
Let the samples sit for 10 min at room temperature, mix by pipetting, and allow to sit for another 10 min at room temperature. Prepare digestion buffer while waiting.
Place tubes on the magnetic rack and allow them to separate for 30 s.
Critical: Work quickly and have all materials ready. All subsequent washing steps are performed quickly and without removing the safe-lock tubes from the magnetic rack.
Remove and discard supernatant with a pipette.
Add 1 mL of neat Acn to each tube, allow to sit for 10 s, and discard by drawing with a pipette.
Add 1 mL of 70% (v/v) ethanol to each tube, allow to sit for 10 s, and discard with a pipette. Remove tubes from the magnetic rack.
Add a 10:1 digestion buffer (µL) to protein (µg) ratio to each sample. The digestion buffer contains endoproteinase Lys-C at 1:20 protease to protein ratio, diluted in 25 mM TEAB.
Incubate at 37 °C by shaking at 200 RPM overnight (18–20 h).
Peptide wash and processing
Add 50% (v/v) TFA to reach 1% concentration to quench the digestion, e.g., for 130 µL add 2.6 µL of 50% (v/v) TFA per sample.
Mix thoroughly and spin for 2 s in a microcentrifuge.
Remove the magnetic beads by transferring the tubes to the magnetic rack, allow to separate for 60 s, and transfer the supernatant to new 1.5 mL safe-lock tubes.
Repeat this step by transferring the tubes with the supernatant back to the magnetic rack, allow to separate for 60 s, and transfer the supernatant to new 1.5 mL safe-lock tubes.
Centrifuge at maximum speed (21,400× g) for 10 min to get rid of any residual beads.
Without disrupting the pellet, transfer 90% of the supernatant volume to new 1.5 mL safe-lock tubes.
Corroborate that the pH is below 3 by placing 1 µL of each sample on a pH strip.
Mount SPE cartridges (one per sample) in a vertical manner in the arrangement of your choice.
Caution: Work in a fume hood.
Wash the SPE cartridges with 1 mL of 80% Acn, 0.1% TFA (v/v) to equilibrate, release, and discard the flowthrough by gravity.
Wash again twice with 1.2 mL of 0.1% (v/v) TFA, allow the flowthrough to be released by gravity, and discard it.
After washing, load the samples slowly to bind the peptides to the SPE cartridges.
Wash the bound peptides with 1.5 mL of 0.1% (v/v) TFA and discard the flowthrough by gravity.
Mount 1.5 mL safe-lock tubes below each SPE cartridge and collect the peptides by eluting with 800 µL of 80% Acn with 0.1% TFA (v/v).
Vacuum concentrate at RT to ~20% of the initial volume (at this preparation stage, Acn is almost completely removed).
Freeze the samples in a deep freezer (-80 °C) for 1 h.
Freeze-dry the samples for approximately 3 h or until tubes are completely dry.
Lyophilized peptides are ready to be resuspended in mass spectrometry loading buffer (2% ACN, 0.05% TFA) and measured in the LCMS platform of your choice.
Data analysis
The complete R and Python code used in our method is publicly available and fully documented via two GitHub repositories. Here, we include the documentation of the R package in Supplemental file 1 and its recommended usage on a compiled markdown in html format as Supplemental file 2, which contains detailed examples, input, and outputs for every function in our package. To visualize the figures embedded in the .md file, your computer must be logged into the internet. Additionally, we report the mathematical formulas, elaborate on their pragmatical implications and assumptions, and explain their results in the manuscript by Martinez-Seidel et al. [1].
Validation of protocol
This protocol or parts of it have been used and validated in the following research article(s):
Martinez-Seidel et al. [1]. Remodelled Ribosomes Synthesise a Specific Proteome in Proliferating Plant Tissue during Cold. bioRxiv (Figures 5 and 6).
To verify the methodological aims of our wet-lab methodology (Step 4), we used commercial preparations of Escherichia coli 70S ribosomes. We recommend the usage of such a control to confirm that the desired macromolecular complexes (in our case ribosomes) withstand with integrity all the purification procedures described herein.
Prepare 4 µL aliquots of E. coli ribosomes (Note 10).
Layer the ribosome aliquots on top of sucrose cushions (Martinez-Seidel et al. [1]) or sucrose gradients, as previously described in Siodmak et al. [16].
Centrifuge at high speeds as described in section A and follow the same procedure detailed in the sections of this manuscript.
We validated that our method enabled the recovery of native 70S E. coli ribosomes by assessing the completeness of the protein annotations generated by MaxQuant for three independent replicates (Figure 3).
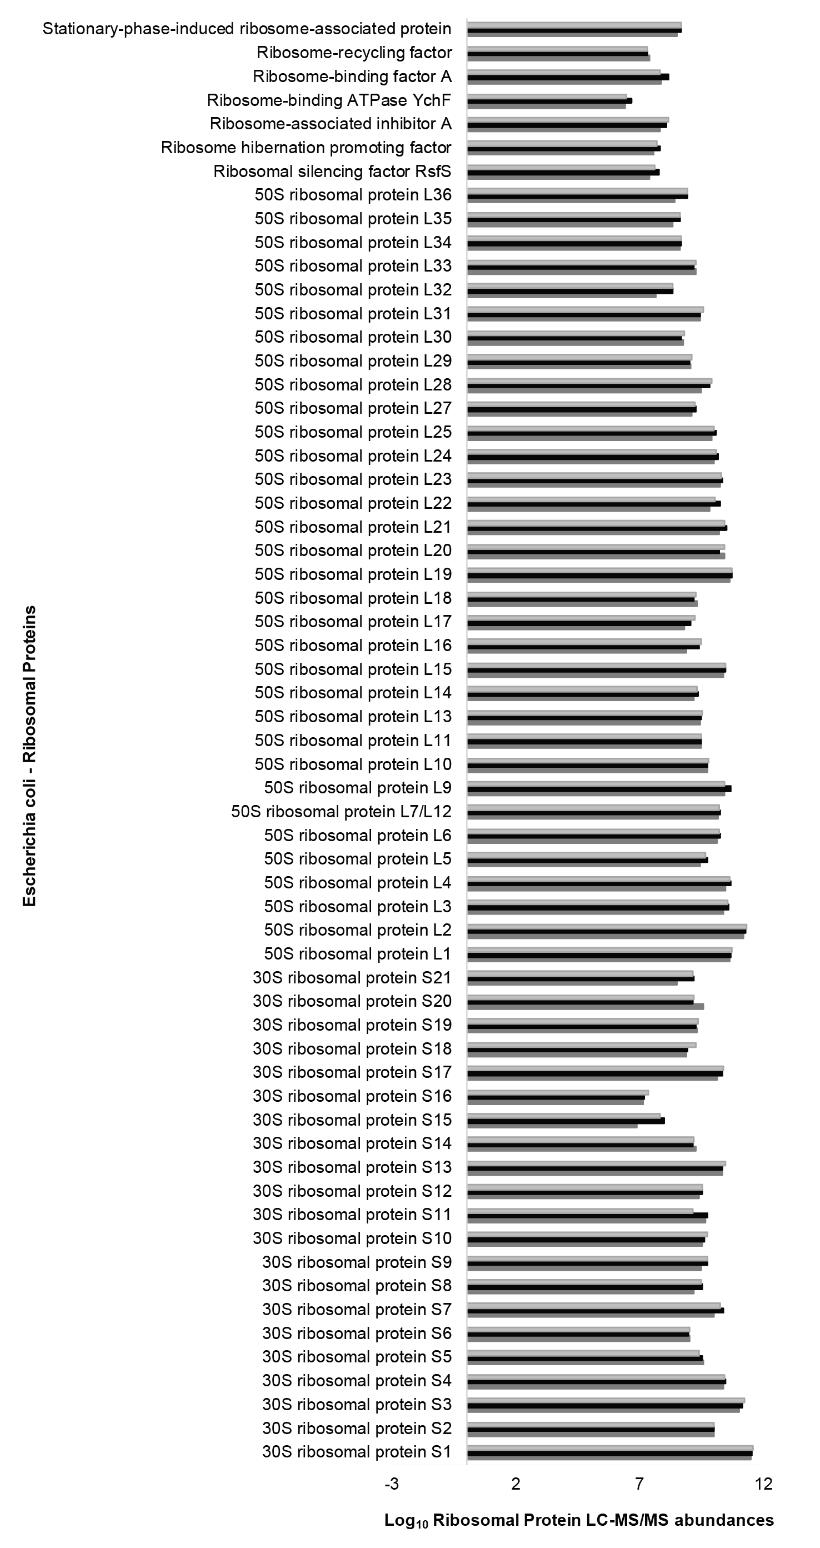
Figure 3. Complete coverage of the Escherichia coli 70S ribosomal proteome from a commercially available preparation obtained by the ribosomal proteomics analysis pipeline. Related to Supplemental Table 2. The ribosomal proteomics pipeline was verified with three independent replicates from the same commercial preparation of Escherichia coli 70S ribosomes. The pipeline tested included ribosome extraction, subsequent purification through a sucrose cushion [following Procedure A using a 60% (w/v) sucrose solution as a cushion to filter the ribosomal particles from any other debris], resuspension of the pelleted complexes with a chaotropic agent to promote ribosomal protein dissociation, and rRNA removal before SP3 beads binding of the ribosomal proteins for protease digestion. The coverage of the 70S ribosomes was complete, with 21 proteins from the 30S small subunit and 33 from the 50S large subunit, plus a small set of expected ribosome-associated factors. The height of the triplicate bars in the plot (i.e., x-axis units) is the log10 value of the LFQ-ribosomal protein abundances as measured by LC-MS/MS from the control ribosomal complexes and quantified by MaxQuant. The y-axis contains the common name of the identified ribosomal proteins.
We can confidently report that in all replicates (Supplemental Table 2), we recovered and profiled all E. coli r-proteins at constant stoichiometries, thus validating that the proposed methodology recovers native and intact ribosomes and that the recovered riboproteome is not fundamentally altered by the purification procedures.
Mass spectrometry parameters: the gradient settings (at a flow rate 300 nL/min) were: solvent B 3%–23% in 59 min, 23%–40% in 10 min, 40%–80% in 5 min, which was maintained at 80% for 5 min before dropping to 3% in 0.1 min with subsequent equilibration at 3% solvent B for 9.9 min. An Eclipse Orbitrap mass spectrometer with nano electrospray ionization (ESI) source at positive mode was used for all LC-MS/MS experiments. The spray voltages, ion funnel RF, and capillary temperature level settings were 1.9 kV, 30%, and 275 °C, respectively. Mass spectra were acquired at 3 s per cycle per full MS scan spectra and as many data-dependent higher-energy C-trap dissociation (HCD)-MS/MS spectra as possible. The full scan MS spectra were set to capture ions between a m/z of 375 and 1500, with the maximum ion trapping time of 50 ms, and an auto gain control target value of 4e5; the resolution was 120,000 at a m/z of 200. The m/z isolation window was 1.6, with an auto gain control target value of 5e4, a normalized collision energy of 30%, with a maximum ion trapping time of 22 ms, and a resolution of 15,000 at a m/z of 200 was used to perform data-dependent HCD-MS/MS of precursor ions (with charge states ranging from 2 to 6).
The resulting dataset was deposited to the Proteome Xchange Consortium [39] via the PRIDE [40] partner repository under complete data submission, which means that all sequenced peptides and identified proteins can be actively browsed for. The dataset identifier is PXD032938 (DOI: 10.6019/PXD032938).
General notes and troubleshooting
General notes
We found that the simplest way to obtain apical root meristems from barley seedlings in a physiologically legitimate way was to germinate the plants in 15 cm dishes completely covered to avoid any light for 3–5 days (optimal germination time for barley). This ensured a dark environment for the root systems while providing the necessary nutrient solution to start germination. Imbibition is recommended in the dark 24 h before plating.
Any space or oven set to 37 °C works for the incubation steps.
We do not recommend standardizing the amount of polysomes that enter the pipeline, since these quantities are calculated based on rRNA absorbance, and as such are not a reflection of the r-proteome dynamic changes. Instead, we standardize the number of r-proteins that enter protease digestion. We do recommend recording and reporting the total amount of polysomes (i.e., derived from rRNA absorbances during fractionation of the ultracentrifuged sucrose gradients) as a reflection of active translation.
The volume may differ between samples. Total fractions volume should be between 400 and 800 µL. The maximum volume of ultracentrifugation tubes is 1 mL.
This will decrease the 60% (w/v) sucrose concentration, allowing all polysomes to pellet during ultracentrifugation. The recommendation is to prepare a pre-resuspension buffer without additions and store it at 4 °C. Before resuspension, add the translational stallers and reducing reagents.
Rotor and ultracentrifuge availability: The ultracentrifuge and rotor-specific runs that we describe here can be adjusted to whatever equipment you have access to by using our parameters and the Beckman-Coulter rotor conversion tool to find the equivalent run in your own equipment (https://www.beckman.com/centrifuges/rotors/calculator).
Always keep the samples on ice.
RNA pellets can be stored at -20 °C for later use.
Ideally, the standard curve should be prepared in the same solution as the test samples. Alternatively, always include controls without protein with the same solution as the test samples to check that there is no reactivity, thus validating a standard curve built in ultra-pure water.
Each aliquot contains approximately 2000 absorbance260 units, equating to approximately 102 µg of ribosomes and 23 µg of r-proteins.
Rotor and ultracentrifuge availability: The ultracentrifuge and rotor-specific runs that we describe here can be adjusted to whatever equipment you have access to by using our parameters and the Beckman-Coulter rotor conversion tool to find the equivalent run in your own equipment (https://www.beckman.com/centrifuges/rotors/calculator).
Incubation steps at 37 °C: Incubation steps were performed in a 37 °C room, but these can be done in any oven that can be set to the appropriate temperature.
Digestion times: Digestion times can vary from 12 to 24 h, but we recommend always keeping them reproducible irrespective of the range of your choice. Quenching the digestion with acid must be done as fast as possible to ensure reproducibility across samples.
Safe stopping points: We have successfully stored polysome pellets for up to six months at -80 °C. After resuspension in GuHCl, the safest stop point for undigested proteins is after reduction and alkylation when proteins will stay denatured until the following steps. We recommend not storing like this for more than a couple of weeks since TEAB buffer slowly loses its buffering capacity. After digestion, clean peptides can be stored preferably at -80 °C indefinitely, but we have stored peptides at room temperature for up to a month.
Beads solutions: Resuspended working solutions of magnetic beads are good for a month when stored at 4 °C.
Stable isotope titration and optimal labeling timing: Stable isotope labeling must be done long enough so that the metabolic targets (i.e., amino acids) reach a steady-state level of label incorporation, which typically lasts for a couple of days and allows the experimental period to be conducted within. This ensures that a fixed amount of your soluble amino acid pools is enriched when your experiment starts, and thus that the correction of peptide enrichments is legitimate. Failure to do this may result in irreproducible peptide enrichments.
SPE cartridges arrangement: We recommend gluing the SPE cartridges with regular tape onto an elevated surface in a way in which their bottom openings can fit into a receiving microcentrifuge tube. In this way, peptides will be eluted directly into the microcentrifuge tubes. SPE cartridges can dry without compromising the number of recovered peptides.
Acknowledgments
We thank the Mass Spectrometry and Proteomics Facility of The Bio21 Molecular Science and Biotechnology Institute at The University of Melbourne for the support of mass spectrometry analysis. F.M.-S. acknowledges the Max-Planck Society (Max Planck Institute of Molecular Plant Physiology) and the University of Melbourne for funding his research via the Melbourne-Potsdam PhD Programme (MelPoPP).
Competing interests
The authors declare that the research was conducted in the absence of any commercial or financial relationships that could be construed as a potential conflict of interest.
References
- Martinez-Seidel, F., Suwanchaikasem, P., Gentry-Torfer, D., Rajarathinam, Y., Ebert, A., Erban, A., Pereira Firmino, A. A., Nie, S., Leeming, M. G., Williamson, N. A., et al. (2022). Remodelled Ribosomes Synthesise a Specific Proteome in Proliferating Plant Tissue during Cold. bioRxiv: e518201. https://doi.org/10.1101/2022.11.28.518201
- Erban, A., Martinez-Seidel, F., Rajarathinam, Y., Dethloff, F., Orf, I., Fehrle, I., Alpers, J., Beine-Golovchuk, O. and Kopka, J. (2020). Multiplexed Profiling and Data Processing Methods to Identify Temperature-Regulated Primary Metabolites Using Gas Chromatography Coupled to Mass Spectrometry. Hincha, D. K. and Zuther, E. (Eds.) In: Methods in Molecular Biology. Springer US, 203-239. https://doi.org/10.1007/978-1-0716-0660-5_15
- Bowman, J. C., Petrov, A. S., Frenkel-Pinter, M., Penev, P. I. and Williams, L. D. (2020). Root of the Tree: The Significance, Evolution, and Origins of the Ribosome. Chem. Rev. 120(11): 4848–4878. https://doi.org/10.1021/acs.chemrev.9b00742
- Woese, C. R., Kandler, O. and Wheelis, M. L. (1990). Towards a natural system of organisms: proposal for the domains Archaea, Bacteria, and Eucarya.. Proc. Natl. Acad. Sci. U.S.A. 87(12): 4576–4579. https://doi.org/10.1073/pnas.87.12.4576
- Woese, C. R. and Fox, G. E. (1977). Phylogenetic structure of the prokaryotic domain: The primary kingdoms. Proc. Natl. Acad. Sci. U.S.A. 74(11): 5088–5090. https://doi.org/10.1073/pnas.74.11.5088
- Ciccarelli, F. D., Doerks, T., von Mering, C., Creevey, C. J., Snel, B. and Bork, P. (2006). Toward Automatic Reconstruction of a Highly Resolved Tree of Life. Science 311(5765): 1283–1287. https://doi.org/10.1126/science.1123061
- Fournier, G. P. and Gogarten, J. P. (2010). Rooting the Ribosomal Tree of Life. Mol. Biol. Evol. 27(8): 1792–1801. https://doi.org/10.1093/molbev/msq057
- Bernier, C. R., Petrov, A. S., Kovacs, N. A., Penev, P. I. and Williams, L. D. (2018). Translation: The Universal Structural Core of Life. Mol. Biol. Evol. 35(8): 2065–2076. https://doi.org/10.1093/molbev/msy101
- Charlebois, R. L. and Doolittle, W. F. (2004). Computing prokaryotic gene ubiquity: Rescuing the core from extinction. Genome Res. 14(12): 2469–2477. https://doi.org/10.1101/gr.3024704
- Harris, J. K., Kelley, S. T., Spiegelman, G. B. and Pace, N. R. (2003). The Genetic Core of the Universal Ancestor. Genome Res. 13(3): 407–412. https://doi.org/10.1101/gr.652803
- Koonin, E. V. (2003). Comparative genomics, minimal gene-sets and the last universal common ancestor. Nat. Rev. Microbiol. 1(2): 127–136. https://doi.org/10.1038/nrmicro751
- Martinez-Seidel, F., Beine-Golovchuk, O., Hsieh, Y. C. and Kopka, J. (2020). Systematic Review of Plant Ribosome Heterogeneity and Specialization. Front. Plant Sci. 11: e00948. https://doi.org/10.3389/fpls.2020.00948
- Genuth, N. R. and Barna, M. (2018). The Discovery of Ribosome Heterogeneity and Its Implications for Gene Regulation and Organismal Life. Mol. Cell 71(3): 364–374. https://doi.org/10.1016/j.molcel.2018.07.018
- Shi, Z., Fujii, K., Kovary, K. M., Genuth, N. R., Röst, H. L., Teruel, M. N. and Barna, M. (2017). Heterogeneous Ribosomes Preferentially Translate Distinct Subpools of mRNAs Genome-wide. Mol. Cell 67(1): 71–83.e7. https://doi.org/10.1016/j.molcel.2017.05.021
- Ferretti, M. B., Ghalei, H., Ward, E. A., Potts, E. L. and Karbstein, K. (2017). Rps26 directs mRNA-specific translation by recognition of Kozak sequence elements. Nat. Struct. Mol. Biol. 24(9): 700–707. https://doi.org/10.1038/nsmb.3442
- Siodmak, A., Martinez-Seidel, F., Rayapuram, N., Bazin, J., Alhoraibi, H., Gentry-Torfer, D., Tabassum, N., Sheikh, A. H., Kise, J. K. G., Blilou, I., et al. (2023). Dynamics of ribosome composition and ribosomal protein phosphorylation in immune signaling in Arabidopsis thaliana. Nucleic Acids Res. 51(21): 11876–11892. https://doi.org/10.1093/nar/gkad827
- Martinez-Seidel, F., Hsieh, Y. C., Walther, D., Kopka, J. and Pereira Firmino, A. A. (2021b). COSNet i: ComplexOme-Structural Network Interpreter used to study spatial enrichment in metazoan ribosomes. BMC Bioinformatics 22(1): 605-605. https://doi.org/10.1186/s12859-021-04510-z
- Chasapis, C. T. (2019). Building Bridges Between Structural and Network-Based Systems Biology. Mol. Biotechnol. 61(3): 221–229. https://doi.org/10.1007/s12033-018-0146-8
- Smirnova, J., Loerke, J., Kleinau, G., Schmidt, A., Bürger, J., Meyer, E. H., Mielke, T., Scheerer, P., Bock, R., Spahn, C. M. T., et al. (2023). Structure of the actively translating plant 80S ribosome at 2.2 Å resolution. Nat. Plants 9(6): 987–1000. https://doi.org/10.1038/s41477-023-01407-y
- Matsuo, Y., Tesina, P., Nakajima, S., Mizuno, M., Endo, A., Buschauer, R., Cheng, J., Shounai, O., Ikeuchi, K., Saeki, Y., et al. (2020). RQT complex dissociates ribosomes collided on endogenous RQC substrate SDD1. Nat. Struct. Mol. Biol. 27(4): 323–332. https://doi.org/10.1038/s41594-020-0393-9
- Flis, J., Holm, M., Rundlet, E. J., Loerke, J., Hilal, T., Dabrowski, M., Bürger, J., Mielke, T., Blanchard, S. C., Spahn, C. M., et al. (2018). tRNA Translocation by the Eukaryotic 80S Ribosome and the Impact of GTP Hydrolysis. Cell Rep. 25(10): 2676–2688.e7. https://doi.org/10.1016/j.celrep.2018.11.040
- Fernie, A. R. and Stitt, M. (2012). On the Discordance of Metabolomics with Proteomics and Transcriptomics: Coping with Increasing Complexity in Logic, Chemistry, and Network Interactions Scientific Correspondence. Plant Physiol. 158(3): 1139–1145. https://doi.org/10.1104/pp.112.193235
- van de Waterbeemd, M., Tamara, S., Fort, K. L., Damoc, E., Franc, V., Bieri, P., Itten, M., Makarov, A., Ban, N., Heck, A. J. R., et al. (2018). Dissecting ribosomal particles throughout the kingdoms of life using advanced hybrid mass spectrometry methods. Nat. Commun. 9(1): e1038/s41467–018–04853–x. https://doi.org/10.1038/s41467-018-04853-x
- Ingolia, N. T., Brar, G. A., Rouskin, S., McGeachy, A. M. and Weissman, J. S. (2012). The ribosome profiling strategy for monitoring translation in vivo by deep sequencing of ribosome-protected mRNA fragments. Nat. Protoc. 7(8): 1534–1550. https://doi.org/10.1038/nprot.2012.086
- Ting, M. K. Y., Gao, Y., Barahimipour, R., Ghandour, R., Liu, J., Martinez-Seidel, F., Smirnova, J., Gotsmann, V. L., Fischer, A., Haydon, M. J., et al. (2023). Guidelines for Performing Ribosome Profiling in Plants Including Structural Analysis of rRNA Fragments. bioRxiv: e567332. https://doi.org/10.1101/2023.11.16.567332
- Batth, T. S., Tollenaere, M., Rüther, P., Gonzalez-Franquesa, A., Prabhakar, B. S., Bekker-Jensen, S., Deshmukh, A. S. and Olsen, J. V. (2019). Protein Aggregation Capture on Microparticles Enables Multipurpose Proteomics Sample Preparation*. Mol. Cell. Proteomics 18(5): 1027a–1035. https://doi.org/10.1074/mcp.tir118.001270
- Hughes, C. S., Moggridge, S., Müller, T., Sorensen, P. H., Morin, G. B. and Krijgsveld, J. (2018). Single-pot, solid-phase-enhanced sample preparation for proteomics experiments. Nat. Protoc. 14(1): 68–85. https://doi.org/10.1038/s41596-018-0082-x
- Moggridge, S., Sorensen, P. H., Morin, G. B. and Hughes, C. S. (2018). Extending the Compatibility of the SP3 Paramagnetic Bead Processing Approach for Proteomics. J. Proteome Res. 17(4): 1730–1740. https://doi.org/10.1021/acs.jproteome.7b00913
- Martinez-Seidel, F., Beine-Golovchuk, O., Hsieh, Y. C., Eshraky, K. E., Gorka, M., Cheong, B. E., Jimenez-Posada, E. V., Walther, D., Skirycz, A., Roessner, U., et al. (2021). Spatially Enriched Paralog Rearrangements Argue Functionally Diverse Ribosomes Arise during Cold Acclimation in Arabidopsis. Int. J. Mol. Sci. 22(11): 6160. https://doi.org/10.3390/ijms22116160
- Martinez-Seidel, F., Suwanchaikasem, P., Nie, S., Leeming, M. G., Pereira Firmino, A. A., Williamson, N. A., Kopka, J., Roessner, U. and Boughton, B. A. (2021). Membrane-Enriched Proteomics Link Ribosome Accumulation and Proteome Reprogramming With Cold Acclimation in Barley Root Meristems. Front. Plant Sci. 12: e656683. https://doi.org/10.3389/fpls.2021.656683
- Figueroa, N. E., Franz, P., Luzarowski, M., Martinez‐Seidel, F., Moreno, J. C., Childs, D., Ziemblicka, A., Sampathkumar, A., Andersen, T. G., Tsiavaliaris, G., et al. (2023). Protein interactome of 3′,5′‐cAMP reveals its role in regulating the actin cytoskeleton. Plant J. 115(5): 1214–1230. https://doi.org/10.1111/tpj.16313
- Poorter, H., Niinemets, Ã., Ntagkas, N., Siebenkäs, A., Mäenpää, M., Matsubara, S. and Pons, T. (2019). A meta‐analysis of plant responses to light intensity for 70 traits ranging from molecules to whole plant performance. New Phytol. 223(3): 1073–1105. https://doi.org/10.1111/nph.15754
- Hunt, R. and Cornelissen, J. (1997). Components of relative growth rate and their interrelations in 59 temperate plant species. New Phytol. 135(3): 395–417. https://doi.org/10.1046/j.1469-8137.1997.00671.x
- Fisher, R. A. (1921). Some remarks on the methods formulated in a recent article on “The quantitative analysis of plant growth.”. Ann. Appl. Biol. 7(4): 367–372. https://doi.org/10.1111/j.1744-7348.1921.tb05524.x
- Blackman, V. H. (1919). The Compound Interest Law and Plant Growth. Ann. Bot. 33(131): 353–360. https://doi.org/10.1093/oxfordjournals.aob.a089727
- Gupta, S., Rupasinghe, T., Callahan, D. L., Natera, S. H. A., Smith, P. M. C., Hill, C. B., Roessner, U. and Boughton, B. A. (2019). Spatio-Temporal Metabolite and Elemental Profiling of Salt Stressed Barley Seeds During Initial Stages of Germination by MALDI-MSI and µ-XRF Spectrometry. Front. Plant Sci. 10: e01139. https://doi.org/10.3389/fpls.2019.01139
- Cheong, B. E., Beine-Golovchuk, O., Gorka, M., Ho, W. W. H., Martinez-Seidel, F., Firmino, A. A. P., Skirycz, A., Roessner, U. and Kopka, J. (2020). Arabidopsis REI-LIKE proteins activate ribosome biogenesis during cold acclimation. Sci. Rep. 11(1): 1–25. https://doi.org/10.1101/2020.02.18.954396
- Firmino, A. A. P., Gorka, M., Graf, A., Skirycz, A., Martinez-Seidel, F., Zander, K., Kopka, J. and Beine-Golovchuk, O. (2020). Separation and Paired Proteome Profiling of Plant Chloroplast and Cytoplasmic Ribosomes. Plants 9(7): 892. https://doi.org/10.3390/plants9070892
- Deutsch, E. W., Bandeira, N., Sharma, V., Perez-Riverol, Y., Carver, J. J., Kundu, D. J., García-Seisdedos, D., Jarnuczak, A. F., Hewapathirana, S., Pullman, B. S., et al. (2019). The ProteomeXchange consortium in 2020: enabling ‘big data’ approaches in proteomics. Nucleic Acids Res. 48(D1): D1145-D1152. https://doi.org/10.1093/nar/gkz984
- Perez-Riverol, Y., Csordas, A., Bai, J., Bernal-Llinares, M., Hewapathirana, S., Kundu, D. J., Inuganti, A., Griss, J., Mayer, G., Eisenacher, M., et al. (2018). The PRIDE database and related tools and resources in 2019: improving support for quantification data. Nucleic Acids Res. 47: D442–D450. https://doi.org/10.1093/nar/gky1106
Supplementary information
The following supporting information can be downloaded here:
- Supplemental Table 1. Metainformation and analyses used to derive the differences in mean peptide length produced with Lys-C or trypsin as in silico proteases for digesting signature ribosomal proteomes across the tree of life. At = Arabidopsis thaliana, Sc = Saccharomyces cerevisiae, Hs = Homo sapiens, Ec = Escherichia coli. Tab A contains the FASTA sequences of the well curated ribosomal proteome. Tab B contains the results from an in silico digestion of the proteome in tab A using lys-C and obtaining, as a result, peptide monoisotopic masses between 200 and 6000 daltons. Tab C contains the same as tab B but using trypsin as protease (no P as digestion rule). Tab D contains the results from the comparison of both digestions in terms of Log2 fold changes and Padj values for peptide mean length per protein entry.
- Supplemental Table 2. Protein content measurements in experimental samples using the BCA kit assay and subsequent ribosomal proteome profiling in E. coli control ribosomes. Tab A contains the measurements performed. Tabs B1 and B2 contain the full and reviewed E. coli ribosomal proteome from UniProt, respectively. Tab C contains the output proteinGroups file from the MaxQuant search using as FASTA target the SwissProt E. coli ribosomal proteome. Tab D contains the abundances of all ribosomal proteins and their graphical analysis.
- Supplemental File 1. R documentation of the functions and methods outlined in the ProtSynthesis package version 0.1.0. This documentation is automatically saved onto your R library upon installation and can be accessed via the help call on the specific functions of the package from the R console. To install the package, please access the local repository in GitHub (https://github.com/MSeidelFed/ProtSynthesis).
- Supplemental File 2. Development of a full usage example of the R package ProtSynthesis as to obtain the results on Martinez-Seidel et al., (2022). Supplementary data is also available to run independently the same example and can be accessed after installation of the R package via the ext_data method. The embedded images in the .html file require a network connection to be displayed, since their path is the local repository of the R package in GitHub (https://github.com/MSeidelFed/ProtSynthesis).
Article Information
Copyright
© 2024 The Author(s); This is an open access article under the CC BY-NC license (https://creativecommons.org/licenses/by-nc/4.0/).
How to cite
Gentry-Torfer, D., Murillo, E., Barrington, C. L., Nie, S., Leeming, M. G., Suwanchaikasem, P., Williamson, N. A., Roessner, U., Boughton, B. A., Kopka, J. and Martinez-Seidel, F. (2024). Streamlining Protein Fractional Synthesis Rates Using SP3 Beads and Stable Isotope Mass Spectrometry: A Case Study on the Plant Ribosome. Bio-protocol 14(9): e4981. DOI: 10.21769/BioProtoc.4981.
Category
Plant Science > Plant biochemistry > Protein > Isolation and purification
Systems Biology
Do you have any questions about this protocol?
Post your question to gather feedback from the community. We will also invite the authors of this article to respond.