- Protocols

- Articles and Issues
- For Authors
- About
- Become a Reviewer

T-Cell-Based Platform for Functional Screening of T-Cell Receptors Identified in Single-Cell RNA Sequencing Data Sets of Tumor-Infiltrating T-Cells
Published: Vol 14, Iss 8, Apr 20, 2024 DOI: 10.21769/BioProtoc.4972 Views: 6791
Reviewed by: Mary Luz UribeAndrea GramaticaDavide PallucciMarco Di Gioia
Original research article
The authors used this protocol in:

Nov 2023
Advertisement

Protocol Collections
Comprehensive collections of detailed, peer-reviewed protocols focusing on specific topics


Related protocols
Abstract
The advent of single-cell RNA sequencing (scRNAseq) has enabled in-depth gene expression analysis of several thousand cells isolated from tissues. We recently reported the application of scRNAseq toward the dissection of the tumor-infiltrating T-cell repertoire in human pancreatic cancer samples. In this study, we demonstrated that combined whole transcriptome and T-cell receptor (TCR) sequencing provides an effective way to identify tumor-reactive TCR clonotypes on the basis of gene expression signatures. An important aspect in this respect was the experimental validation of TCR-mediated anti-tumor reactivity by means of an in vitro functional assay, which is the subject of the present protocol. This assay involves the transient transfection of mRNA gene constructs encoding TCRα/β pairs into a well-defined human T-cell line, followed by co-cultivation with the tumor cells of interest and detection of T-cell activation by flow cytometry. Due to the high transfectability and the low background reactivity of the mock-transfected T-cell line to a wide variety of tumor cells, this assay offers a highly robust and versatile platform for the functional screening of large numbers of TCR clonotypes as identified in scRNAseq data sets. Whereas the assay was initially developed to test TCRs of human origin, it was more recently also applied successfully for the screening of TCRs of murine origin.
Key features
• Efficient functional screening of—and discrimination between—TCRs isolated from tumor-reactive vs. bystander T-cell clones.
• Applicable to TCRs from CD8+ and CD4+ tumor-infiltrating T-cells originating from patient-derived tumor samples and syngeneic mouse tumor models.
• Rapid flow cytometric detection of T-cell activation by means of TNFα and CD107a expression after a 5 h T-cell/tumor cell co-cultivation.
Keywords: Tumor-infiltrating lymphocytesGraphical overview
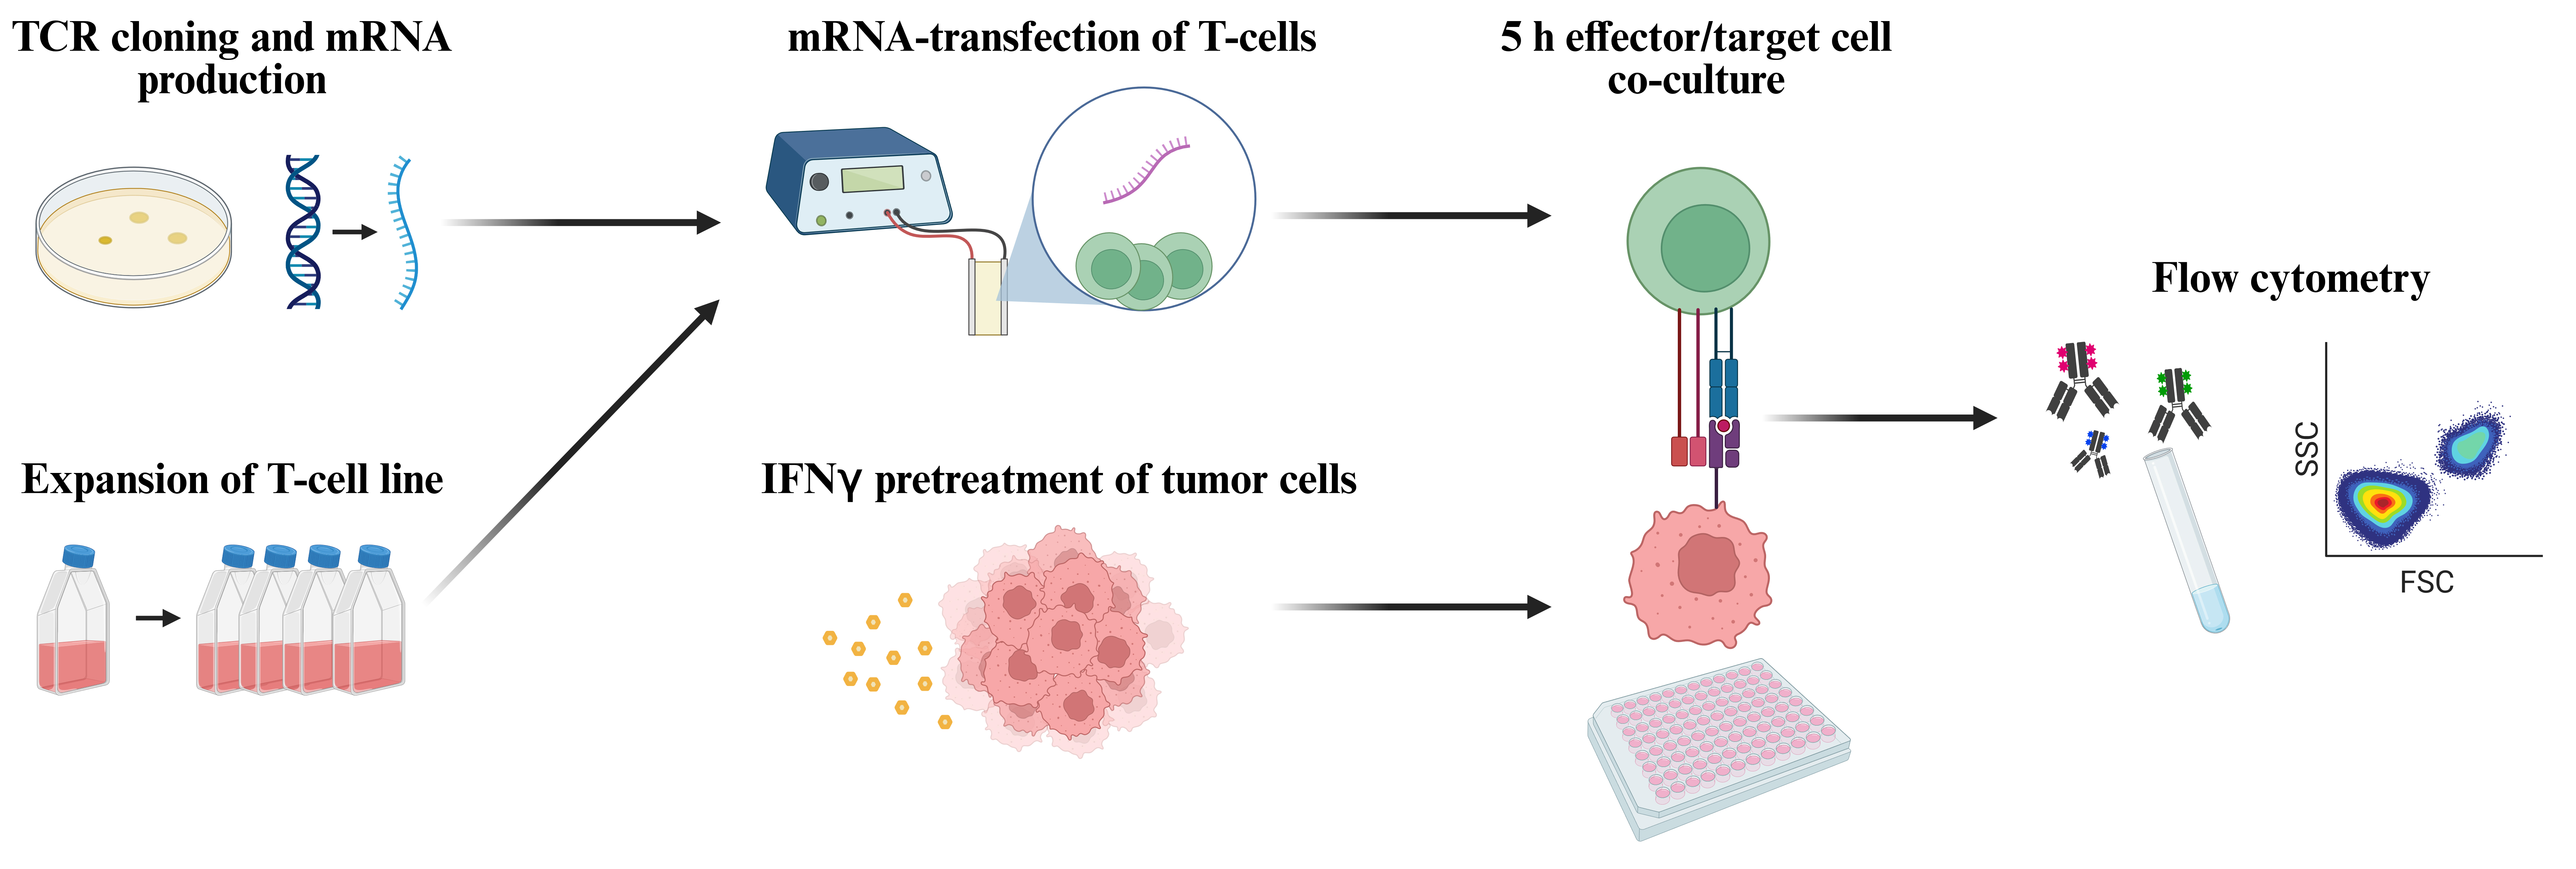
Workflow for functional screening of T-cell receptors (TCRs) as transiently expressed in human T-cells by means of mRNA transfection followed by co-culture with autologous tumor cells and analysis of T-cell reactivity by means of flow cytometric detection of TNFα and CD107a (figure created with BioRender.com).
Background
Crucial to the further improvement of T-cell cancer therapy is detailed information on the anti-tumor reactivity and antigen-specificity of the tumor-infiltrating lymphocyte (TIL) repertoire in large numbers of human tumor samples from different cancer types. In recent years, single-cell RNA sequencing (scRNAseq) technology platforms have emerged to enable the identification of paired T-cell receptor (TCR)α/β sequences in the context of the complete transcriptome for thousands of tumor-infiltrating T-cells. Whereas initial studies primarily focused on discriminating between tumor-reactive and bystander TCR clonotypes on the basis of distinct transcriptomic gene signatures [1], more recent studies including our own encompassed experimental validation of the predicted tumor reactivity by means of molecular cloning of selected TCRα/β pairs and in vitro functional assays with TCR-transfected T-cells [2–7]. In the majority of cases, these screenings were based on the presumption that the immunodominant T-cell antigens in tumors are neoepitopes encoded by somatic mutations in the tumor genome, and therefore focused on TCR screening against libraries of potential neoepitopes. However, it is still an open question whether this class of epitopes truly represents the immunodominant antigens targeted by the natural anti-tumor T-cell response in human cancers.
In view of the latter, based on the low mutational burden of human pancreatic ductal adenocarcinoma (PDAC) [8,9] and the notion that only a small fraction of nonsynonymous mutations is expected to encode immunogenic T-cell epitopes [10–13], we chose to perform an unbiased functional screening of tumor-derived TCRs against autologous tumor cells instead of mutanome-based candidate neoepitopes [7,14]. Evidently, this required a highly robust assay with a favorable signal-to-background ratio. Whereas Jurkat T-cells are commonly used in this respect, the readout for TCR-mediated activation is limited to interleukin-2 production and reporter gene construct expression. Instead, our TCR screening assay is based on a human T-cell line, subsequently referred to as T222, that originated from an ex vivo–expanded culture of tumor-infiltrating T-cells isolated from a human PDAC sample (PDA222). In the context of prior studies, we noticed that the TCR repertoire of this T-cell culture had drastically changed during expansion, leading to the loss of all dominant TCR clonotypes as detected in the tumor sample [15]. Upon further in vitro cultivation according to a well-established rapid expansion protocol [16], we found that this T-cell line grew indefinitely and consistently. Moreover, T222 lacked background reactivity as measured on the basis of multiple commonly applied T-cell activation parameters when co-cultivated with various human tumor cells, including multiple PDAC, colorectal cancer, and melanoma cell lines and cultures, rendering it a potentially suitable tool for the functional screening of TCRs as identified in scRNAseq data sets of tumor-infiltrating T-cell isolates. With respect to TCR gene transduction, we chose transient mRNA transfection, based on the superior results obtained with this technology by colleagues in the field [17]. We selected TNFα and CD107a as markers for T-cell activation, not only because these reflect key aspects of the effector T-cell response (cytokine production and cytolytic activity), but also because both markers can be optimally measured in the context of a 5 h assay. By means of mRNA-transfected T222 cells, we successfully screened > 150 TCRs derived from nine human PDAC samples for reactivity against autologous tumor cells in 5 h co-cultivation assays [7]. In subsequent studies, our assay was also used successfully for the screening of TCRs derived from tumor-reactive CD4+ T-cells and of > 100 TCRs derived from TIL scRNAseq data sets of murine PDAC tumors.
Materials and reagents
Biological materials
T222 cell line as generated by in vitro expansion of tumor-infiltrating lymphocytes of human PDAC sample PDA222 [7]
Tumor cell lines derived from primary tumor samples of PDAC patients [7]
Murine tumor cell lines PDA30364 and PDA30364-OVA [18]
Reagents
T7 mScript standard mRNA production system (Cellscript, catalog number: C-MSC100625)
RNA 6000 Nano Kit for 2100 Bioanalyzer Systems (Agilent, catalog number: 5067-1511)
pcDNATM 3.1(+) (Invitrogen, catalog number: V79020)
Anti-human HLA-A, B, C antibody APC, W6/32 (BioLegend, catalog number: 311410)
Anti-human HLA-DR Antibody PE, LN3 (BioLegend, catalog number: 327008)
X-VIVO 15 (Lonza, catalog number: BE02-060Q)
Human serum type AB (Sigma-Aldrich, catalog number: H4522)
Gentamycin (Life Technologies, catalog number: 15750045)
Amphotericin B (Life Technologies, catalog number: 15290-026)
Human Interleukin-2 Proleukin® S (Clinigen Healthcare, catalog number: 17152.00.00)
Purified anti-human CD3 (Invitrogen, catalog number: 16-0037-85)
Dimethylsulfoxide (DMSO) (Sigma-Aldrich, catalog number: D2650)
Human albumin 20% (CSL Behring, catalog number: PZN: 1468366)
OptiMEM serum-reduced media (Thermo Fisher, catalog number: 31985062)
Advanced DMEM/F12 (Gibco, catalog number: 12634010)
L-Glutamine, 200 mM (Gibco, catalog number: 25030-024)
Penicillin-Streptomycin, 10,000 IU/mL (Gibco, catalog number: 15140-122)
B-27 supplement, 50× (Gibco, catalog number: 17504044)
HEPES, 1 M, pH 7.0–7.6 (Sigma-Aldrich, catalog number: H0887)
Heparin sodium salt, grade I-A (Sigma-Aldrich, catalog number: H3149)
Glucose solution, 200 g/L (Gibco, catalog number: A24940-01)
RPMI 1640 (Gibco, catalog number: 52400-025)
Fetal bovine serum (FBS) (Biowest, catalog number: S181B-500)
DMEM, high glucose (Gibco, catalog number: 41965-039)
Sodium pyruvate, 100 mM (Gibco, catalog number: 11360039)
Recombinant human/murine interferon gamma (IFNγ) (Immunotools, catalog number: 11343536/12343536)
MEKi, GDC-0623, mitogen-activated protein kinase inhibitor (Active Biochem, catalog number: A-1181)
Dulbecco’s phosphate buffered saline (PBS) (Sigma-Aldrich, catalog number: D8537)
Bovine serum albumin (BSA) (Sigma-Aldrich, catalog number: A9418)
EDTA, UltraPure 0.5 M, pH 8.0 (Invitrogen, catalog number: 15575020)
Phorbol 12-myristate 13-acetate (PMA) (Sigma-Aldrich, catalog number: P8139)
Ionomycin calcium salt (Sigma-Aldrich, catalog number: I0634)
Anti-human CD107a Antibody PE/APC, H4A3 (BioLegend, catalog number: 328608/328620)
GolgiStop, Protein Transport Inhibitor (BD Biosciences, catalog number: 554724)
GolgiPlug, Protein Transport Inhibitor (BD Biosciences, catalog number: 555029)
LIVE/DEAD Fixable Aqua Dead Cell Stain kit (DCM) (Life Technologies, catalog number: L34957)
Anti-mouse CD16/32, 93 (BioLegend, catalog number: 101320)
Anti-mouse CD16.2, 9E9 (BioLegend, catalog number: 149502)
Anti-human CD3 antibody Brilliant Violet 711, OKT3 (BioLegend, catalog number: 317328)
Anti-human CD4 antibody APC/Fire 750, SK3 (BioLegend, catalog number: 344638)
Anti-human CD8a antibody Alexa Fluor 700, HIT8a (BioLegend, catalog number: 300920)
Anti-mouse TCR beta chain antibody Brilliant Violet 421, H57-597 (BioLegend, catalog number: 109230)
Anti-mouse CD8a antibody PerCP, 53-6.7 (BioLegend, catalog number: 100732)
Anti-mouse CD8b antibody PE, YTS156.7.7 (BioLegend, catalog number: 126608)
Anti-mouse CD4 antibody PE, GK1.5 (BioLegend, catalog number: 100408)
Cytofix/Cytoperm Fixation/Permeabilization kit (BD Biosciences, catalog number: 554714)
Perm/Wash buffer, included in Fixation/Permeabilization kit (BD Biosciences, catalog number: 51-2091KZ)
Anti-human TNF alpha antibody Alexa Fluor 488, MAb11 (BioLegend, catalog number: 502915)
Solutions
T-cell expansion medium (see Recipes)
Freezing medium (see Recipes)
T-cell medium (see Recipes)
Tumor cell medium I: human (see Recipes)
Tumor cell medium II: mouse (see Recipes)
FACS buffer (see Recipes)
Recipes
T-cell expansion medium
X-VIVO 15 supplemented with 2% human serum type AB, 100 IU/mL penicillin-streptomycin, 20 µg/mL gentamycin, 2.5 µg/mL amphotericin B, and 30 ng/mL purified anti-human CD3
Freezing medium
FBS supplemented with 10% DMSO
T-cell medium
X-VIVO 15 supplemented with 2% human albumin
Tumor cell medium I: human
DMEM/F12+ supplemented with 2 mM L-glutamine, 100 IU/mL penicillin-streptomycin, 2% B27 supplement (50×), 5 mM HEPES, 12 mg/mL heparin, and 6 g/L glucose
Tumor cell medium II: mouse
DMEM supplemented with 10% FBS, 100 IU/mL penicillin-streptomycin, and 1 mM sodium pyruvate
FACS buffer
PBS supplemented with 0.5% BSA and 5 mM EDTA
Laboratory supplies
T25 tissue culture flask (TPP, catalog number: TPP90026)
Cuvette, 0.4 cm gap Gene Pulser/MicroPulser Electroporation (Bio-Rad, catalog number: 1652088)
24-well plate, flat bottom, TC-treated (VWR, catalog number: 734-2325)
96-well U-bottom plate, round bottom, TC-treated (Avantor, catalog number: 734-2328)
96-well plate, flat bottom, polystyrene (TPP, catalog number: TPP92096)
96-well V-bottom plate, conical bottom, non treated, no lid (Costar, catalog number: 3897)
Pasteur pipette, glass 230 mm, no filter (WU Mainz, catalog number: 200763)
15 mL tube conical bottom (Greiner, catalog number: 188271-N)
50 mL tube conical bottom, polypropylene (Falcon, catalog number: 352070)
Equipment
2100 Bioanalyzer (Agilent)
Incubator Heracell 240i (Thermo Scientific, catalog number: 51032875)
Centrifuge 5810R refrigerated (Eppendorf, catalog number: EPP-022628187)
Electroporator, Gene Pulser Xcell Systems with ShockPod cuvette chamber (Bio-Rad, catalog number: 1652660)
LSRFortessaTM cell analyzer (BD Biosciences)
Software
FlowJo v10.9.0 (FlowJo LLC, Ashland, OR, USA)
Bio Render (https://www.biorender.com/)
Procedure
TCR cloning strategy and production of in vitro–transcribed mRNA for transfection
T-cell receptor V(D)J α- and β-chain nucleotide sequences from TCR clonotypes of interest as identified in scRNAseq data sets are synthesized as DNA oligomers. Seamless Golden Gate assembly is used for their insertion into the bicistronic TCR expression cassette pTRAC, as depicted in Figure 1. The template for synthesis of in vitro–transcribed mRNA is generated by linearization of the expression vector at the NotI site located downstream of the expression cassette. The T7 mScript Standard mRNA Production System is used for the generation of capped and poly(A)-tailed mRNA as outlined in the protocol provided by the manufacturer. mRNA quality is routinely checked for showing a single peak on the 2100 Bioanalyzer system using Agilent RNA 6000 Nano chips.
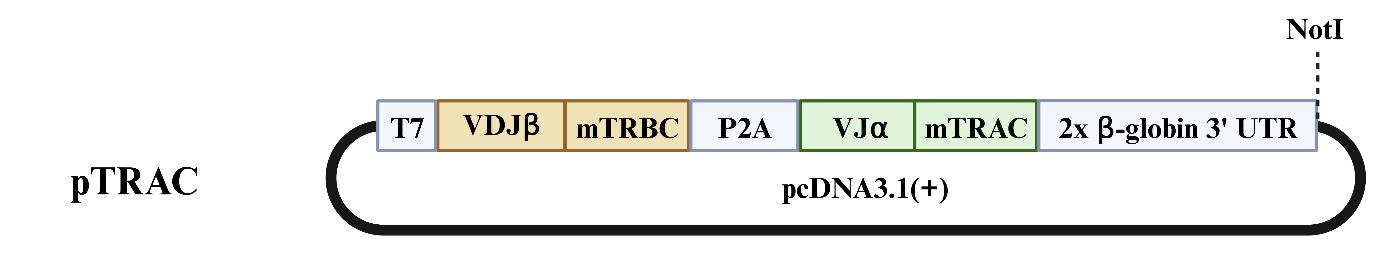
Figure 1. pcDNA3.1(+) vector with T7 promotor enabling in vitro transcription of mRNA encoding both a TCRβ and a TCRα chain. The variable VDJβ and VJα sequences are joined in-frame with the mouse TCRβ-constant (mTRBC) and TCRα-constant (mTRAC) domains, respectively, resulting in a bicistronic open reading frame in which the TCRβ and TCRα coding sequences are separated by a self-cleaving P2A site, as described in detail by Kropp et al. [19]. mTRBC and mTRAC sequences harbor the previously described T48C and S57C mutations, respectively, resulting in an additional interchain disulfide bond [20,21]. The latter mutations in combination with the use of murine constant regions reduce mispairing of the transfected T-cell receptor (TCR) with endogenously expressed TCR chains in human T-cells. Furthermore, this allows for flow cytometric detection of cell surface expression of the gene transduced TCR by means of a monoclonal antibody against the mouse TCRβ (mTCRβ) constant domain. Downstream of this open reading frame is a 3’UTR consisting of two tandem copies of the human β-globin gene that improve stability of the resulting transcript in cells [22]. The expression cassette is embedded in the pcDNA3.1(+) vector, allowing in vitro transcription through the T7 promoter sequence.Testing of CD8+ TCRs in mRNA-transfected human T-cells for anti-tumor reactivity
The success of our assay for the functional screening of multiple TCRs stands or falls with the choice of T-cells and the preparation of the tumor cells, as discussed in detail in this paragraph. As mentioned in the Background section, we routinely use human T-cell line T222 for functional TCR screening experiments. This T-cell line was derived from a primary TIL culture of a human PDAC sample. Upon in vitro cultivation according to a well-established rapid expansion protocol [16], we found that this T-cell line grew indefinitely and consistently. T222 cells efficiently express the majority of TCRs upon mRNA transfection in approximately 90% of the cells (Figure 2), with the exception of unmatched TCRα/β pairs and some rare cases. We found T222 to lack background reactivity when co-cultivated with the vast majority of human tumor cells tested (see example in Figure 2), rendering it highly suitable for the functional screening of TCRs as identified in scRNAseq data sets of human TIL samples. In the context of the present protocol description, this raises two questions that are important to address:
How unique is the T222 line and could T-cell lines with similar properties be readily generated in other labs?
What would be the best strategy to generate similar T-cell lines?
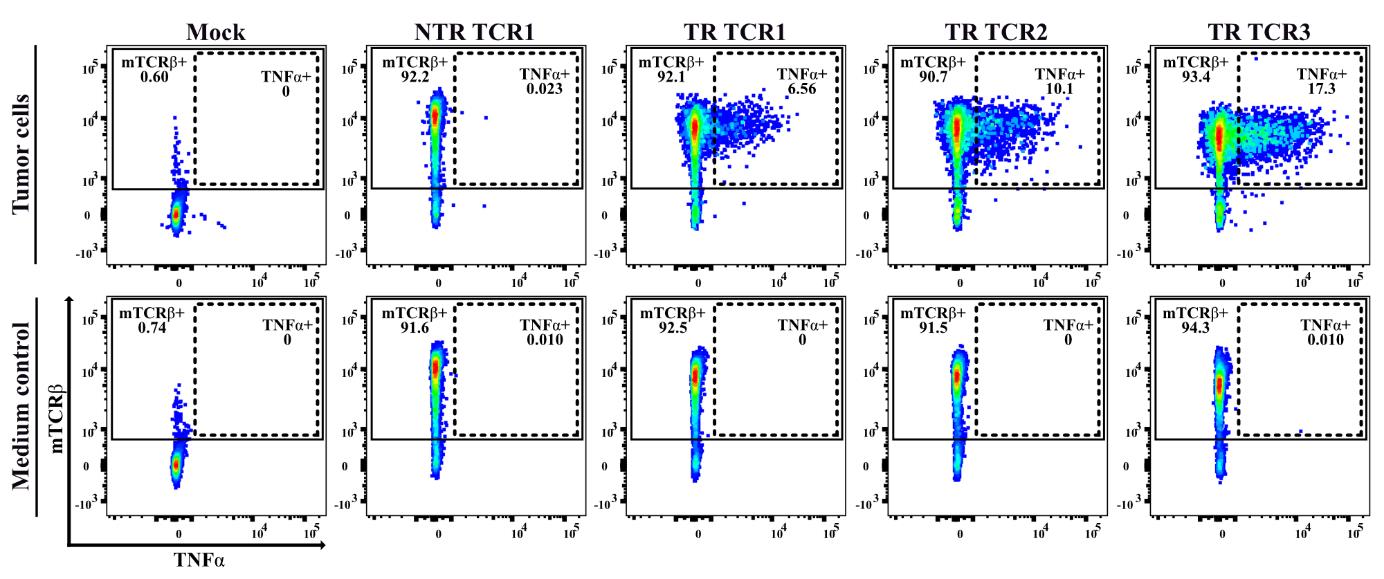
Figure 2. Functional T-cell receptor (TCR) screening in a 5 h T-cell/tumor cell co-cultivation assay. Representative example of flow cytometry data showing the outcome of functional testing of four different CD8+ T-cell-derived TCRs, isolated from the same human pancreatic ductal adenocarcinoma (PDAC) tumor sample, upon transfection into human CD8+ T222 cells [7]. Left to right: mock-transfected T-cells, followed by T-cells transfected with a non-tumor-reactive (NTR) TCR and three different tumor-reactive (TR) TCRs. The tumor cells originated from the same patient-derived tumor sample as the four tested TCRs and were pretreated with IFNγ. The dot plots depict the expression of the mouse TCRβ-constant domain and intracellular TNFα in CD3+CD8+ T-cells, thereby demonstrating that T-cell reactivity is mediated by the transfected TCRs.In the course of our work, we have evaluated the suitability for TCR screening of additional expanded TIL cultures as obtained from other human tumor samples, including settings with TILs and tumor cells from the same patients, with variable outcome. Some of these T-cell lines displayed similar qualities as T222, illustrating the feasibility of generating suitable TIL-derived T-cell lines in other laboratories. Other TIL-derived T-cell lines were found to maintain strong reactivity against the autologous tumor, which we found to be associated with persistence of tumor-reactive TCR clonotypes in spite of repeated expansion ([15] and unpublished data). Furthermore, some of the TIL-derived T-cell lines exhibited broader anti-tumor reactivity, presumably due to allo-reactivity. We postulate that the desirable properties of T222 and several other TIL-derived T-cell lines may be related to the greater clonality of these T-cell lines as compared to peripheral blood mononuclear cells (PBMC)-derived T-cell cultures [15], thereby reducing the likelihood that a fraction of the T-cells express allo/cross-reactive TCRs resulting in background reactivity in functional T-cell assays.
Cultivate cells according to the rapid expansion protocol as described by Dudley et al. [16]. See Figure S1 and appending text for details.
Validate each batch prior to use in TCR screening experiments for CD8+/CD4+ ratio and TCR transfection efficiency.
Thaw T-cells 72 h prior to transfection. The preculture increases the viability after electroporation. See Note 1 and Figure S2 for estimation of required T-cell number, taking into account potential proliferation during the 72 h culture and cell loss due to electroporation.
Seed 3 × 10⁶ T-cells (viable cells as counted with trypan blue staining, e.g., using Vi-CELL counter) per well in 1 mL of T-cell medium + 300 IU of IL-2 in a 24-well plate. The cells of all wells will be pooled before electroporation.
Culture T-cells for 72 h at 37 °C and 5 % CO2.
Add 333 IU/mL of human IFNγ to tumor cell culture and incubate for 48 h. As shown in Figure 4, IFNγ pretreatment should be initiated 72 h before initiation of T-cell/tumor cell co-cultures. See Note 2 for IFNγ concentration.
Pre-chill cuvettes and OptiMEM at 4 °C on day of electroporation.
Pre-heat T-cell medium to 37 °C.
Keep all preparations/solutions containing RNA on ice to avoid degradation.
Prepare RNA-OptiMEM mix (4 °C):
Use 5 µg (per 5 × 10⁶ cells) of in vitro–transcribed capped and tailed mRNA per TCR. Fill up with OptiMEM to 25 µL to reach 1/10th of the total transfection volume.
Collect precultured T-cells from 24-well plate in 50 mL tube and wash twice with ice-cold OptiMEM at 350× g for 5 min at 4 °C.
Set concentration to 20 × 106 cells/mL in OptiMEM. Keep cells on ice.
Pipette 250 µL of T-cell suspension (5 × 10⁶ cells) into pre-chilled cuvette. Add 25 µL of ice-cold RNA-OptiMEM mix containing 5 µg of TCR-mRNA. Mix by pipetting thoroughly, avoiding air bubbles. Place lid on cuvette to keep sterile.
Carefully wipe outside of cuvette dry with tissue; wet cuvettes may cause malfunction of electroporation device.
Place cuvette in Bio-Rad ShockPodTM cuvette chamber and electroporate cells with one square-wave pulse of 500 V for 5 ms.
After electroporation, immediately add 1 mL of pre-heated (37 °C) T-cell medium to the T-cells and transfer these with a Pasteur pipette from the cuvette to one well of a 24-well plate.
Repeat for each TCR-RNA and collect in separate wells.
Transfer plate with electroporated T-cells to incubator after no more than four electroporations. Cells should be transferred at latest 5 min after electroporation into incubator to avoid excessive loss of cell viability (Note 3).
Culture transfected T-cells for 20–24 h before initiating T-cell/tumor cell co-culture.
See Figure 5 for an example of a 96-well plate layout.
Seed IFNγ-pretreated, adherent tumor cells into relevant wells of 96-well flat-bottom plate 24 h before co-culture. Aim for tumor cell cultures to be 90%–100% confluent on the day of co-culture for optimal assay sensitivity (see Figure S4A). See Notes 4 and 5 for setting up assays with non-adherent or freshly trypsinized tumor/target cells.
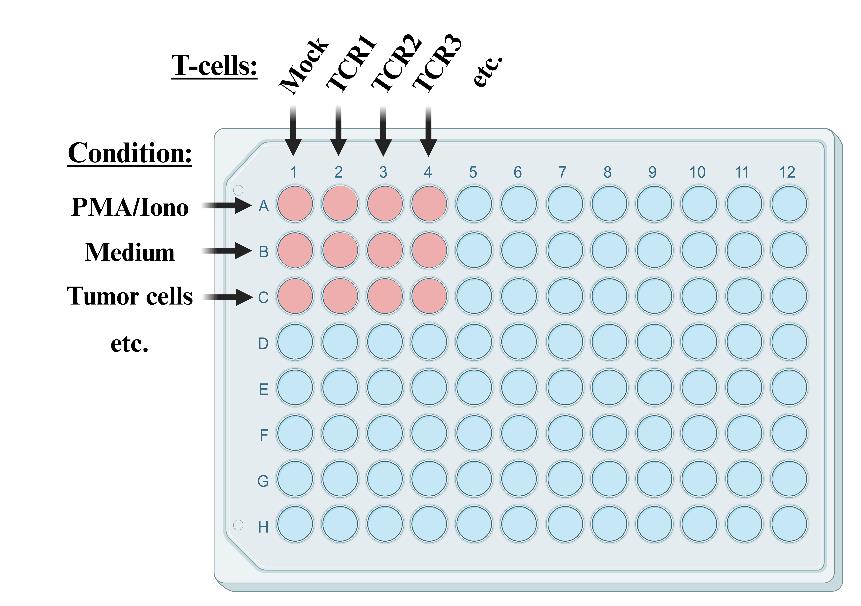
Figure 5. Example of co-culture plate layout. Columns 1–12 are typically used to test T-cells transfected with different T-cell receptors (TCRs). In this context, rows A–H are used to test reactivity of TCR-transfected T-cells under different conditions, e.g., with media only (negative control), in the presence of PMA/ionomycin (positive control), in the presence of one or more different tumor cell lines, and/or in the presence of immunomodulatory substances such as anti-PD-L1 antibodies [23]. It is advisable to keep the row with the PMA/ionomycin condition separated from the rows in which reactivity to tumor cells is tested in order to avoid accidental spillover of PMA/ionomycin-containing media. In case all rows on the plate are used, use rows A and B for PMA/ionomycin and media controls, respectively, as shown in figure. In case six or less rows are used, use row A for media control, rows B–F for testing conditions, and row H for PMA/ionomycin control. Figure created with BioRender.com.Setup of different assay conditions as shown in Figure 5:
Carefully remove supernatant from the wells in which tumor cells were seeded on Day 3 without affecting adherence of the tumor cells.
Wash with 200 µL of PBS, carefully remove supernatant, and add 50 µL of T-cell medium to the tumor cell–containing wells.
Prepare PMA/ionomycin master mix for positive control cultures, consisting of T-cell medium with 400 ng/mL of PMA and 2 µg/mL of ionomycin calcium salt (ionomycin).
Add 50 µL of PMA/ionomycin master mix to each positive control well as indicated in Figure 5. Final concentration during co-culture is 100 ng/mL PMA and 500 ng/mL ionomycin.
Add 50 µL of T-cell medium to each negative control well as indicated in Figure 5.
Addition of TCR-transfected T-cells:
Adjust concentration of transfected T-cells to 2 × 10⁶ cells/mL in T-cell medium. In many cases, this can be done in the 24-well plates in which the T-cells were cultured after transfection.
According to the layout shown in Figure 5, add 100 µL of T-cell suspension containing 2 × 10⁵ T-cells into each well.
Addition of anti-CD107a and IL-2:
Prepare CD107a/IL-2 master mix, consisting of T-cell medium with 1:20 anti-CD107a-PE antibody (see Note 6) and 1200 IU/mL IL-2.
Add 50 µL of CD107a/IL-2-mix to all wells, thereby reaching a final volume of 200 µL per well. Final dilution during co-culture is 1:80 anti-CD107a-PE antibody and 300 IU/mL IL-2.
Spin down T-cells by centrifugation of the plate at 50× g for 1 min at room temperature (21 °C).
Incubate for 1 h at 37 °C and 5% CO2.
Addition of GolgiStop and GolgiPlug after the first hour of co-culture:
Prepare master mix consisting of T-cell medium with 1:100 GolgiStop and 1:100 GolgiPlug-solution.
Carefully add 20 µL of GolgiStop and GolgiPlug mix per well. Do not mix by pipetting as this will whirl up the cells and interfere with T-cell/target-cell interaction.
Incubate for another 4 h at 37 °C and 5% CO2.
Proceed immediately with the flow cytometry staining protocol.
Dead cell marker (DCM) staining:
Prepare DCM mix, consisting of 1:40 DCM in PBS (Note 7).
When the assay is performed according to the default protocol in a flat-bottom plate, resuspend T-cells and carefully transfer into a V-bottom plate to minimize cell loss during the staining procedure. If detached tumor cells come along, this is no problem. (See Note 8 for co-culture assays performed in U-bottom plate.)
Centrifuge cells down and flick plate to discard supernatant.
Add 200 µL of PBS.
Centrifuge and flick plate to discard supernatant.
Wash again with 200 µL of PBS by centrifuging and flicking.
Resuspend pellets in 100 µL of DCM mix per well.
Incubate at 4 °C protected from light for 15 min.
Add 100 µL of FACS buffer.
Centrifuge and flick plate to discard supernatant.
Add 200 µL of FACS buffer.
Extracellular staining (ECS):
Prepare ECS antibody mix. See Table 2 for example.
Centrifuge and flick plate to discard supernatant.
Resuspend pellets in 100 µL of ECS antibody mix.
Incubate at 4 °C protected from light for 25 min.
Add 100 µL of FACS buffer.
Centrifuge and flick plate to discard supernatant.
Add 200 µL of FACS buffer.
Table 2. Extracellular (ECS) antibody mix. Antibodies were titrated to identify ideal staining concentrations for our cell lines and flow cytometer setup.
V per sample Target Fluorophore Clone 2.5 µL hCD3 BV711 OKT3 2.5 µL hCD8a AF700 HIT8a 0.5 µL hCD4 APC/Cy7 SK3 2.5 µL mTCRβ BV421 H57-597 92 µL FACS buffer 100 µL Total volume
Intracellular staining (ICS):
Centrifuge and flick plate to discard supernatant.
Resuspend pellets in 100 µL of Cytofix/Cytoperm.
Incubate at 4 °C protected from light for 15 min.
Proceed with step 3e for staining on the same day or pause overnight as follows:
Pause point:
i. Add 100 µL of FACS buffer.
ii. Centrifuge and flick to discard supernatant.
iii. Add 200 µL of FACS buffer.
iv. Centrifuge and flick to discard supernatant.
v. Resuspend pellets in 200 µL of FACS buffer.
vi. Store at 4 °C protected from light overnight.
vii. Prepare Perm/Wash working solution (WS): 1:10 dilution with Milli-Q H2O.
viii. Centrifuge and flick plate to discard supernatant.
ix. Resuspend pellets in 100 µL of Perm/Wash WS.
x. Incubate at 4 °C protected from light for 15 min.
xi. Proceed with step 3e.
Add 100 µL of Perm/Wash WS.
Centrifuge and flick plate to discard supernatant.
Wash again with 200 µL of Perm/Wash WS.
Prepare ICS antibody mix according to your scientific question. See Table 3 for example.
Centrifuge and flick plate to discard supernatant.
Resuspend pellets in 100 µL of ICS antibody mix.
Incubate at 4 °C protected from light for 25 min.
Add 100 µL of Perm/Wash WS.
Centrifuge and flick plate to discard supernatant.
Wash again with 200 µL of Perm/Wash WS.
Centrifuge and flick plate to discard supernatant.
Resuspend pellets in 100–200 µL of FACS buffer.
Acquire data by flow cytometric analysis of samples.
Table 3. Intracellular (ICS) antibody mix. Antibodies were titrated to identify ideal staining concentrations for our cell lines and flow cytometer setup.
V per sample Target Fluorophore Clone 4 µL hTNFα AF488 Mab11 96 µL FACS buffer 100 µL Total volume
Functional testing of TCRs derived from CD8+ versus CD4+ T-cell clones
As shown in Figure 3A, many human tumor cells including PDAC cells can, upon pretreatment with IFNγ, be induced to express HLA class II at the cell surface. This enables the functional screening for anti-tumor reactivity of TCRs originating from CD4+ TILs, which is of particular interest for CD4+ TILs expressing exhausted or Treg-related gene signatures [3,24–27]. The experiment shown in Figure 6 demonstrates that our functional TCR screening assay can effectively identify tumor-reactive TCRs derived from both CD8+ and CD4+ T-cell clones, provided that the T-cells used express the co-receptor matching that of the T-cell clones from which the TCRs were isolated (see Note 9). In view of the latter, we have—by means of FACS sorting and subsequent expansion—generated T222 lines predominantly (> 90%) consisting of either CD8+ or CD4+ T-cells and include determination of the CD8+/CD4+ ratio in our routine quality control for generation of cell batches.
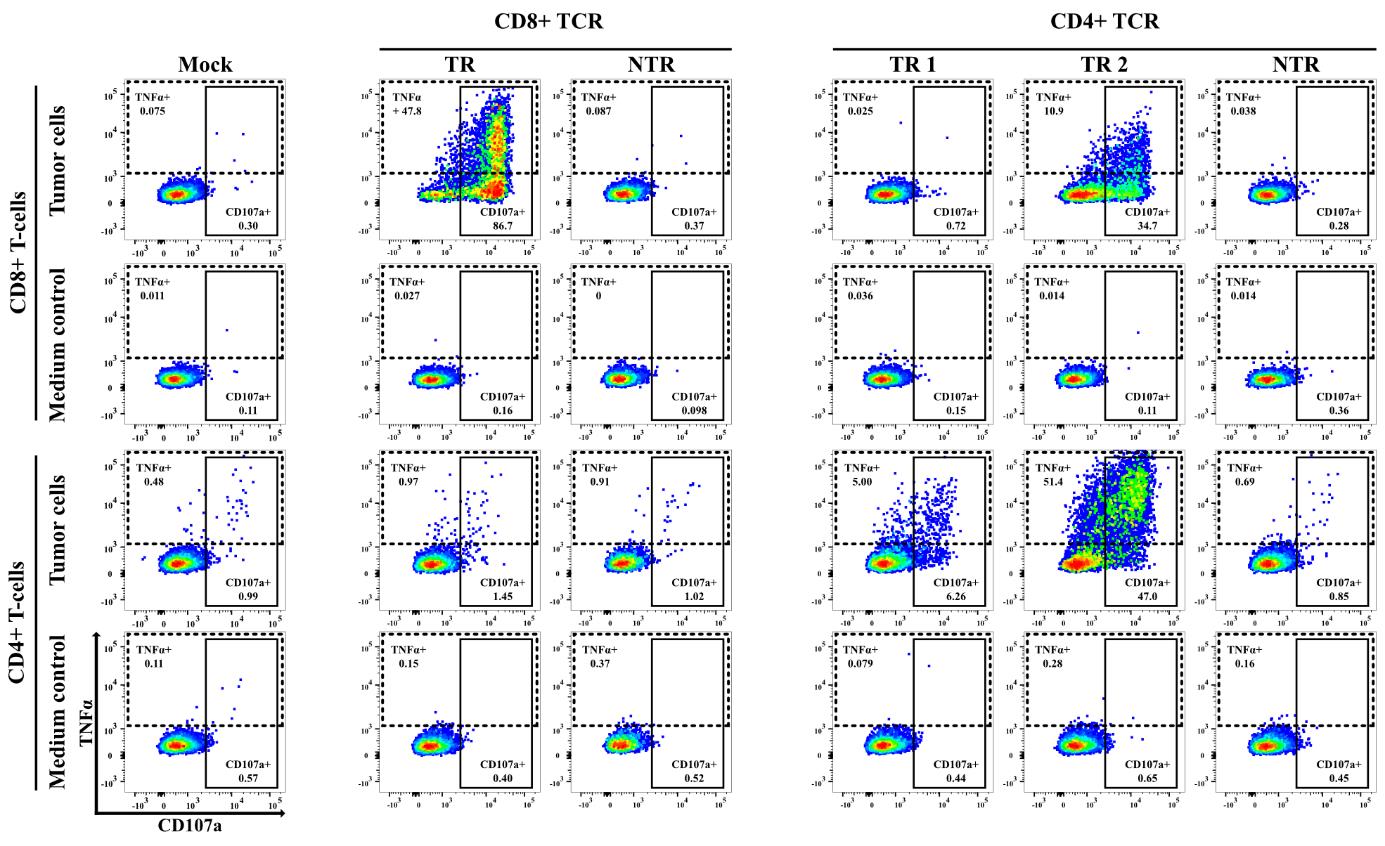
Figure 6. Importance of CD8/CD4 co-receptor expression for efficient detection of T-cell receptor (TCR)-mediated T-cell activation. Representative example of a 5 h co-cultivation experiment in which tumor-reactive (TR) and non-tumor-reactive (NTR) TCRs, derived from human CD8+ and CD4+ tumor-infiltrating T-cells of a single pancreatic ductal adenocarcinoma (PDAC) tumor sample, were tested for reactivity against autologous, IFNγ-pretreated tumor cells. The TCRs were transfected into either human CD8+ (top panel) or CD4+ (bottom panel) T222 cells. The dot plots depict the expression of CD107a and TNFα in CD3+mTCRβ+ T-cells, thereby revealing that, as expected, CD107a is the predominant activation marker of CD8+ T-cells and TNFα is that of CD4+ T-cells. Furthermore, these data show that detection of TCR reactivity is strongly promoted by using human T- cells expressing the co-receptor that matches the T-cell of origin.Functional testing of TCRs originating from syngeneic mouse tumor models
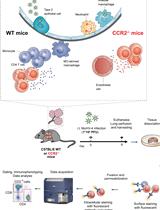
In a study parallel to the screening of TIL-derived TCRs from scRNAseq data sets of human PDAC samples, we performed analogous analyses on the basis of a transplantable mouse PDAC tumor model [18] using the functional screening assay with the human T222 cells as described above (Kehm et al. [28]). Our protocol, as described under Procedure B, works equally efficiently for TCRs derived from mouse CD8+ T-cells (Figure 7) and CD4+ T-cells (not shown), provided that the following three modifications are applied:
Efficient antigen recognition by TCRs derived from mouse CD8+ and CD4+ T-cells when expressed in human T-cells requires co-transfection of the murine CD8+ and CD4+ co-receptor, respectively. In view of this, co-transfect human T-cells with mRNA-encoding mouse TCR (5 µg per 5 × 10⁶ cells) and mouse CD8A and CD8B (2.5 µg each per 5 × 10⁶ cells) or CD4 (5 µg per 5 × 10⁶ cells), respectively.
For enhancement of MHC-restricted antigen presentation, pretreat the mouse tumor cells with 3,000 IU/mL mouse IFNγ for 48 h, taking into account the considerations under Note 2. In order to achieve sufficient induction of MHC Class II on mouse tumor cells for screening of CD4+ TCRs, pretreat the tumor cells with IFNγ in combination with MEK inhibitor (100 nM MEKi GDC-0623) as described in Baumann et al. [18].
Adapt the flow cytometry staining panel to include anti-mouse CD8a and CD8b or CD4. See Table 4 for our staining panel. In case the mouse tumor cells, e.g., B-cell tumors, express Fc receptors, perform mouse Fc receptor block [18] before extracellular staining.
Table 4. Extracellular (ECS) antibody mix for CD8+ mouse T-cell receptors (TCRs). Antibodies were titrated to identify ideal staining concentrations for our cell lines and flow cytometer setup. Anti-human CD107a-APC was used during co-culture to avoid spectral overlap with mCD8b-PE. We used anti-mouse CD4-PE (1:100) instead of mCD8b to validate co-receptor expression when screening mouse CD4+ T-cell-derived TCRs.
Volume per sample Target Fluorophore Clone 2.5 µL hCD3 BV711 OKT3 1 µL mCD8a PerCP 53-6.7 1 µL mCD8b PE YTS156.7.7 2.5 µL mTCRβ BV421 H57-597 93 µL FACS buffer 100 µL Total volume
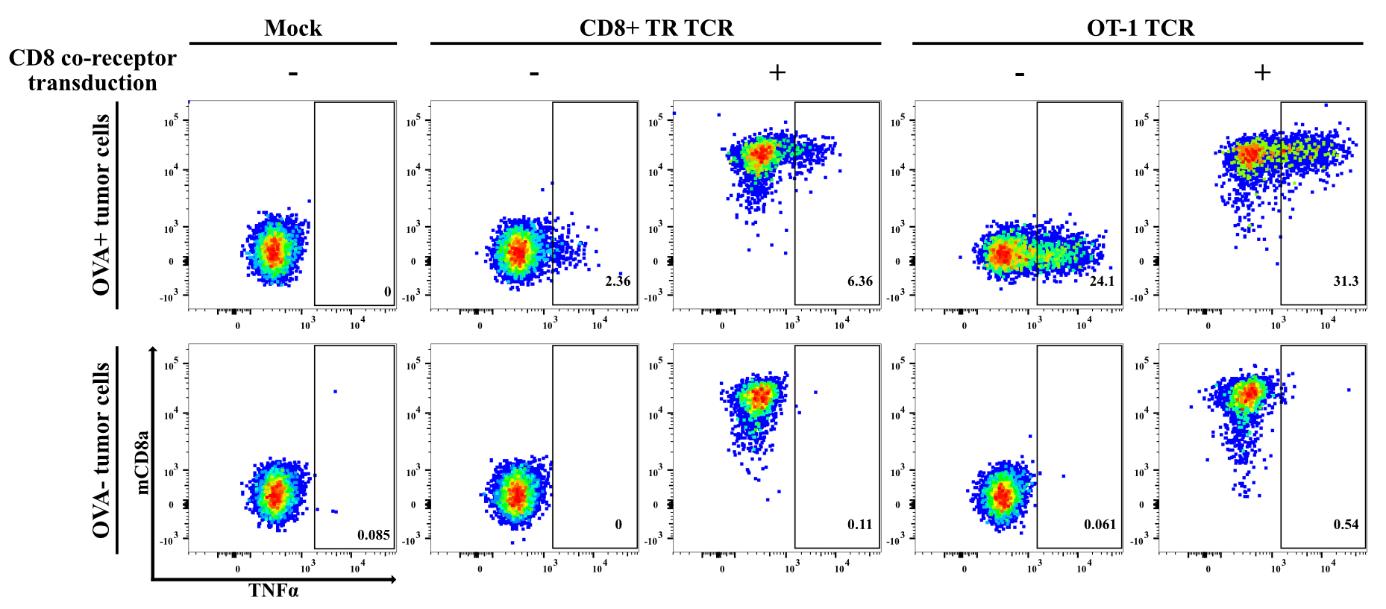
Figure 7. Functional testing of mouse-derived T-cell receptors (TCRs) requires co-transduction of mouse co-receptors. Representative example of an experiment involving the functional testing of TCRs isolated from a transplantable mouse pancreatic ductal adenocarcinoma (PDAC) model expressing the chicken ovalbumin (OVA) neoantigen [18], approximately 50% of which were found directed against OVA [28]. In view of the proven reliability of our TCR-screening setup for human tumor–derived TCRs, we applied the same protocols for testing the anti-tumor reactivity of > 100 mouse PDAC tumor–derived TCRs. Shown in this figure is the reactivity of human CD8+ T222 cells transfected with a TCR derived from a tumor-infiltrating CD8+ T-cell clone, as compared to the OVA/SIINFEKL-specific TCR derived from the OT-1 TCR-transgenic mouse strain against IFNγ-pretreated OVA-expressing mouse PDAC tumor cells and the OVA-negative parental cells. The dot plots depict the expression of TNFα and mouse-CD8a+ in CD3+mTCRβ+ T-cells, thereby showing that both TCRs only mediate T-cell reactivity against the OVA-expressing tumor cells. Furthermore, the data demonstrate that reactivity by the strong OT-1-derived TCR is readily detected in the absence of co-transfection of the mouse CD8+ co-receptor, whereas detection of the reactivity of weaker TCRs is markedly facilitated by mouse-CD8 co-transfection. Notably, this does not significantly increase T-cell reactivity against the OVA-negative tumor cells.
In view of the above, the best strategy to generate similar T-cell lines is to perform repeated rapid expansion [16] of approximately 10–20 available TIL cultures, freeze the resulting T-cell batches into aliquots, and evaluate the resulting T-cell lines for the above-mentioned desirable features.
The human PDAC tumor lines used in our studies [7] were all derived from patient-derived xenograft (PDX) models in NSG mice. More recently, we also successfully made use of tumor cell lines that were initiated as organoid cultures. To increase HLA class I–restricted antigen presentation on human tumor cell lines, the tumor cells are routinely pretreated with 333 IU/mL human IFNγ for 48 h. As shown in Figure 3, this significantly increases surface HLA expression and thereby the sensitivity of the assay, especially for the weakly reactive TCRs.
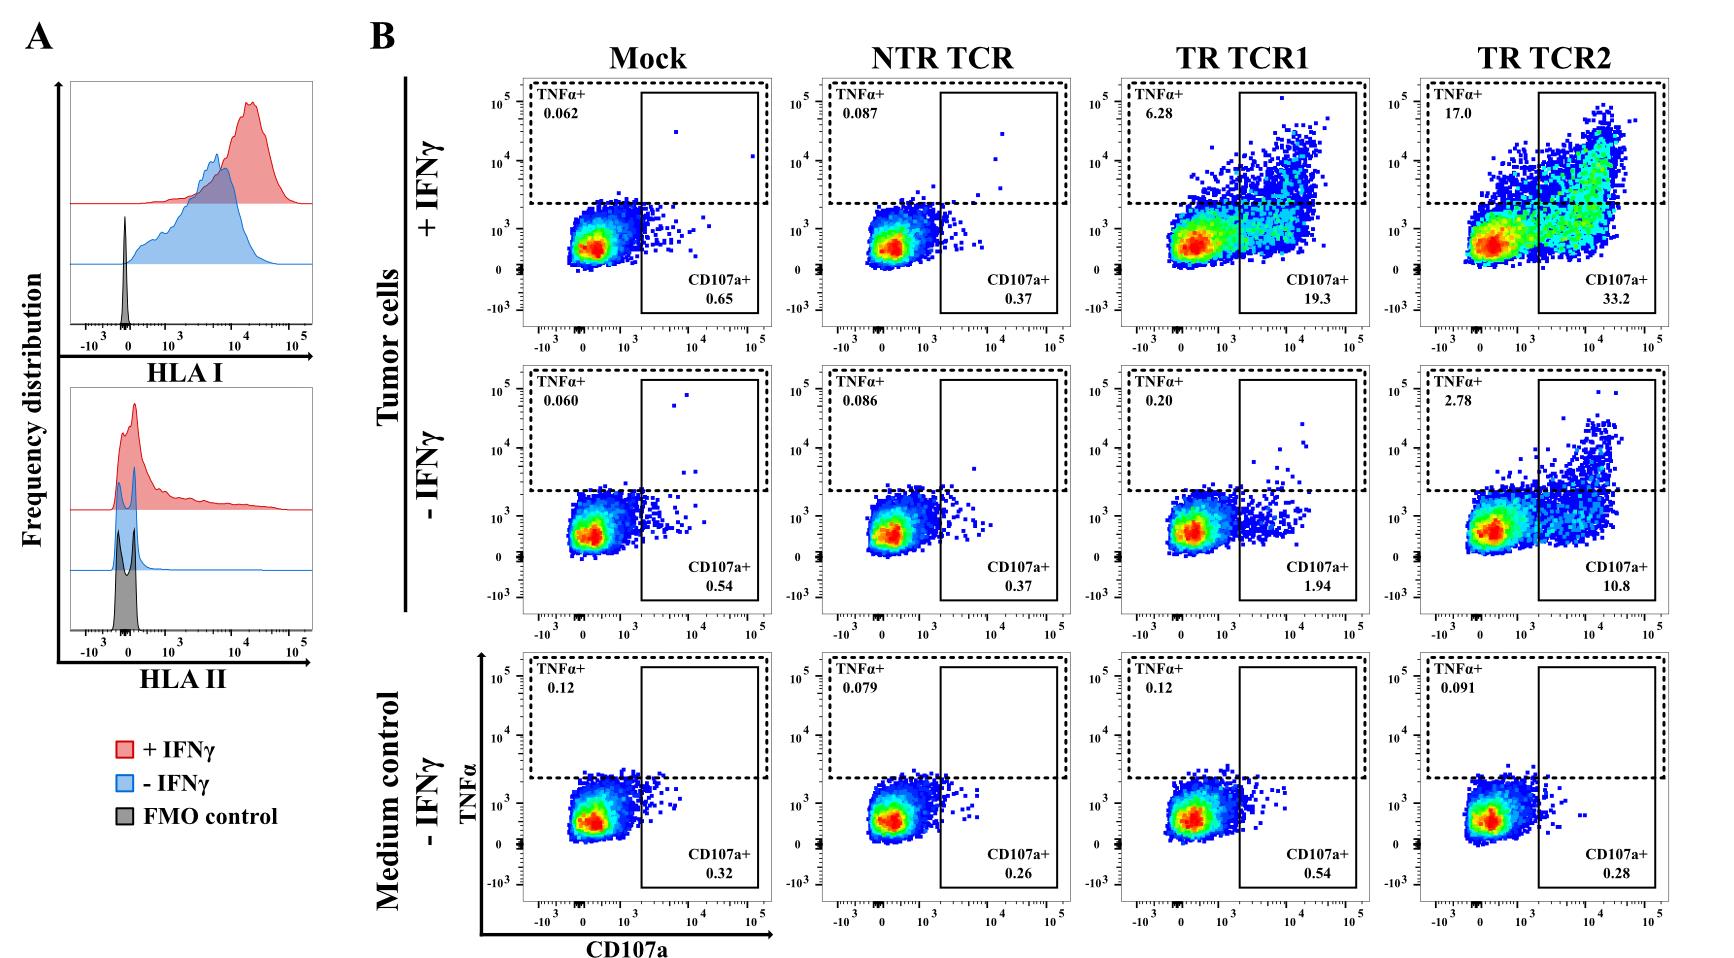
Figure 3. Importance of IFNγ-pretreatment of tumor cells for efficient detection of T-cell receptor (TCR)-mediated T-cell activation. (A) Impact of IFNγ-pretreatment on the cell surface HLA class I and II expression, as detected by pan-HLA class I and class II monoclonal antibodies (APC-conjugated W6/32 and PE-conjugated LN3, respectively) for a representative human pancreatic ductal adenocarcinoma (PDAC) tumor cell line. (B) Flow cytometry data showing the outcome of functional testing in a 5 h co-cultivation experiment of three different CD8+ T-cell-derived TCRs, isolated from the same human PDAC tumor sample, upon transfection into human CD8+ T222 cells. Left to right: mock-transfected T-cells, followed by T-cells transfected with a non-tumor-reactive (NTR) TCR and two tumor reactive (TR) TCRs. The dot plots depict the expression of CD107a and TNFα in CD3+mTCRβ+ T-cells. The data illustrate that detection of TCR reactivity is strongly promoted by IFNγ-pretreatment of the tumor cells, especially for weaker TCRs as exemplified by TCR1. The same applies, even to greater extent, for the detection of reactivity by TCRs derived from CD4+ T-cell clones (see Procedure C).
Maintenance and quality control of T-cell line
T-cell preculture (Day 0 of assay timeline as shown in Figure 4)
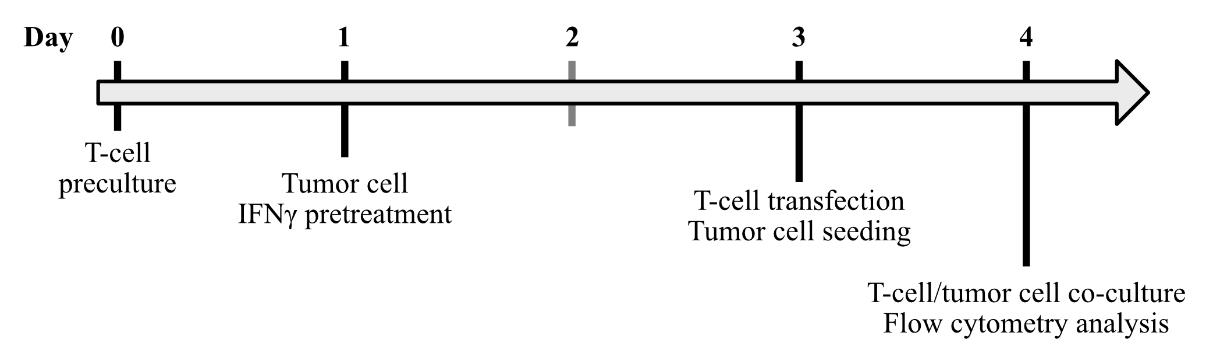
Figure 4. Assay timeline
IFNγ pretreatment of tumor cells (Day 1)
mRNA-transfection of T-cells (Day 3)
T-cells are transfected in batches of 2.5 × 10⁶–7 × 10⁶ cells per TCR. The number of cells to be transfected depends on the number of conditions to be screened per TCR during the T-cell/tumor cell co-culture. For each condition, 2 × 10⁵ transfected viable T-cells are needed on the day of co-culture. Take into account cell loss due to electroporation of the T-cell line concerned (Note 1). See Figure S2 for a calculation example. The following steps describe the transfection of 5 × 10⁶ cells with 5 µg of TCR-encoding mRNA. This setting is based on extensive evaluation of different T-cell numbers and mRNA concentrations in pilot experiments. Adapt the amount of TCR-mRNA and transfection volume to the actual number of transfected cells. See Table 1 for orientation.
Table 1. Examples with respect to calculation of T-cell transfection volume
| Parameters | Example 1 | Example 2 | Example 3 |
|---|---|---|---|
| T-cells per TCR transfection | 2.5 × 10⁶ | 5 × 10⁶ | 7 × 10⁶ |
| TCR mRNA | 2.5 µg | 5 µg | 7 µg |
| T-cell transfection volume | 125 µL | 250 µL | 350 µL |
Tumor cell seeding for T-cell/tumor cell co-culture (Day 3)
Initiation of T-cell/tumor cell co-culture (Day 4)
Flow cytometry staining (Day 4)
Perform all centrifugation steps at 700× g for 2 min at 4 °C. In order to avoid photobleaching of the fluorophores, use the minimum light exposure required for safe working and avoid direct light on the samples.
Data analysis
Samples were acquired with LSRFortessaTM and analyzed with FlowJo software. See Figure S3 for our gating strategy.
Validation of protocol
This protocol was used in the following research articles:
Meng et al. [7]. Transcriptome-based identification of tumor-reactive and bystander CD8+ T-cell receptor clonotypes in human pancreatic cancer. Sci. Transl. Med. 15(722): eadh9562.
Sun et al. [23]. ROTACs leverage signaling-incompetent R-spondin for targeted protein degradation. Cell Chem. Biol. 30(7): 739–752.e8.
Offringa et al. [29] Antigen reactive T-cell receptors, International patent WO 2022/200457 A1.
Kehm, H., Baumann, D., Meng, Z., Zens, S., Riemer, A., Volkmar, M., Poschke, I, Offringa, R. Dissection of the tumor-reactive and bystander T-cell repertoires in a murine model for pancreatic cancer (manuscript in preparation) [28].
Rodriguez Ehrenfried, A., Steffens, L.K., Meng, Z., Poschke, I., Volkmar, M., Offringa, R. Identification and functional analysis of tumor-reactive CD4+ effector and regulatory T-cell subsets in human pancreatic cancer. (manuscript in preparation) [27].
General notes and troubleshooting
General notes
For our T222 line, we have observed up to 2-fold increase in cell numbers during the 72 h preculture phase and a 25%–50% cell loss due to electroporation. For further TIL-derived T-cell lines, we have found other gain/loss ratios. In order to end up with sufficient numbers of viable TCR-transfected T-cells for the intended experiment, it is important to have a good idea of this gain/loss ratio and, based on this, to decide how many T-cells in total need to be transfected. See Figure S2 for an example of T-cell number development throughout the assay protocol.
Preparations of IFNγ may differ considerably in biological activity. In view of this, the concentration as defined in IU/mL should only be taken as a rough indication, and pilot experiments to test the optimal concentration of IFNγ for increasing HLA/MHC surface expression on tumor cells are recommended. In order to maintain consistency, dispense IFNγ stock solutions into aliquots and avoid repeated freezing/thawing. Caution: excessive concentrations of IFNγ can affect tumor cell viability.
Work as efficient as possible. Cells are particularly sensitive to temperature after transfection. A short processing time is crucial for cell viability.
Whereas our default assay setup involves pre-seeding of the tumor cells to allow these to adhere, the assay can also be successfully performed by seeding non-adherent tumor/target cells or freshly trypsinized cells, followed immediately by addition of the T-cells. In this case, collect the tumor/target cells on the day of co-culture (Day 4; see Figure 4). Wash them twice with T-cell medium by centrifuging at 350× g for 5 min at room temperature (21 °C) and discarding the supernatant. Resuspend in T-cell medium at required concentration to seed 50 µL of cell suspension per well. Use a U-bottom 96-well plate instead of a flat-bottom plate. Add tumor cells to T-cell/tumor cell co-culture according to the assay layout shown in Figure 5. In order to achieve optimal assay sensitivity, use an effector to target cell ratio ranging from 1:1 to 1:8; see Figure S4 for further guidance in this respect.
In order to evaluate whether tumor-reactive TCRs would be directed against specific T-cell epitopes, e.g., neoepitopes as predicted by tumor mutanome analysis, our assay setup can readily be adapted to the use of different target cells such as peptide-pulsed or minigene-transfected antigen-presenting cells [7].
We found that addition of anti-CD107a antibody during culture resulted in stronger, cumulative signals while not affecting cell viability. Notably, this procedure is in line with the majority of published CD107a staining protocols.
Reconstitute dead cell marker (DCM) in 500 µL of DMSO and store in 10 µL aliquots to avoid freeze/thaw cycles.
In case the assay is performed with non-adherent or freshly trypsinized tumor/target cells, do not transfer the cells in V-bottom plate but perform staining in U-bottom plate. This will avoid unnecessary cell loss during transfer.
We found that the fraction of TCRs isolated from TIL clones with gene signature-based predicted tumor-reactivity displaying reactivity against autologous tumor cells is lower for CD4+ clonotypes than for CD8+ clonotypes. This discrepancy is most likely related to key differences between the HLA class I and II antigen processing pathways [11]. Consequently, most of the HLA class II-restricted epitopes are only presented in the tumor microenvironment by professional antigen-presenting cells such as dendritic cells and tumor-associated macrophages, whereas only a small fraction is also directly presented by tumor cells.
Acknowledgments
This protocol was adapted from our previous work as described in Meng et al. [7].
Funding sources: K. H. Bauer foundation (RO, IP, and MV). The German ministry of education and research (BMBF; IP, project TIL-REP, 01ZY1403A). The Helmholtz-Institute for Translational Oncology, Mainz (HI-TRON; ARE and MV). The Chinese Scholarship Council (ZM). The Graduate school of the German Cancer Research Center (LS and HK). The Cooperation Research Program of the German Cancer Research Center with the Ministry of Science, Technology and Space and the German-Israeli Helmholtz International Research School/Cancer-TRAX Program (SZ). The Helmholtz Foundation, Immunology and Inflammation Program (CL, program TCR Gene Therapy of Pancreatic Cancer). The German Comprehensive Cancer Center (CL, program NEO-ATT). The Sino-German Laboratory of Personalized Medicine for Pancreatic Cancer (ZM and RO). The Joachim Herz Foundation (LS).
Competing interests
The authors declare no competing interests.
Ethical considerations
The PDAC samples and tumor-infiltrating lymphocytes thereof were provided by University Hospital Heidelberg via the European Pancreas Center on the basis of informed written consent. The study was approved by the local ethics committees (Nr. S-708/2019) and conducted in accordance with the declaration of Helsinki.
All animal procedures were approved by the governmental authorities (Regional Administrative Authority Karlsruhe, Germany) and adhered to the institutional laboratory animal research guidelines.
References
- van der Leun, A. M., Thommen, D. S. and Schumacher, T. N. (2020). CD8+ T cell states in human cancer: insights from single-cell analysis. Nat. Rev. Cancer 20(4): 218–232.
- Caushi, J. X., Zhang, J., Ji, Z., Vaghasia, A., Zhang, B., Hsiue, E. C., Mog, B. J., Hou, W., Justesen, S., Blosser, R., et al. (2021). Transcriptional programs of neoantigen-specific TIL in anti-PD-1-treated lung cancers. Nature 596(7870): 126–132.
- Lowery, F. J., Krishna, S., Yossef, R., Parikh, N. B., Chatani, P. D., Zacharakis, N., Parkhurst, M. R., Levin, N., Sindiri, S., Sachs, A., et al. (2022). Molecular signatures of antitumor neoantigen-reactive T cells from metastatic human cancers. Science 375(6583): 877–884.
- Zheng, C., Fass, J. N., Shih, Y. P., Gunderson, A. J., Sanjuan Silva, N., Huang, H., Bernard, B. M., Rajamanickam, V., Slagel, J., Bifulco, C. B., et al. (2022). Transcriptomic profiles of neoantigen-reactive T cells in human gastrointestinal cancers. Cancer Cell 40(4): 410–423.e7.
- Oliveira, G., Stromhaug, K., Cieri, N., Iorgulescu, J. B., Klaeger, S., Wolff, J. O., Rachimi, S., Chea, V., Krause, K., Freeman, S. S., et al. (2022). Landscape of helper and regulatory antitumour CD4+ T cells in melanoma. Nature 605(7910): 532–538.
- Hu, Z., Leet, D. E., Allesøe, R. L., Oliveira, G., Li, S., Luoma, A. M., Liu, J., Forman, J., Huang, T., Iorgulescu, J. B., et al. (2021). Personal neoantigen vaccines induce persistent memory T cell responses and epitope spreading in patients with melanoma. Nat. Med. 27(3): 515–525.
- Meng, Z., Rodriguez Ehrenfried, A., Tan, C. L., Steffens, L. K., Kehm, H., Zens, S., Lauenstein, C., Paul, A., Schwab, M., Förster, J. D., et al. (2023). Transcriptome-based identification of tumor-reactive and bystander CD8+ T cell receptor clonotypes in human pancreatic cancer. Sci. Transl. Med. 15(722): eadh9562.
- Connor, A. A., Denroche, R. E., Jang, G. H., Timms, L., Kalimuthu, S. N., Selander, I., McPherson, T., Wilson, G. W., Chan-Seng-Yue, M. A., Borozan, I., et al. (2017). Association of Distinct Mutational Signatures With Correlates of Increased Immune Activity in Pancreatic Ductal Adenocarcinoma. JAMA Oncol. 3(6): 774–783.
- Cancer Genome Atlas Research Network. Electronic address: andrew_aguirre@dfci.harvard.edu; Cancer Genome Atlas Research Network. Integrated Genomic Characterization of Pancreatic Ductal Adenocarcinoma.Cancer Cell 32(2): 185–203 e113.
- Haen, S. P., Löffler, M. W., Rammensee, H. G. and Brossart, P. (2020). Towards new horizons: characterization, classification and implications of the tumour antigenic repertoire. Nat. Rev. Clin. Oncol. 17(10): 595–610.
- Rock, K. L., Reits, E. and Neefjes, J. (2016). Present Yourself! By MHC Class I and MHC Class II Molecules. Trends Immunol. 37(11): 724–737.
- Yadav, M., Jhunjhunwala, S., Phung, Q. T., Lupardus, P., Tanguay, J., Bumbaca, S., Franci, C., Cheung, T. K., Fritsche, J., Weinschenk, T., et al. (2014). Predicting immunogenic tumour mutations by combining mass spectrometry and exome sequencing. Nature 515(7528): 572–576.
- Bassani-Sternberg, M. and Coukos, G. (2016). Mass spectrometry-based antigen discovery for cancer immunotherapy. Curr. Opin. Immunol. 41: 9–17.
- Gartner, J. J., Parkhurst, M. R., Gros, A., Tran, E., Jafferji, M. S., Copeland, A., Hanada, K. I., Zacharakis, N., Lalani, A., Krishna, S., et al. (2021). A machine learning model for ranking candidate HLA class I neoantigens based on known neoepitopes from multiple human tumor types. Nat. Cancer 2(5): 563–574.
- Poschke, I. C., Hassel, J. C., Rodriguez-Ehrenfried, A., Lindner, K. A., Heras-Murillo, I., Appel, L. M., Lehmann, J., Lövgren, T., Wickström, S. L., Lauenstein, C., et al. (2020). The Outcome of Ex Vivo TIL Expansion Is Highly Influenced by Spatial Heterogeneity of the Tumor T-Cell Repertoire and Differences in Intrinsic In Vitro Growth Capacity between T-Cell Clones. Clin. Cancer Res. 26(16): 4289–4301.
- Dudley, M. E., Wunderlich, J. R., Shelton, T. E., Even, J. and Rosenberg, S. A. (2003). Generation of Tumor-Infiltrating Lymphocyte Cultures for Use in Adoptive Transfer Therapy for Melanoma Patients. J. Immunother. 26(4): 332–342.
- Simon, P., Omokoko, T. A., Breitkreuz, A., Hebich, L., Kreiter, S., Attig, S., Konur, A., Britten, C. M., Paret, C., Dhaene, K., et al. (2014). Functional TCR Retrieval from Single Antigen-Specific Human T Cells Reveals Multiple Novel Epitopes. Cancer Immunol. Res. 2(12): 1230–1244.
- Baumann, D., Hägele, T., Mochayedi, J., Drebant, J., Vent, C., Blobner, S., Noll, J. H., Nickel, I., Schumacher, C., Boos, S. L., et al. (2020). Proimmunogenic impact of MEK inhibition synergizes with agonist anti-CD40 immunostimulatory antibodies in tumor therapy. Nat. Commun. 11(1): 2176.
- Kropp, K. N., Schäufele, T. J., Fatho, M., Volkmar, M., Conradi, R., Theobald, M., Wölfel, T. and Wölfel, C. (2020). A bicistronic vector backbone for rapid seamless cloning and chimerization of αβT-cell receptor sequences. PLoS One 15(9): e0238875.
- Boulter, J. M., Glick, M., Todorov, P. T., Baston, E., Sami, M., Rizkallah, P. and Jakobsen, B. K. (2003). Stable, soluble T-cell receptor molecules for crystallization and therapeutics. Protein Eng. Des. Sel. 16(9): 707–711.
- Cohen, C. J., Li, Y. F., El-Gamil, M., Robbins, P. F., Rosenberg, S. A. and Morgan, R. A. (2007). Enhanced Antitumor Activity of T Cells Engineered to Express T-Cell Receptors with a Second Disulfide Bond. Cancer Res. 67(8): 3898–3903.
- Holtkamp, S., Kreiter, S., Selmi, A., Simon, P., Koslowski, M., Huber, C., Türeci, O. and Sahin, U. (2006). Modification of antigen-encoding RNA increases stability, translational efficacy, and T-cell stimulatory capacity of dendritic cells. Blood 108(13): 4009–4017.
- Sun, R., Meng, Z., Lee, H., Offringa, R. and Niehrs, C. (2023). ROTACs leverage signaling-incompetent R-spondin for targeted protein degradation. Cell Chem. Biol. 30(7): 739–752.e8.
- Cenerenti, M., Saillard, M., Romero, P. and Jandus, C. (2022). The Era of Cytotoxic CD4 T Cells. Front. Immunol. 13: e867189.
- Tay, R. E., Richardson, E. K. and Toh, H. C. (2020). Revisiting the role of CD4+ T cells in cancer immunotherapy—new insights into old paradigms. Cancer Gene Ther. 28: 5–17.
- Huppert, L. A., Green, M. D., Kim, L., Chow, C., Leyfman, Y., Daud, A. I. and Lee, J. C. (2021). Tissue-specific Tregs in cancer metastasis: opportunities for precision immunotherapy. Cell Mol. Immunol. 19(1): 33–45.
- Rodriguez Ehrenfried, A, Steffens, L.K., Meng, Z., Poschke, I., Volkmar, M., Offringa, R. Identification and functional analysis of tumor-reactive CD4+ effector and regulatory T-cell subsets in human pancreatic cancer. (manuscript in preparation)
- Kehm, H., Baumann, D, Meng, Z., Zens, S., Riemer, A., Volkmar, M., Poschke, I, Offringa, R. Dissection of the tumor-reactive and bystander T-cell repertoires in a murine model for pancreatic cancer (manuscript in preparation)
- Offringa, R., Meng, Z., Rodriguez Ehrenfried, A., Steffens, L. K. and Tan, C.L. (2022) Antigen reactive T-cell receptors, International patent WO 2022/200457 A1
Supplementary information
The following supporting information can be downloaded here:
- Supplementary information
Article Information
Copyright
© 2024 The Author(s); This is an open access article under the CC BY-NC license (https://creativecommons.org/licenses/by-nc/4.0/).
How to cite
Readers should cite both the Bio-protocol article and the original research article where this protocol was used:
- Ehrenfried, A. R., Zens, S., Steffens, L. K., Kehm, H., Paul, A., Lauenstein, C., Volkmar, M., Poschke, I., Meng, Z. and Offringa, R. (2024). T-Cell-Based Platform for Functional Screening of T-Cell Receptors Identified in Single-Cell RNA Sequencing Data Sets of Tumor-Infiltrating T-Cells. Bio-protocol 14(8): e4972. DOI: 10.21769/BioProtoc.4972.
- Meng, Z., Rodriguez Ehrenfried, A., Tan, C. L., Steffens, L. K., Kehm, H., Zens, S., Lauenstein, C., Paul, A., Schwab, M., Förster, J. D., et al. (2023). Transcriptome-based identification of tumor-reactive and bystander CD8+ T cell receptor clonotypes in human pancreatic cancer. Sci. Transl. Med. 15(722): eadh9562.
Category
Immunology > Immune cell function > Lymphocyte
Immunology > Immune mechanisms
Cell Biology
Do you have any questions about this protocol?
Post your question to gather feedback from the community. We will also invite the authors of this article to respond.