- Protocols

- Articles and Issues
- For Authors
- About
- Become a Reviewer

A Simple Immunofluorescence Method to Characterize Neurodegeneration and Tyrosine Hydroxylase Reduction in Whole Brain of a Drosophila Model of Parkinson’s Disease
(*contributed equally to this work) Published: Vol 14, Iss 4, Feb 20, 2024 DOI: 10.21769/BioProtoc.4937 Views: 2083
Reviewed by: Alessandro DidonnaSara BagnoliAnonymous reviewer(s)
Original research article
The authors used this protocol in:

Jun 2023
Advertisement


Protocol Collections
Comprehensive collections of detailed, peer-reviewed protocols focusing on specific topics


Abstract
Dopaminergic (DAergic) neurodegeneration in the substantia nigra pars compacta of the human brain is the pathological feature associated with Parkinson’s disease (PD). Drosophila also exhibits mobility defects and diminished levels of brain dopamine on exposure to neurotoxicants mimicking PD. Our laboratory demonstrated in a Drosophila model of sporadic PD that there is no decrease in DAergic neuronal number; instead, there is a significant reduction in tyrosine hydroxylase (TH) fluorescence intensity (FI). Here, we present a sensitive assay based on the quantification of FI of the secondary antibody (ab). As the FI is directly proportional to the amount of TH synthesis, its reduction under PD conditions denotes the decrease in the TH synthesis, suggesting DAergic neuronal dysfunction. Therefore, FI quantification is a refined and sensitive method to understand the early stages of DAergic neurodegeneration. FI quantification is performed using the ZEN 2012 SP2 single-user software; a license must be acquired to utilize the imaging system to interactively control image acquisition, image processing, and analysis. This method will be of good use to biologists, as it can also be used with little modification to characterize the extent of degeneration and changes in the level of degeneration in response to drugs in different cell types. Unlike the expensive and cumbersome confocal microscopy, the present method will be an affordable option for fund-constrained neurobiology laboratories.
Key features
• Allows characterizing the incipient DAergic and other catecholaminergic neurodegeneration, even in the absence of loss of neuronal cell body.
• Great alternative for the fund-constrained neurobiology laboratories in developing countries to utilize this method in different cell types and their response to drugs/nutraceuticals.
Graphical overview
Background
Degeneration of dopaminergic (DAergic) neurons in the substantia nigra pars compacta and noradrenergic neurons in the locus coeruleus region of the human brain is the characteristic pathological feature of Parkinson’s disease (PD) subjects. Tyrosine hydroxylase (TH) is the marker protein for DAergic neurons, as it is the rate-limiting enzyme in the synthesis of dopamine. Hence, demonstration of the DAergic degeneration phenotype using TH immunostaining is critical in the development and validation of animal models of PD. For the first time, in an α-synuclein Drosophila model of PD, Feany and Bender [1] demonstrated a progressive, age-dependent locomotor dysfunction similar to the PD subjects accompanied by a loss of DAergic neurons. Since then, many labs have been using the fly to model PD [2–13].
One prime feature of Drosophila PD models is the DAergic cell loss, as claimed by several independent labs [1,2,6,12,14–19]; however, some other labs found no loss in neuronal numbers [7,9,20–23]. Further neurotoxins such as paraquat and rotenone have been used to develop the Drosophila model of PD. In most cases, cluster-specific loss of DAergic neurons [6,24–27] or no variation in the number of DAergic neurons [3,7,13,21,22,28] were observed. TH immunostaining and green fluorescent protein (GFP) reporter-based methods have typically been adopted to quantify DAergic neurons in the whole Drosophila brain. The reduction in fluorescence intensity (FI) of TH immunostaining or GFP signal has been termed neuronal dysfunction [7].
Here, we describe a sensitive fluorescence microscopy–based assay developed in our laboratory [28], less expensive and more user friendly than cumbersome confocal microscopy, to characterize DAergic neuronal dysfunction even in the absence of loss of neuronal cell bodies. Through this assay, it is feasible to characterize the early DAergic neurodegeneration, which will be of great support in following the progression of the disease; the same can be employed to understand the neuroprotective efficacy of small molecules/nutraceuticals/drugs. With appropriate modifications, this method can also be used for identifying other cell type–specific neurodegeneration in fly models of different neurodegenerative disease(s).
Materials and reagents
Drosophila melanogaster [Oregon K (OK) flies, procured from the National Drosophila Stock Center, Mysore University, Mysuru, India, were raised in food media containing sucrose, yeast, agar-agar, and propionic acid, and maintained in a fly environment chamber and used in the current study [3,10,13,28]]. Depending on the nature of the experiment, flies with and/or without neurotoxicant treatment (sporadic PD model) and transgenic fly model(s) can be employed.
Sterilized 1.5 mL centrifuge tubes (Tarsons, catalog number: 500010)
ParafilmTM wrapping film (Bemis, catalog number: PM996)
Conical flask (Borosil, catalog number: 5100)
Magnetic stirrer bar #8 mm × 40 mm (Tarsons, catalog number: 4113)
SPINNOTTM digital magnetic stirrer hotplate (Tarsons, catalog number: 6090)
Sterilized micro tips (Tarsons, catalog number: 521010)
Freshwrapp aluminum foil 9–11 μm (Hindalco, catalog number: HV2241)
Glass plate (Suwimut, catalog number: B08FRB2NTM)
Fingernail polish (FacesCanada, catalog number: CC4403)
Glass spacer (Borosil, catalog number: 9115S01)
Microscopy slides #76 mm × 26 mm (ReliGlas, catalog number: 7101)
Gold-seal coverslips (22 mm2) (Electron Microscopy Sciences, catalog number: 63765-01)
Sucrose (SRL, catalog number: 84973)
Agar-agar (HiMedia, catalog number: GRM666)
Sugar-tolerant yeast (Angel, catalog number: 5331A201908)
Propionic acid (Merck, catalog number: 80060505001730)
WhatmanTM filter paper (GE Healthcare, catalog number: 1001917)
Paraformaldehyde (PFA) pH 7.4 (Sigma-Aldrich, catalog number: I58127)
Phosphate buffered saline (PBS) pH 7.4 (HiMedia, catalog number: ML023)
Triton X-100 (Sigma-Aldrich, catalog number: T8787)
Normal goat serum (NGS) (Vector Labs, catalog number: S1000)
Rabbit anti-tyrosine hydroxylase (anti-TH) polyclonal primary ab (Millipore, catalog number: Ab152)
Goat anti-rabbit IgG H&L (TRITC-labeled) polyclonal secondary ab (Abcam, catalog number: Ab6718)
VECTASHIELD® mounting medium (Vector Labs, catalog number: H1000)
Solutions
4% PFA solution (50 mL) (see Recipes)
0.1% PBST (phosphate buffered saline and Triton X-100) (50 mL) (see Recipes)
0.5% PBST (50 mL) (see Recipes)
5% NGS blocking buffer solution (1 mL) (see Recipes)
Anti-TH polyclonal primary ab solution (see Recipes)
TRITC-labeled polyclonal secondary ab solution (see Recipes)
Recipes
4% PFA solution (50 mL)
PFA 2 g
1× PBS 50 mL
Add PFA in 1× PBS in a conical flask, cover it with parafilm, and shake it thoroughly for 10 min.
Transfer the flask with a magnetic stirrer on the hotplate for heating/boiling with a temperature ranging from 80 °C to 110 °C with moderate stirring at 150 rpm.
Keep the flask on the hotplate until the cloudy solution becomes transparent.
After this, switch off the hotplate but keep the stirring for 15 min. Allow the solution to cool down, aliquot it in a 1.5 mL centrifuge tube, and store it at -80 °C.
Critical: Do not store the solution for more than a week.
Caution: PFA is a potential carcinogen; hence, the whole process should be done under a fume hood. Wear hand gloves and a lab coat during handling and preparation of PFA solution.
0.1% PBST (phosphate buffered saline and Triton X-100) (50 mL)
10× PBS 5 mL
Autoclaved enzyme-free water 45 mL
Triton X-100 50 μL
Add 5 mL of 10× PBS in 45 mL of autoclaved enzyme-free water.
Mix 50 μL of Triton X-100 and vortex it for 10 seconds. The solution can be stored at room temperature for one week.
0.5% PBST (50 mL)
10× PBS 5 mL
Autoclaved enzyme-free water 45 mL
Triton X-100 250 μL
Add 5 mL of 10× PBS in 45 mL of autoclaved enzyme-free water.
Mix 250 μL of Triton X-100 and vortex it for 10 s. The solution can be stored at room temperature for one week.
5% NGS blocking buffer solution (1 mL)
NGS 50 μL
0.5% PBST 950 μL
Add 50 μL of NGS in 950 μL of 0.5% PBST and mix it properly by vortexing for 10 s. The solution can be stored at room temperature for 1–2 h.
Anti-TH polyclonal primary ab solution
Anti-TH polyclonal primary ab 5 μL
5% NGS blocking buffer 1,245 μL
Take 1,245 μL of 5% NGS blocking buffer and add 5 μL of anti-TH polyclonal primary ab (1:250 dilution). Mix it gently by inverting the tube slowly and place it on the ice until used.
TRITC-labeled polyclonal secondary ab solution
TRITC-labeled polyclonal secondary ab 5 μL
5% NGS blocking buffer 1,245 μL
Take 1,245 μL of 5% NGS and add 5 μL of TRITC-labeled polyclonal secondary ab (1:250 dilution). Mix it gently by inverting the tube slowly and store it on ice until used.
Equipment
Fly head capsule handling items e.g., needles #31 G × 6 mm (Tentabe BD, catalog number: 324902)
Dissecting fine forceps (EMS, catalog number: 78620-4B)
Brush (TEYUP, model number: SR-1013)
Delicate task Kim wipers (KIMTECHTM, catalog number: 370080)
Micropipette i.e., 1,000 μL, 50 μL, 10 μL, 2 μL (Gilson, catalog number: 30040)
Frost-free refrigerator (Whirlpool, model number: FF26 4S)
pH/mV meter (Hanna Instruments, model: HI2211-02)
-20 °C ES Series refrigerator (Thermo Scientific, model: 50616100444443250)
-80 °C ultra-low temperature freezer (New Brunswick Innova, model: U101-86)
Stereo zoom microscope (Carl Zeiss, model: Stemi 305)
Stereo zoom microscope (Leica, model: E24)
Fume hood (BIOMATRIX, Telangana, India)
BOD incubator (Percival, model: DR-36VL)
Test tube rotator (Tarsons, Rotospin, catalog number: 3070) and disk for 24 × 1.5 mL tube (Tarsons, catalog number: 3071)
Axio Imager M2 fluorescence microscope fitted with 100 W Mercury lamp (Carl Zeiss, catalog number: 430004-9902-000)
AxioCam ICm1 monochromatic camera (Carl Zeiss, catalog number: 426553-9901-000)
Software and datasets
ZEN 2012 SP2 blue edition, version 2.0.14283.302 (Carl Zeiss, Jena, Germany)
Microsoft Office Excel Worksheet 2007 (Microsoft Inc., WA, USA)
GraphPad Prism, March 7, 2007, version 5.00 (GraphPad Inc., MA, USA)
Procedure
Anti-TH immunostaining of the whole Drosophila brain
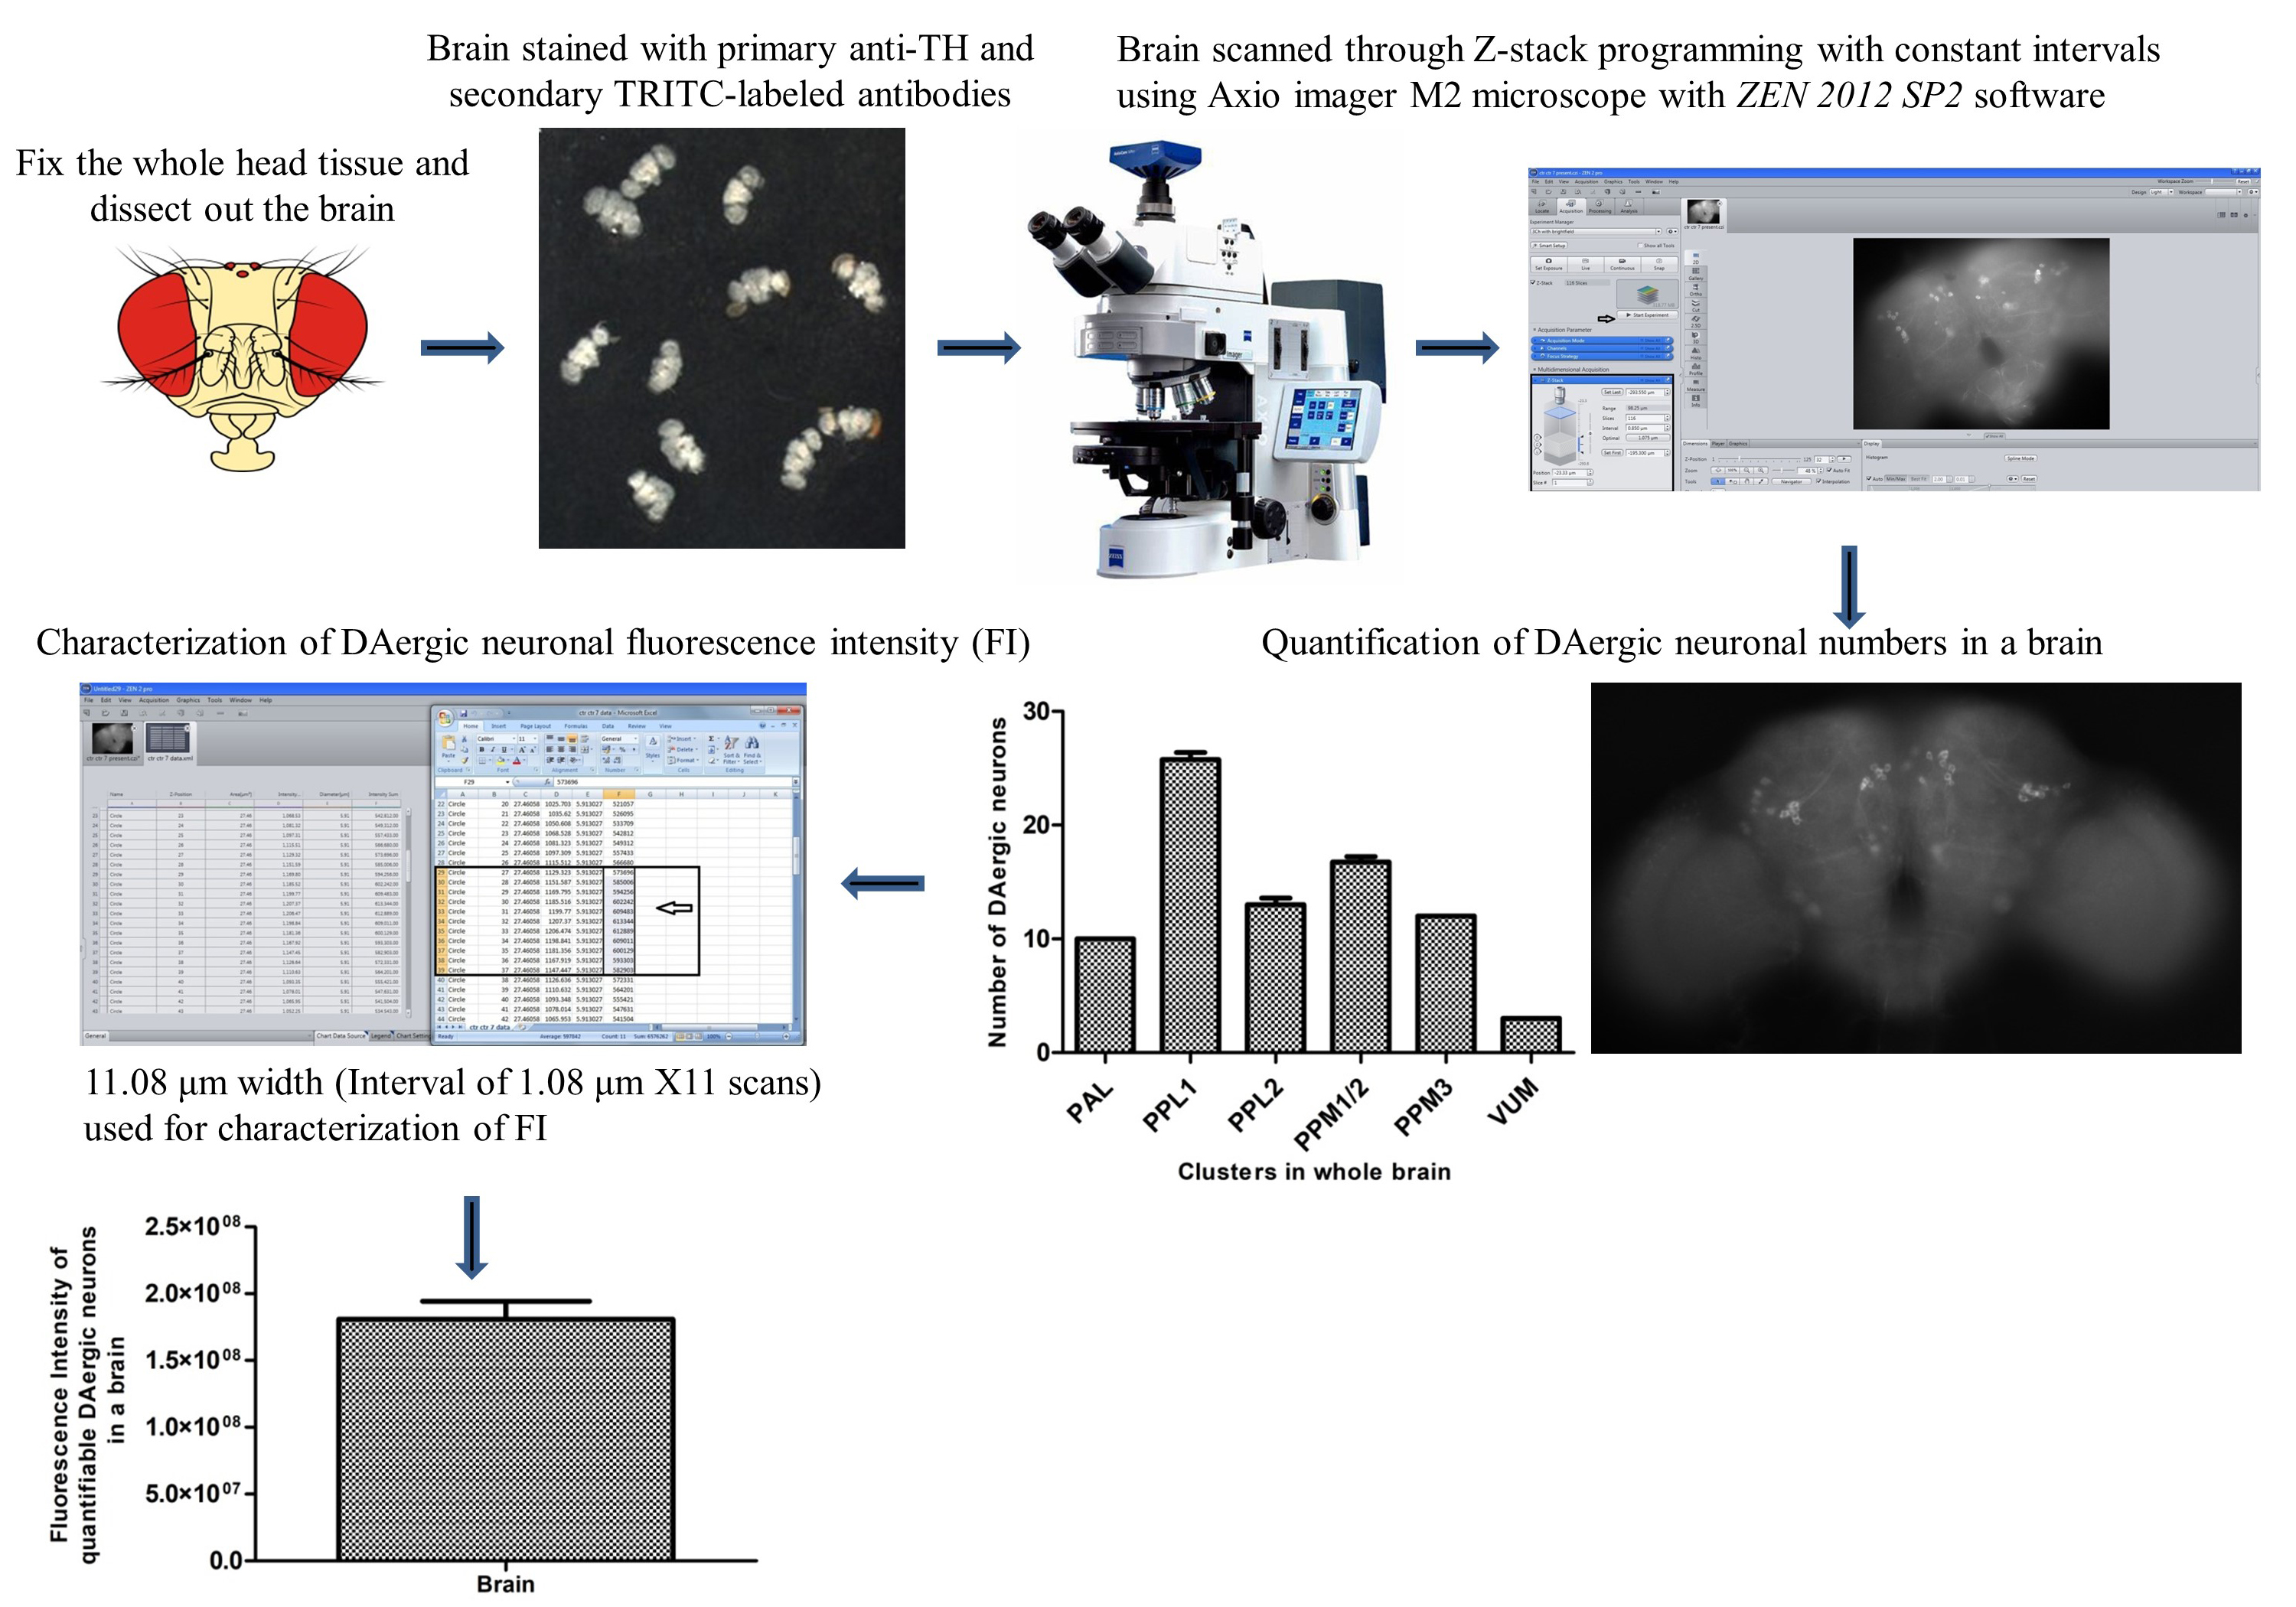
Fix the fly whole head tissue in 1 mL of 4% PFA (pH 7.4) containing 0.5% Triton X-100 in a sterilized 1.5 mL centrifuge tube for 2 h through mixing by using a test tube rotator with constant velocity (10 rpm) at room temperature (RT).
Remove PFA after 2 h of fixation by washing the fly head tissue with 1 mL of 0.1% PBST three times for 15 min each at RT.
Carry out dissection of brains in 1× PBS (pH 7.4) under a stereo zoom microscope at RT using fine forceps and needles to remove the head capsule and connecting tissues.
Then, wash the brains with 0.1% PBST five times for 15 min each at RT.
Block the brains with 5% NGS blocking buffer solution for 120 min at RT.
Then, incubate/probe brains with anti-TH polyclonal primary ab solution for 72 h at 4 °C through mixing by using a test tube rotator at constant velocity (10 rpm).
Wash off excess primary antibodies by 0.1% PBST five times for 15 min each at RT.
Incubate brains with TRITC-labeled polyclonal secondary ab solution for 24 h in the dark (Critical: Cover centrifuge tube containing brains with aluminum foil) by thorough mixing with a test tube rotator at a constant velocity (10 rpm) at RT.
To eliminate excess secondary antibodies, wash brains again with 0.1% PBST five times for 15 min each at RT.
Mount brains in VECTASHIELD® mounting medium and then top with cover glass.
Critical: Glass spacers were placed around the VECTASHIELD® mounting medium to protect brains from being crushed by a coverslip.
Critical: Brains were scanned in a dorsoventral orientation.
Use clear fingernail polish to seal the edges.
The sample is ready for image acquisition.
Image acquisition
Steps for the acquisition of Drosophila brain image(s) for quantification of DAergic neurons and FI using a fluorescence microscope with ZEN 2012 SP2 software are as follows:
Observe stained brains under a fluorescence microscope equipped with a 40× objective lens (Figure 1).
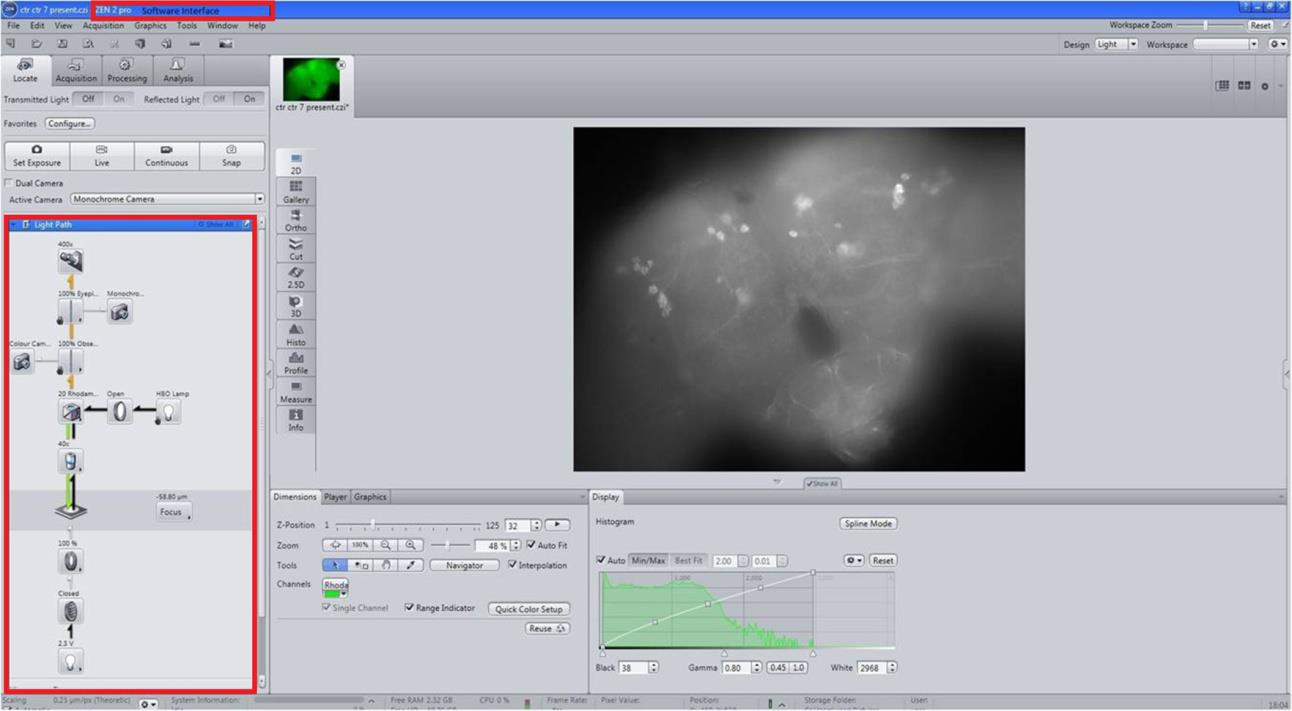
Figure 1. Scanning of the whole brain of Drosophila. Scan the anti-TH immunostained Drosophila brain using Carl Zeiss, Axio Imager M2 (40× objective lens) with ZEN 2012 SP2 software that interactively controls image acquisition, image processing, and analysis of the images.Scan and take images using a monochromatic camera with a Rhodamine fluorescence filter (Figure 2).
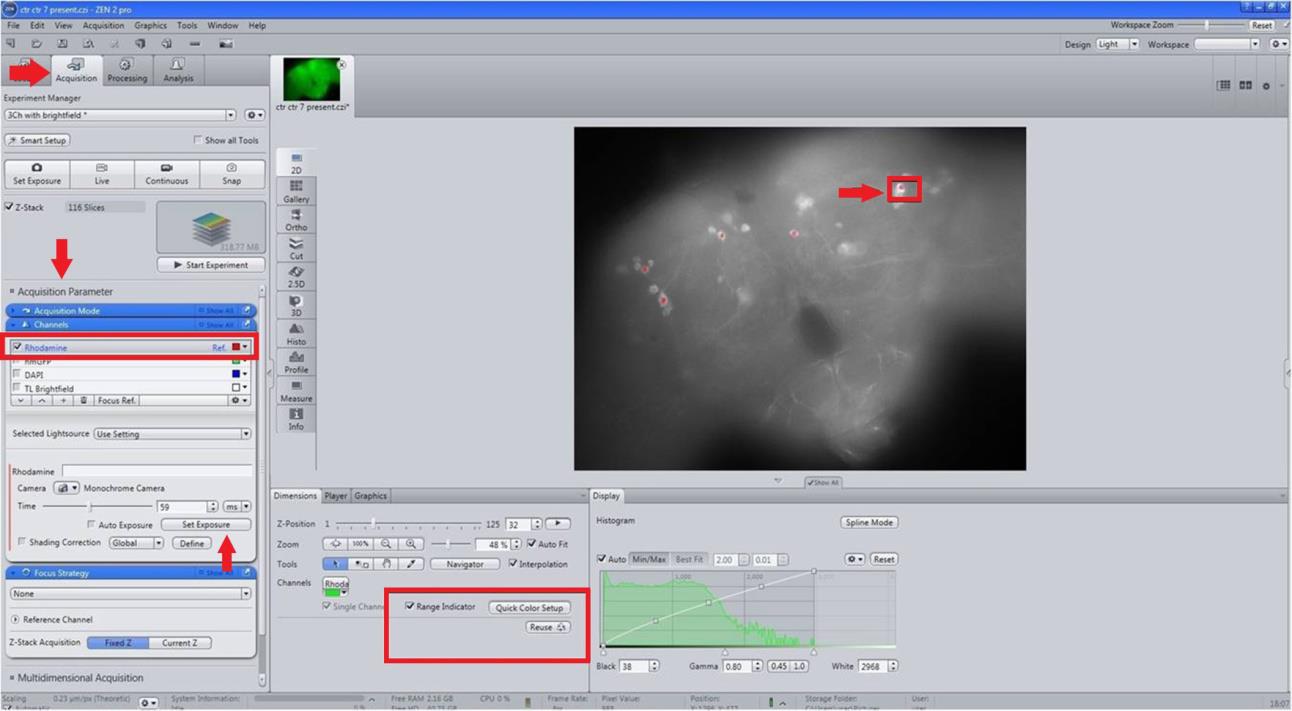
Figure 2. Image acquisition and performing the red dot test. For image acquisition, select a monochromatic camera with a Rhodamine filter. Perform a red dot test for visibility of dopaminergic (DAergic) neurons and assessing saturation using a brain, reusing the same exposure time for other samples.Perform a red dot test in the acquisition panel (select range indicator from Dimensions and set exposure from Acquisition parameter) for visibility of DAergic neurons and to assess the signal saturation during the image acquisition. Reuse the same exposure time for all brain samples (Figure 2).
Then, perform Z-stack programming with constant intervals of 1.08 μm for each image (Figure 3).
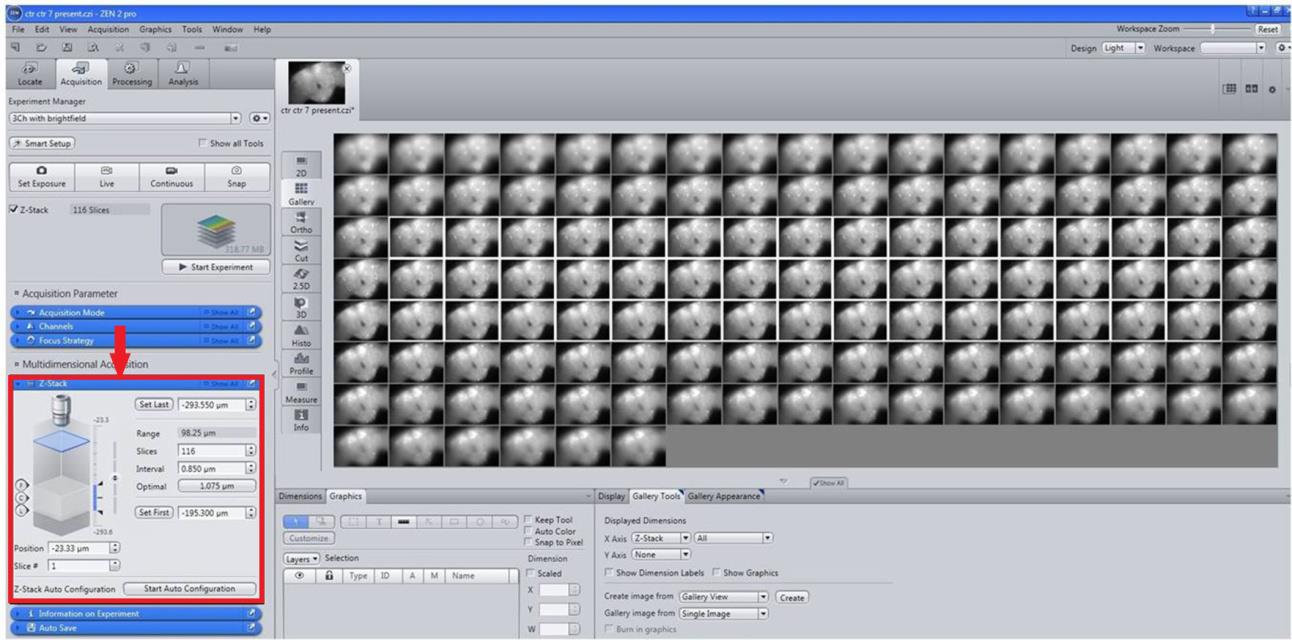
Figure 3. Selection of images and Z-StackingTo generate a 2D image, on the method column apply Ortho and Maximum intensity projection (MIP) from Ortho display with X–Y Plane (Figure 4).
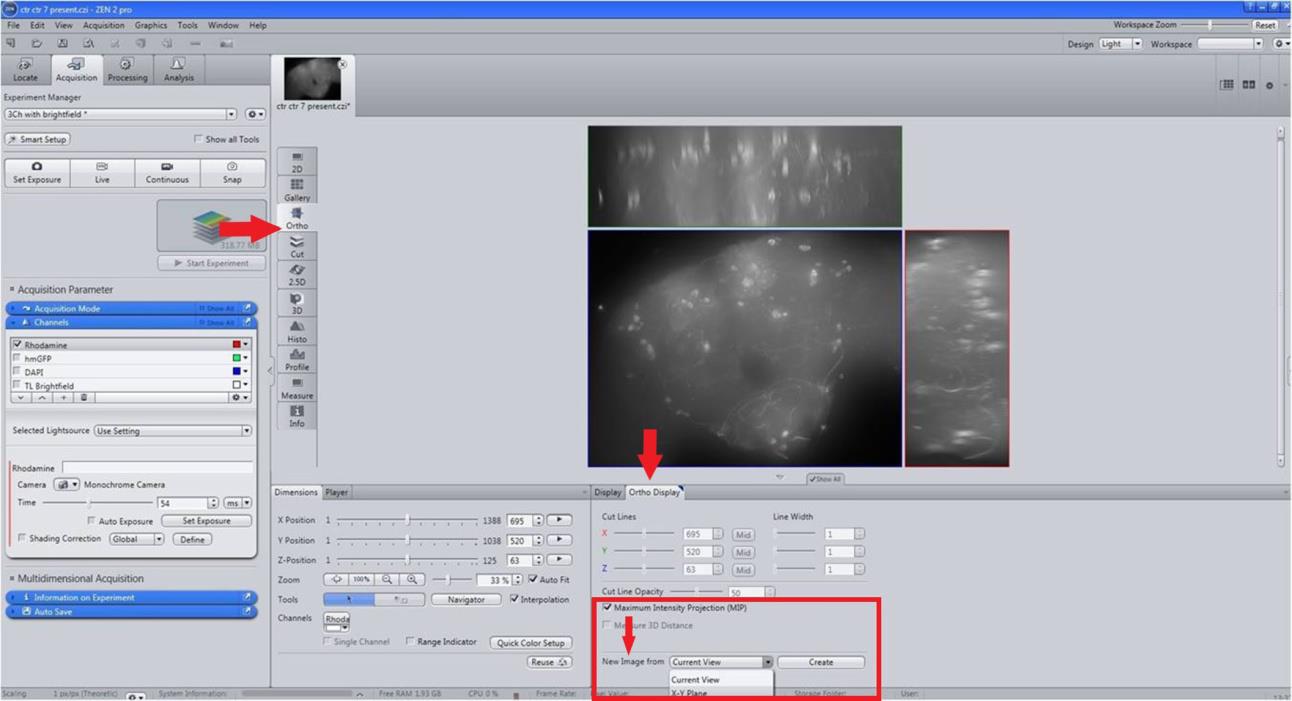
Figure 4. Creation of 2D image. For creating a 2D merged image, on the Method column, select Maximum intensity projection (MIP) with X-Y Plane.Export the 2D image of the brain in .jpg format for presentation (Figure 5).
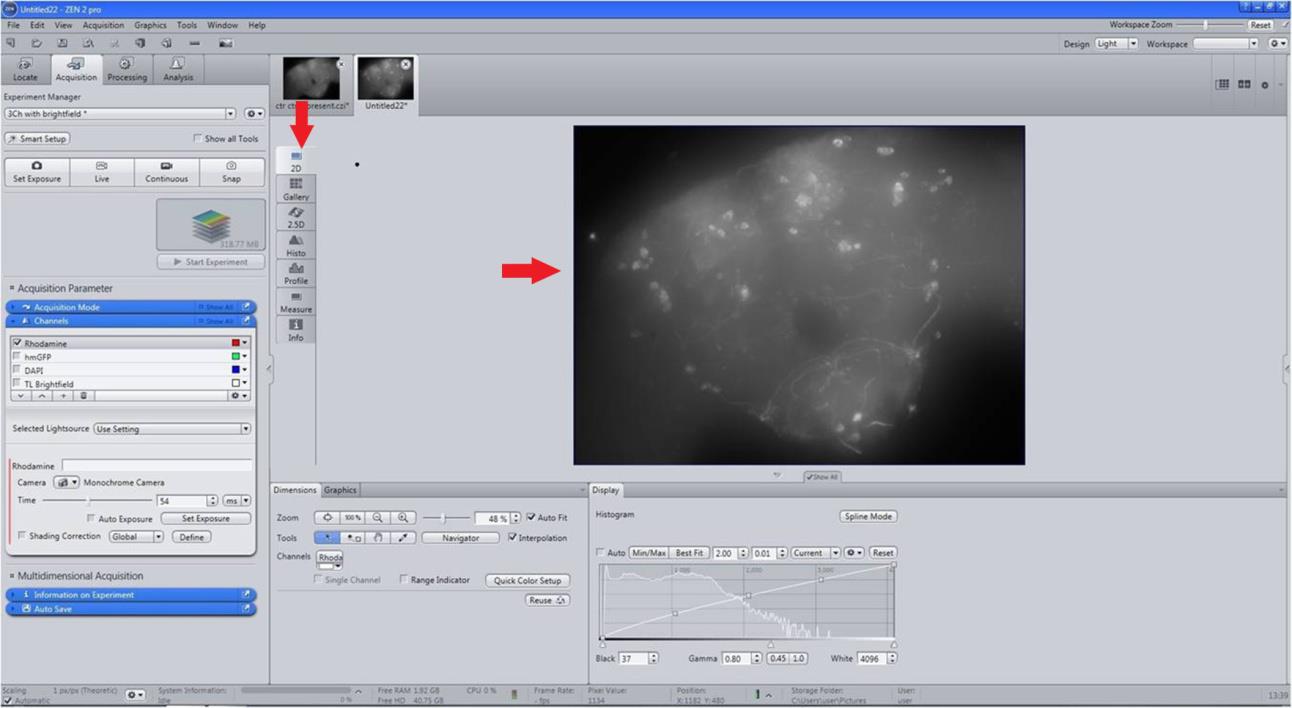
Figure 5. Export of 2D brain image to the required format
Method for quantification of DAergic neurons
Identify clusters from the images/scans obtained through Z-stack programming with constant intervals (Figure 6).
Enlarge the image to reveal the cell body/structure (Figure 6).
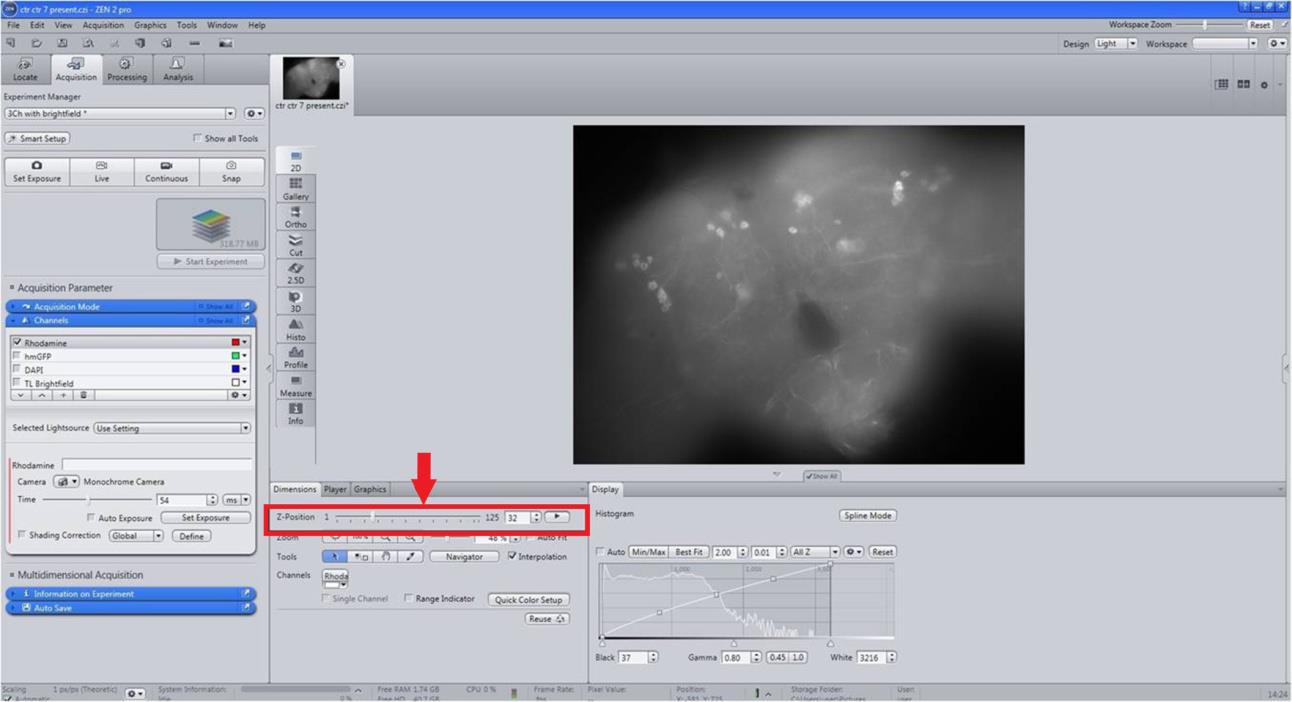
Figure 6. Quantification of dopaminergic (DAergic) neuronal number and fluorescence intensity (FI). For the quantification of DAergic neuronal number and FI, select 3D images/scans of Z-Stack with brain regions; PAL, PPL1, PPL2, PPM1/2, and PPM3 (PAL: Protocerebral anterior lateral; PPL: Protocerebral posterior lateral; PPM: Protocerebral posterior medial).Determine/count the number of DAergic neurons in each cluster in an unbiased manner.
Method for characterization of FI of DAergic neurons
From 3D scan images, chose the PAL, PPL1, PPL2, PPM1/2, PPM3, and VUM (quantifiable DAergic neuronal clusters) regions of the fly brains (Figure 6).
Enlarge brain images to see the clear neurites (Figure 7).
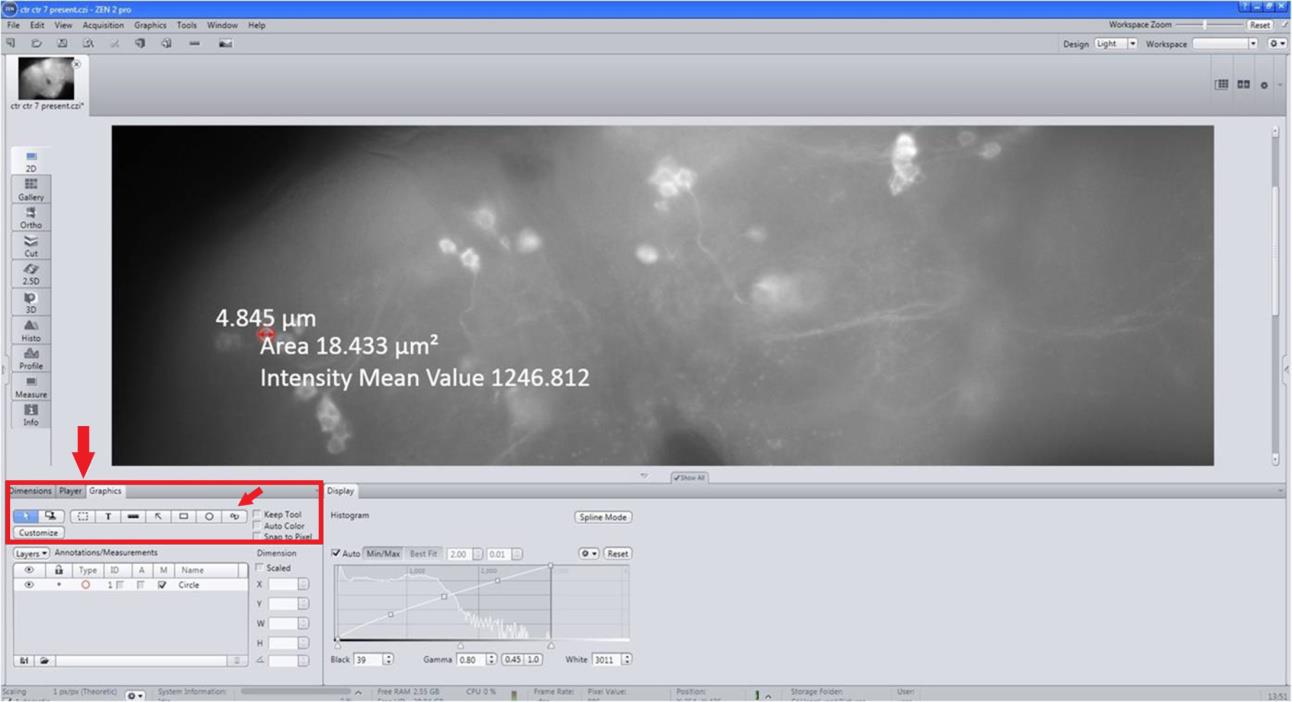
Figure 7. Details of the quantification of the fluorescence intensity (FI). Enlarge the images to see clear neurites, select appropriate tools, draw spline contour from graphics and draw a line around the neuron, and display intensity mean value and area.Select the appropriate graphics tool, draw spline contour, and draw a line to encircle the neuron giving intensity mean and area (Figure 7).
Select More measurement options and chose intensity sum by right-clicking inside the neuron (Figure 8).
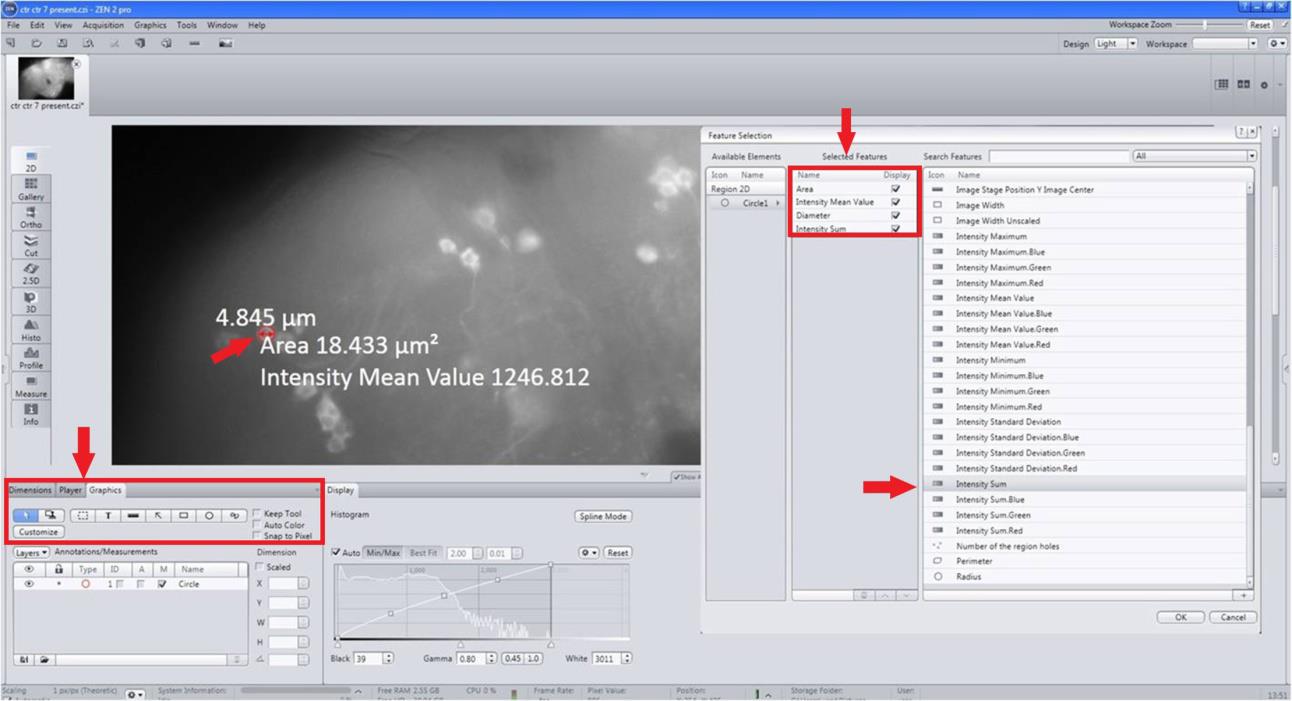
Figure 8. Measurement of fluorescence intensity (FI) sum. Select intensity sum by opting for more measurement options (software provides the pixel value upon right-clicking on the neuron).From the Measurement tab on the left side of the panel, select List, All views and Create document (Figure 9).
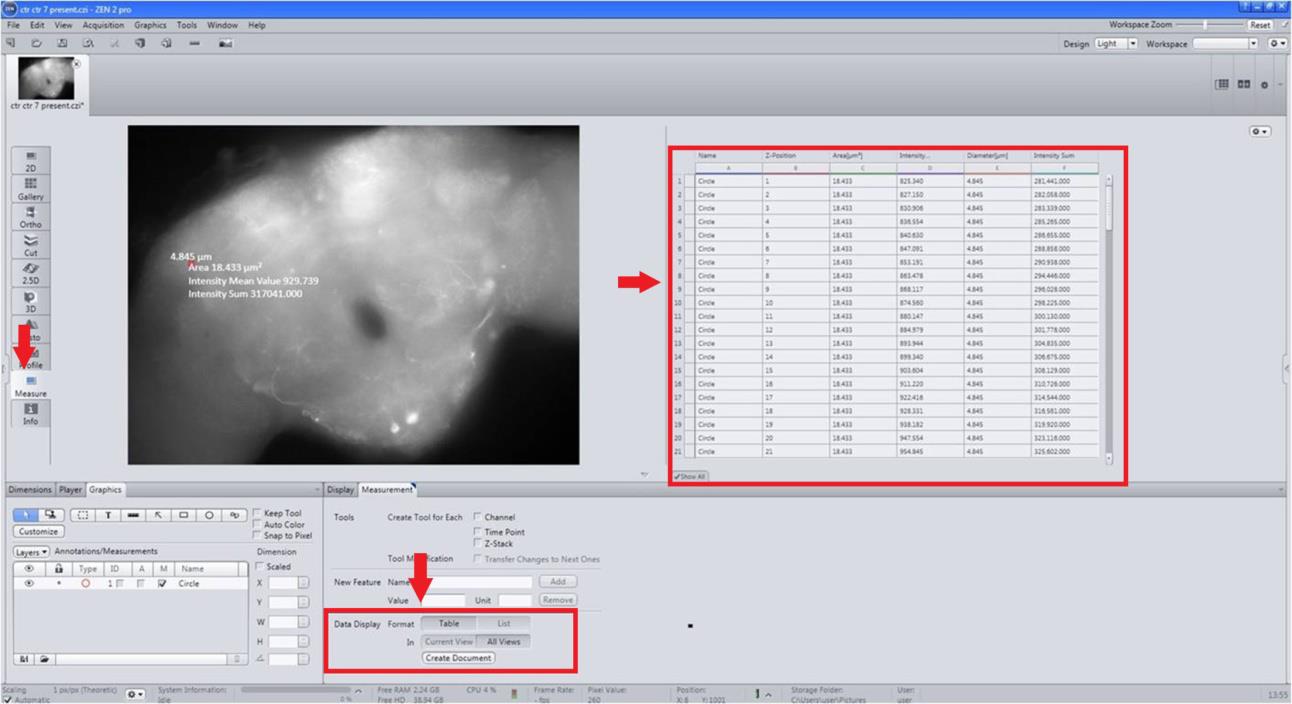
Figure 9. Fluorescence intensity (FI) compilation. From the measurement option select list, All views, and create document.Record the area and FI sum for each image of a neuron in .xml format (Figure 10).
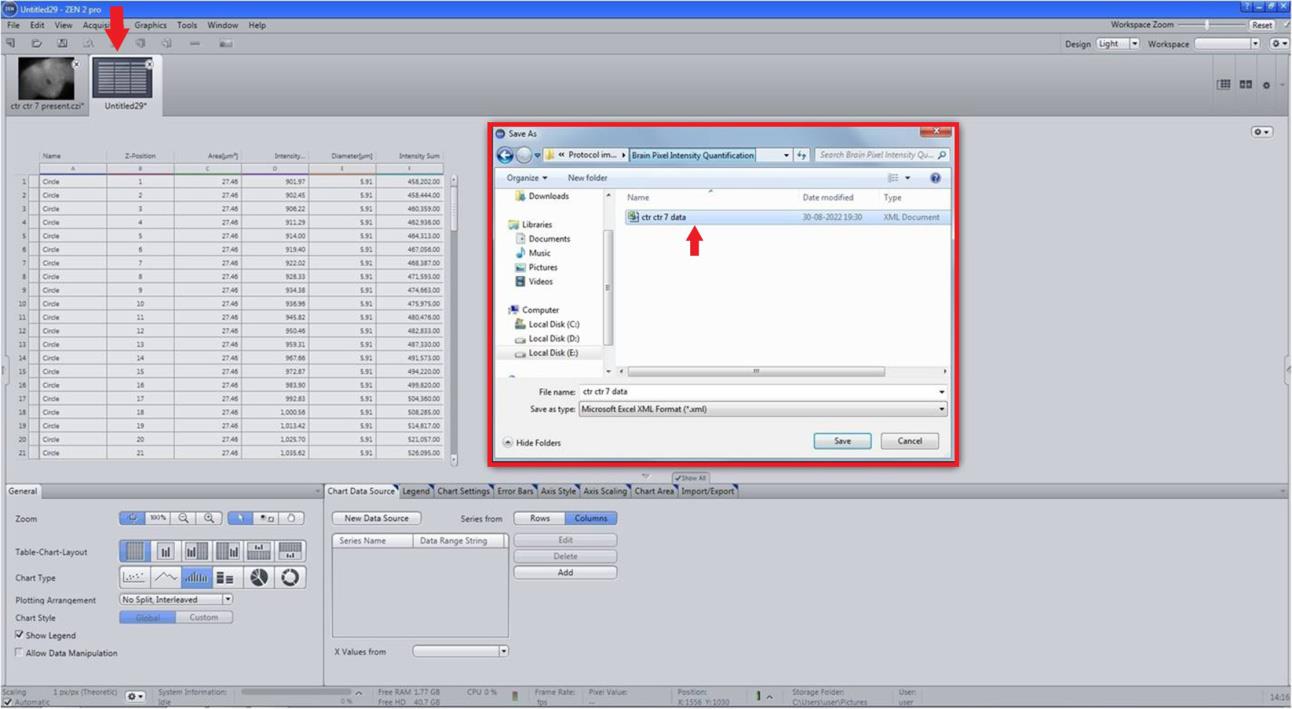
Figure 10. Measuring the FI sum for each scan of a neuron in .xml formatFor quantification of FI of a single neuron, we considered a total of 11 scans with an interval of 1.08 μm for each scan (cumulative of 11.88 μm width) (Figure 11).
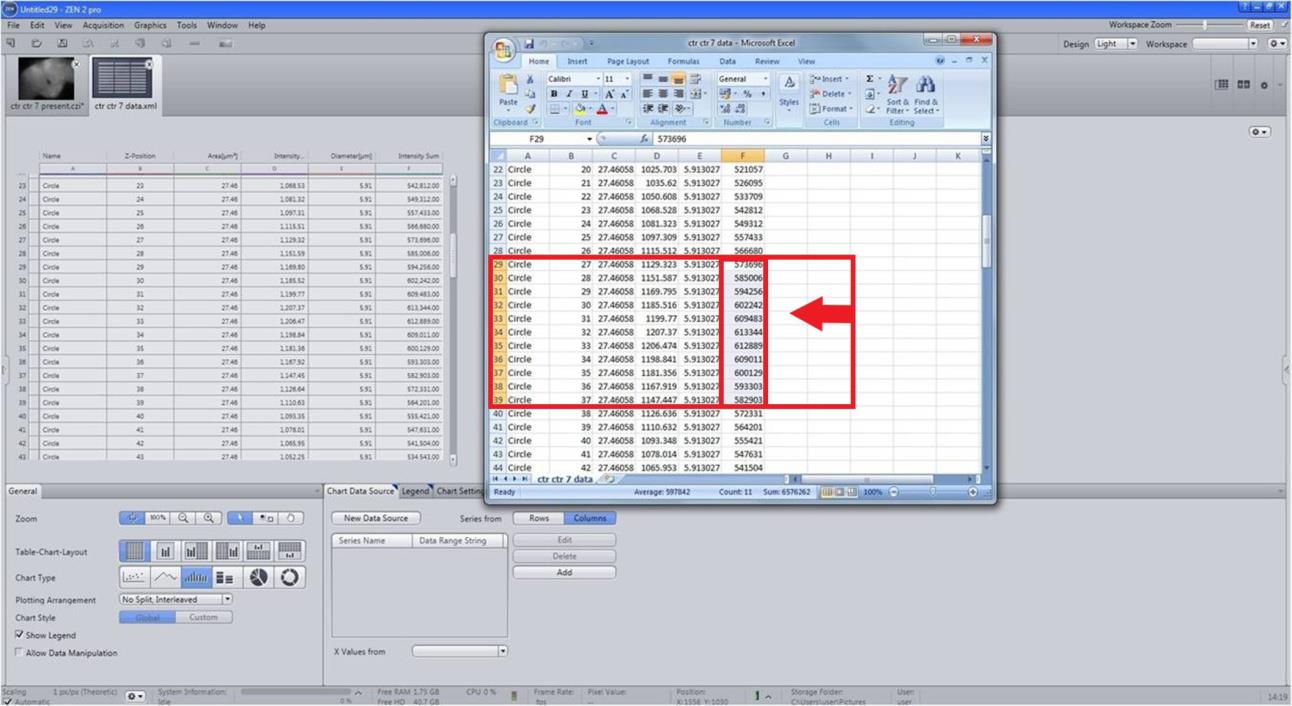
Figure 11. Compilation of fluorescence intensity (FI) of a single neuron and all the neurons of a cluster. For the characterization of FI of a single neuron, a total of 11 scans with an interval of 1.08 μm for each scan (cumulative 11.88 μm width) were considered. Take the average and find the standard error. Follow the same method/step(s) for all the dopaminergic (DAergic) neurons. The intensity sum of all the neurons in a specific cluster gives the total FI of that particular region (cluster-wise). The total FI is the sum of the FI of all the neurons belonging to all the DAergic neuronal clusters.The intensity sum of all the neurons in a cluster gives the total FI of that particular region (cluster-wise).
Total FI is the sum of the FIs of all the neurons belonging to all the DAergic neuronal clusters.
Precautions and recommendations
Head tissue fixation is critical and should be properly done [use the test tube rotator with constant velocity (10 rpm) for fixing the head tissue gently and thoroughly]. If any issue arises with the working of antibodies (primary ab), the worker should first check if fixation was done thoroughly and properly before investing time in figuring out the efficiency of the antibody.
Incubation with primary and secondary antibodies should be done using a test tube rotator with constant velocity (10 rpm).
Critical: To prevent brains from being crushed, glass spacers should be used while mounting the brains with a coverslip.
Coverslip edges should be thoroughly sealed with nail polish to avoid drying up of the brains.
Image acquisition should be done on the same day to avoid bleaching.
Care should be taken to capture images from the samples with the same orientation.
The red dot test should be carried out carefully.
The same setting should be reused to capture the images/scans of different samples.
Care should be taken while performing Z-stack programming so that no neuron is left out of scanning.
The DAergic neurons were determined/counted from the Z-stack images/scans. The number of DAergic neurons in each cluster was counted in an unbiased manner. A minimum of 10 brains were analyzed for DAergic neuronal number quantification. A merged fly brain 2D image was used for presentation (Figure 12).
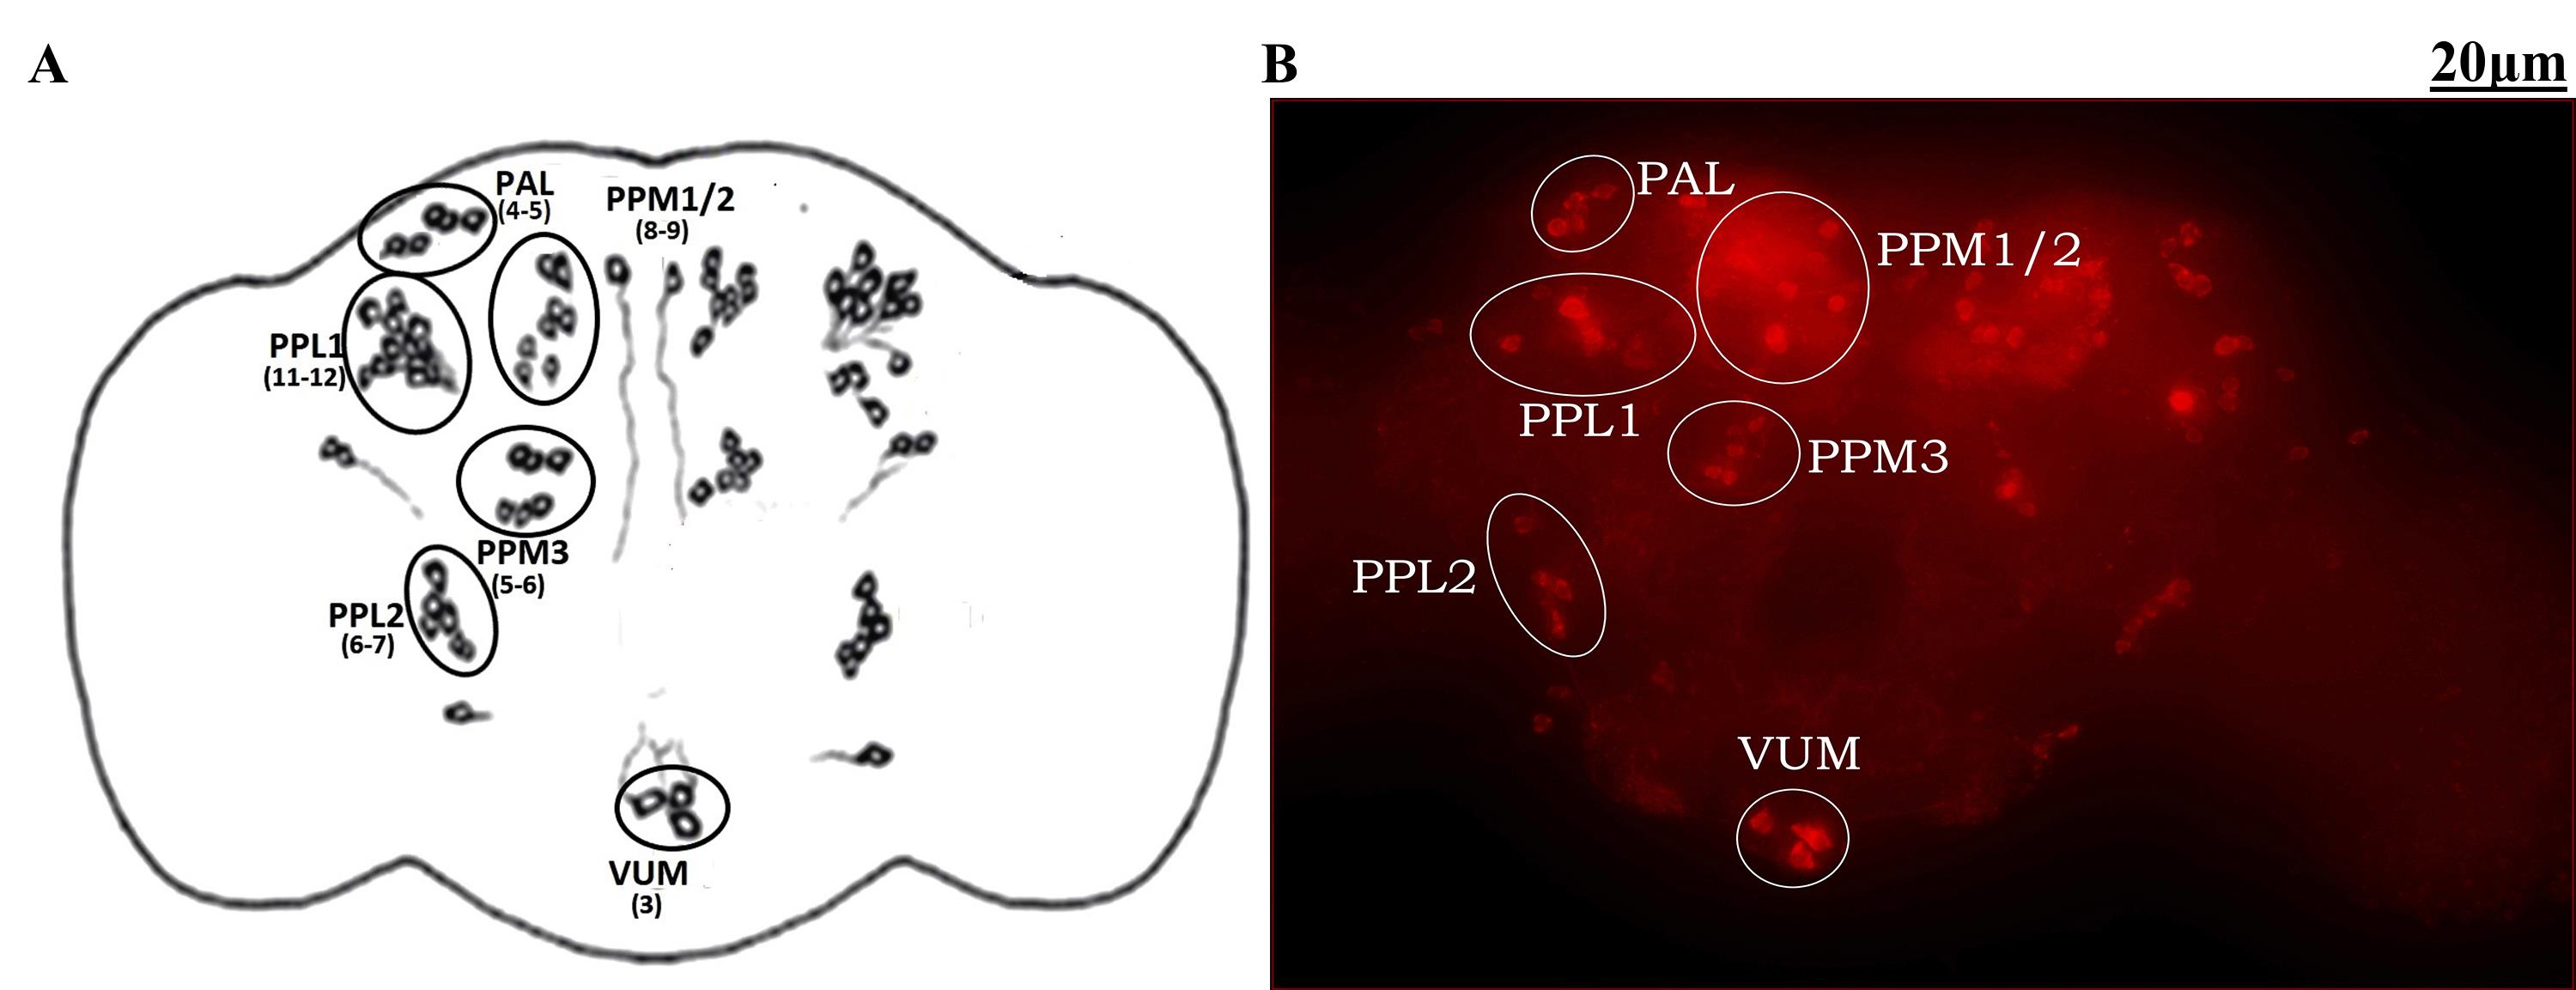
Figure 12. Demonstration of dopaminergic (DAergic) neuronal clusters in the whole brain of a Drosophila. A. Cartoon of Drosophila brain showing the position of different clusters of DAergic neurons. B. Whole-brain mount of Drosophila captured and analyzed using ZEN software of Carl Zeiss fluorescence microscope using fluorescently labeled secondary antibody targeted against the primary anti-TH antibody. The brain of Drosophila has approximately 140 DAergic neurons in each hemisphere, which are arranged into different clusters. Some of them are PAL (4–5 neurons), PPL1 (11–12 neurons), PPL2 (6/7 neurons), PPM1/2 (8/9 neurons), PPM3 (5–6 neurons), and VUM (3 neurons) (PAL: Protocerebral anterior lateral; PPL: protocerebral posterior lateral; PPM: protocerebral posterior medial). Figures 1–12 adapted with modification from Ayajuddin et al. [28].For the characterization of FI of a single neuron, a total of 11 scans with an interval of 1.08 μm for each (cumulative 11.88 μm width) were considered. Then, average and standard error were obtained. The same method/step(s) were followed for all the DAergic neurons. The intensity sum of all neurons in a specific cluster gives the total FI of that particular region (cluster-wise). The total FI is the sum of the FI of all the neurons belonging to all the DAergic neuronal clusters.
Data was arranged and plotted using GraphPad Prism for total DAergic neurons and FI of all the DAergic neurons (Figure 13).
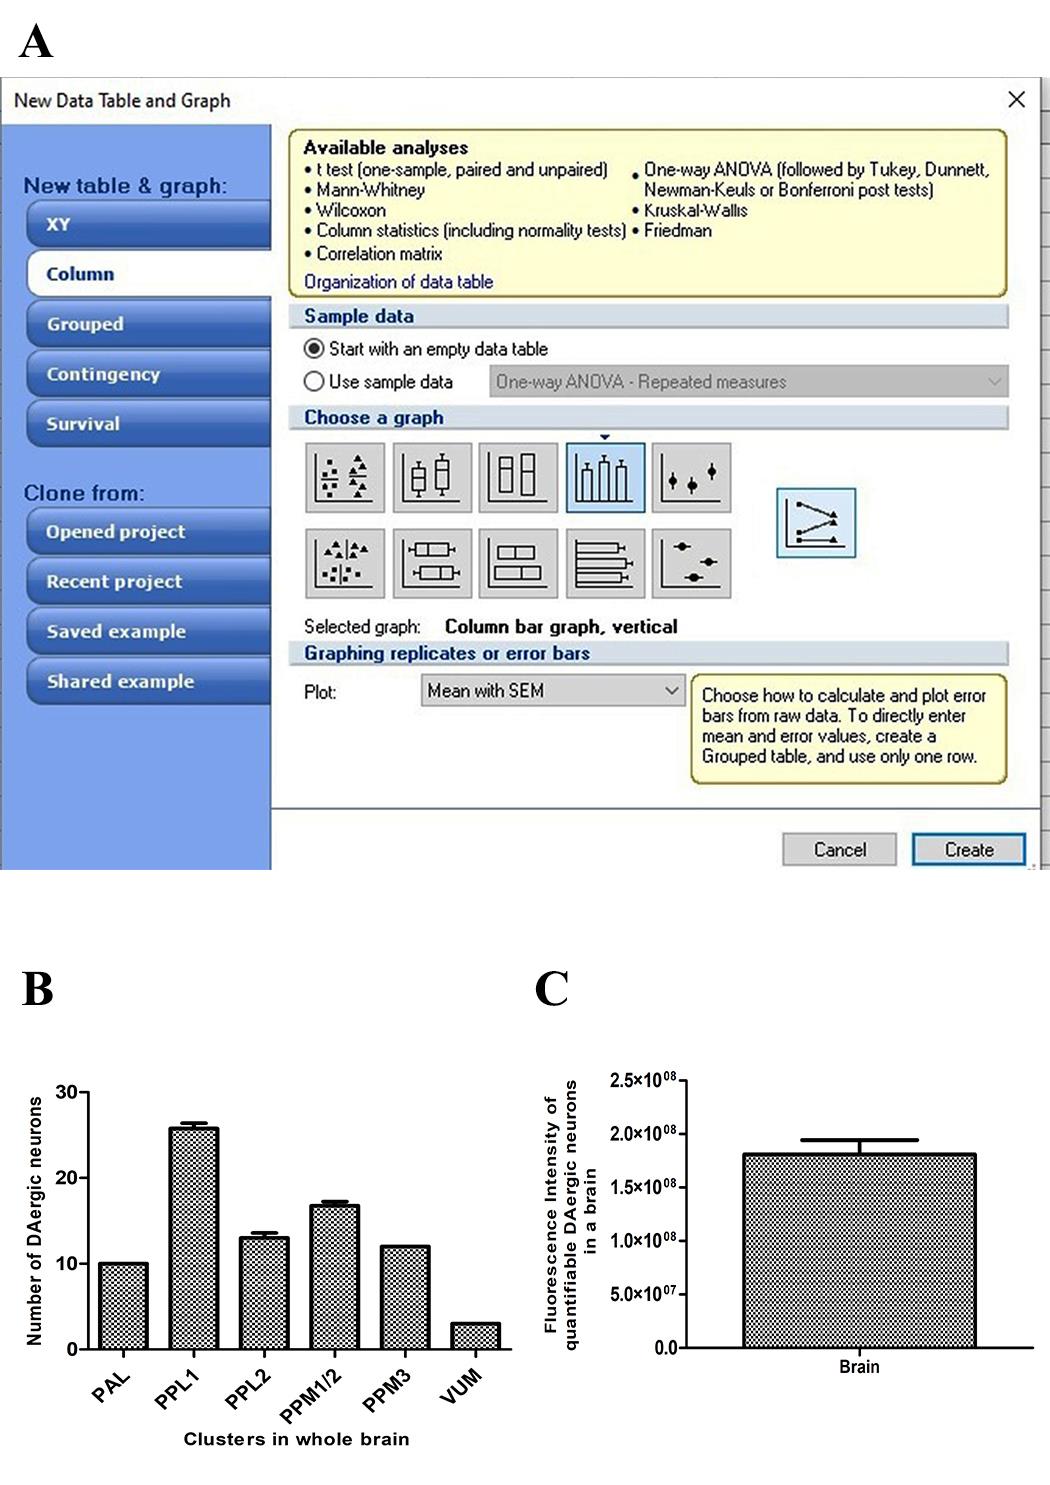
Figure 13. Data analysis and representation of results. A. Data was arranged and plotted using GraphPad Prism for total dopaminergic (DAergic) neurons and fluorescence intensity (FI) of all the neurons. B. Graphical representation of DAergic neurons. C. Graphical representation of total FI of secondary ab tagged against the primary ab (anti-TH) of DAergic neurons in Drosophila brain. Figures 12 and 13 were prepared using Adobe Photoshop CS 6.2 version: 13.0.1.
Data analysis
Analysis of Z-stack scans/images for quantification of DAergic neurons and characterization of FI in Drosophila brain
Validation of protocol
This protocol or parts of it has been used and validated in the following research article:
Ayajuddin et al. [28]. Fluorescence microscopy-based sensitive method to quantify dopaminergic neurodegeneration in a Drosophila model of Parkinson’s disease. Front. Neurosci. (Figure 2, Supplementary figures 1–11).
General notes and troubleshooting
Utmost care should be exercised while dissecting the head capsule out to avoid damaging the brain, which may damage certain neuronal clusters that will affect FI quantification (may not affect quantification of neuronal number).
It is important to pay attention and mix the heads thoroughly and gently while fixing them in PFA.
Image acquisition should be done soon after the preparation of slides to minimize the signal bleaching that could influence FI quantification.
Care should be taken to scan brains that are oriented in a dorsoventral position.
Scanning different brains in different orientations will give variation in FI signal levels.
Acknowledgments
This research was supported by the Department of Biotechnology (DBT), India (R&D grant nos. BT/405/NE/U-Excel/2013; BT/PR16868/NER/95/328/2015 and BT/COE/34/SP28408/2018) and the Science and Engineering Research Board (SERB) of the Department of Science and Technology (DST) India (R&D grant no. EMR/2016/002375, 27-3-2017) awarded to SCY. Part of this work was presented at the Indian Drosophila Research Conference (InDRC)-13-17 December 2021, organized by the Indian Institute of Science Education and Research (IISER-K), Kolkota by RC. RC and MA received DBT-JRF (junior research fellowship); RC received DBT-SRF (senior research fellowship) and ICMR (Indian Council of Medical Research)-SRF.
Original research paper: Ayajuddin, M., Chaurasia, R., Das, A., Modi, P., Phom, L., Koza, Z. and Yenisetti, S.C. (2023). Fluorescence microscopy-based sensitive method to quantify dopaminergic neurodegeneration in a Drosophila model of Parkinson’s disease. Front. Neurosci. 17:1158858 [28].
Competing interests
The author declares no conflicts of interest.
References
- Feany, M. B. and Bender, W. W. (2000). A Drosophila model of Parkinson’s disease. Nature 404(6776): 394–398. https://doi.org/10.1038/35006074
- Auluck, P. K., Chan, H. Y. E., Trojanowski, J. Q., Lee, V. Y. and Bonini, N. M. (2002). Chaperone Suppression of α-Synuclein Toxicity in a Drosophila Model for Parkinson's Disease. Science 295(5556): 865–868. https://doi.org/10.1126/science.1067389
- Ayajuddin, M., Phom, L., Koza, Z., Modi, P., Das, A., Chaurasia, R., Thepa, A., Jamir, N., Neikha, K., Yenisetti, S. C., et al. (2022). Adult health and transition stage-specific rotenone-mediated Drosophila model of Parkinson’s disease: Impact on late-onset neurodegenerative disease models. Front. Mol. Neurosci. 15: e896183. https://doi.org/10.3389/fnmol.2022.896183
- Bordet, G., Lodhi, N., Kossenkov, A. and Tulin, A. (2021). Age-Related Changes of Gene Expression Profiles in Drosophila. Genes 12(12): 1982. https://doi.org/10.3390/genes12121982
- Botella, J. A., Bayersdorfer, F., Gmeiner, F. and Schneuwly, S. (2009). Modelling Parkinson’s Disease in Drosophila. NeuroMol. Med. 11(4): 268–280. https://doi.org/10.1007/s12017-009-8098-6
- Maitra, U., Harding, T., Liang, Q. and Ciesla, L. (2021). GardeninA confers neuroprotection against environmental toxin in a Drosophila model of Parkinson’s disease. Commun. Biol. 4(1): e1038/s42003–021–01685–2. https://doi.org/10.1038/s42003-021-01685-2
- Navarro, J. A., Heßner, S., Yenisetti, S. C., Bayersdorfer, F., Zhang, L., Voigt, A., Schneuwly, S. and Botella, J. A. (2014). Analysis of dopaminergic neuronal dysfunction in genetic and toxin‐induced models of Parkinson's disease in Drosophila. J. Neurochem. 131(3): 369–382. https://doi.org/10.1111/jnc.12818
- Park, J., Lee, S. B., Lee, S., Kim, Y., Song, S., Kim, S., Bae, E., Kim, J., Shong, M., Kim, J. M., et al. (2006). Mitochondrial dysfunction in Drosophila PINK1 mutants is complemented by parkin. Nature 441(7097): 1157–1161. https://doi.org/10.1038/nature04788
- Pesah, Y., Burgess, H., Middlebrooks, B., Ronningen, K., Prosser, J., Tirunagaru, V., Zysk, J. and Mardon, G. (2005). Whole-mount analysis reveals normal numbers of dopaminergic neurons following misexpression of α-Synuclein in Drosophila. Genesis 41(4): 154–159. https://doi.org/10.1002/gene.20106
- Phom, L., Achumi, B., Alone, D. P., Muralidhara. and Yenisetti, S. C. (2014). Curcumin's Neuroprotective Efficacy in Drosophila Model of Idiopathic Parkinson's Disease Is Phase Specific: Implication of its Therapeutic Effectiveness. Rejuvenation Res. 17(6): 481–489. https://doi.org/10.1089/rej.2014.1591
- Rai, P. and Roy, J. K. (2022). Rab11 regulates mitophagy signaling pathway of Parkin and Pink1 in the Drosophila model of Parkinson's disease. Biochem. Biophys. Res. Commun. 626: 175–186. https://doi.org/10.1016/j.bbrc.2022.08.027
- Sur, M., Dey, P., Sarkar, A., Bar, S., Banerjee, D., Bhat, S. and Mukherjee, P. (2018). Sarm1 induction and accompanying inflammatory response mediates age-dependent susceptibility to rotenone-induced neurotoxicity. Cell Death Discovery 4(1): e1038/s41420–018–0119–5. https://doi.org/10.1038/s41420-018-0119-5
- Koza, Z., Ayajuddin, M., Das, A., Chaurasia, R., Phom, L. and Yenisetti, S. C. (2023). Sexual dysfunction precedes motor defects, dopaminergic neuronal degeneration, and impaired dopamine metabolism: Insights from Drosophila model of Parkinson’s disease. Front. Neurosci. 17: e1143793. https://doi.org/10.3389/fnins.2023.1143793
- Chen, L. and Feany, M. B. (2005). α-Synuclein phosphorylation controls neurotoxicity and inclusion formation in a Drosophila model of Parkinson disease. Nat. Neurosci. 8(5): 657–663. https://doi.org/10.1038/nn1443
- Cooper, A. A., Gitler, A. D., Cashikar, A., Haynes, C. M., Hill, K. J., Bhullar, B., Liu, K., Xu, K., Strathearn, K. E., Liu, F., et al. (2006). α-Synuclein Blocks ER-Golgi Traffic and Rab1 Rescues Neuron Loss in Parkinson's Models. Science 313(5785): 324–328. https://doi.org/10.1126/science.1129462
- Trinh, K., Moore, K., Wes, P. D., Muchowski, P. J., Dey, J., Andrews, L. and Pallanck, L. J. (2008). Induction of the Phase II Detoxification Pathway Suppresses Neuron Loss in Drosophila Models of Parkinson's Disease. J. Neurosci. 28(2): 465–472. https://doi.org/10.1523/jneurosci.4778-07.2008
- Trinh, K., Andrews, L., Krause, J., Hanak, T., Lee, D., Gelb, M. and Pallanck, L. (2010). Decaffeinated Coffee and Nicotine-Free Tobacco Provide Neuroprotection in Drosophila Models of Parkinson's Disease through an NRF2-Dependent Mechanism. J. Neurosci. 30(16): 5525–5532. https://doi.org/10.1523/jneurosci.4777-09.2010
- Barone, M. C., Sykiotis, G. P. and Bohmann, D. (2011). Genetic activation of Nrf2 signaling is sufficient to ameliorate neurodegenerative phenotypes in a Drosophila model of Parkinson’s disease. Dis Model Mech. 4(5): 701–707. https://doi.org/10.1242/dmm.007575
- Hernandez-Vargas, R., Fonseca-Ornelas, L., Lopez-Gonzalez, I., Riesgo-Escovar, J., Zurita, M., and Reynaud, E. (2011). Synphilin suppresses a-synuclein neurotoxicity in a Parkinson’s disease Drosophila model. Genesis 49(5):392–402. https://doi.org/10.1002/dvg.20740
- Pesah, Y., Pham, T., Burgess, H., Middlebrooks, B., Verstreken, P., Zhou, Y., Harding, M., Bellen, H. and Mardon, G. (2004). Drosophila parkinmutants have decreased mass and cell size and increased sensitivity to oxygen radical stress. Development 131(9): 2183–2194. https://doi.org/10.1242/dev.01095
- Menzies, F. M., Yenisetti, S. C. and Min, K. T. (2005). Roles of Drosophila DJ-1 in Survival of Dopaminergic Neurons and Oxidative Stress. Curr. Biol. 15(17): 1578–1582. https://doi.org/10.1016/j.cub.2005.07.036
- Meulener, M., Whitworth, A. J., Armstrong-Gold, C. E., Rizzu, P., Heutink, P., Wes, P. D., Pallanck, L. J. and Bonini, N. M. (2005). Drosophila DJ-1 Mutants Are Selectively Sensitive to Environmental Toxins Associated with Parkinson’s Disease. Curr. Biol. 15(17): 1572–1577. https://doi.org/10.1016/j.cub.2005.07.064
- Whitworth, A. J., Theodore, D. A., Greene, J. C., Beneš, H., Wes, P. D. and Pallanck, L. J. (2005). Increased glutathione S -transferase activity rescues dopaminergic neuron loss in a Drosophila model of Parkinson's disease. Proc. Natl. Acad. Sci. U.S.A. 102(22): 8024–8029. https://doi.org/10.1073/pnas.0501078102
- Coulom, H. and Birman, S. (2004). Chronic Exposure to Rotenone Models Sporadic Parkinson's Disease in Drosophila melanogaster. J. Neurosci. 24(48): 10993–10998. https://doi.org/10.1523/jneurosci.2993-04.2004
- Chaudhuri, A., Bowling, K., Funderburk, C., Lawal, H., Inamdar, A., Wang, Z. and O'Donnell, J. M. (2007). Interaction of Genetic and Environmental Factors in a Drosophila Parkinsonism Model. J. Neurosci. 27(10): 2457–2467. https://doi.org/10.1523/jneurosci.4239-06.2007
- Wang, C., Lu, R., Ouyang, X., Ho, M. W. L., Chia, W., Yu, F. and Lim, K. L. (2007). Drosophila Overexpressing Parkin R275W Mutant Exhibits Dopaminergic Neuron Degeneration and Mitochondrial Abnormalities. J. Neurosci. 27(32): 8563–8570. https://doi.org/10.1523/jneurosci.0218-07.2007
- Chaouhan, H. S., Li, X., Sun, K. T., Wang, I. K., Yu, T. M., Yu, S. H., Chen, K. B., Lin, W. Y. and Li, C. Y. (2022). Calycosin Alleviates Paraquat-Induced Neurodegeneration by Improving Mitochondrial Functions and Regulating Autophagy in a Drosophila Model of Parkinson’s Disease. Antioxidants 11(2): 222. https://doi.org/10.3390/antiox11020222
- Ayajuddin, M., Chaurasia, R., Das, A., Modi, P., Phom, L., Koza, Z. and Yenisetti, S. C. (2023). Fluorescence microscopy-based sensitive method to quantify dopaminergic neurodegeneration in a Drosophila model of Parkinson’s disease. Front. Neurosci. 17: e1158858. https://doi.org/10.3389/fnins.2023.1158858
Article Information
Copyright
© 2024 The Author(s); This is an open access article under the CC BY-NC license (https://creativecommons.org/licenses/by-nc/4.0/).
How to cite
Chaurasia, R., Ayajuddin, M., Ratnaparkhi, G. S., LS, S. and Yenisetti, S. C. (2024). A Simple Immunofluorescence Method to Characterize Neurodegeneration and Tyrosine Hydroxylase Reduction in Whole Brain of a Drosophila Model of Parkinson’s Disease. Bio-protocol 14(4): e4937. DOI: 10.21769/BioProtoc.4937.
Category
Neuroscience > Nervous system disorders > Parkinson's disease
Cell Biology > Cell imaging > Fluorescence
Do you have any questions about this protocol?
Post your question to gather feedback from the community. We will also invite the authors of this article to respond.