- Protocols

- Articles and Issues
- For Authors
- About
- Become a Reviewer

Identification of Acetylation Sites of Fatty Acid Synthase (FASN) by Mass Spectrometry and FASN Activity Assay

Published: Vol 13, Iss 21, Nov 5, 2023 DOI: 10.21769/BioProtoc.4873 Views: 1936
Reviewed by: Komuraiah MyakalaGautam RunwalAnonymous reviewer(s)
Original research article
The authors used this protocol in:
Dec 2022

Protocol Collections
Comprehensive collections of detailed, peer-reviewed protocols focusing on specific topics


Related protocols
Abstract
Lysine acetylation is a conserved post-translational modification and a key regulatory mechanism for various cellular processes, including metabolic control, epigenetic regulation, and cellular signaling transduction. Recent advances in mass spectrometry (MS) enable the extensive identification of acetylated lysine residues of histone and non-histone proteins. However, protein enrichment before MS analysis may be necessary to improve the detection of low-abundant proteins or proteins that exhibit low acetylation levels. Fatty acid synthase (FASN), an essential enzyme catalyzing the de novo synthesis of fatty acids, has been found to be acetylated in various species, from fruit flies to humans. Here, we describe a step-by-step process of antibody-based protein enrichment and sample preparation for acetylation identification of endogenous FASN protein by MS-based proteomics analysis. Meanwhile, we provide a protocol for nicotinamide adenine dinucleotide phosphate (NADPH) absorbance assay for FASN activity measurement, which is one of the primary functional readouts of de novo lipogenesis.
Key features
• A comprehensive protocol for protein immunoprecipitation and sample preparation for acetylation site identification by mass spectrometry.
• Step-by-step procedures for measurement of FASN activity of fruit fly larvae using an absorbance assay.
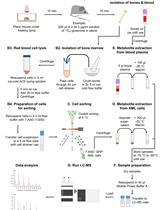
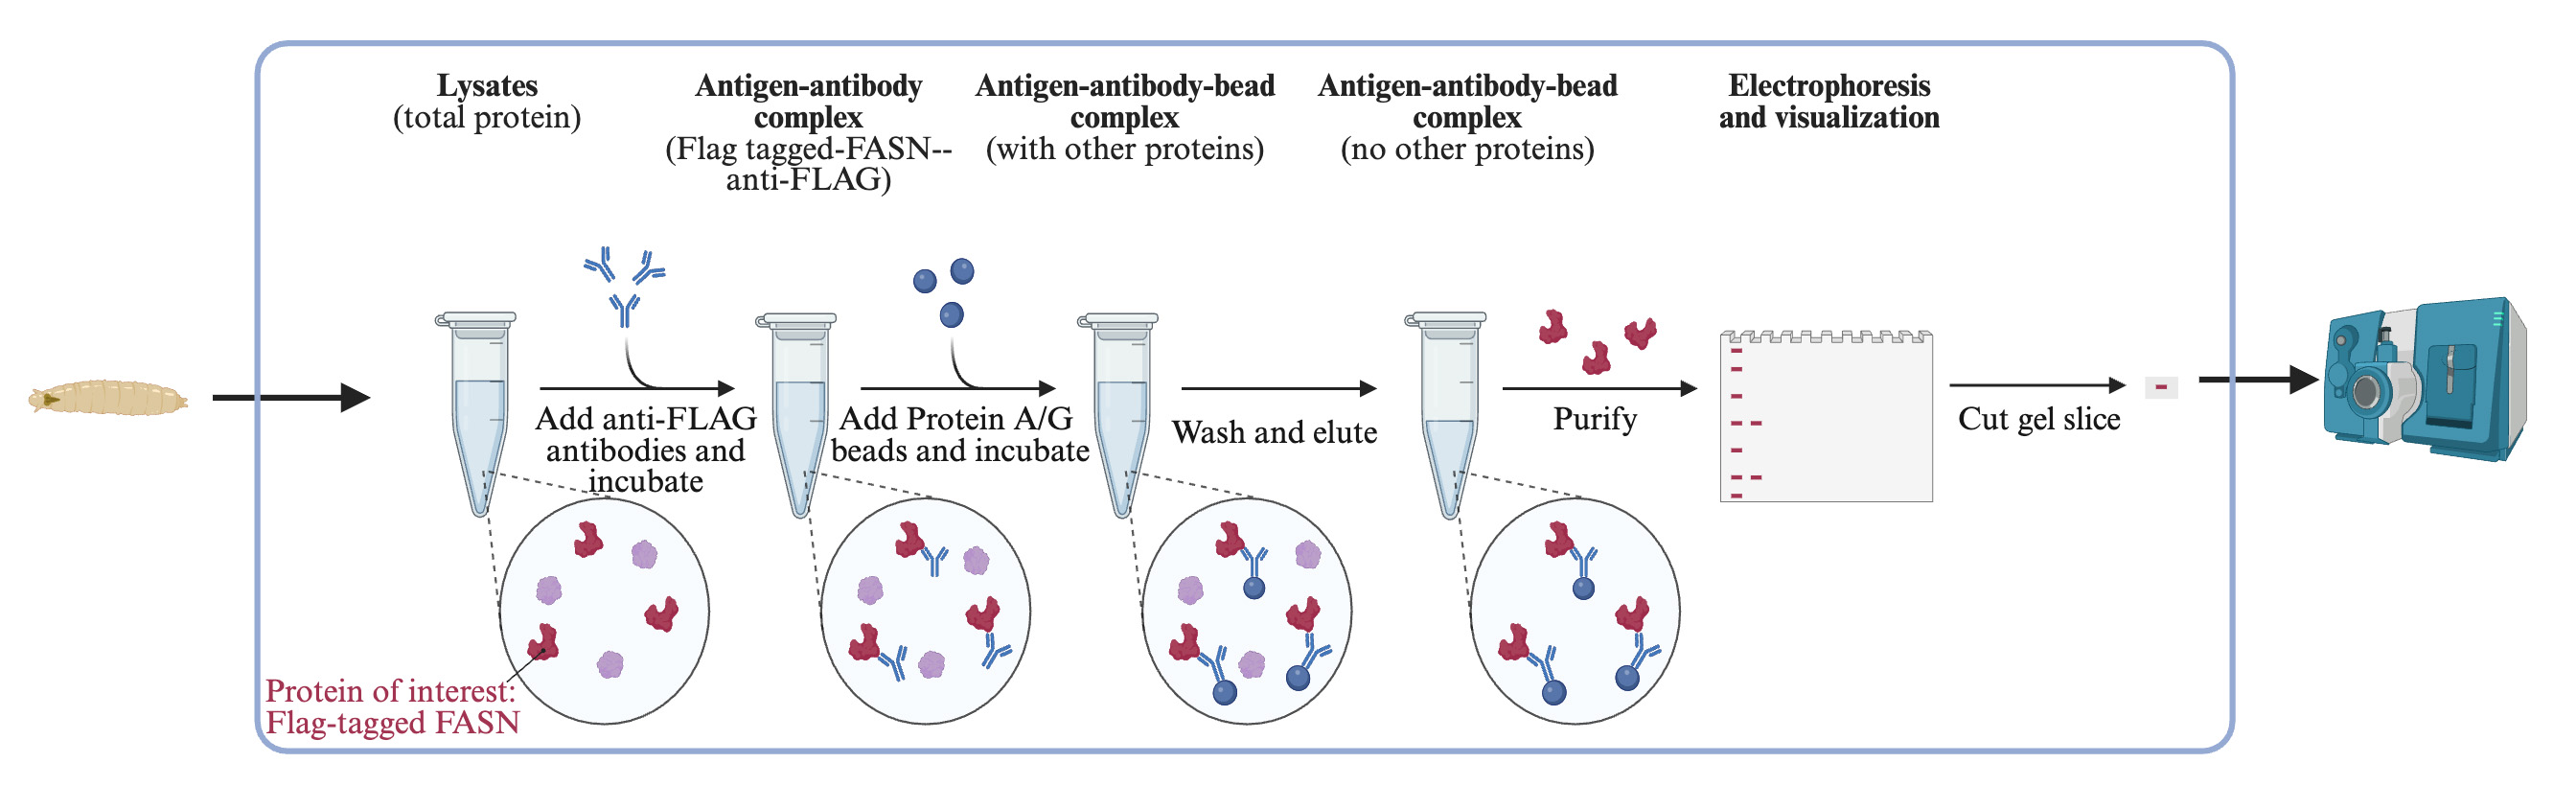
Graphical overview
Background
Lysine acetylation is a post-translational modification (PTM) described as the transfer of an acetyl group from acetyl-coenzyme A (acetyl-CoA) to the primary amine of the lysine side chain of a protein. Lysine acetylation links acetyl-CoA metabolism and cellular signaling. Histone acetylation was well known to alter nucleosomal conformation, which is one of the most important regulatory mechanisms of its transcriptional activity (Boffa et al., 1978; Sealy, 1978; Vettese-Dadey et al., 1996). In the past 20 years, thanks to the advances in mass spectrometry (MS)-based proteomics technique, the acetylation of thousands of non-histone proteins was identified and characterized (Choudhary et al., 2009; Wang et al., 2010; Zhao et al., 2010). These proteome-wide discoveries of lysine acetylation sites enable acetylome mapping in various species and in numerous biological processes such as aging and tumor progression, which provides prerequisites for novel discovery of the function of protein acetylation (Sato et al., 2017; Yeo et al., 2020; Zhang et al., 2020). The information on protein acetylation is presented comprehensively in open-access databases such as Protein Lysine Modification Database (PLMD) (Xu et al., 2017).
However, due to the low abundance of some protein targets and relatively low levels of lysine acetylation modification, protein enrichment prior to proteomics is sometimes necessary to improve the efficiency and coverage of the analysis (Jensen et al., 2021). An antibody-based enrichment method is one of the most widely used strategies for the characterization of the dynamic acetylome or modifications of a protein of interest (Inuzuka et al., 2012; Lin et al., 2013; Miao et al., 2022). Here, we describe step-by-step procedures for the identification of acetylated lysine sites of fatty acid synthase (FASN) of fruit fly Drosophila larvae.
De novo lipogenesis (DNL) is a tightly regulated metabolic pathway that converts carbohydrates to fatty acids (Song et al., 2018). FASN uses acetyl-CoA and malonyl-CoA as the substrates and nicotinamide adenine dinucleotide phosphate (NADPH) as a cofactor to catalyze the formation of palmitate, the first fatty acid product of DNL. Therefore, FASN activity is one of the primary functional readouts for DNL. Here, we describe an NADPH absorbance assay that can be used to quantify FASN enzymatic activity and kinetics (Dils and Carey, 1975; Cox and Hammes, 1983; Menendez et al., 2004).
Materials and reagents
Flies
Fly lines used in this study: ywR (a gift from Eric Rulifson); ywR; FASNFlag (Miao et al., 2022). Flies were maintained at 25 °C, 60% relative humidity, and a 12:12 h light/dark cycle. Adults and larvae are reared on standard cornmeal and yeast-based food.
Reagents
PierceTM IP lysis buffer (Thermo ScientificTM, catalog number: 87787)
Protease inhibitor cocktail (PIC, 100×) (Sigma-Aldrich, catalog number: P8340)
PMSF protease inhibitor (Fisher Scientific, Thermo ScientificTM, catalog number: PI36978)
Sodium butyrate (VWR, Thermo ScientificTM, catalog number: AAAA11079-06)
Nicotinamide (NAM) (Sigma-Aldrich, catalog number: 72340)
PierceTM BCA Protein Assay kit (Thermo ScientificTM, catalog number: 23225)
SureBeadsTM Protein G magnetic beads (Bio-Rad, catalog number: 1614023)
2× Laemmli sample buffer (Bio-Rad, catalog number: 1610737)
10× Premixed electrophoresis buffer (Bio-Rad, catalog number: 1610732)
4%–20% Mini-PROTEAN® TGXTM Precast protein gels (Bio-Rad, catalog number: 4561093)
Sucrose (Sigma-Aldrich, catalog number: S9378)
GibcoTM HEPES (1 M) (Fisher Scientific, catalog number: 15-630-080)
Magnesium chloride (MgCl2) (Fisher Scientific, Thermo Scientific Chemicals, catalog number: AC223210010)
Dithiothreitol (DTT) (Sigma-Aldrich, catalog number: D0632)
UltraPureTM 0.5 M EDTA, pH 8.0 (Fisher Scientific, InvitrogenTM, catalog number: 15-575-020)
PierceTM Coomassie (Bradford) Protein Assay kit (Thermo ScientificTM, catalog number: 23200)
Monoclonal ANTI-FLAG® M2 antibody (Sigma-Aldrich, catalog number: F1804-50UG)
Solutions
100 mM PMSF
5 M Sodium Butyrate
1 M NAM
1 M Sucrose
1 M MgCl2
1 M DTT
1 M Dipotassium phosphate (K2HPO4)
1 M Potassium dihydrogen phosphate (KH2PO4)
24 mM NADPH
6.2 mM Acetyl-CoA
5.8 mM Malonyl-CoA
Protein lysis buffer for immunoprecipitation and electrophoresis (lysis buffer 1) (see Recipes)
Protein denature buffer for protein elution and electrophoresis (denature buffer) (see Recipes)
Electrophoresis running buffer (see Recipes)
Protein lysis buffer for FASN activity assay (lysis buffer 2) (see Recipes)
200 mM potassium phosphate buffer (PPB), pH 6.6 (see Recipes)
FASN reaction buffer (see Recipes)
Recipes
Protein lysis buffer for immunoprecipitation and electrophoresis (lysis buffer 1)
6–7 mL of lysis buffer 1 will be used for lysis and washing steps; calculate the total volume according to number of samples and make the buffer freshly.
PierceTM IP lysis buffer supplied with 1× PIC, 1 mM PMSF, 50 mM sodium butyrate, and 50 mM NAM
Protein denature buffer for protein elution and electrophoresis (denature buffer)
Note: Make fresh.
950 μL of 2× Laemmli sample buffer
50 μL of BME
1 mL of lysis buffer 1
Electrophoresis running buffer
Note: Can be stored at room temperature.
10× Premixed electrophoresis buffer following dilution to 1× with water
Protein lysis buffer for FASN activity assay (lysis buffer 2)
300 μL of lysis buffer 2 will be used for the lysis step; calculate the total volume according to number of samples and make the buffer freshly.
250 mM sucrose
20 mM HEPES Buffer, pH 7.2
2 mM MgCl2
1 mM DTT
1 mM EDTA
1× PIC
200 mM potassium phosphate buffer (PPB), pH 6.6
Note: Stable at 4 °C for two months.
0.76 mL of 1 M K2HPO4
1.24 mL of 1 M KH2PO4
Bring volume to 10 mL with distilled water
FASN reaction buffer
200 μL of the reaction buffer will be added to each sample/standard; calculate the volume according to number of standards and samples and make the buffer freshly.
200 mM PPB, pH 6.6
1 mM DTT
1 mM EDTA
0.24 mM NADPH
0.031 mM Acetyl-CoA
Laboratory supplies
Pellet PestleTM cordless motor (Fisher Scientific, catalog number: 12-141-361)
Magnetic bead rack (Bio-Rad, catalog number: 1614916)
1.7 mL low-binding microcentrifuge tube (Fisher Scientific, catalog number: 07-200-184)
Equipment
Sonifier (Branson, model: SFX150)
Microcentrifuge (SorvallTM LegendTM Micro 21)
Digital dry baths/block heaters (Fisher Scientific, catalog number: 88860103)
Microplate spectrophotometer (BioTek Epoch 2)
ChemiDoc MP Imaging System (Bio-Rad)
Procedure
Part I: Identification of acetylation sites by mass spectrometry
Protein extraction
Collect 30–50 mg of third-instar larvae (L3) of FASNFlag flies with a Flag knock-in at FASN locus in a microcentrifuge tube. Samples can be flash-frozen in liquid nitrogen and stored at -80 °C.
Make lysis buffer 1 right before protein extraction.
Add 300 μL of lysis buffer 1 to each tube. Homogenize larvae with a pestle gun on ice until larvae are shattered.
Sonicate for 10 s at 10–20 amplitude.
Bring volume to 800 μL with lysis buffer 1. Incubate samples on ice for 20 min.
Spin at 20,000× g for 30 min at 4 °C.
Transfer the supernatant to a new tube. Repeat the centrifugation step twice or until the supernatant is clear.
Pipette 5 μL of lysate to a new tube. Dilute ten times with lysis buffer 1. The protein concentration of each sample is determined by PierceTM BCA Protein Assay according to the manufacturer’s protocol.
Dilute protein to an equal amount according to the PierceTM BCA Protein Assay. The optimal amount of total protein for FASN pull down assay is approximately 1 mg. Bring volume to 1 mL with lysis buffer 1.
Pause step: Proteins can be snap frozen in liquid nitrogen and stored at -80 °C.
Immunoprecipitation
Add 25 μL of SureBeadsTM Protein G magnetic beads to a clean microcentrifuge tube.
Wash the beads three times with 200 μL of lysis buffer 1: vortex for 5 s to resuspend the beads and centrifuge at 10,000× g for 1 min. Collect beads using a magnetic bead rack and remove the buffer by pipetting.
Add protein lysate from Step A directly to the beads. Incubate at 4 °C on a rotor for 30 min to remove non-specific bindings.
Briefly spin down the bead-lysate mixture. Collect beads using a magnetic bead rack and transfer lysate to a fresh microcentrifuge tube.
Add 10 μL of ANTI-FLAG® M2 antibody (anti-FLAG) to 1 mL of protein lysate (1:100 dilution).
Incubate antibody-lysate mixture on a rotor at 4 °C overnight.
Add 100 μL of SureBeadsTM Protein G magnetic beads to a clean microcentrifuge tube. Wash the beads three times with 500 μL of lysis buffer 1 as described above.
Add the antibody-lysate mixture to the beads. Vortex briefly to resuspend the beads.
Incubate the antibody-lysate-beads mixture on a rotor at 4 °C for 3 h.
Collect beads using a magnetic bead rack and discard the liquid by pipetting.
Wash the beads three times with 1 mL of lysis buffer 1. Rotate at 4 °C for 10 min between each wash.
Collect beads using a magnetic bead rack and carefully remove all liquid. Add 30 μL of denature buffer. Resuspend the beads by gently tapping the tube.
Heat samples at 95 °C for 5 min to elute proteins from the beads, gently tapping the tube at the halfway point.
Briefly spin samples and place the tube in a magnetic bead rack. Transfer elution to a new microcentrifuge tube.
Pause step: Eluted and denatured proteins can be stored at -20 °C or lower.
Electrophoresis and Coomassie Blue staining
Load 30 µL of protein samples from Procedure B on a 4%–20% Mini-PROTEAN® TGXTM Precast protein gel for electrophoresis.
Apply Coomassie Blue stain to the protein gel according to the manufacturer’s protocol to visualize the protein.
Cut protein bands with approximately 250 kDa molecular weight; the gel slices can be temporally stored in a microcentrifuge tube with distilled water at 4 °C (Figure 1).
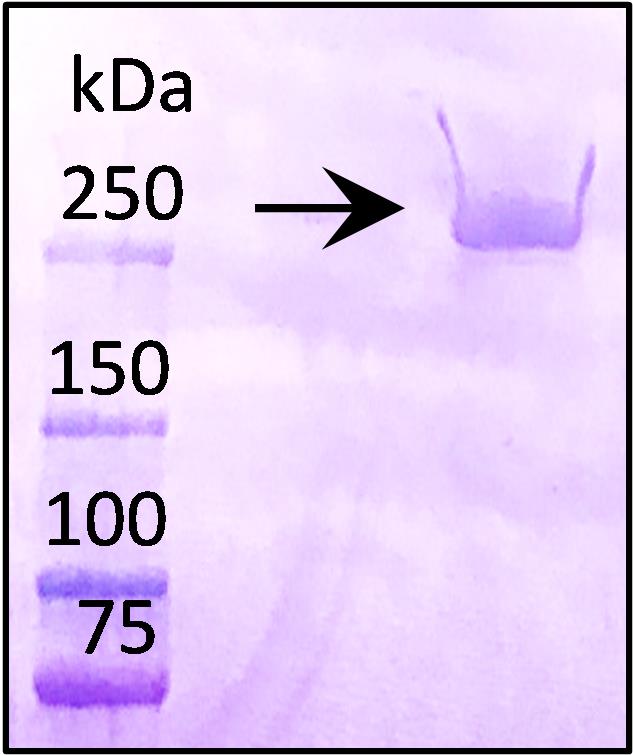
Figure 1. Protein electrophoresis gel showing immunoprecipitated fatty acid synthase (FASN) protein after Coomassie Blue stain. Protein bands at approximately 250 kDa were cut for further analysis.Samples are shipped to a Mass Spectrometry Facility for in-gel digestion, desalting, lyophilization, and MS analysis to detect acetylation sites.
Acetylated site identification by mass spectrometry and data validation
Proteomics analysis to identify acetylated lysine residues is normally performed by the Mass Spectrometry Facility. Raw data can also be acquired and processed through proteomics data analysis platforms (e.g., MaxQuant) if further analysis is desired. The use of MaxQuant has been well summarized before (Tyanova et al., 2016).
MS-based analysis has identified eight acetylated lysine residues of FASN that are immunoprecipitated from L3 stage larvae, and the results are compared with previously identified acetylation sites of FASN, which can be acquired from open-access databases such as Protein Lysine Modification Database (PLMD) (Xu et al., 2017) and PhosphoSitePlus® PTM Resource (Hornbeck et al., 2014) (Table 1).
Table 1. List of the eight acetylated lysine residues of fly FASN identified by mass spectrometry
Ac-Lysine identified in this study Ac-Lysine at the same position identified previously Peptide sequence K193 None DRIGKLKDSDLENF K333 None GAGLILKPTMSLQF K407 None GITYPIGKMQNRLIR K813 K813 (Drosophila melanogaster, from a different fly study) NAEGVFAKVNSSGY K673 (Homo sapiens) RKEGVFAKVRTGGM K673 (Mus musculus) KQEGVFAKVRTGGL K673 (Rattus norvegicus) KQEGVFAKVRTGGL K926 K926 (Drosophila melanogaster, from a different fly study) ATNLSLVKGHENNV K786 (Homo sapiens) CTIIPLMKDHRDNL K786 (Mus musculus) CTIIPLMKDHKDNL K786 (Rattus norvegicus) CTIIPLMKDHKDNL K1535 None LISNVLKNGAWGT K1800 K1771 (Homo sapiens) GRFLEIGKDLSQNH K1764 (Mus musculus) GRFLEIGKDLSNNH K1765 (Rattus norvegicus) GRFLEIGKDLSNNH K2466 K2426 (Homo sapiens) AARSFYYKRAAEQY K2419 (Mus musculus) AAVSFYHKRAADQY Acetylation of the lysine residue K813 is further validated using an Ac-K813 specific antibody.
To verify the acetylation of K813 residue identified from MS, we first generated a rabbit polyclonal antibody against synthetic peptides with acetylated K813 (Yenzym antibodies, CA, USA). The peptide sequence is NAEGVFA-acK-AVNSSG. which covers amino acids 806–819 of the MAT domain of the fly FASN protein.
We then expressed recombinant KS-MAT didomain of FASN protein using E. coli BL21 (DE3) expression system for the use of acetylation validation experiment.
To validate the acetylation of K813 of the KS-MAT recombinant protein, we incubated recombinant proteins with different amounts of acetyl-CoA for 1 h and checked the acetylation of K813 by western blot analysis and Ac-K813 antibody. Interestingly, K813 was rapidly acetylated by acetyl-CoA in a dosage-dependent manner (Figure 2).
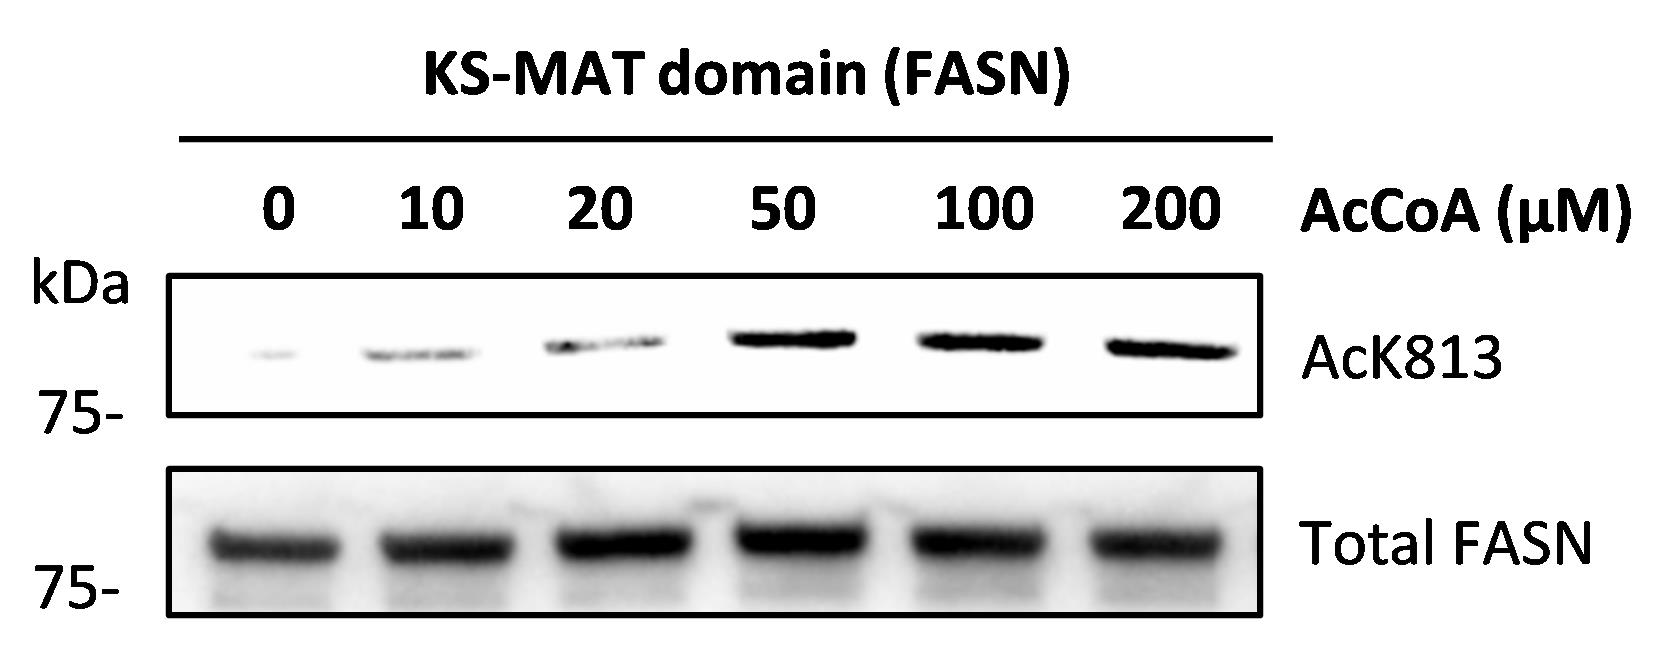
Figure 2. Acetylation of K813 residue of the recombinant fatty acid synthase (FASN) protein (KS-MAT domain) was detected after Acetyl-CoA (AcCoA) treatment. Acetyl-K813 antibody was used in the western blotting analyses.
Part II: FASN activity assay
Protein extraction
Collect 20–30 mg of L3 larvae of ywR flies in a microcentrifuge tube. Samples can be flash-frozen in liquid nitrogen and stored at -80 °C.
Add 300 μL of lysis buffer 2 to each tube. Homogenize larvae with a pestle gun on ice until larvae are shattered.
Sonicate for 10 s at 10–20 amplitude.
Centrifuge at 3,500× g for 10 min at 4 °C.
Transfer lysate to a new tube and centrifuge again at 21,000× g for 20 min at 4 °C. Repeat twice.
Pipette 5 μL of lysate to a new tube. Dilute ten times with lysis buffer 2. The protein concentration of each sample (mg/mL) is determined by Pierce Coomassie Bradford assay according to the manufacturer’s protocol.
Pause step: Proteins can be temporarily stored at -80 °C.
FASN activity assay
To generate NADPH standard curve, measure the absorbance of different dilutions of NADPH: dilute 24 mM NADPH stock solution with distilled water to prepare 12, 6, 3, 1.5, and 0.75 mM standard solutions. Add 200 μL of distilled water to the wells of a 96-well plate and 2 μL of different dilutions of NADPH to generate 0.24, 0.12, 0.06, 0.03, 0.015, and 0.0075 mM/well standards. Read at A340nm on a plate reader.
On the same 96-well plate, add 20 μL of fly protein extracts and 200 μL of freshly made FASN reaction buffer.
Read plates at A340nm at 37 °C for 3 min (1 min intervals) to measure background NADPH oxidation.
Add 2 μL of 5.8 mM Malonyl-CoA (final concentration: 58 μM) to each well.
Read at A340nm at 37 °C for 15 min (1 min interval) to determine FASN-dependent oxidation of NADPH.
Calculation
Use the values obtained from the appropriate NADPH standards to plot a standard curve.
The rates of A340nm change are corrected for the background rate of NADPH oxidation. FASN activity is normalized against protein amount and calculated in nmol NADPH oxidized min-1 mg protein-1.
Calculate the average reduction of OD readings within 15 min: Rate 1 = (OD_0 min - OD_15 min)/15. Calculate the rate of OD change of background readings within 3 min: Rate 2 = (OD_0 min - OD_3 min)/3. Correct the rate of A340nm change: Rate = Rate 1 - Rate 2.
Convert the corrected OD reduction rate (Rate) to change of NADPH concentration (mM) per minute according to the standard curve (C). Calculate the reduction of NADPH amount per min in 200 μL reaction: C × 200 (nmol/min).
Calculate the amount of protein added to each well (mg): Protein concentration (mg/mL) × 0.02 mL.
Normalize reduction of NADPH against protein amount (nmol/min/mg of protein).
In Figure 3, we show that FASN activity decreases in the fly larvae with a specific acetylation-deficiency mutant (FASNK813R) where the lysine residue at 813 position was mutated to arginine.
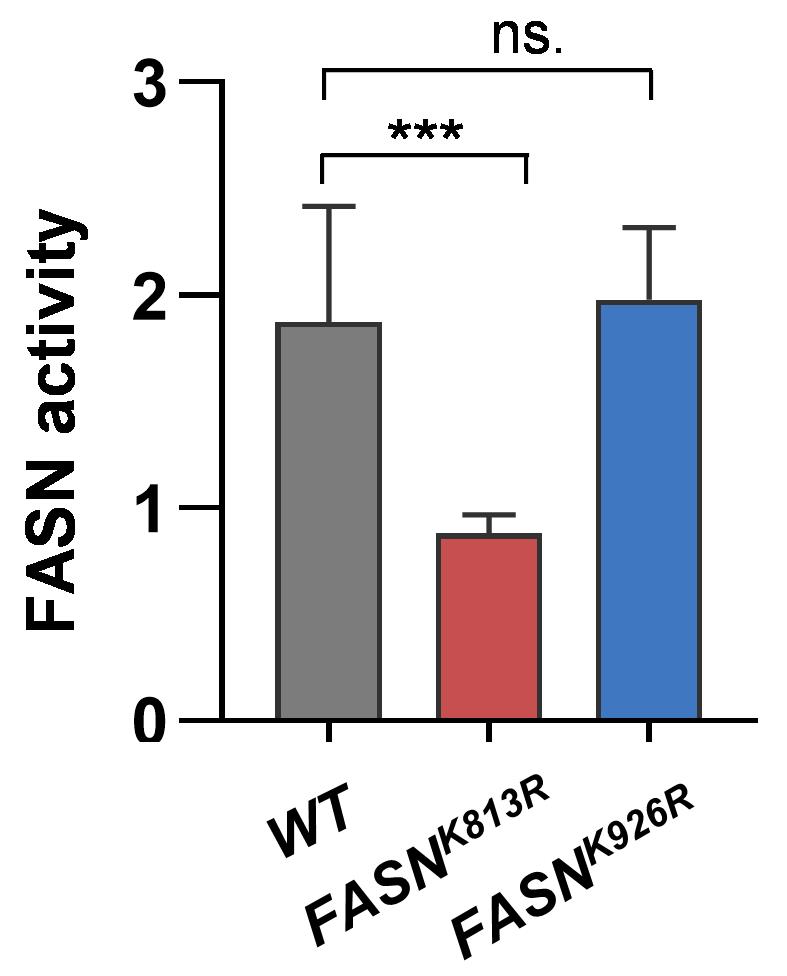
Figure 3. Fatty acid synthase (FASN) enzymatic activity of wild-type fly larvae (WT) and two FASN acetylation-deficiency mutants (FASNK813R, FASNK926R). FASN activity was determined by oxidated NADPH per minute per milligram of protein. Fold-change of FASN activity is presented. Data are presented as mean ± SD. One-way ANOVA; ***p-value < 0.001; ns. not significant.
Acknowledgments
We thank Ross Tomaino from Harvard Medical School Taplin Mass Spectrometry Facility for mass spectrometry analysis. We thank Dr. Justin Walley for advising on sample preparation for identification of acetylation sites. Graphical Overview was created with BioRender.com. This work was supported by NSF CAREER 2046984 and NIH R01AG058741 to H.B.
Competing interests
The authors declare no conflicts of interest.
References
- Boffa, L., Vidali, G., Mann, R. and Allfrey, V. (1978). Suppression of histone deacetylation in vivo and in vitro by sodium butyrate. J. Biol. Chem. 253(10): 3364–3366.
- Choudhary, C., Kumar, C., Gnad, F., Nielsen, M. L., Rehman, M., Walther, T. C., Olsen, J. V. and Mann, M. (2009). Lysine Acetylation Targets Protein Complexes and Co-Regulates Major Cellular Functions. Science 325(5942): 834–840.
- Cox, B. G. and Hammes, G. G. (1983). Steady-state kinetic study of fatty acid synthase from chicken liver. Proc. Natl. Acad. Sci. U.S.A. 80(14): 4233–4237.
- Dils, R. and Carey, E. M. (1975). [9] Fatty acid synthase from rabbit mammary gland. Meth. Enzymol. 35: 74–83.
- Hornbeck, P. V., Zhang, B., Murray, B., Kornhauser, J. M., Latham, V. and Skrzypek, E. (2014). PhosphoSitePlus, 2014: mutations, PTMs and recalibrations. Nucleic Acids Res. 43: D512–D520.
- Inuzuka, H., Gao, D., Finley, L. W., Yang, W., Wan, L., Fukushima, H., Chin, Y. R., Zhai, B., Shaik, S., Lau, A. W., et al. (2012). Acetylation-Dependent Regulation of Skp2 Function. Cell 150(1): 179–193.
- Jensen, P., Patel, B., Smith, S., Sabnis, R. and Kaboord, B. (2021). Improved Immunoprecipitation to Mass Spectrometry Method for the Enrichment of Low-Abundant Protein Targets. Methods Mol. Biol.: 229–246.
- Lin, R., Tao, R., Gao, X., Li, T., Zhou, X., Guan, K. L., Xiong, Y. and Lei, Q. Y. (2013). Acetylation Stabilizes ATP-Citrate Lyase to Promote Lipid Biosynthesis and Tumor Growth. Mol. Cell 51(4): 506–518.
- Menendez, J., Mehmi, I., Atlas, E., Colomer, R. and Lupu, R. (2004). Novel signaling molecules implicated in tumor-associated fatty acid synthase-dependent breast cancer cell proliferation and survival: Role of exogenous dietary fatty acids, p53-p21WAF1/CIP1, ERK1/2 MAPK, p27KIP1, BRCA1, and NF-κB. Int. J. Oncol. 24(3): 591–608.
- Miao, T., Kim, J., Kang, P., Fujiwara, H., Hsu, F. F. and Bai, H. (2022). Acetyl-CoA-mediated autoacetylation of fatty acid synthase as a metabolic switch of de novo lipogenesis in Drosophila. Proc. Natl. Acad. Sci. U.S.A. 119(49): e2212220119.
- Sato, S., Solanas, G., Peixoto, F. O., Bee, L., Symeonidi, A., Schmidt, M. S., Brenner, C., Masri, S., Benitah, S. A., Sassone-Corsi, P., et al. (2017). Circadian Reprogramming in the Liver Identifies Metabolic Pathways of Aging. Cell 170(4): 664–677.e11.
- Sealy, L. (1978). The effect of sodium butyrate on histone modification. Cell 14(1): 115–121.
- Song, Z., Xiaoli, A. and Yang, F. (2018). Regulation and Metabolic Significance of De Novo Lipogenesis in Adipose Tissues. Nutrients 10(10): 1383.
- Tyanova, S., Temu, T. and Cox, J. (2016). The MaxQuant computational platform for mass spectrometry-based shotgun proteomics. Nat. Protoc. 11(12): 2301–2319.
- Vettese-Dadey, M., Grant, P. A., Hebbes, T. R., Crane- Robinson, C., Allis, C. D. and Workman, J. L. (1996). Acetylation of histone H4 plays a primary role in enhancing transcription factor binding to nucleosomal DNA in vitro. EMBO J. 15(10): 2508–2518.
- Wang, Q., Zhang, Y., Yang, C., Xiong, H., Lin, Y., Yao, J., Li, H., Xie, L., Zhao, W., Yao, Y., et al. (2010). Acetylation of Metabolic Enzymes Coordinates Carbon Source Utilization and Metabolic Flux. Science 327(5968): 1004–1007.
- Xu, H., Zhou, J., Lin, S., Deng, W., Zhang, Y. and Xue, Y. (2017). PLMD: An updated data resource of protein lysine modifications. J. Genet. Genomics 44(5): 243–250.
- Yeo, D., Kang, C. and Ji, L. L. (2020). Aging alters acetylation status in skeletal and cardiac muscles. GeroScience 42(3): 963–976.
- Zhang, L., Wang, W., Zhang, S., Wang, Y., Guo, W., Liu, Y., Wang, Y. and Zhang, Y. (2020). Identification of lysine acetylome in cervical cancer by label-free quantitative proteomics. Cancer Cell Int. 20: 182.
- Zhao, S., Xu, W., Jiang, W., Yu, W., Lin, Y., Zhang, T., Yao, J., Zhou, L., Zeng, Y., Li, H., et al. (2010). Regulation of Cellular Metabolism by Protein Lysine Acetylation. Science 327(5968): 1000–1004.
Article Information
Copyright
© 2023 The Author(s); This is an open access article under the CC BY-NC license (https://creativecommons.org/licenses/by-nc/4.0/).
How to cite
Miao, T. and Bai, H. (2023). Identification of Acetylation Sites of Fatty Acid Synthase (FASN) by Mass Spectrometry and FASN Activity Assay. Bio-protocol 13(21): e4873. DOI: 10.21769/BioProtoc.4873.
Category
Cell Biology > Cell metabolism > Amino acid
Do you have any questions about this protocol?
Post your question to gather feedback from the community. We will also invite the authors of this article to respond.