- Protocols

- Articles and Issues
- For Authors
- About
- Become a Reviewer

Double Staining with Fluorescent Tracers to Determine Myeloid Cell Migration of Leishmania-infected Cells from Mouse Skin to Lymphatic Tissues by Flow Cytometry
Published: Vol 13, Iss 18, Sep 20, 2023 DOI: 10.21769/BioProtoc.4817 Views: 2383
Reviewed by: Alexandros AlexandratosMaria AgallouAnonymous reviewer(s)
Original research article
The authors used this protocol in:

Jan 2023
Advertisement


Protocol Collections
Comprehensive collections of detailed, peer-reviewed protocols focusing on specific topics


Related protocols

Abstract
Immune cell trafficking in steady-state conditions and inflammatory cell recruitment into injured tissues is crucial for the surveillance of the immune system and the maintenance of body homeostasis. Tracking the cell journey from the infection site in the skin to lymphoid tissues has been challenging, and is typically determined using fluorescent cell tracers, antibodies, or photoconvertible models. Here, we describe the detailed method to track Leishmania-infected myeloid cells migrating from the skin to lymphatic tissues by multiparametric flow cytometry. These methods involve labeling of infective Leishmania donovani parasites with fluorescent cell tracers and phenotyping of myeloid cells with fluorescent antibodies, to determine the infection status of migratory myeloid cells. We also describe the detailed protocol to trace donor monocytes transferred intradermally into recipient mice in Leishmania donovani infection. These protocols can be adapted to study skin-lymphoid tissue migration of dendritic cells, inflammatory monocytes, neutrophils, and other phagocytic myeloid cells in response to vaccine antigens and infection.
Key features
• Cell-tracking of cell-trace-labeled parasites and monocytes from the skin to lymphatic tissues after transference into donor mice.
• Identification of migratory cells labeled with fluorescent cell tracers and antibodies by flow cytometry.
• Isolation, labeling, and transference of bone marrow monocytes from donor mice into the skin of recipient mice.
• Description of a double-staining technique with fluorescent cell tracers to determine cell and parasite dissemination from the skin to lymphoid tissues.
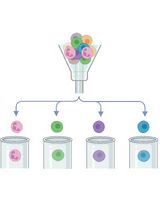
Graphical overview
Overview of the methods to trace the migration of Leishmania and monocytes from the skin to lymphatic tissues by flow cytometry. Infective metacyclic promastigotes (from axenic culture) and monocytes (isolated from the bone marrow of donor mice) are labeled with fluorescent cell tracers. After intradermal injection into the test mouse (1, 2), migratory cells and infected cells are isolated from the skin and lymphoid tissues of the test mouse. These cells are then labeled with fluorescent antibodies against myeloid cells and recognized according to the differential excitation/emission wavelengths of the fluorochromes by flow cytometry.
Background
The migration of immune cells is a fundamental function of the immune system in health and disease. Immune cell movement through the lymphatic network plays a crucial role in immune surveillance, the initiation of the immune response, and the development of tolerance. Innate immune cells, such as neutrophils, macrophages, and dendritic cells capture antigens and capture and kill pathogens, activating the adaptative immune response at the draining lymph node (Hampton and Chtanova, 2019). However, intracellular parasites have also developed strategies to circumvent the immune response, survive, and disseminate through the lymphatics to other tissues (Hampton and Chtanova, 2019).
Cell migration can be studied by diverse approaches with different drawbacks. Time-lapse microscopy tracks short fragments of the individual cell migration and generates large amounts of digital data, making the analysis complicated, even with access to software tools for automated cell tracking (Al-Zaben et al., 2019). Intravital microscopy (IVM) is useful for the visualization of cell trafficking, proliferation, and cell death at single-cell resolution level (Maiorino et al., 2022). However, IVM is an invasive method that can generate local inflammation and tissue damage (Maiorino et al., 2022). Most IVM techniques are based on fluorescence microscopy, but in the last two decades, different biological processes have been explored using IVM together with two/three-photon microscopy to avoid dye use. However, the long duration of image acquisition can cause photodamage and an inadequate spatial co-registration between sequentially detected signals (You et al., 2018). Currently, photoconvertible transgenic mice are being used for cell migration studies; however, the establishment of photoactivation conditions is tedious, requiring the coupling of the photoactivation technique and instrumentation for signal detection. The most popular photoactivation/conversion model, Kaede mice, helps to understand cell migration at single-cell level or by invasive intracranial imaging. However, this technique is not suitable for models involving photoactivation of cells in the skin or for studies requiring deep tissue photoactivation (Tomura et al., 2021). Similarly, in our hands, the photoactivable model R26-PAGFP-LysMcre [B6.Cg-Gt(ROSA)26Sortm1(CAG-PA-GFP)Rmpl/J mice mated with B6.129P2-Lyz2tm1(cre)Ifo/J] was not suitable for identifying migratory cells photoactivated in the skin (Figure S1, Video S1 and Table S1). Therefore, fluorescent cell tracers are the most inexpensive, straightforward technique to study cell migration from skin to lymphatic organs.
Fluorescent cell trackers are powerful tools that enable the direct visualization of biological processes, such as cell proliferation, cell migration, and cell–cell interactions (Halabi et al., 2020). Thus, it is possible to stain cells or pathogens with fluorescent tracers to follow their migration through the lymphoid tissues of the host. The use of cell trackers coupled with flow cytometry makes it possible to identify the infected cells and determine the cell populations carrying parasites from the skin (Ibrahim et al., 2013). The higher specificity, sensitivity, and robustness of this method are reached by the combination with flow cytometry. The protocol described here was applied to the study of infection status and migration of innate immune cells (monocytes, dendritic cells, and neutrophils) to lymph node and spleen of after-skin-infection with Leishmania spp. (Osorio et al., 2023).
Materials and reagents
Biological materials
Balb/c mice (4–7 weeks old) (Envigo, Inotiv)
Wildtype or mCherry Leishmania donovani metacyclic promastigotes (IS strain; MHOM/SD/00/S-2D) (Osorio et al., 2023)
Reagents
RPMI 1640 medium (Thermo Fisher Science, GibcoTM, catalog number: 11875093)
M199 medium (Thermo Fisher Science, GibcoTM, catalog number: 11150067)
Penicillin-streptomycin solution (Thermo Scientific, GibcoTM, catalog number: 15140163)
Fetal bovine serum (FBS), inactivated by heating at 56 °C for 20 min (Thermo Scientific, GibcoTM, catalog number: 16000044)
0.4% Trypan Blue solution (Sigma-Aldrich, catalog number: T8154)
Adenine (Sigma-Aldrich catalog number: A8626)
Hemin (Millipore, Sigma, catalog number: H9039)
HEPES buffer solution 1 M (Millipore, Sigma, catalog number: 83264)
Sodium chloride (NaCl) (Millipore, Sigma, catalog number: S9888)
Potassium chloride (KCl) (Millipore, Sigma, catalog number: P3911)
Magnesium chloride hexahydrate (MgCl2·6H2O) suitable for cell culture (Millipore, Sigma, catalog number: M2393)
Calcium chloride (CaCl2) suitable for cell culture (Millipore, Sigma, catalog number: C7902)
Collagenase D (Millipore, Sigma, Roche, catalog number: 11088858001)
DNase I (Millipore, Sigma, Roche, catalog number: 10104159001)
LiberaseTM TL (Millipore, Sigma, Roche, catalog number: 5401020001)
Accutase cell detachment solution (STEMCELL Technologies, catalog number: 07920)
Bovine serum albumin (BSA) (Sigma-Aldrich, catalog number: A7030)
10× phosphate-buffered saline (PBS) (Corning®, catalog number: 46-013-CM)
Dimethyl sulfoxide (DMSO) (hybridoma grade) (Sigma-Aldrich, catalog number: D2650)
MojoSortTM mouse Ly-6G Selection kit (BioLegend, catalog number: 480123)
MojoSortTM buffer (5×) (BioLegend, catalog number: 480017)
MojoSortTM magnet (BioLegend, catalog number: 480020)
Anti-CD11b magnetic particles DM Clone M1/70 (RUO) (BD IMagTM, catalog number: 558013)
Lectin from Arachis hypogaea (peanut) PNA agglutinin (Sigma-Aldrich, catalog number: L-08881)
Dibutyl phthalate (Sigma-Aldrich, catalog number: 524980)
1-step Fix/Lyse solution (10×) (eBioscienceTM, catalog number: 00533354)
BD IMagTM buffer (10×) (BD, catalog number: 552362)
RBC lysis buffer (10×) (BioLegend, catalog number: 420301)
TruStain FcXTM (anti-mouse CD16/32) antibody (BioLegend, catalog number: 101320)
Fixable Viability Dye eFluor 455UV (eBioscienceTM, catalog number: 65-0868)
Antibodies for flow cytometry (see Table 1)
Cell tracer dyes (see Table 2)
Table 1. Antibodies and probes for ex vivo staining of myeloid cells by flow cytometry
Antibody name (Concentration of stock) Ex/Em (nm) Working concentration
μg/tube (μL)
Clone Brand and catalog number Anti-mouse CD3- FITC (0.5 mg/mL) 495/519 1.0 (0.25) 17A2 BioLegend, 100204 Anti-mouse CD19-FITC (0.5 mg/mL) 495/519 0.125 (0.25) 1D3/CD19 BioLegend, 152404 Anti-mouse NK-1.1-FITC (0.5 mg/mL) 495/519 0.25 (0.25) PK136 BioLegend, 108706 Anti-mouse CD45-PE-Cy7 (0.2 mg/mL) 488, 532, 561/767 0.125 (0.5) 30-F11 BioLegend, 103114 Anti-mouse/human CD11b-eFluor 506
(0.2 mg/mL)
419/508 0.125 (0.5) M1/70 eBioscience, 69-0112-82 Anti-mouse Ly6C-BV 785 (0.2 mg/mL) 405/785 0.25 (0.5) HK1.4 BioLegend, 128041 Anti-mouse Ly6G–APC-Cy7 (0.2 mg/mL) 650, 755/767 0.25 (0.5) 1A8 BioLegend, 127624 Anti-mouse CD11c-BV 605 (0.2 mg/mL) 405/605 0.25 (1) N418 BioLegend, 117334 Viability (Fixable Viability Dye-eFluor 455) (100 test) 355/450 0.1 (0.01) NA eBioscience, 65-0868 Note: Antibody titration is recommended for optimal performance. Avoid direct exposure of labeled samples to light. Acquire samples in a flow cytometer as soon as possible to one week at 4 °C (better within 24 h). Use FMOs, unstained control (no-cell trace control tissues) for gating. For myeloid cell phenotyping, use fluorochromes compatible with your flow cytometer. Use FluoroFinder or other software for panel design (to avoid spectral overlap of fluorescence based on the configuration of your flow cytometer).
Table 2. Cell tracer dyes used in the study; the listed dyes can be used to track cells or parasites*
Cell tracer name
(Concentration of stock)
Storage Excitation/Emission (nm) Final concentration Brand and catalog number CellTrackerTM Orange CMTMR (10 mM) -20 °C 541/565 nm 2.5 μM Invitrogen C2927 CellTrackerTM Green CMFDA (10 mM) -20 °C 492/517 nm 5 μM Invitrogen C2925 CellTraceTM Far-Red (1 mM) -20 °C 630/661 nm 1 μM Invitrogen C34572 PKH26 Red Fluorescent Cell Linker 4 °C 551/567 nm 4 μM Sigma-Aldrich MINI26-1KT PKH 67 Green Fluorescent Cell Linker 4 °C 490/502 nm 4 μM Sigma-Aldrich MINI67-1KT *mCherry (5871/610 nm)
Solutions
1× phosphate-buffered saline (1× PBS) (see Recipes)
1× PBS with 0.1% BSA: FACS buffer (see Recipes)
1× PBS + 2% FBS (see Recipes)
1× 1-Step Fix/Lyse solution (see Recipes)
1× RBC lysis buffer (see Recipes)
1× BD IMagTM buffer (see Recipes)
Complete M199 medium (see Recipes)
Complete RPMI 1640 medium (see Recipes)
Collagenase D + Liberase TL Mix (see Recipes)
Collagenase D solution + DNase I (see Recipes)
Recipes
1× phosphate-buffered saline (1× PBS) from 10× PBS (4 °C storage)
Reagent Final concentration Quantity 10× PBS 1× 100 mL Distilled H2O n/a 900 mL Total n/a 1,000 mL 1× PBS with 0.1% BSA. FACS buffer (4 °C storage)
Reagent Final concentration Quantity 1× PBS 1× 1,000 mL BSA 0.1% 1 g Total n/a 1,000 mL 1× PBS + 2% FBS (4 °C storage)
Reagent Final concentration Quantity 1× PBS 1× 980 mL 100% FBS 2% 20 mL Total n/a 1,000 mL 1× 1-Step Fix/Lyse solution (4 °C storage)
Reagent Final concentration Quantity 10× 1-step Fix/Lyse 1× 100 mL Distilled H2O n/a 900 mL Total n/a 1,000 mL 1× RBC lysis buffer (4 °C storage)
Reagent Final concentration Quantity 10× RBC lysis buffer 1× 10 mL Distilled H2O n/a 90 mL Total n/a 100 mL 1× BD IMagTM buffer (4 °C storage)
Reagent Final concentration Quantity 10× BD IMagTM buffer 1× 10 mL Distilled H2O n/a 90 mL Total n/a 100 mL Complete M199 medium (4 °C storage)
Reagent Final concentration Quantity M199 medium n/a 500 mL FBS 10% 50 mL Adenine 1% 6 mL Hemin 0.1% 1.2 mL Penicillin-streptomycin solution 1× 6 mL Total n/a 563.2 mL Complete RPMI 1640 medium (4 °C storage)
Reagent Final concentration Quantity RPMI medium n/a 445 mL FBS 10% 50 mL Penicillin-streptomycin solution 1× 5 mL Total n/a 500 mL Collagenase D + Liberase TL Mix (storage at -20 °C)
Reagent Final concentration Quantity 20 mg/mL Collagenase D 2 mg/mL 2 mL 1 mg/mL Liberase TL 160 μg/mL 640 μL RPMI complete medium n/a 17.36 mL Total n/a 20 mL Collagenase D Solution + DNase I (storage at -20 °C)
Reagent Final concentration Quantity 20 mg/mL Collagenase D 2 mg/mL 5 mL 2 mg/mL DNase I 20 μg/mL 500 μL 1 M HEPES pH 7.4 10 mM 500 μL 5 M NaCl 150 mM 1.5 mL 1 M KCl 5 mM 250 μL 0.5 M MgCl2 1 mM 100 μL 0.5 M CaCl2 1.8 mM 180 μL Distilled H2O n/a 42.5 mL Total n/a 50 mL
Laboratory supplies
Ultra-fine insulin syringe with needle (BD, catalog number: 324920)
Sterile 5 mL Polystyrene round bottom tube (Falcon, catalog number: 352054)
Sterile 70 μm cell strainer (any vendor)
Sterile 15 mL polypropylene centrifuge tubes (any vendor)
Sterile 50 mL polypropylene centrifuge tubes (any vendor)
Sterile nuclease-free filter tips (10, 200, and 1,000 μL) (any vendor)
Cell culture plates, different sizes, 6-, 12-, and 24-wells flat bottom, TC treated, sterile (any vendor)
Vented flask surface area 25 cm2 and 175 cm2 (any vendor)
Micro-dissecting scissors (Millipore, Sigma, catalog number: S3271)
Scissor-handle forceps (Millipore, Sigma, catalog number: Z168831)
Disposable plastic serological pipettes, sterile, individually wrapped, 10 mL, 25 mL capacity (any vendor)
Equipment
Flow cytometer with at least two lasers and seven parameter analysis capacity (BD LSRFortessa IITM Cell Analyzer, BD Biosciences; SE500, Stratedigm)
Eclipse TE300 Microscope (Nikon)
Software and datasets
Panel Builder, Fluorofinder (3, 2014, free)
FlowJo V10.6 software (V10.6, 2019, license required)
BD FACSDiva 9.0 (flow cytometer software)
GraphPad Prism 9.0 software (9, 2020, license required)
Procedure
Labeling of Leishmania donovani and bone marrow cells
Selection of L. donovani metacyclic promastigotes with PNA agglutinin (adapted from Sacks and Melby, 2015). This selection is adequate for L. donovani expressing mCherry fluorescent protein (Figure 1).
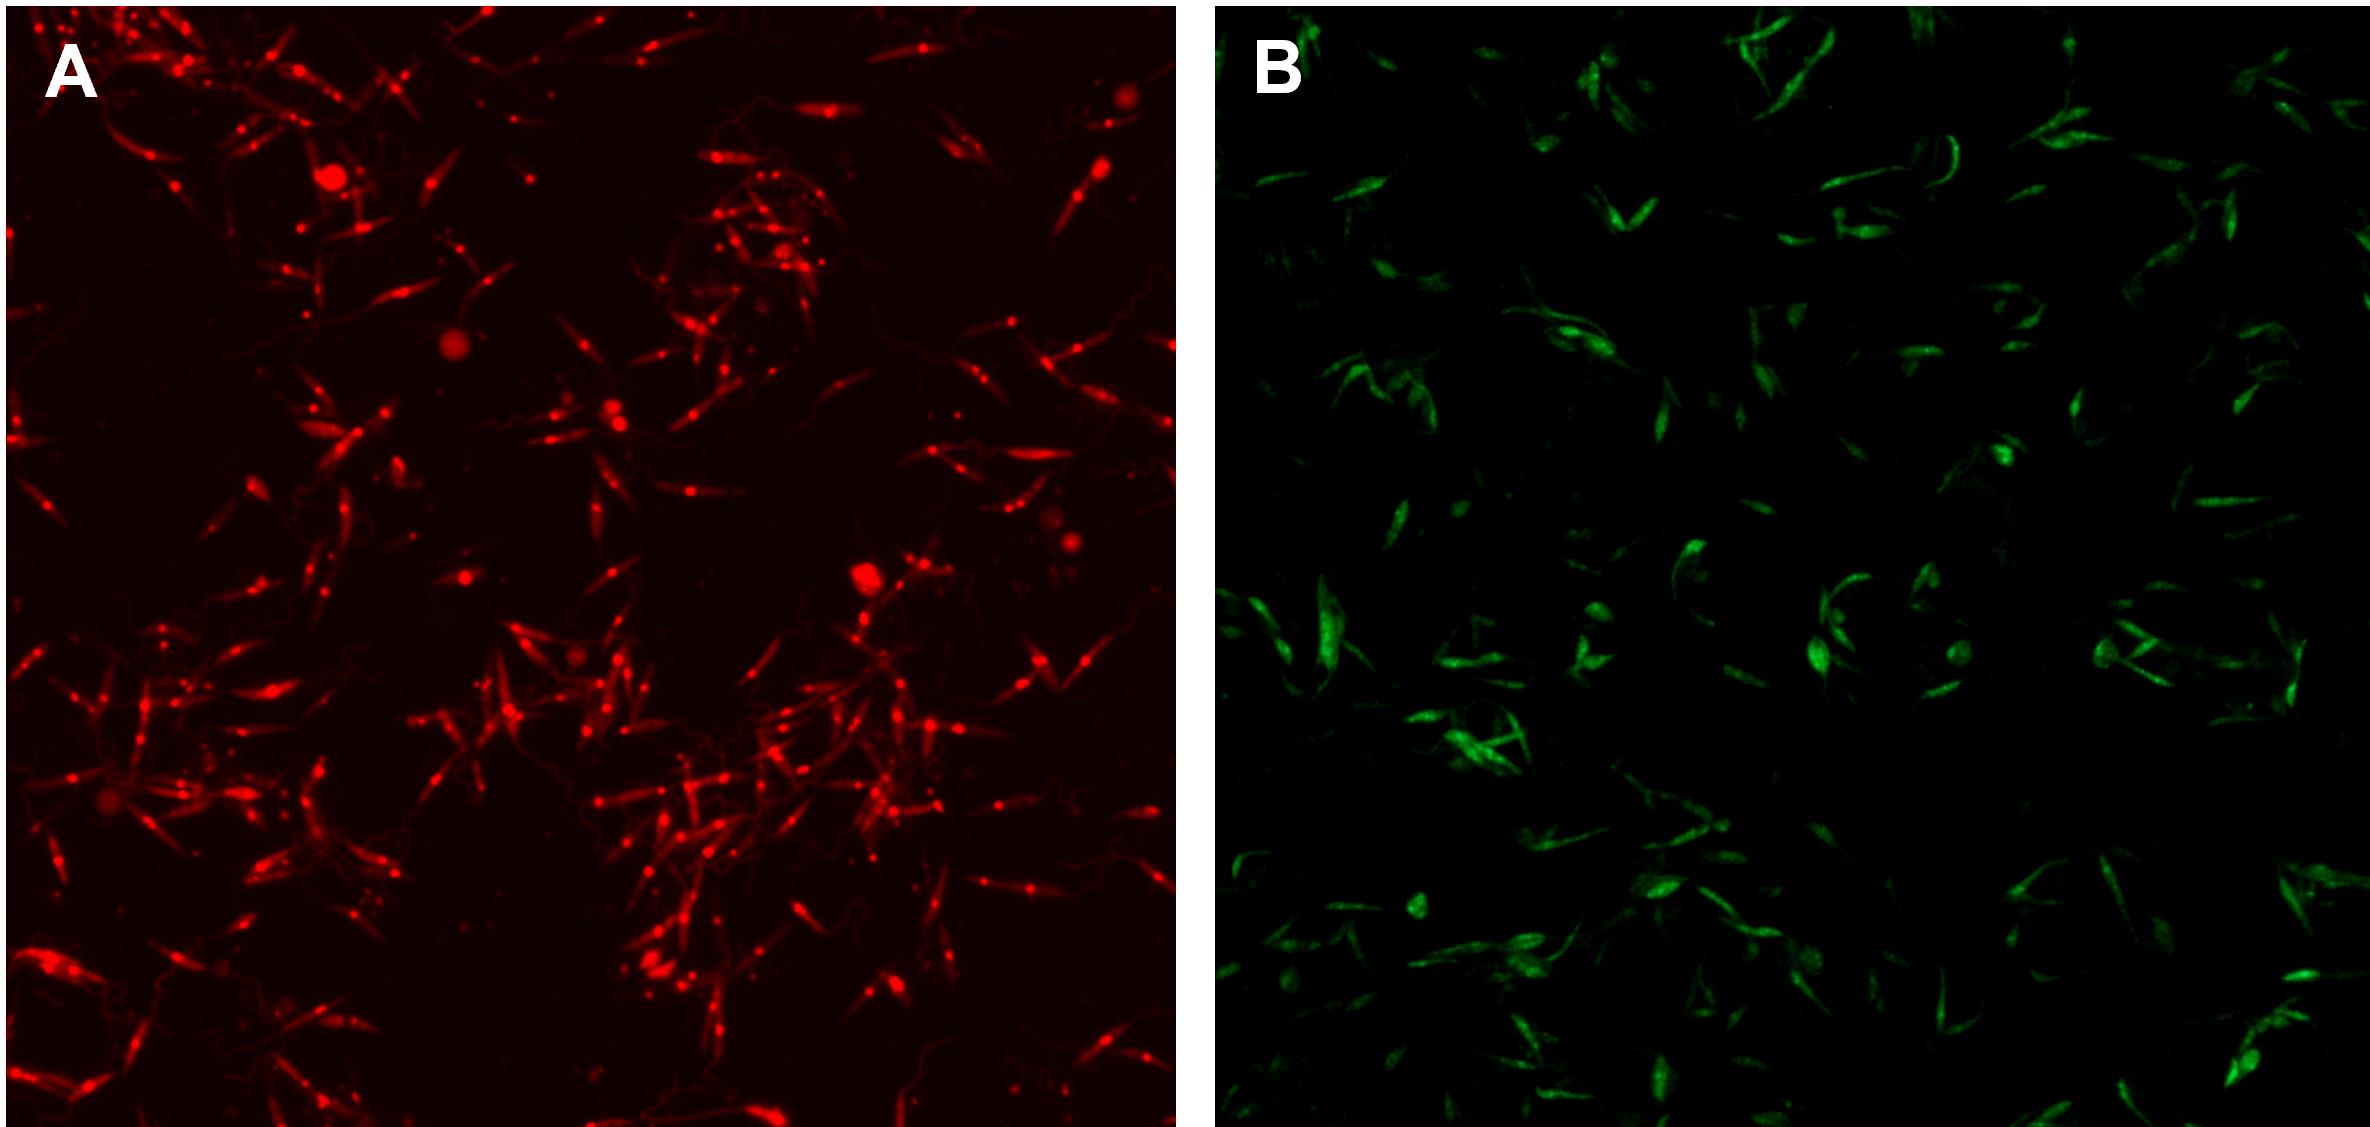
Figure 1. Representative fluorescent signal of Leishmania donovani infective promastigotes. A. L. donovani expressing mCherry fluorescent protein (red). B. L. donovani stained with PKH67 (green) (step A2). Parasites were selected as mentioned in step A1. Images were taken with a Nikon Eclipse TE300 Microscope at 20×.Grow L. donovani (MHOM/SD/00/S-2D): add approximately 40 mL of parasites in logarithmic phase of culture (3–4 days) at 1 × 10⁶ cells/mL to 400 mL of complete M199 medium. Incubate for 5–6 days (until stationary phase) at 27 °C.
Harvest the parasite by centrifugation in sterile 50 mL tubes at 700× g for 10 min.
Note: All the centrifugation steps are performed at room temperature (RT), unless the text indicates otherwise.
Discard supernatant. Caution! Be careful to not disturb the pellet.
Resuspend the pellet in 10 mL of RPMI medium and take 10 μL to count parasites. Use dilution if the number of parasites is too high and difficult to count in a Neubauer camera.
Centrifuge at 700× g for 10 min.
Discard the supernatant and resuspend in 1× PBS to a final concentration of 1 × 10⁸ parasites/mL.
Add 50 μg/mL of PNA or 10 μL/mL.
Vortex for 30 s and incubate at RT for 30 min without agitation.
Centrifuge at 200× g for 2 min (low speed).
Take the supernatant in a fresh tube. The supernatant contains metacyclic promastigotes.
Wash parasites with 10 mL of RPMI medium. Proceed with counting viable parasites. Parasite viability is assessed by the motility of parasites.
To count viable parasites, take 10 μL of parasites from step A1k into a Neubauer chamber covered with a cover slide and count motile parasites. Parasites with any movement of the body or flagellum are counted. Then, calculate the number of parasites using the following equation:
Number of parasites per milliliter = Number of motile parasites per quadrant × dilution factor × 10,000.
Centrifuge at 700× g for 10 min.
Resuspend parasites at desired concentration (normally 1 × 10⁶ parasites/10 μL of PBS) for intradermic (ID) inoculation or 2 × 10⁷ parasites/mL. If the parasite is not fluorescent, proceed with staining with PKH26/67 (step A2).
Note: The parasite staining is not necessary when the L. donovani strain is expressing a fluorescent protein (mCherry). In this case, skip step A2. The mCherry L. donovani parasites are ready for intradermal infection (step A7). To perform intradermic inoculation, check Machholz et al. (2012).
Parasite staining with PKH26 (red) or PKH67 (green) for intradermal infection (modified from manufacturer’s protocol):
Place a suspension containing 2 × 10⁷ single parasites in a 15 mL polypropylene tube and wash once using medium without serum or 1× PBS.
Centrifuge the parasites at 400× g for 5 min into a loose pellet at RT.
After centrifuging, carefully aspirate the supernatant, being careful not to remove any cells but leaving no more than 25 μL of supernatant.
Prepare a 2× parasite suspension by adding 1 mL of Diluent C to the pellet and resuspend with gentle pipetting to ensure complete dispersion. Caution! Do not vortex and do not let cells stand in Diluent C for long periods of time.
Immediately prior to staining, prepare a 2× dye solution (4 μM) in Diluent C by adding 4 μL of the PKH26 to 1 mL of Diluent C in a polypropylene centrifuge tube and mix well to disperse.
Rapidly add the 1 mL of 2× parasite suspension to 1 mL of 2× dye solution and immediately mix the sample by pipetting. Final concentrations after mixing the indicated volumes will be 1 × 10⁷ cells/mL and 2 μM PKH26/67.
Incubate the parasite/dye suspension for 5 min with periodic mixing at 27 °C (or as best suitable for the cell you are using) in the dark. Because staining is so quick, longer times provide no advantage.
Stop the staining by adding an equal volume (2 mL) of serum or 10 mL of complete medium and incubate for 1 min to allow binding of excess dye.
Centrifuge the parasites at 400× g for 10 min at RT and carefully remove the supernatant. Resuspend cell pellet in 10 mL of complete medium, transfer to a fresh sterile conical polypropylene tube, centrifuge at 400× g for 5 min at RT, and wash the parasite pellet two more times with 10 mL of complete medium to ensure removal of unbound dye.
After the final wash, resuspend the parasite pellet in 10 mL of complete RPMI medium for assessment of cell recovery and cell viability. Optional: check fluorescence intensity in a fluorescence microscope (Figure 1). Proceed with counting viable parasites (step A1l).
Centrifuge and resuspend to a desired final concentration of viable parasites in a volume of 10 μL (1 × 10⁶/10 μL 1× PBS).
Note: The procedure above uses 2 mL as the final staining volume, containing final concentrations of 2 μM of PKH26/67 and 1 × 10⁷ cells/mL. Volume is adjusted to the concentration of parasites obtained.
Optional: L. donovani expressing mCherry fluorescent protein can be used (Figure 1A) instead of metacyclic promastigotes labeled with a fluorescent cell tracer. The selection of infective metacyclic promastigotes should be performed as mentioned before.
Isolation of bone marrow monocytes:
Euthanize the mice according to the approved IACUC protocol (exposure to carbon dioxide followed by cervical dislocation) and proceed with bone marrow collection. Place the mouse in a container with 70% alcohol for disinfection for 30 s. Work in a laminar flow hood.
Remove femurs and tibias from the mice using scissors and forceps. Place the tissues on the plate containing 1 mL of RPMI complete media. Keep the tissues on ice until all mice have been prepared.
Using sterile utensils, remove the muscles from the bones and place the clean bones in a Petri dish. (Estimate that one mouse femur yields approximately 1 million monocytes.)
Obtention of bone marrow cells: using sterile utensils, cut both ends of the bone with scissors as close to the joints as possible. Fill a 1 mL insulin syringe with ice-cold RPMI complete medium, insert the syringe needle into the end of the bone marrow cavity, and flush out the bone marrow into a 15 mL centrifuge tube on ice. Flush five times (5 mL) until the bones are completely white. Break up any cell clumps by pipetting up and down. Alternatively, place the bone in one sterile mortar and carefully break the bone with the pestle. Transfer the bone fragments to a sterile Petri dish containing 1 mL of Accutase solution. Incubate for 5 min at 37 °C. Add 1 mL of culture medium and flush the material out of the bones (by pipetting up and down until the cells detach from the bone). Repeat, if necessary, until the reddish bones turn white.
Obtain a single-cell suspension by filtering the solution through a 70 μm cell strainer, place it in a fresh 15 mL centrifuge tube, and centrifuge at 500× g for 5 min at RT. Discard the supernatant.
Resuspend the bone marrow cell pellet in 1–3 mL of 1× RBC lysis buffer and incubate for 5 min at RT.
Stop the lysis reaction by adding 10 mL of 1× PBS + 2% FBS. Centrifuge immediately at 500× g for 5 min at RT. Decant the supernatant and resuspend the cells in RPMI complete media (5 mL).
Proceeded with Neutrophil depletion using MojoSortTM Mouse Ly-6G Selection Kit (step A4).
Note: The cell purification kit varies in accordance with the lineage of cells to be traced.
Neutrophil depletion using MojoSortTM Mouse Ly-6G Selection kit (modified from manufacturer’s protocol). This step excludes neutrophils and enriches the sample for monocytes.
Centrifuge the bone marrow cells obtained above at 300× g for 5 min and resuspend in 4 mL of 1× MojoSort buffer. Count the cells with 0.4% trypan blue and adjust to 1 × 10⁸ cell/mL in 1× MojoSort buffer.
Take 100 μL of cell suspension (107 cells) into a new 5 mL polypropylene tube. Add 10 μL of the Biotin anti-mouse Ly-6G antibody (clone 1A8) per 100 μL of cell suspension (107 cells/100 μL). Mix well and incubate on ice for 15 min.
Resuspend the Streptavidin nanobeads by vortex at maximum speed for 10 s and add 10 μL of Streptavidin nanobeads to the cell suspension. Mix well and incubate on ice for 15 min.
After incubation time, add 2.5 mL of MojoSort buffer.
Place the tube in the magnet for 5 min.
Optional: take a small aliquot before placing the tube in the magnet to monitor purity and yield.
Transfer the unlabeled cell fraction still in suspension (not held by the magnet) by pouring the liquid into a fresh 5 mL tube. The unlabeled fraction is the cells of interest.
Resuspend the labeled cells in MojoSort buffer and repeat steps A4e–A4g on the labeled cells at least two more times.
Pool the unlabeled fractions.
Continue with monocytes positive selection with CD11b magnetic particles DM (step A5).
Note: When working with less than 107 cells, use the indicated volumes for 107 cells. To scale up, adjust the volumes of cells and beads proportionately. For example, add 100 μL of nanobeads to separate 1 × 10⁸ cells in 1 mL of MojoSort buffer. To maximize yield, you can disrupt the aggregates by pipetting the solution up and down. Filter the suspension using a 70 μm cell strainer.
Positive selection of monocytes with CD11b magnetic particles DM (modified from manufacturer’s protocol).
Centrifuge the unlabeled negative fraction from the previous procedure at 400× g for 5 min.
Resuspend the cell in 3 mL of 1× BD IMag buffer. Count the cells with 0.4% trypan blue and adjust to 1 × 10⁷ cell/mL in 1× BD IMag buffer.
Centrifuge at 400× g for 5 min and carefully aspirate all the supernatant.
Vortex to maximum speed the BD IMag anti-CD11b magnetic particles DM. Add 50 μL of particles for every 1 × 10⁷ total cells. Mix thoroughly. Refrigerate for 30 min at 4 °C.
Bring the BD IMag–particle labeling volume up to 1 × 10⁷–8 × 10⁷ cells/mL with 1× BD IMag buffer and immediately place the tube on the cell separation magnet. Incubate at RT for 8 min.
Keep the tube on the cell separation magnet and carefully aspirate off the supernatant with a Pasteur pipette. This supernatant contains the negative fraction. (This time, we want the CD11b positive fraction, which is attached to the magnet.)
Remove the tube from the cell separation magnet and add 1× BD IMag buffer to the same volume as in step A5e. Gently resuspend cells by pipetting briefly and return the tube to the cell separation magnet for another 4 min.
With the tube on the cell separation magnet, carefully aspirate off the supernatant and discard.
Repeat steps A5g and A5h one more time.
After the final wash, resuspend the positive fraction in 1× PBS and adjust the purified monocytes to 1 × 10⁶ cells/500 μL for staining with the cell tracer (step A6).
Monocyte staining using cell tracers:
Label the monocytes with any of the cell tracers in Recipe 9. However, make sure that the excitation/emission wavelength is different from the parasites. For this, dissolve the lyophilized CMTMR (orange) or CMFDA (green) CellTrackerTM in high-quality DMSO to get a 10 mM stock or dilute the Far-Red CellTraceTM to obtain a 1 mM stock with high-quality DMSO.
Dilute the stock solution to a 2× working concentration of 2.5 μM CMTMR (orange), 5 μM CMFDA (green), or 1 μM Far-Red CellTraceTM (Figure 2) in 500 μL of serum-free medium or 1× PBS. For this, add either 0.5 μL of CMTMR, 1 μL of CMFDA, or 2 μL of Far-Red to 500 μL of serum-free medium or 1× PBS. Vortex.
Note: Cell tracer dyes and PKH linkers are equally useful to trace lymphoid cells and parasites.
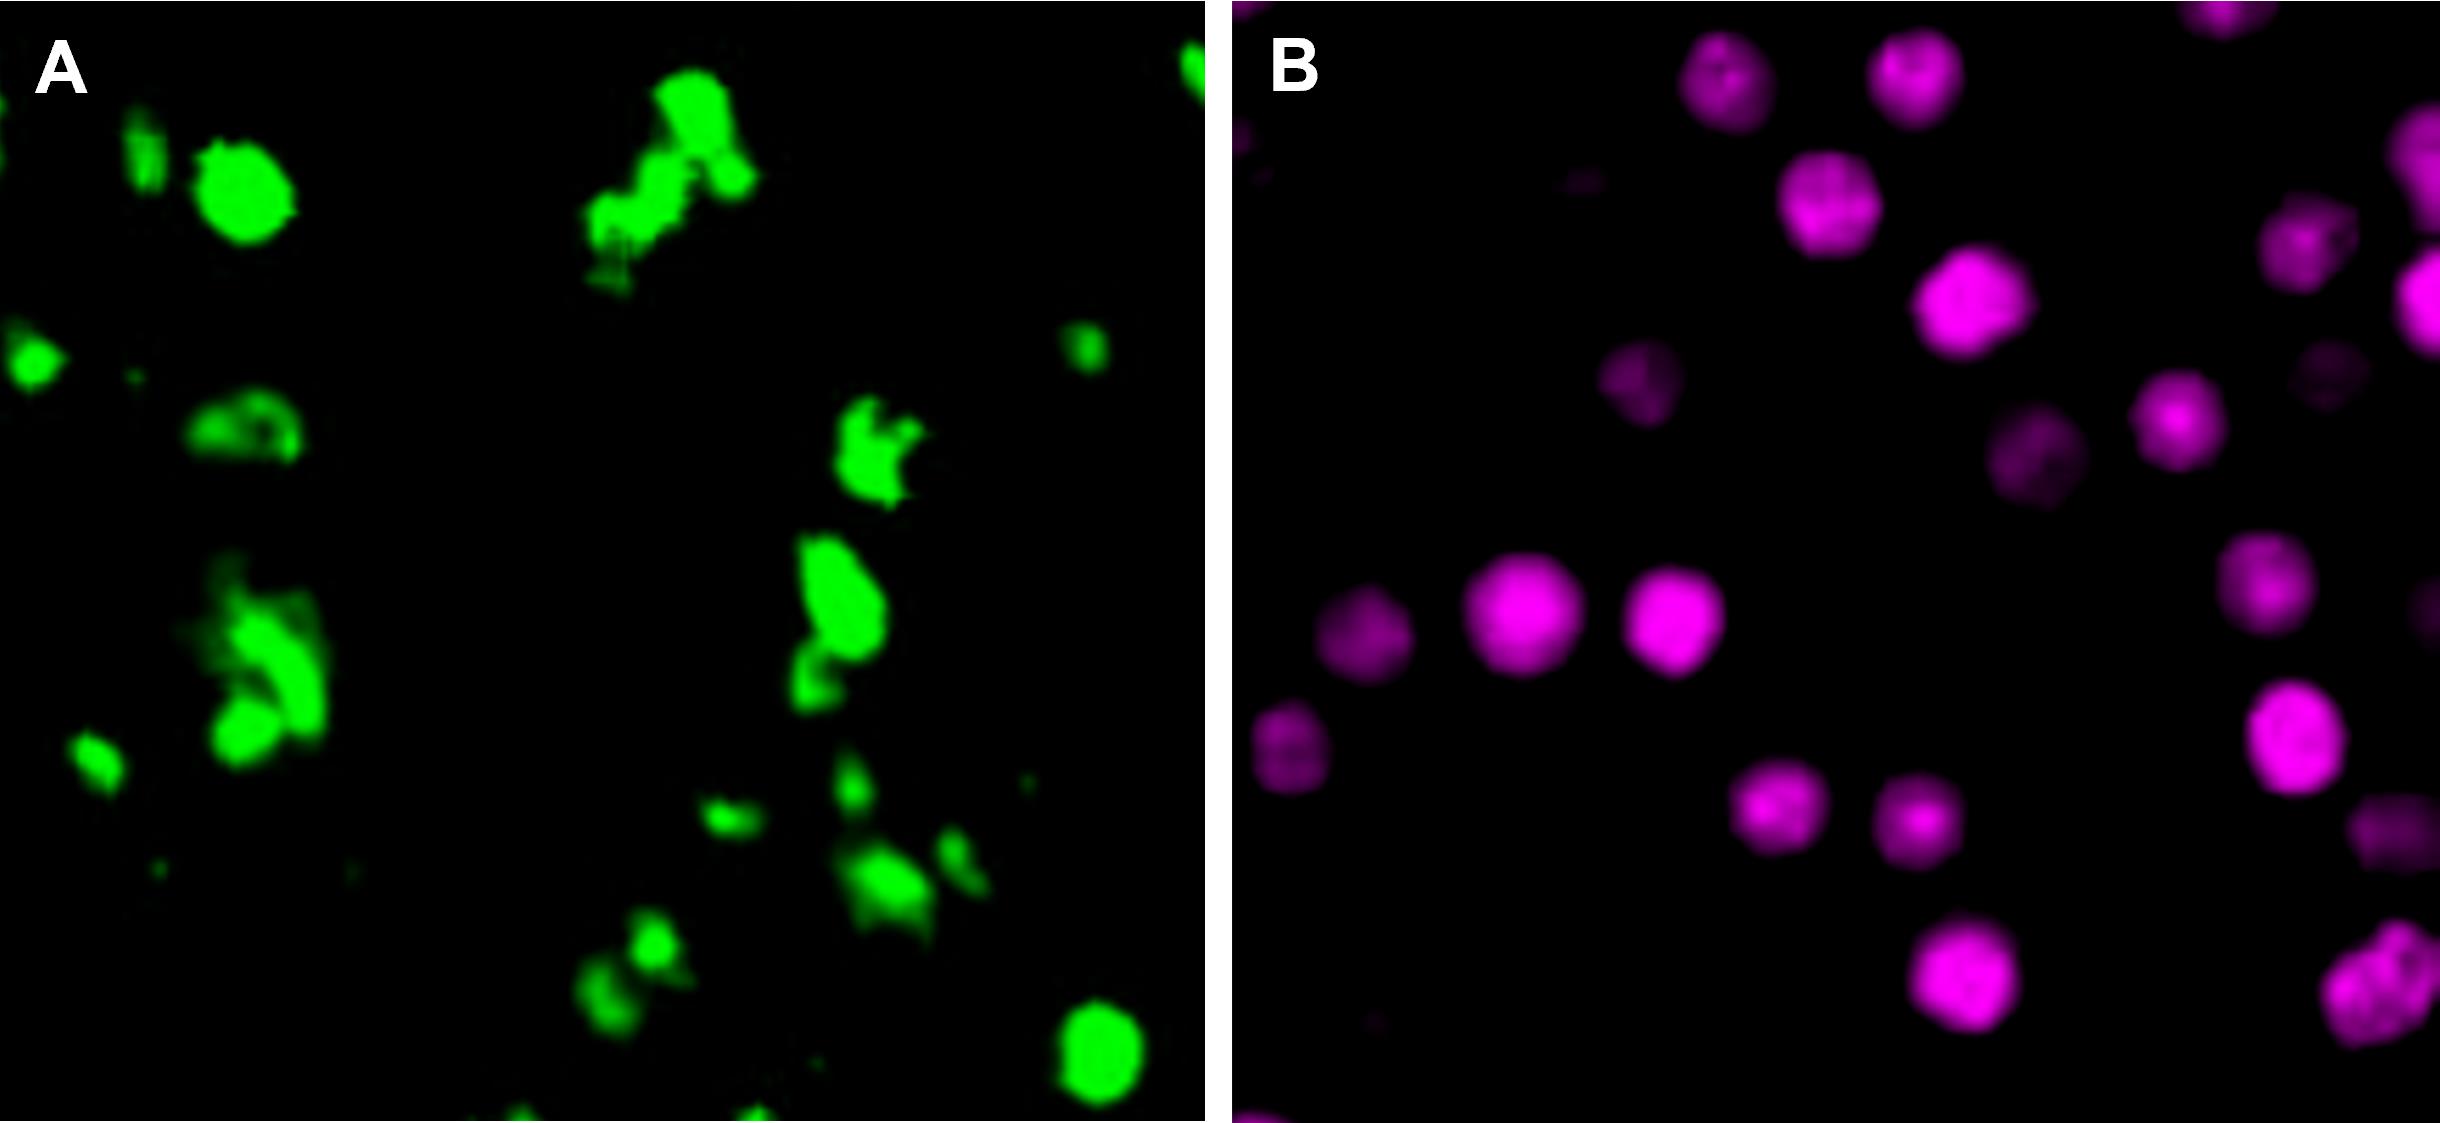
Figure 2. Representative fluorescent signal of monocytes stained with cell tracers. A. Mouse bone marrow monocytes stained with 5 μM CMFDA (green). B. Monocytes stained with 1 μM Far-Red cell trace (magenta). Monocytes were isolated and labeled as in steps A3–A6. Images were taken with a Nikon Eclipse TE300 Microscope at 40×.Warm the 2× cell tracker working solution to 37 °C and add 500 μL to the cells obtained in step A5 (1 × 10⁶ cells in 500 μL of 1× PBS) for a final volume of 1 mL. Mix the tube by inversion.
Incubate for 20 min at 37 °C with 5% CO2 protected from light.
Add five times the original staining volume of complete culture medium to the cells and incubate for 5 min. This step removes any free dye remaining in the solution. Count the cells.
Centrifuge the cells at 300× g for 5 min. Carefully remove all the supernatant with a pipette.
Add RPMI complete culture medium to adjust the cells to 2.5 × 10⁶–4 × 10⁶ per 10–20 μL.
Optional: Check the fluorescent signal at the microscope (Figure 2).
Intradermal transfer of cell tracer–labeled monocytes and intradermal infection using fluorescent L. donovani (in vivo).
Cell tracer–labeled monocytes (step A6) and fluorescent parasites (mCherry) or pre-labeled with a cell tracer (step A2) are inoculated by ID injection.
Place the parasite (1 × 10⁶ parasite/10 μL) into an ultra-fine insulin syringe (protected from light).
In an ABSL2 room, put the mice under anesthesia and transfer the cell tracer–labeled monocytes (Figure 2) by ID injection (2.5 × 10⁶–4 × 10⁶ per 10 μL).
Immediately inoculate intradermally the fluorescent parasite (1 × 10⁶/10 μL) in each foot (dorsal hind paw) or as needed.
Twenty-four to forty-eight hours after transfer of cell tracer labeled cells and infection, proceed with popliteal lymph node and spleen isolation for flow cytometry acquisition and analysis (follow sections B and C).
Collection of in vivo samples and tissue processing
Isolation of cells from skin
Euthanize the mice as mentioned before and proceed with the skin tissue collection. For this, hold the skin with forceps and cut the skin of the infected hind paw with a scalpel.
Note: Collect the draining lymph nodes and spleen and treat them as in section C.
Place the inoculation site tissue (skin of hind paw) into a 24-well plate in 1 mL of complete RPMI medium on ice (4 °C).
Transfer skin tissue to 500 μL of 2 mg/mL collagenase D + 160 μg/mL of Liberase (see Recipes). Reserve the complete medium from the step above (B1b) at 4 °C to use in step B1e.
Cut the tissue in small parts with a blade or scissors (< 2 mm), incubate at 37 °C for 30 min, and mix at 200 rpm if an incubator with shaker is available. Alternatively, mix the tube by inversion every 5 min during the incubation time.
Add the 1 mL complete medium saved from above (B1c) to stop the enzymatic digestion (B1d).
Collect the cell suspension together with any tissue in the suspension and press the tissue through a 70 μm cell strainer with a 1 mL syringe plunger. Use another well or a small Petri dish to collect the cell suspension.
Add 1 mL of culture medium to the cell strainer to help pass through the cells.
Transfer the cell homogenate to a 5 mL Falcon tube.
Pellet the cells by centrifuging at 300× g for 7 min at 4 °C.
Remove the supernatant and add 1 mL of FACS buffer (see Recipes).
Count cells with 0.4% trypan blue (use 1:10 dilution).
Centrifuge cells at 300× g for 7 min at 4 °C, remove the supernatant, and adjust cell count to 1 × 10⁶/50 μL per tube by adding FACS buffer.
Proceed with cell surface staining for flow cytometry (see below).
Note: Use uninfected (stained samples without parasites) as control to establish flow cytometry thresholds for infected cells [dot-plot of the forward scatter (FSC) of cell population of interest vs. fluorescence channel of parasites].
Isolation of cells from spleen and draining lymph node (dLN)
Disinfect the euthanized mice with 70% alcohol.
Proceed to make an incision on the mouse’s left side, high under the rib cage, where the spleen is located. Collect the spleen and place it into a Petri dish with RPMI complete medium at 4 °C.
Make an incision on the right and left hind leg using scissors. Pushing the knee up to expose the popliteal fossa and using forceps, carefully remove the popliteal lymph node draining the infection site (Figure 3) and place it into a Petri dish with RPMI complete medium at 4 °C. Use a stereoscope as an alternative to facilitate visualization of lymph node.
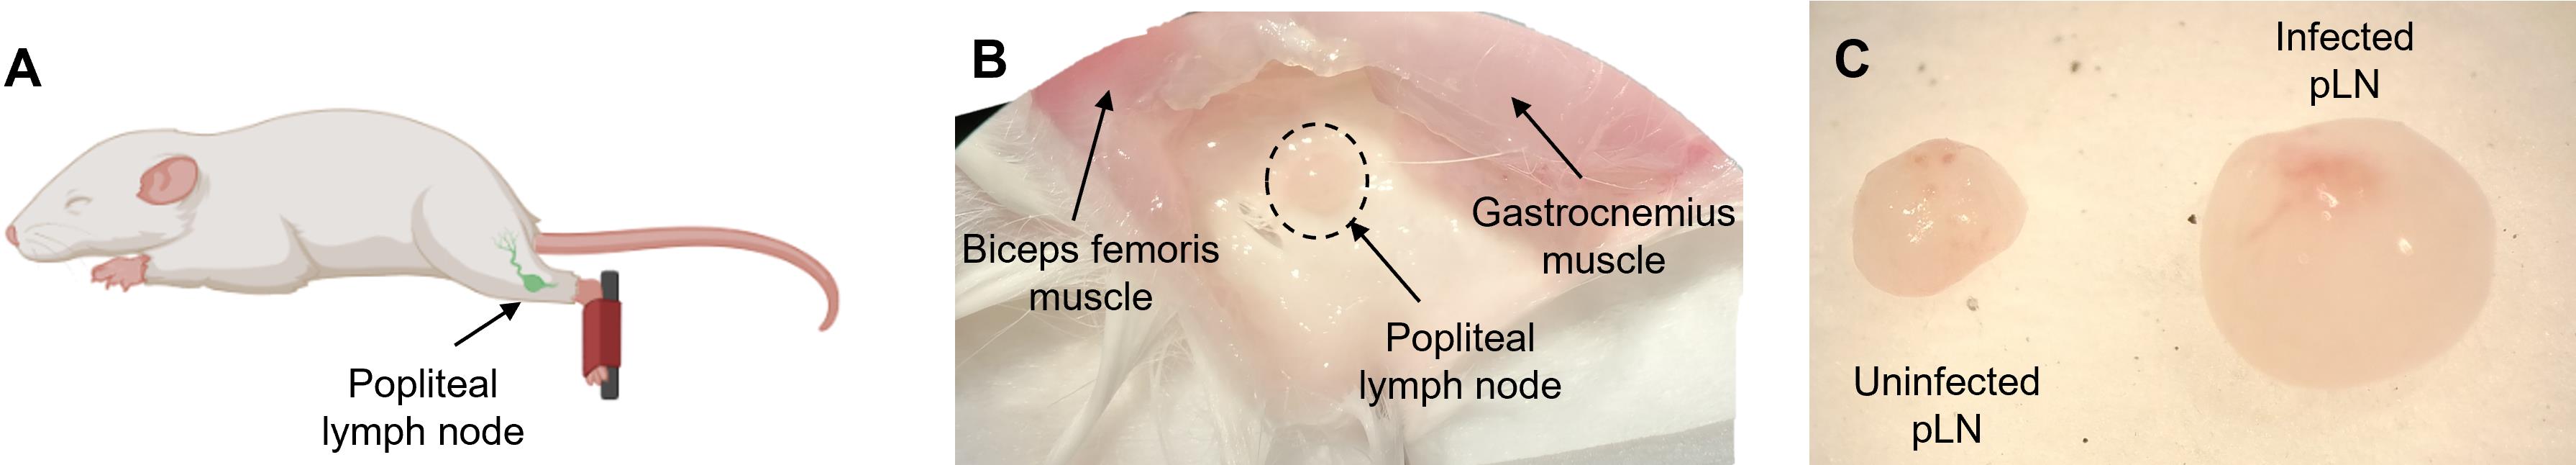
Figure 3. Mouse popliteal lymph node (pLN) localization. A. Popliteal lymph node drawing. B. Photo of the pLN (dot circle) using a stereoscope for localization and isolation. C. Comparison between an uninfected pLN (left) and Leishmania donovani–infected pLN (right) view under a stereoscope.Transfer the tissues into a Petri dish with Collagenase D solution + DNase I (see Recipes).
Inject the mouse spleen with 1 mL of Collagenase D solution + DNase I per spleen using a 1 mL syringe, then cut the tissue into smaller (1 mm) pieces using sharp scissors. Skip this step for the popliteal lymph node.
Incubate for 30 min at 37 °C with 5% CO2.
Inactivate the reaction by adding 1 mL of RPMI complete media.
Transfer the suspension of tissue pieces into a 70 μm cell strainer placed on a Petri dish. Add 1 mL of 1× PBS to the strainer and gently press the tissue through the strainer with a 1 mL syringe plunger.
Transfer the cell suspension to a 5 mL polypropylene tube.
Centrifuge at 500× g for 5 min. Discard the supernatant. Skip step B2k–m for lymph nodes.
To eliminate red blood cells from spleen tissues, resuspend the pellet in 1 mL of 1× RBC lysis buffer for 5 min.
Stop the lysis reaction by adding 3 mL of 1× PBS + 2% FBS.
Centrifuge immediately at 300× g for 5 min at RT. Decant the supernatant.
Resuspend the cells in 300 μL to 1 mL of PBS to adjust the cell concentration to 1× 10⁶ cells/50 μL.
Proceed with cell surface staining for myeloid cell phenotyping flow cytometry.
Finally, proceed with flow cytometry acquisition and analysis.
Note: If you are working with groups of mice, 24-well plates can be used to preserve the spleen or other organs at 4 °C. However, it is important to work fast to avoid cell death.
Phenotyping of harvested cells
Cell surface staining for myeloid cell phenotyping flow cytometry
Samples are adjusted at 1 × 10⁶/50 μL of 1× PBS (section B). Distribute 50 μL of cell suspension to a 5 mL polypropylene tube.
Add 50 μL of 1× PBS with FC block antibody (dilution 1:100) and Fixable Viability Dye eFluor 455UV (dilution 1:1,000) per tube. Add only PBS to one non-stained control tube.
Note: The staining for viability is done in 1× PBS as per manufacturer’s instructions; use FACS buffer otherwise.
Incubate for 20 min at 4 °C, protected from light.
Wash cells using 2 mL of FACS buffer and centrifuge at 300× g for 5 min at 4 °C. Decant supernatant.
Resuspend samples in 50 μL of FACS buffer with antibody staining cocktail per tube as below. Reserve tubes: unstained and FMO controls as needed for gating.
Prepare the antibody staining cocktail to identify the cell population of interest. In this case, we are using a panel to identify the main myeloid cell populations: monocytes, neutrophils, dendritic cells, and monocyte-derived dendritic cells (see suggested flow cytometry panel in Table 1). The number of markers depends on the flow cytometer configuration and the antibodies available. Incubate for 30 min on ice in the dark.
After incubation, add 3 mL of FACS buffer and centrifuge at 400× g for 5 min at 4 °C.
Discard the supernatant and resuspend cell pellet in 300 μL of 1× Fix/Lyse.
Incubate for 15 min at RT in the dark.
Add 3 mL of FACS buffer and centrifuge at 400× g for 5 min at 4 °C.
Wash the pellet with 3 mL of FACS buffer.
Resuspend the cell pellet in 300 μL of FACS buffer.
Store fixed cells in the dark at 4 °C for flow cytometry acquisition and analysis.
Note: Make sure to include fluorescence minus one (FMO) controls for the flow cytometry analysis.
Flow cytometry acquisition and analysis
For BD LSRFortessa IITM Cell Analyzer, turn on the machine and check fluid levels. Set the instrument settings (assistance for sample acquisition and analysis may be necessary if the user is not familiar with flow cytometry). Proceed with acquisition of the single-color compensation controls, FMO controls, and negative controls.
Collect between 100,000 and 1,000,000 events to capture enough infected cells for analysis.
Note: To generate a compensation matrix, it is preferable to use compensation beads (UltraComp eBeads, Thermo Fisher Scientific). For the compensation of cell tracers, is necessary to use cells reserved from the labeling with the fluorescent cell tracer or parasites expressing a fluorescent protein, if that is the case.
Data analysis
Flow cytometry analysis
For the flow cytometry analysis, we recommend using FlowJo. Basic analysis features may be available in each instrument.
To analyze data in FlowJo, follow the gating schemes in Figure 4 (adapted from Rose et al., 2012; Osorio et al., 2023). We performed different gating strategies depending on the cell population to be analyzed.
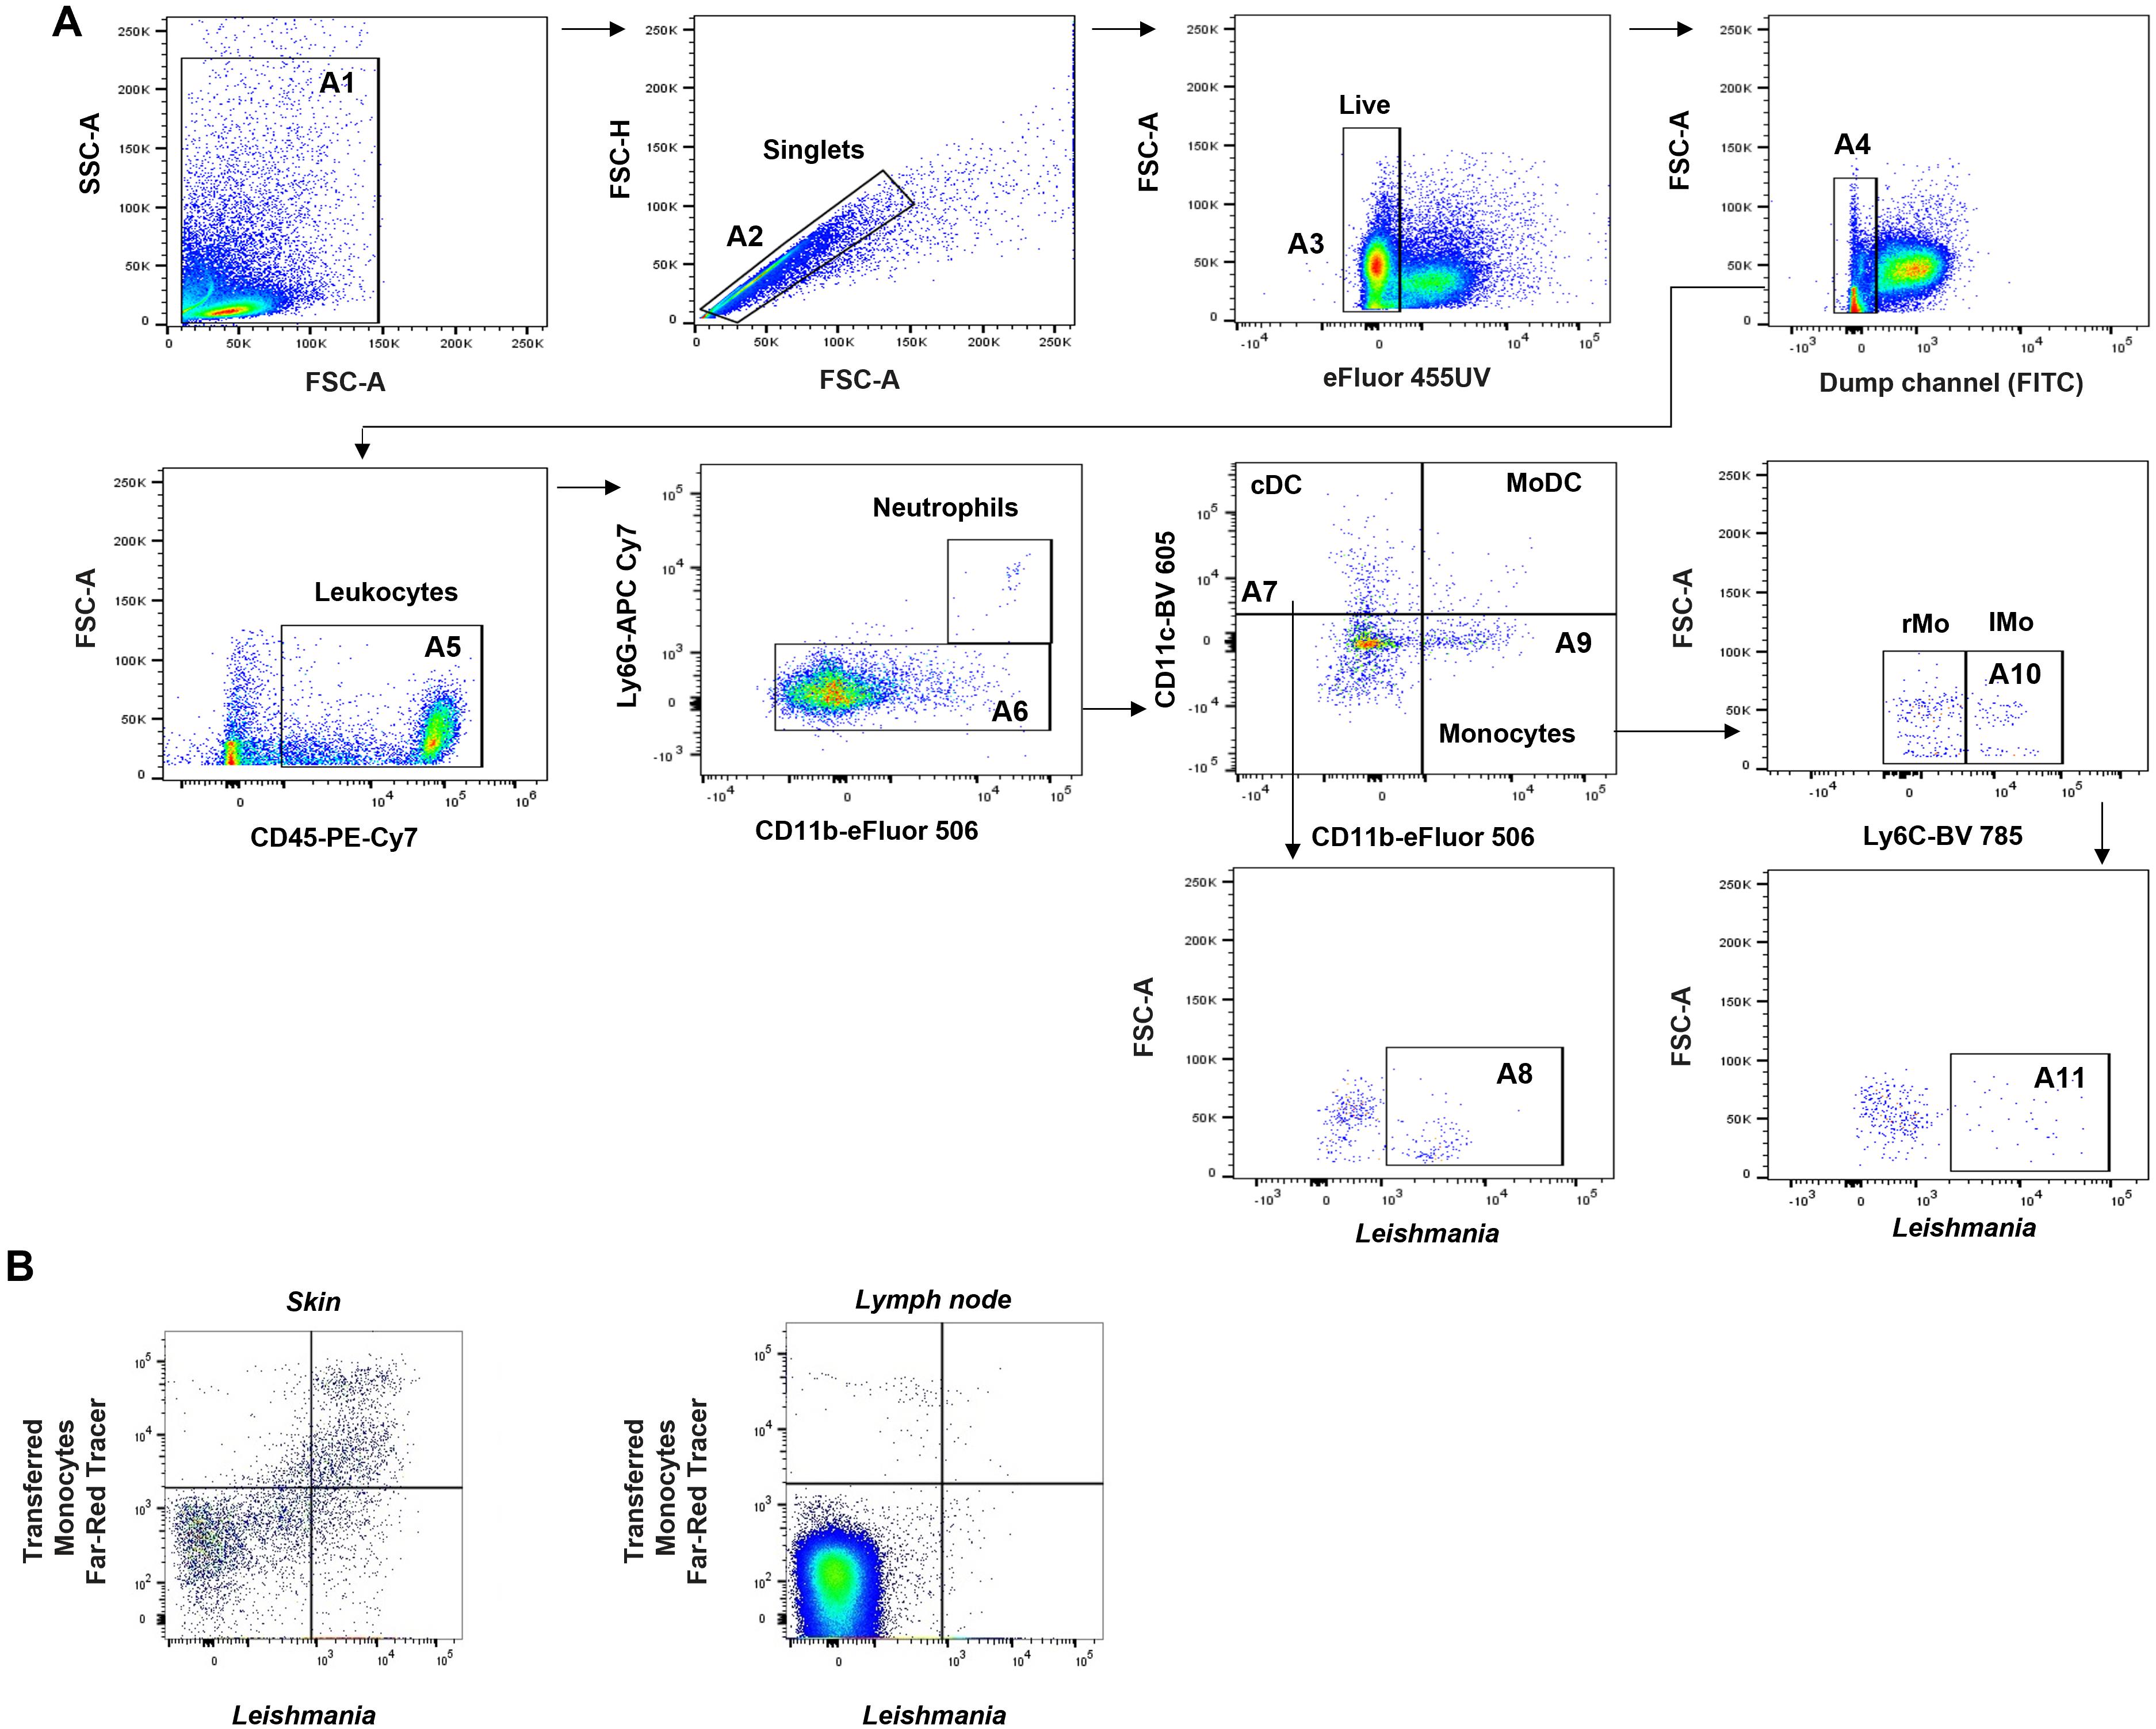
Figure 4. Representative gating strategy to detect fluorescent Leishmania in infected myeloid cells on lymphoid tissues. A. Representative gating strategy to evaluate infected cells in draining lymph node (dLN) and spleen (evaluated at 6 h and 12 h post-infection, respectively). B. Gating strategy to determine cells stained with cell tracer infected with Leishmania. Representative dot-plot skin (left) or lymph node (right) of monocytes labeled with Far-Red cell tracer positive for fluorescent Leishmania parasites (mCherry + or PKH26 cell tracer +) after 48 h of transference. Dot-plot from Ly6G-CD11b+ cells (gates A6). The threshold is established above the fluorescent signal of FMO controls and uninfected tissue controls. See detailed gating strategy in Data analysis.Gating strategy to identify cell tracer–labeled Leishmania in neutrophils, monocytes, conventional dendritic cells (cDCs), and monocyte-derived dendritic cells (MoDCs) (dLN and spleen): first, gate events on FSC-A and SSC-A (A1), and then gate on FSC-A vs. FSC-H to exclude doublets (A2). Cells are sub-gated to exclude dead cells in 455 UV (A3) and then T cells (CD3+), B cells (CD19+), and NK cells (NK-1.1+) in the FITC dump channel for T, B, and NK cells (A4). Leukocytes CD45+ (PE-Cy7) are sub-gated (A5). Then, CD11b+ (eFluor 506) population are sub-gated using the expression of Ly6G+ (APC-Cy7) to determine monocytes (CD11b+ Ly6G-) (A6) or neutrophils (CD11b+Ly6G+). cDCs and MoDCs are sub-gated using the expression of CD11c+ and CD11b+ to determine cDCs (CD11c+ CD11b-) (A7) or MoDCs (CD11c+ CD11b+). Monocytes are determined as CD11c- CD11b+ (A9). Monocytes could further be classified according to Ly6C expression as resident monocytes (Ly6Clow/-) or inflammatory monocytes (Ly6Chi+/int) (A10).
All populations are sub-gated in a dot-plot with FSC-A and the fluorescence of Leishmania (mCherry or labeled with a cell tracer such as PKH26) to identify infected cells (Leishmania) (A8 and 11).
Similarly, isolated, labeled, and transferred monocytes can be identified using the gating strategy explained above (Figure 4B). Here, after sub-gating monocytes as CD11b+ Ly6G- (A6 or B6), transferred monocytes labeled with Far-Red cell tracer are gated with the fluorescent Leishmania. The double staining indicates the transferred monocytes are infected with Leishmania parasites.
Validation of protocol
Parts of these procedures were standardized and validated previously (Ibrahim et al., 2013 and Osorio et al., 2023). For flow cytometry analysis, the threshold was established as the fluorescent signal above the FMO controls and uninfected tissue controls. Data were analyzed with GraphPad Prism 9.0 software (GraphPad, LLC).
General notes and troubleshooting
Troubleshooting (Table 3)
Table 3. Troubleshooting
| Problem | Possible reason | Solution |
| Cell clumping after using collagenase D or other proteases | Extended time using enzymatic degradation | • Reduce the time of cell exposure to collagenase D solution |
| Incomplete disaggregation of the cells/cell suspension is not achieved property | Short time using enzymatic degradation or ineffective filtration | When cell agglomeration occurs, passing the cell suspension through a 70 or 50 μm strainer can help. This will also avoid clogs when using the Flow cytometer |
| Compensation problem | Inadequate fluorochrome panel design | • Design your fluorochrome panel using specialized software (Fluorofinder). Ask a flow cytometrist for help |
Acknowledgments
This work was supported by the U.S. National Institutes of Health (NIH/NISID) grant numbers AI107419 and AI13012 to P.C.M. We thank the staff at the Animal Resources Center at the University of Texas Medical Branch for excellent care provided to the experimental animals. This protocol was adapted from the less-detailed original (Ibrahim et al., 2013 and Osorio et al., 2023).
Competing interests
The authors have declared that no competing interests exist.
Ethical considerations
The protocol was approved by the Institutional Animal Care and Use Committee of the University of Texas Medical Branch, Galveston, Texas (protocol number 1306027).
References
Al-Zaben, N., Medyukhina, A., Dietrich, S., Marolda, A., Hünniger, K., Kurzai, O. and Figge, M. T. (2019). Automated tracking of label-free cells with enhanced recognition of whole tracks. Sci. Rep. 9(1): e1038/s41598-019-39725-x.
- Halabi, E. A., Arasa, J., Püntener, S., Collado-Diaz, V., Halin, C. and Rivera-Fuentes, P. (2020). Dual-activatable cell tracker for controlled and prolonged single-cell labeling. ACS Chem. Biol. 15(6): 1613–1620.
- Hampton, H. R. and Chtanova, T. (2019). Lymphatic Migration of Immune Cells. Front. Immunol. 10: e01168.
- Ibrahim, M. K., Barnes, J. L., Anstead, G. M., Jimenez, F., Travi, B. L., Peniche, A. G., Osorio, E. Y., Ahuja, S. S. and Melby, P. C. (2013). The Malnutrition-Related Increase in Early Visceralization of Leishmania donovani Is Associated with a Reduced Number of Lymph Node Phagocytes and Altered Conduit System Flow. PLoS Negl.Trop. Dis. 7(8): e2329.
- Machholz, E., Mulder, G., Ruiz, C., Corning, B. F. and Pritchett-Corning, K. R. (2012). Manual Restraint and Common Compound Administration Routes in Mice and Rats. J. Vis. Exp.: e3791/2771.
- Maiorino, L., Shevik, M., Adrover, J. M., Han, X., Georgas, E., Wilkinson, J. E., Seidner, H., Foerschner, L., Tuveson, D. A., Qin, Y. X., et al. (2022). Longitudinal Intravital Imaging Through Clear Silicone Windows. J. Vis. Exp.: e3791/62757–v.
- Osorio, E. Y., Uscanga-Palomeque, A., Patterson, G. T., Cordova, E., Travi, B. L., Soong, L. and Melby, P. C. (2023). Malnutrition-related parasite dissemination from the skin in visceral leishmaniasis is driven by PGE2-mediated amplification of CCR7-related trafficking of infected inflammatory monocytes. PLoS Negl.Trop. Dis. 17(1): e0011040.
- Rose, S., Misharin, A. and Perlman, H. (2012). A novel Ly6C/Ly6G-based strategy to analyze the mouse splenic myeloid compartment. Cytometry Part A 81(4): 343–350.
- Sacks, D. L. and Melby, P. C. (2015). Animal Models for the Analysis of Immune Responses to Leishmaniasis. Curr. Protoc. Immunol. 108(1): eim1902s108.
- Tomura, M., Ikebuchi, R., Moriya, T. and Kusumoto, Y. (2021). Tracking the fate and migration of cells in live animals with cell-cycle indicators and photoconvertible proteins. J. Neurosci. Methods 355: 109127.
- You, S., Tu, H., Chaney, E. J., Sun, Y., Zhao, Y., Bower, A. J., Liu, Y. Z., Marjanovic, M., Sinha, S., Pu, Y., et al. (2018). Intravital imaging by simultaneous label-free autofluorescence-multiharmonic microscopy. Nat. Commun. 9(1): 2125.
Supplementary information
The following supporting information can be downloaded here:
- Figure S1. Presence of the Green Fluorescent Protein(GFP) in the photoactivable mice(PA-GFP)
- Video S1. Single-cell photoactivation
- Table S1. Conditions tested in the photoconvertible model PA-GFP for identifying migratory cells photoactivated in skin. Most of the conditions showed no significant photoconversion
Article Information
Copyright
© 2023 The Author(s); This is an open access article under the CC BY-NC license (https://creativecommons.org/licenses/by-nc/4.0/).
How to cite
Uscanga-Palomeque, A. C., Osorio, E. Y. and Melby, P. C. (2023). Double Staining with Fluorescent Tracers to Determine Myeloid Cell Migration of Leishmania-infected Cells from Mouse Skin to Lymphatic Tissues by Flow Cytometry. Bio-protocol 13(18): e4817. DOI: 10.21769/BioProtoc.4817.
Category
Immunology > Immune cell staining > Flow cytometry
Cell Biology > Cell movement > Cell migration
Immunology > Immune cell isolation > Myeloid cell
Do you have any questions about this protocol?
Post your question to gather feedback from the community. We will also invite the authors of this article to respond.