- Protocols

- Articles and Issues
- For Authors
- About
- Become a Reviewer

Functional Phenotyping of Lung Mouse CD4+ T Cells Using Multiparametric Flow Cytometry Analysis
Published: Vol 13, Iss 18, Sep 20, 2023 DOI: 10.21769/BioProtoc.4815 Views: 4244
Reviewed by: Alka MehraMartin V Kolev
Original research article
The authors used this protocol in:

Jul 2022

Protocol Collections
Comprehensive collections of detailed, peer-reviewed protocols focusing on specific topics


Related protocols


Abstract
Gammaherpesviruses such as Epstein-Barr virus (EBV) are major modulators of the immune responses of their hosts. In the related study (PMID: 35857578), we investigated the role for Ly6Chi monocytes in shaping the function of effector CD4+ T cells in the context of a murine gammaherpesvirus infection (Murid gammaherpesvirus 4) as a model of human EBV. In order to unravel the polyfunctional properties of CD4+ T-cell subsets, we used multiparametric flow cytometry to perform intracellular staining on lung cells. As such, we have developed herein an intracellular staining workflow to identify on the same samples the cytotoxic and/or regulatory properties of CD4+ lymphocytes at the single-cell level. Briefly, following perfusion, collection, digestion, and filtration of the lung to obtain a single-cell suspension, lung cells were cultured for 4 h with protein transport inhibitors and specific stimulation media to accumulate cytokines of interest and/or cytotoxic granules. After multicolor surface labeling, fixation, and mild permeabilization, lung cells were stained for intracytoplasmic antigens and analyzed with a Fortessa 4-laser cytometer. This method of quantifying cytotoxic mediators as well as pro- or anti-inflammatory cytokines by flow cytometry has allowed us to decipher at high resolution the functional heterogeneity of lung CD4+ T cells recruited after a viral infection. Therefore, this analysis provided a better understanding of the importance of CD4+ T-cell regulation to prevent the development of virus-induced immunopathologies in the lung.
Key features
• High-resolution profiling of the functional properties of lung-infiltrating CD4+ T cells after viral infection using conventional multiparametric flow cytometry.
• Detailed protocol for mouse lung dissection, preparation of single-cell suspension, and setup of multicolor surface/intracellular staining.
• Summary of optimal ex vivo restimulation conditions for investigating the functional polarization and cytokine production of lung-infiltrating CD4+ T cells.
• Comprehensive compilation of necessary biological and technical controls to ensure reliable data analysis and interpretation.
Graphical overview

Graphical abstract depicting the interactions between immune cells infiltrating the alveolar niche and the lung during respiratory infection with a gammaherpesvirus (Murid herpesvirus 4, MuHV-4). Two distinct situations are represented: the inflammatory response developed during viral replication in the lung, either in the presence (WT mice) or absence of regulatory monocytes (CCR2KO mice). Sequential process of the experiment is represented, starting from intratracheal instillation of MuHV-4 virions to tissue dissociation and multicolor staining for flow cytometry analysis.
Background
The complexity and heterogeneity of CD4+ T cells are increasingly being investigated. Indeed, in addition to their multiple roles as helper cells orchestrating the orientation of immune responses, CD4+ T cells also play major direct roles as regulatory or cytotoxic cells. In particular, it is becoming increasingly clear that CD4+ T cells, alongside with CD8+ T cells, are key determinants in anti-viral and anti-tumor immunity. Investigating the heterogeneity of CD4+ T-cell response, as well as their possible plasticity in different contexts of inflammation, can be achieved by high-resolution transcriptomic approaches such as sc-RNA sequencing. However, this expensive technique, relying on strong bioinformatics expertise, cannot always be used as a first line of investigation and/or requires additional validation of protein expression. In this context, the development of multicolor flow cytometry staining is a reliable and accurate tool as it allows the precise definition of the expression profile of surface molecules, while evaluating the functional properties of these populations in the presence of relevant stimuli. Multiparametric flow cytometry is therefore a widely used method for immunoprofiling circulating or tissue-resident cells. The originality and interest of the present protocol is to combine the staining of surface molecules suggestive of functional cell polarization (e.g., the checkpoint inhibitor PD-1 or the degranulation marker CD107a) with the quantification of the immune mediators expressed and/or released by these target cells. In that regard, the design of the restimulation cocktail is extremely important and requires a precise knowledge of the biological context of expression of each particular mediator. Indeed, the use of certain drugs such as phorbol 12-myristate 13-acetate and ionomycin triggers a massive and non-specific release of certain cytokines that does not necessarily reflect the behavior and level of activation of the cells of interest in vivo and makes it difficult to interpret the results. In addition, these aggressive treatments may also introduce a bias by affecting cell viability and leading to the selective loss of activated cells in vivo and therefore more sensitive to this type of treatment. Furthermore, while staining of some chemokines such as CXCL9 or cytotoxic mediators such as granzyme B can be achieved directly without any accumulation, others require simple accumulation (e.g., iNOS) or accumulation in presence of conditioned medium (e.g., IFNγ) for reliable detection. More specifically, the protocol presented here details the optimal conditions for assessing the regulatory vs. cytotoxic properties of CD4+ T cells recruited to the lung after respiratory infection with a gammaherpesvirus.
Materials and reagents
GentleMACS C tube (Miltenyi, catalog number: 130-093-237)
Hank’s buffered saline solution (HBSS) (Lonza, catalog number: BE10-543F)
DNase I (Roche, catalog number: 11284932001)
Collagenase D (Roche, catalog number: 11088866001)
Falcon, 15 and 50 mL conical centrifuge tubes (Corning, catalog numbers: 352096 and 352070)
Bovine serum albumin (BSA) (Sigma, catalog number: A8412)
Fetal calf serum (FCS) (Gibco, catalog number: 10082147)
EDTA (CorningTM, catalog number: 46-034-CI)
Falcon® 70 μm cell strainer (Corning, catalog number: 352350)
cOmpleteTM protease inhibitor cocktail (Roche, catalog number: 11697498001)
RBC lysis buffer (Thermo Fisher Scientific, catalog number: 00433357)
Trypan Blue solution, 0.4% (Sigma-Aldrich, catalog number: 93595)
96-well round (U) bottom plate, TC surface, pack of 1 (Thermo ScientificTM, catalog number: 163320)
RPMI 1640 medium (GibcoTM, catalog number: 11875093)
Monensin solution (BioLegend, catalog number: 420701)
Brefeldin A solution (BioLegend, catalog number: 420601)
β-mercaptoethanol (Sigma-Aldrich, catalog number: 3148)
L-Glutamine (CorningTM, catalog number: 25005CI)
Sodium pyruvate (CorningTM, catalog number: 25-000-CIR)
Sodium azide (Sigma, catalog number: 8223350100)
Penicillin-streptomycin (GibcoTM, catalog number: 15070063)
Purified anti-mouse CD28 antibody (BioLegend, catalog number: 102102)
Ultra-LEAFTM purified anti-mouse CD3ε antibody (BioLegend, catalog number: 100340)
Ultra-LEAFTM purified anti-mouse CD49d antibody (BioLegend, catalog number: 103709)
Anti-mouse CD107a allophycocyanin (APC) conjugated antibody (BioLegend, catalog number: 121613)
Anti-mouse CD16/32 Fc block (BioLegend, catalog number: 101301)
Zombie Aqua Fixable Viability kit (BioLegend, catalog number: 423101)
Paraformaldehyde (PFA) (Santa Cruz Biotechnology, catalog number: sc-281692)
Saponin (Sigma-Aldrich, catalog number: 47036)
BD FACSuiteTM CS&T research beads (BD Biosciences, catalog number: 650621)
Lung digestion medium (see Recipes)
Collagenase D working stock (see Recipes)
DNase I working stock (see Recipes)
Culture medium (see Recipes)
Wash buffer (see Recipes)
FACS buffer (see Recipes)
Permeabilization buffer (see Recipes)
Intracellular staining buffer (see Recipes)
Fc receptor blockade (see Recipes)
Intracellular staining mix (see Recipes)
Surface staining mix (see Recipes)
Zombie VioletTM Fixable Viability Kit (see Recipes)
Restimulation medium 1 (see Recipes and Table 1)
Restimulation medium 2 (see Recipes and Table 1)
Table 1. Summary of the specific cocktails of stimulation medium
Specific medium Milieu a (Il-10 and IFNγ producing T cells) Milieu b (Granzyme B and Granzyme A producing T cells) Milieu c (Perforin-1 producing T cells) Media RPMI complete medium RPMI complete medium RPMI complete medium Protein transport inhibitors Monensin (2 μM) and brefeldin (2 μM) Monensin (2 μM) and brefeldin (2 μM) Monensin (2 μM) and brefeldin (2 μM) Additives β-mercaptoethanol (50 μM) β-mercaptoethanol (50 μM) β-mercaptoethanol (50 μM) purified CD28 antibody (1 μg/mL) purified CD28 antibody (1 μg/mL) purified CD3ε antibody (2 μg/mL) purified CD3ε antibody (2 μg/mL) purified CD49d antibody (1 μg/mL) APC anti-mouse CD107a (0.5 μg/mL; LAMP-1) antibody
Recipes
Lung digestion medium
HBSS medium supplemented with 5% heat-inactivated fetal calf serum
Collagenase D working stock
Resuspend lyophilized collagenase D with HBSS at a concentration of 20 mg/mL (stock solution). The reconstituted solution can be stored at -15 to -25 °C.
DNase I working stock
Resuspend lyophilized DNase I with nuclease-free water at a concentration of 1 mg/mL (stock solution). The reconstituted solution can be stored at -15 to -25 °C.
Culture medium
RPMI medium supplemented with 10% heat-inactivated FCS, 100 U/mL penicillin, 100 U/mL streptomycin, 2 mM L-glutamine, and 50 μM of β-mercaptoethanol.
Wash buffer
2 mM PBS-EDTA with 10% FCS
FACS buffer
PBS, 0.5% BSA, EDTA 2 mM, 2 mM NaN3 sodium azide
Note: FACS Buffer is a buffered saline solution that can be used for immunofluorescence staining protocols, antibody and cell dilution steps, wash steps required for surface staining, and flow cytometry analysis. The buffer contains sodium azide as preservative and animal serum proteins (BSA) to help minimize non-specific binding of antibodies. The addition of EDTA prevents cell-to-cell adhesion and clumping.
Permeabilization buffer
PBS, 0.1% saponin
Intracellular staining buffer
FACS buffer, 0.1% saponin
Fc receptor blockade
Add purified anti-mouse CD16/32 antibody diluted 1:500 in FACS buffer. Put 100 μL of total volume per well.
Surface staining mix
Add antibodies with appropriate dilutions predetermined by titration experiments in FACS buffer. Put 100 μL of total volume per well.
Zombie VioletTM Fixable working stock
Place the DMSO provided with the kit in a 37 °C water bath until it is completely thawed. Add 100 μL of DMSO to one vial of Zombie VioletTM dye and mix until fully dissolved. Store at -20 °C in 10 μL aliquots. Add appropriate volumes of Fixable Viability solution, with dilutions predetermined by titration experiments (1:1,000) in PBS. Put 100 μL of total volume per well.
Intracellular staining mix
Add antibodies with appropriate dilutions predetermined by titration experiments in intracellular staining buffer. Put 100 μL of total volume per well.
Equipment
BD LSR Fortessa X-20 flow cytometer (BD Biosciences)
Beckman Coulter Allegra X-15R centrifuge (Beckman Coulter); μ-plate carrier for SX4750A (392806)
GentleMACS dissociator (Miltenyi)
Software
FACS Diva software (Version 6.0)
FlowJo software v10
Procedure
Cell suspension preparation from the lungs
Open the thoracic cavity (Figure 1).
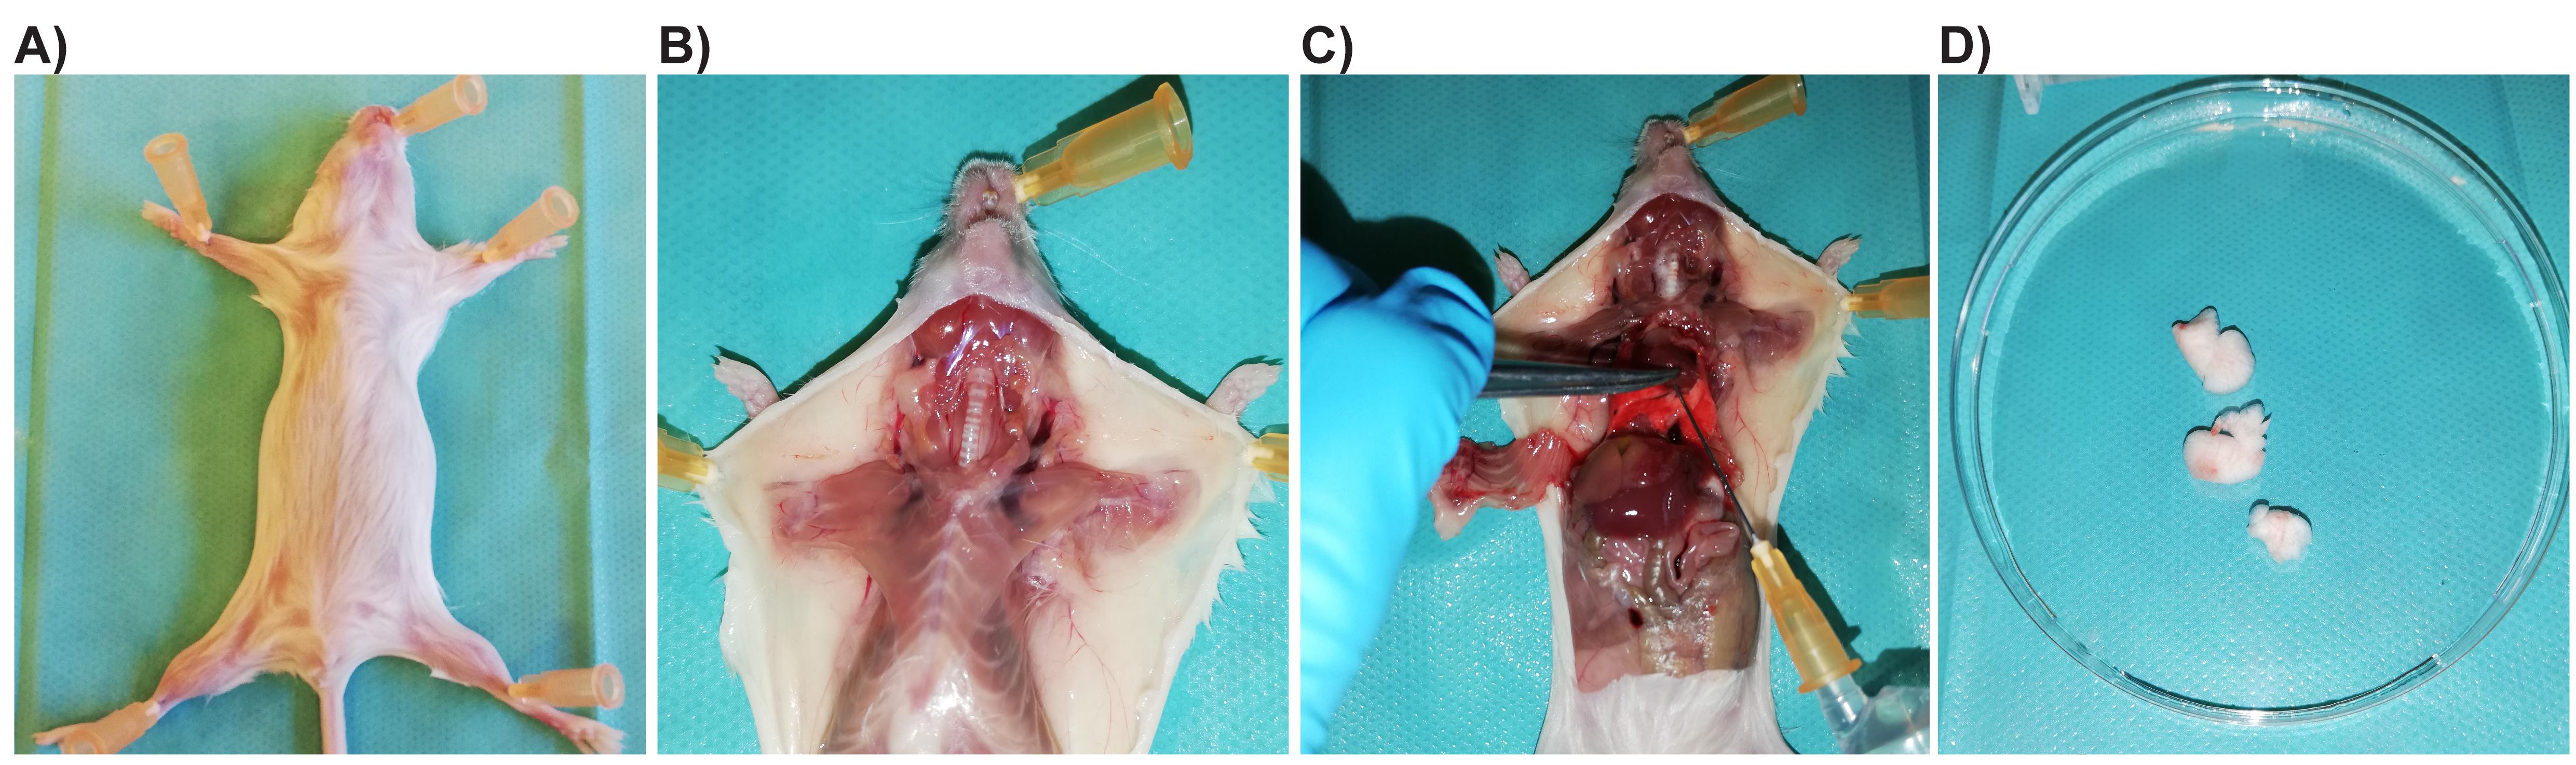
Figure 1. Pictures illustrating the different steps of dissection, perfusion, and isolation of the lungs for flow cytometry analysis of immune cells in the context of a respiratory viral infection. (A) Fixation of the mouse on a platform to be stuck in this position. (B) Dissection of the skin and subcutaneous tissue to visualize the upper part of the respiratory system and the thoracic cavity. (C) Opening of the thoracic cavity by cutting the thoracic ribs at the basis to visualize the lungs in place. In the axillary cavity, cut the blood vessels. Insertion of the needle in the right part of the heart (darker side of the heart) and instillation of ice-cold PBS (5 mL) carefully with the syringe. The lungs turn white as the instillation progresses. (D) Isolation of the perfused lung lobes on a dish.Perfuse the lungs with ice-cold PBS through the right ventricle of the heart.
Collect the lobes of the lung into a pre-warmed GentleMACS C-tube containing 3 mL of complete HBSS, collagenase D (final concentration: 1 mg/mL), and DNase I (final concentration 50 μg/mL).
Process the lungs with a gentleMACS dissociator.
Run the m_lung_01.01 protocol (pre-programmed by manufacturer: 8 s at 168 rounds per run no heat).
Critical: During the dissociation process, some tissue may get stuck to the plastic blades in the C tube. If this occurs, use forceps to transfer the tissue to the liquid prior to centrifugation.
Incubate in water bath under agitation (200 rpm) during 30 min at 37 °C.
Use again the gentleMACS dissociator and run the m_lung_02.01 protocol (pre-programmed by manufacturer: 38 s 2,083 rounds per run no heat) to finely grind the lungs.
Strain the cell suspensions through a 70 μm Falcon filter with wash buffer into a 50 mL centrifuge tube.
Spin down the tubes at 350× g for 5 min at 4 °C.
Discard the supernatant, resuspend with 1 mL of 1× RBC lysis buffer, mix well, and incubate during 5 min.
Fill the tubes with 20 mL of wash buffer.
Spin down the tubes at 350× g for 5 min at 4 °C.
Discard the supernatant and resuspend the pellet into 1 mL of FACS buffer.
Count cells with hemocytometer using trypan blue staining.
Plate 2 million cells into a 96-well U-bottom plate after counting.
Ex vivo stimulation of lung cells
Prepare culture media according to the particular mediators/cytokines to be quantified.
IL-10- and IFNγ-producing T cells: mouse lung cells are stimulated for 4 h at 37 °C in RPMI complete medium containing protein transport inhibitors (2 μM monensin and 2 μM brefeldin), 50 μM β-mercaptoethanol, purified CD28 antibody (1 μg/mL), and purified CD3ε antibody (2 μg/mL).
Granzyme B and Granzyme A producing T cells: mouse lung cells accumulate granzymes for 4 h at 37 °C in RPMI medium containing protein transport inhibitors (2 μM monensin and 2 μM brefeldin) and 50 μM β-mercaptoethanol.
Perforin-1-producing T cells: mouse lung cells are stimulated for 4 h at 37 °C in RPMI medium containing protein transport inhibitors (2 μM monensin and 2 μM brefeldin), 50 μM β-mercaptoethanol, purified CD28 antibody (1 μg/mL), purified CD3ε antibody (2 μg/mL), purified CD49d antibody (1 μg/mL), and APC anti-mouse CD107a (0.5 μg/mL; LAMP-1) antibody.
Centrifuge the cells at 350× g for 5 min at 4 °C.
Discard the supernatant.
Resuspend the cell in 200 μL of specific culture media as described above.
Incubate at 37 °C during 4 h and mix regularly by pipetting the solution once an hour.
Centrifuge the cells at 350× g for 5 min at 4 °C.
Discard the supernatant.
Wash the cells with 200 μL of ice-cold FACS buffer.
Centrifuge the cells at 350× g for 5 min at 4 °C.
Discard the supernatant.
Flow cytometry staining
Block Fc receptors by adding the purified CD16/32 antibody diluted 1:500 in ice-cold FACS buffer. Put 100 μL of total volume per well.
Incubate for 15 min at 4 °C.
Centrifuge the cells at 350× g for 5 min at 4 °C.
Discard the supernatant.
Stain for cell surface antigens with antibodies diluted in ice-cold FACS buffer. Put 100 μL of total volume per well. The surface antibodies used (panel, dilution, clone, provider) are provided in Figures 2 and 3.
Incubate for 30 min at 4 °C.
Centrifuge the cells at 350× g for 5 min at 4 °C.
Discard the supernatant.
Wash the cells with 200 μL of FACS buffer per well.
Centrifuge the cells at 350× g for 5 min at 4 °C.
Discard the supernatant.
Resuspend the cells in 100 μL of fixable viability solution.
Incubate for 30 min at 4 °C.
Centrifuge the cells at 350× g for 5 min at 4 °C.
Discard the supernatant.
Wash the cells with 200 μL of PBS per well.
Centrifuge the cells at 350× g for 5 min at 4 °C.
Resuspend the cells in PFA 4% (diluted in PBS) for 15 min or, alternatively, in PFA 1% overnight at 4 °C.
After the incubation time, centrifuge the cells at 400× g for 5 min at 4 °C.
Discard the supernatant.
Resuspend the cells in 200 μL of permeabilization buffer.
Incubate for 20 min at 37 °C.
Centrifuge the cells at 400× g for 5 min at 4 °C.
Discard the supernatant.
Stain for intracellular cytokines with antibodies diluted in the intracellular staining buffer. The intracellular antibodies used in this study (panel, dilution, clone, provider) are provided in Figures 2 and 3.
Incubate for 20 min at 4 °C.
Centrifuge the cells at 400× g for 5 min at 4 °C.
Discard the supernatant.
Resuspend the cells in 200 μL of intracellular staining buffer.
Centrifuge the cells at 400× g for 5 min at 4 °C.
Discard the supernatant.
Resuspend the cells in 200 μL of FACS buffer.
Analyze by flow cytometry.
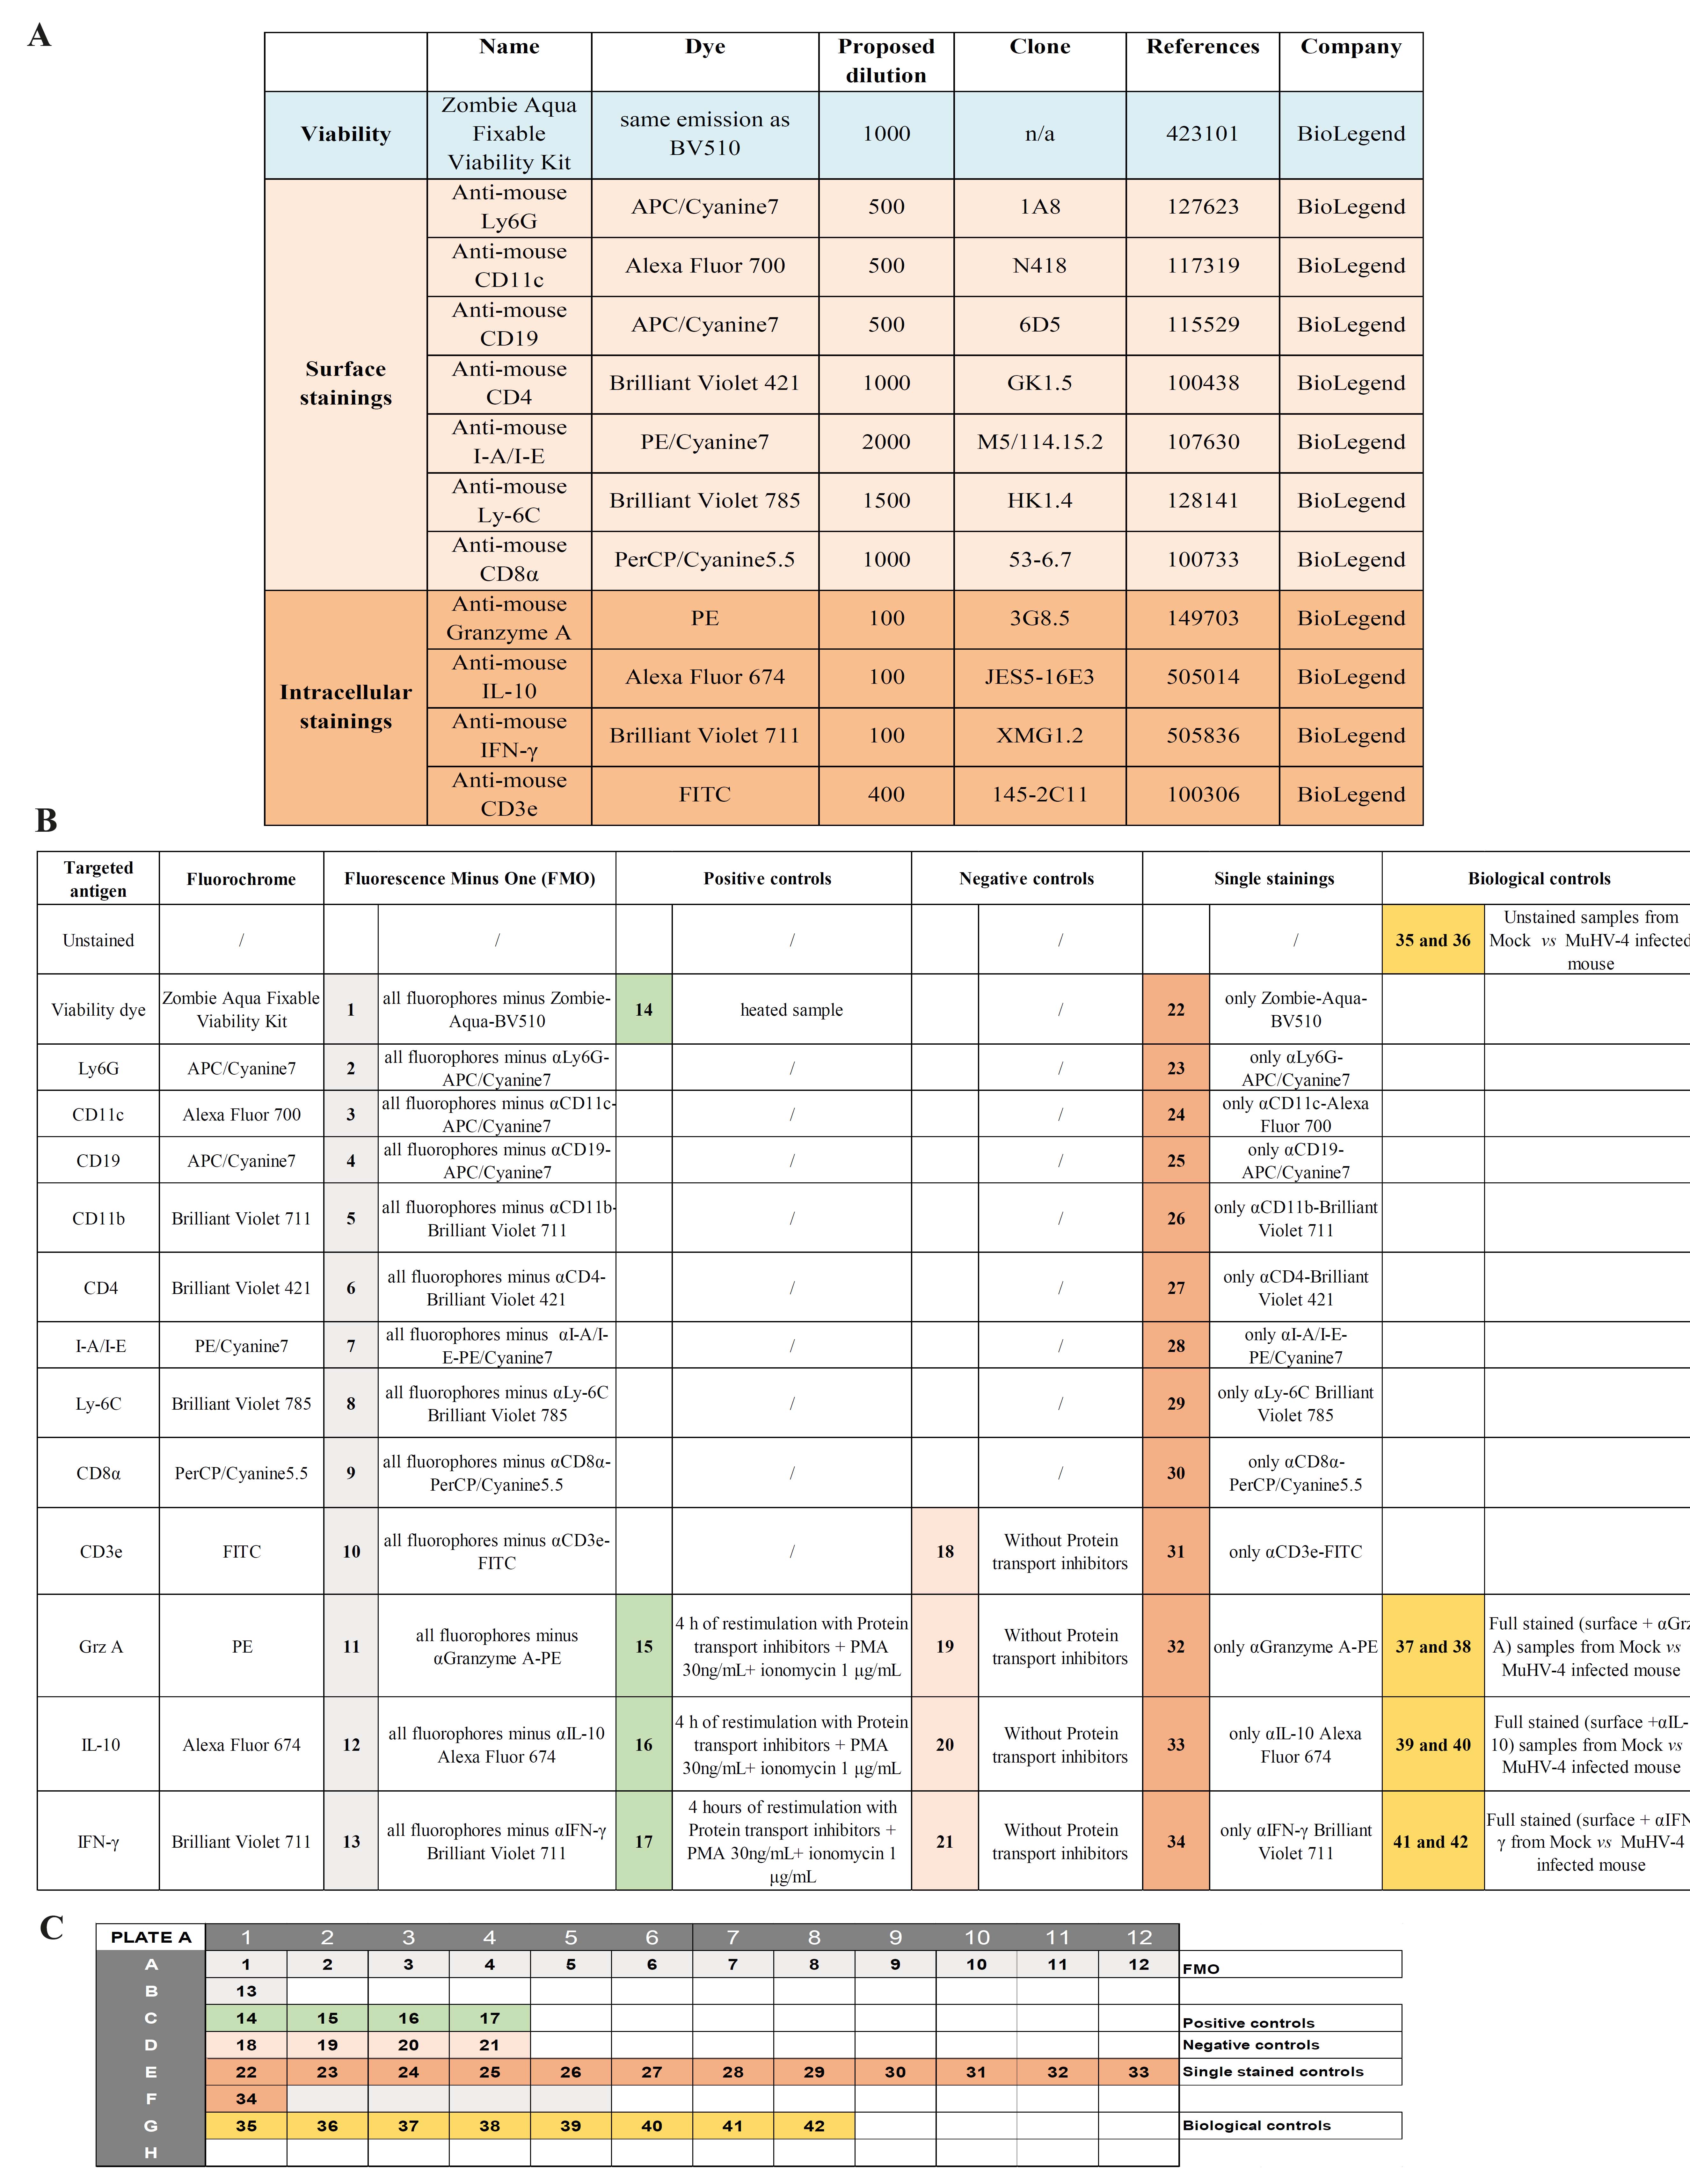
Figure 2. Panel 1 antibodies, useful controls, and plate design for Granzyme A, Interleukin-10, and IFN-γ staining. (A). Details of antibodies against surface and intracellular antigens used in the panel 1 (fluorochromes, clones, dilutions, references). (B). Various controls useful for setting up and validating the proposed multicolor panel 1 and example of a 96-well plate design corresponding to the controls used for setting up the panel (C).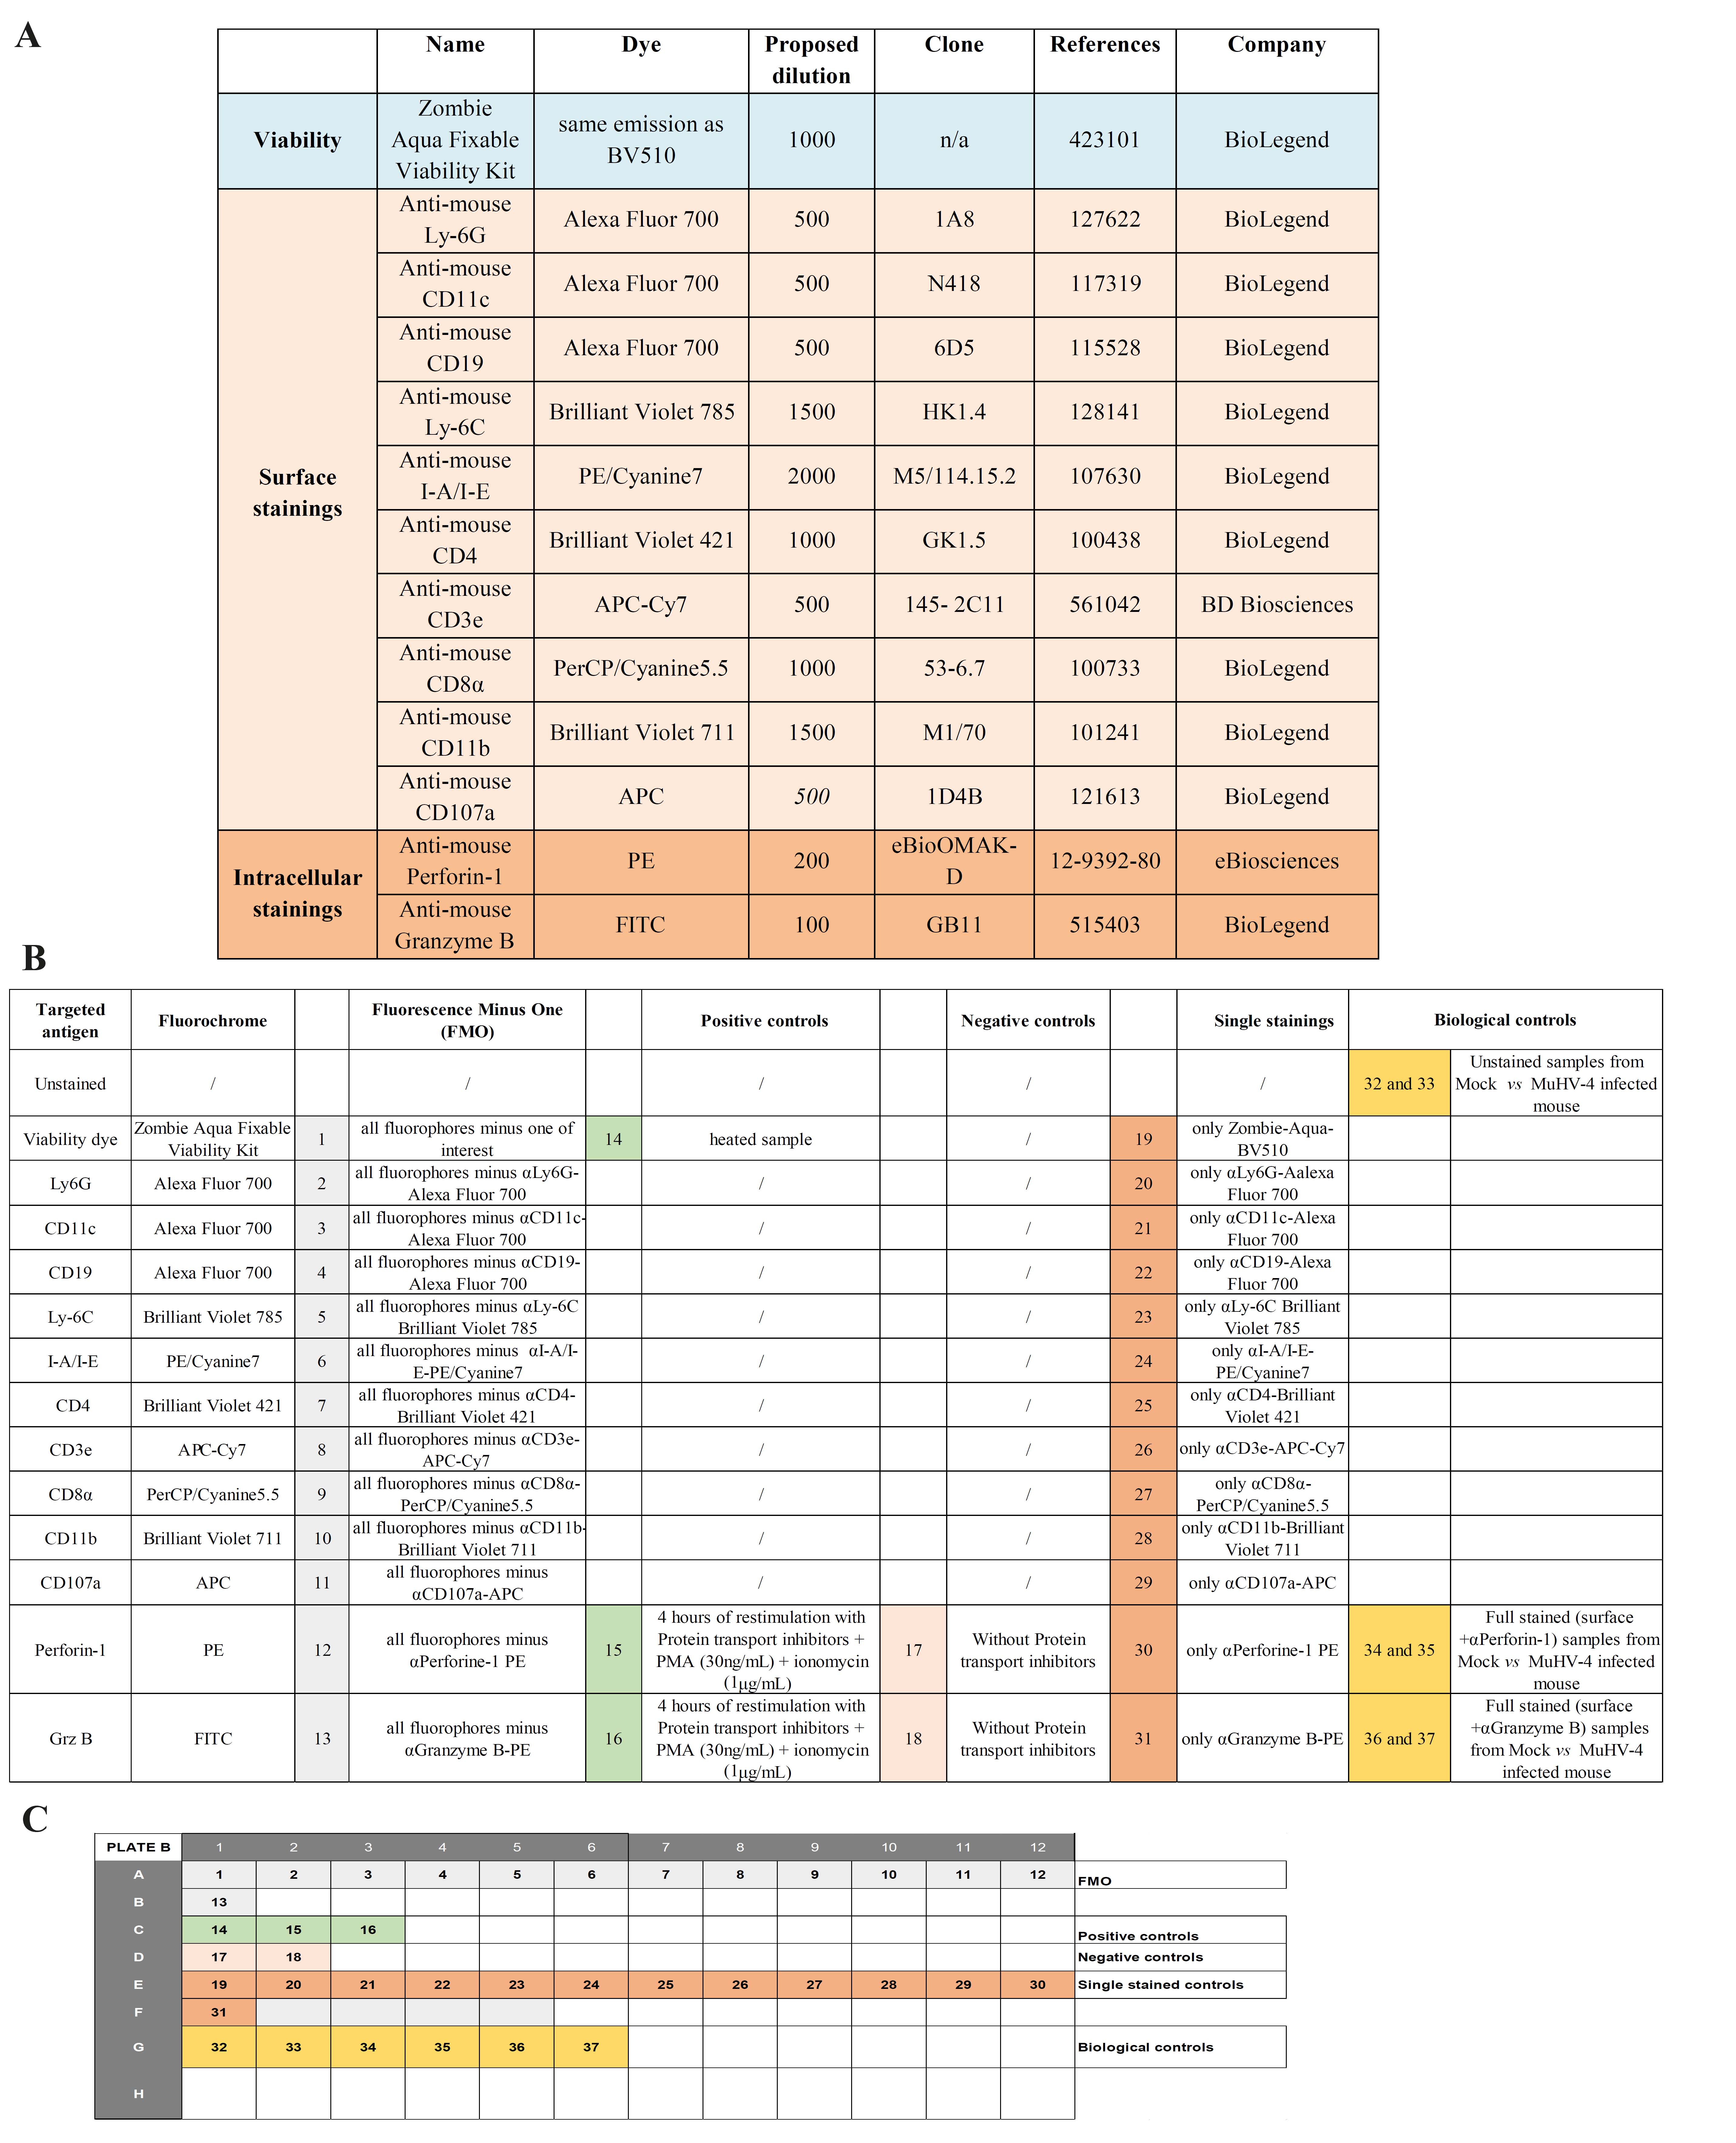
Figure 3. Panel 2 antibodies, useful controls, and plate design for Granzyme B and Perforin-1 staining. (A). Antibodies against surface and intracellular antigens used in the panel 2 (fluorochromes, clones, dilutions, references). (B). Various controls useful for setting up and validating the proposed multicolor panel 1 and example of a 96-well plate design corresponding to the controls used for setting up the panel (C).
Staining setup for flow cytometry
In general, there are important considerations that need to be taken into account when performing multiparameter flow cytometry. The Figure 4 provides a schematic representation of the steps in the protocol to be followed.
Figure 4. Protocol flowchart. Schematic representation of the steps in the protocol to be followed and the importance of the controls to be included at key times.As such, to avoid possible technical variances that may affect data interpretation, it is critical to properly set up the instrument with these following steps by adding technical and biological controls. To circumvent any issues, biological control samples and experimental samples must be processed and analyzed concurrently.
Before each use, calibration of the flow cytometer has to be done by running CST beads provided by BD Biosciences.
We strongly recommend performing titrations of each antibody, single staining controls, and fluorescence minus one (FMO) controls to obtain maximum resolution of cell populations and consistent results across experiments in these multicolor panels. Technical control samples such as FMO controls are essential to help define the boundaries between negative and positive populations. All of these controls allow adjusting the settings of flow cytometer voltages and automatically calculate a compensation matrix, which depends on spillover spreading. We recommend including (in addition of compensation beads) an unstained control by using the cells of interest in order to identify and correct for any intrinsic potential autofluorescence.
In addition to these technical controls, we recommend adding biological controls for each experiment to control the intracellular staining and put the gates properly. As biological controls, we always include control mock mice, ex vivo unstimulated sample controls with and without Golgi Stop (Brefeldin, Monensin). These controls are crucial to validate the signals and to interpret correctly the data obtained by eliminating bias due to technical problems.
Specific features
The protocol we describe in detail here was used to define the functional profile of lung-infiltrating CD4+ T cells during acute respiratory infection induced by a gammaherpesvirus and to understand the intercellular interactions controlling CD4+ T-cell activation. In order to characterize the phenotype of CD4+ cells and to study the mechanisms that control their level of activation and degranulation that take place in vivo, we established an ex vivo stimulation protocol, following which we used multicolor staining and multiparametric flow cytometry. Specifically, we isolated cells from the whole lung (without prior enrichment or sorting) and plated 2 million of cells per well in order to respect the existing in vivo stoichiometry and to preserve the intercellular interactions that participate in the local control of cytotoxic CD4+ T cells.
Data analysis
Regarding the gating strategy, the cells were first selected based on their size and granulosity and the doublets were excluded. We then focused on live cells (not stained with fixable aqua zombie viability dye) and excluded alveolar macrophages based on the CD11c marker expression and autofluorescence in the FITC channel. We subsequently excluded B cells and neutrophils according to lineage markers (Ly6G, CD19) and focused on lin-CD11b- cells. Within these lin-CD11b- cells, T cells were selected based on CD3 expression and the CD4+ and CD8+ T-cell subsets were subsequently selected according to these respective markers.
Detailed information on data analyses appears in the original research article (Maquet et al., 2022) and in the Figure 5 provided in this Bio-protocol. The technical and biological controls included during the process are provided in Figure 4 as a flowchart.
Figure 5. Immunoprofiling of CD4+ T cells isolated from mouse lung after viral infection. (A) Gating strategy used to identify by flow cytometry lung CD4+ T cells isolated from Mock and MuHV-4 infected mice at day 8 after infection. The first step is to distinguish cell populations based on the forward (FSC) and side scatter properties related to cell size and granularity, respectively. After exclusion of doublet cells based on FSC-W vs. FSC-A distribution, dead cells (stained by the fixable viability dye) are identified and eliminated from the gating. Among the living cells, alveolar macrophages (AMs) are gated based on an autofluorescent signal falling in the FITC channel and positive CD11c marker. By excluding these AMs, other immunes cells can be identified as follows: neutrophils gated as live, non-autofluorescent/CD11c-CD19-CD3-Ly6G+CD11b+; monocytes (MOs) gated as live, non-autofluorescent/CD11c-CD19-CD3-Ly6G-CD11b+Ly6C+; CD4+ or CD8+ T cells gated as live, non-autofluorescent/CD11c-CD19-CD3+CD4+ or CD8+, respectively. After selection of the cell subset of interest, the specific gates for the cytotoxic markers and Interleukin-10 are adjusted according to the FMO, biological controls, and positive and negative controls. Representative flow cytometry plots of lung CD4+ T cells, stained for the indicated cytotoxic mediators (B), and for Interleukin-10 (C) after 4 h of anti-CD3ε and anti-CD28 ex vivo stimulation. (D) Expected numbers of live total lung cells, CD4+ T cells, and MOs recovered after lung digestion and multicolor staining for flow cytometry, as described in the methods. (E) Percentage of lung CD4+ T cells expressing the indicated marker of cytotoxicity or interleukin-10 after cell isolation, restimulation, and staining, as described in the methods.
Validation of protocol
This protocol allows for successful isolation of lung cells. Successful dissociation/digestion should yield a viability of 70% or greater. The cell numbers are dependent upon the status of the mice (control or virally infected mice). In Figure 5, we have detailed the gating strategy used to identify the lung cells of interest in the context of the study published in Maquet et al. (2022) on day 8 post infection with MuHV-4, as well as the expected percentages and total numbers of these target cells.
General notes and troubleshooting
General consideration
It is important to highlight that we have described the staining for the intracellular cytokines IL-10 and IFNγ as an example and that other cytokines (in other inflammatory contexts) could be targeted in a similar manner. Indeed, the methods we detail here are directly related to the study we published in Science Immunology, which demonstrated that the absence of recruited monocytes in the lung transforms an asymptomatic viral infection into a severe immunopathology. In particular, in infected WT mice, monocytes provide a balance between cytotoxic and regulatory responses developed by the CD4+ T cells infiltrating the lung. In the specific context of this gammaherpesvirus respiratory infection, it is relevant to quantify the production of IL-10 and IFNγ to determine the functional heterogeneity of CD4+ T cells. This intracellular staining is proposed as an example: the quantification of other cytokines such as IL-6 (Th17), IL-12 (Th1), or the cytokines IL-5 and IL-13 in the context of a Th2 response could be addressed using a similar protocol.
Besides, it is also important to note that treatment of CD4+ T cells with monoclonal anti-CD3 and anti-CD28 antibodies provides a co-stimulatory signal that engages the T-cell receptor (TCR), which can be used for mimicking antigen-induced activation. However, to investigate the presence, activation, and/or proliferation of T cells specific to a given antigen, other protocols should be considered, such as the addition of specific peptides to the stimulation medium or the use of transgenic mice whose CD4+ T cells display a TCR specific to a given antigen.
Critical steps/Troubleshooting
Throughout this protocol, problems may be encountered, and we have compiled a list of critical steps to consider in order to avoid troubleshooting.
Reagents storage
Antibody conjugates and reagents are light and temperature sensitive and must be always protected from light and maintained at room temperature to preserve their stability and shelf life.
Zombie Fixable Viability kit should be stored for up to one year at -20 °C. Unused content in the aliquots should be discarded.
Protocol adjustments
We have tested saving the samples in the fridge overnight after PFA (1% instead of 4% with 15 min fixation) in case samples cannot be immediately acquired by the flow cytometer. Cells can be stored overnight at 4 °C in 1% PFA protected from light, and permeabilized and intracellular-stained the day after, without alteration of the results.
Due to cross-laser excitation, some dyes spill into other channels inducing spillover-spreading errors. Alternatively, and depending on the required panel, antibodies-conjugated fluorochromes could be swapped with another dye. For more information on spreading, use BD Biosciences Spectrum Viewer.
Depending on the biological questions, intracellular staining of Granzymes A and B can be performed directly without any pre-incubation with protein transport inhibitors.
Cautionary points
Lung samples should be kept as much as possible on ice until stimulation at 37 °C to preserve viability. After digestion, the only step that has to be performed at room temperature is the RBC lysis during 5 min. Use ice-cold solutions.
Saponin permeabilization is a reversible step, and intracellular staining must be carried out in the presence of permeabilization buffer.
Respect the washing steps correctly during staining and permeabilization.
Acknowledgments
The protocol was adapted from the previously published paper: Maquet et al. (2022). This work was supported in part by the F.R.S./FNRS (research fellow for C.M.; research associate support for B.M.; F.R.S./FNRS “incentive grant for scientific research to B.M., 40003542”), in part by the ERC Starting Grant (to B.M.) (ERC-StG-2019 VIROME, ID:853608), in part by the grant from Leon Fredericq Foundation (to C.M.), and by the EOS joint program of F.R.S./FNRS-FWO (EOS ID: 30981113) (to L.G.).
Competing interests
The authors declare no competing interests.
Ethical considerations
All work in the development of this protocol was approved by the Committee on the Ethics of Animal Experiments of ULiège (permit numbers 2015 and 2215).
References
- Maquet, C., Baiwir, J., Loos, P., Rodriguez-Rodriguez, L., Javaux, J., Sandor, R., Perin, F., Fallon, P. G., Mack, M., Cataldo, D., et al. (2022). Ly6Chimonocytes balance regulatory and cytotoxic CD4 T cell responses to control virus-induced immunopathology. Sci. Immunol. 7(73): eabn3240.
Article Information
Copyright
© 2023 The Author(s); This is an open access article under the CC BY-NC license (https://creativecommons.org/licenses/by-nc/4.0/).
How to cite
Readers should cite both the Bio-protocol article and the original research article where this protocol was used:
- Maquet, C. M., Gillet, L. and Machiels, B. (2023). Functional Phenotyping of Lung Mouse CD4+ T Cells Using Multiparametric Flow Cytometry Analysis. Bio-protocol 13(18): e4815. DOI: 10.21769/BioProtoc.4815.
- Maquet, C., Baiwir, J., Loos, P., Rodriguez-Rodriguez, L., Javaux, J., Sandor, R., Perin, F., Fallon, P. G., Mack, M., Cataldo, D., et al. (2022). Ly6Chimonocytes balance regulatory and cytotoxic CD4 T cell responses to control virus-induced immunopathology. Sci. Immunol. 7(73): eabn3240.
Category
Immunology > Immune cell function > Lymphocyte
Cell Biology > Cell-based analysis > Flow cytometry
Do you have any questions about this protocol?
Post your question to gather feedback from the community. We will also invite the authors of this article to respond.