- Protocols

- Articles and Issues
- For Authors
- About
- Become a Reviewer

Quantitative Analysis of Clot Deposition on Extracorporeal Life Support Membrane Oxygenators Using Digital and Scanning Electron Microscopy Imaging Techniques
Published: Vol 13, Iss 18, Sep 20, 2023 DOI: 10.21769/BioProtoc.4814 Views: 1513
Reviewed by: Komuraiah MyakalaBhanu JagilinkiAndrew Doyle
Advertisement


Protocol Collections
Comprehensive collections of detailed, peer-reviewed protocols focusing on specific topics


Related protocols

Abstract
Device-induced thrombosis remains a major complication of extracorporeal life support (ECLS). To more thoroughly understand how blood components interact with the artificial surfaces of ECLS circuit components, assessment of clot deposition on these surfaces following clinical use is urgently needed. Scanning electron microscopy (SEM), which produces high-resolution images at nanoscale level, allows visualization and characterization of thrombotic deposits on ECLS circuitry. However, methodologies to increase the quantifiability of SEM analysis of ECLS circuit components have yet to be applied clinically. To address these issues, we developed a protocol to quantify clot deposition on ECLS membrane oxygenator gas transfer fiber sheets through digital and SEM imaging techniques. In this study, ECLS membrane oxygenator fiber sheets were obtained, fixed, and imaged after use. Following a standardized process, the percentage of clot deposition on both digital images and SEM images was quantified using ImageJ through blind reviews. The interrater reliability of quantitative analysis among reviewers was evaluated. Although this protocol focused on the analysis of ECLS membrane oxygenators, it is also adaptable to other components of the ECLS circuits such as catheters and tubing.
Key features
• Quantitative analysis of clot deposition using digital and scanning electron microscopy (SEM) techniques
• High-resolution images at nanoscale level
• Extracorporeal life support (ECLS) devices
• Membrane oxygenators
• Blood-contacting surfaces
Graphical overview
Background
Device-induced thrombosis remains one of the major complications of extracorporeal life support (ECLS) (Jaffer et al., 2015; Doyle and Hunt, 2018). The interaction of blood and artificial surfaces of ECLS components results in clot deposition on these surfaces and in severe instances can lead to occlusion of the circuit and systemic complications (Roberts et al., 2020a). Clinically available antithrombotic treatments can introduce hemorrhagic complications, especially in patients with preexisting bleeding disorders (MacLaren et al., 2022). Non-thrombogenic circuits that reduce thrombotic complications and enable improved patient outcomes are needed. An important prerequisite to developing such circuits is to more thoroughly understand how blood components interact with the artificial surfaces of ECLS devices (Beely et al., 2016). However, there is currently no methodology for routine examination of these devices after use. Surfaces of ECLS components could be specifically engineered to address the issue of thrombosis with a better understanding of the interactions between blood and ECLS surfaces. Examination and analysis of extracorporeal circuitry following clinical use in a standardized and validated method could inform both clinical decision-making regarding anticoagulation as well as device design.
Digital images have been used to record and visualize the extent of clot formation within ECLS devices in small pilot research studies, both clinically and in translational research laboratories (Lehle et al., 2008; Beely et al., 2016; Diehl and Gantner, 2018; Chlebowski et al., 2020; Naito et al., 2021). Blood clots are easily observed through digital images, while some microscopic thrombotic structures are not. Scanning electron microscopy (SEM), an advanced technology, produces high-resolution images at nanoscale level. Although most of the clinical use of SEM is qualitative, new methodologies that increase the quantifiability of SEM have been developed (Kundu et al., 1988; Di Iorio et al., 2005). We have previously used SEM to visualize and characterize clots and cell deposits in ECLS circuits following use in translational research studies in swine up to 72 h in duration (Beely et al., 2016; Roberts et al., 2020b). In this protocol, we developed and standardized a method to quantitatively analyze clot deposition using both digital and SEM images, allowing to routinely evaluate ECLS components following clinical use. Although this protocol focused on the analysis of ECLS membrane oxygenators only, this method could be applied to other components of the ECLS with necessary adaptations.
Materials and reagents
Reagents
Glutaraldehyde, 50% biological grade (Electron Microscopy Sciences, catalog number: 16520)
Sucrose, ≥ 99.5% (Sigma-Aldrich, catalog number: S9378)
Sodium cacodylate trihydrate, ≥ 98% (Sigma-Aldrich, catalog number: C0250)
Phosphate buffered saline (PBS) powder, 10×, pH 7.4 (Fisher BioReagents, catalog number: BP665-1)
Dehydrant alcohol, 100% (Epredia, catalog number: 6215)
Milli-Q water, 18.2 MΩ·cm, obtained through BarnsteadTM Smart2PureTM Pro Water Purification System
Solutions
Scanning electron microscopy fixative (SEM fixative) (see Recipes)
Scanning electron microscopy buffer (SEM buffer) (see Recipes)
Phosphate buffered saline, pH 7.4 (PBS) (see Recipes)
Recipes
SEM fixative
Reagent Final concentration Quantity Sucrose 0.1 M 8.5575 g Sodium cacodylate trihydrate 0.1 M 5.3508 g Glutaraldehyde, 50% 3% 15 mL Milli-Q water n/a 235 mL SEM buffer
Reagent Final concentration Quantity Sucrose 0.1 M 8.5575 g Sodium cacodylate trihydrate 0.1 M 5.3508 g Milli-Q water n/a 250 mL PBS (based on vendor instruction)
Reagent Final concentration Quantity PBS powder, 10× 1× 98.9 g Milli-Q water n/a 10 L
Laboratory supplies
Slotted tissue cassette (Epredia, catalog number: B851729WH)
Container, multi-purpose, PP, with separate snap lid, 120 mL (Globe Scientific, catalog number: 271004)
Copper conductive tape, single adhesive surface (Ted Pella, catalog number: 16072-1)
Carbon conductive tape, double coated (Ted Pella, catalog number: 16073-5)
T10 Torx Screwdriver (Tekton, model number: DST31100)
Sterilization wrap (Halyard, catalog number: 34162)
Premium blue indicating silica gel desiccant beads 3–5 mm (Dry & Dry, catalog number: X000TS1IZP)
Straight connector, female luer lock port (Qosina, catalog number: 73317)
Needleless injection site, swappable, male luer lock (Qosina, catalog number: 80147)
50 mL syringe, luer-lok tip (BD, catalog number: 309653)
Scissors
Surgical grade stainless steel forceps, nonlocking thumb handle straight delicate, serrated tips, 4 3/4" in. (McKesson, catalog number: 43-1-772)
Pathology metric ruler
Weighing paper or weighing boat
Spatula
Cylinder
Desiccator, 6"
SEM fixative/buffer waste bottle
Dehydration/ethanol waste bottle
Labels with study ID, protocol number, and date
Personal protective equipment (gloves, goggles, hearing protection, and scrubs/lab coats)
Equipment
Miter saw coupled with diamond blade (Miter saw DeWALT, model: DWS779; blade RIDGID, model: 12 in. dual-purpose)
Digital camera with lens (Nikon, camera model: D3300, lens model: AF-P DX NIKKOR 18-55 f/3.5-5.6G VR)
BarnsteadTM Smart2PureTM Pro Water Purification System (Thermo Fisher Scientific, catalog number: 50157873)
Gold sputter coater (Denton Vacuum, model: Desk II)
InTouchScopeTM scanning electron microscope (JEOL, model: JSM-IT100)
Impact suction unit (Envi health solutions, model: 326/326M)
Software and datasets
ImageJ (version: 1.53k, release date: 07/06/2021, free)
Analytics Software & Solutions (SAS) (version 9.4, release date: 07/2013, license needed)
Procedure
Membrane oxygenator preservation post-use
Disconnect membrane oxygenator from ECLS system pump.
Flush membrane oxygenator from the inlet port with 1× PBS and drain blood/PBS flush from the outlet port until flush exiting outlet is clear (standardize flush flow rate to the flow rate in which the ECLS device is operated).
Connect inlet and outlet tubing (10–15 cm length) into a closed loop with 3/8" × 3/8" connector (Figure 1).
Attach needleless injection port to 3/8" × 3/8" straight connector.
Inject SEM fixative into the oxygenator via a priming port using a 50 mL syringe while simultaneously withdrawing air from the oxygenator via a separate port. This process is continued until the membrane is saturated with fixative.
Store the membrane oxygenator in the refrigerator (4 °C) until ready for section B.
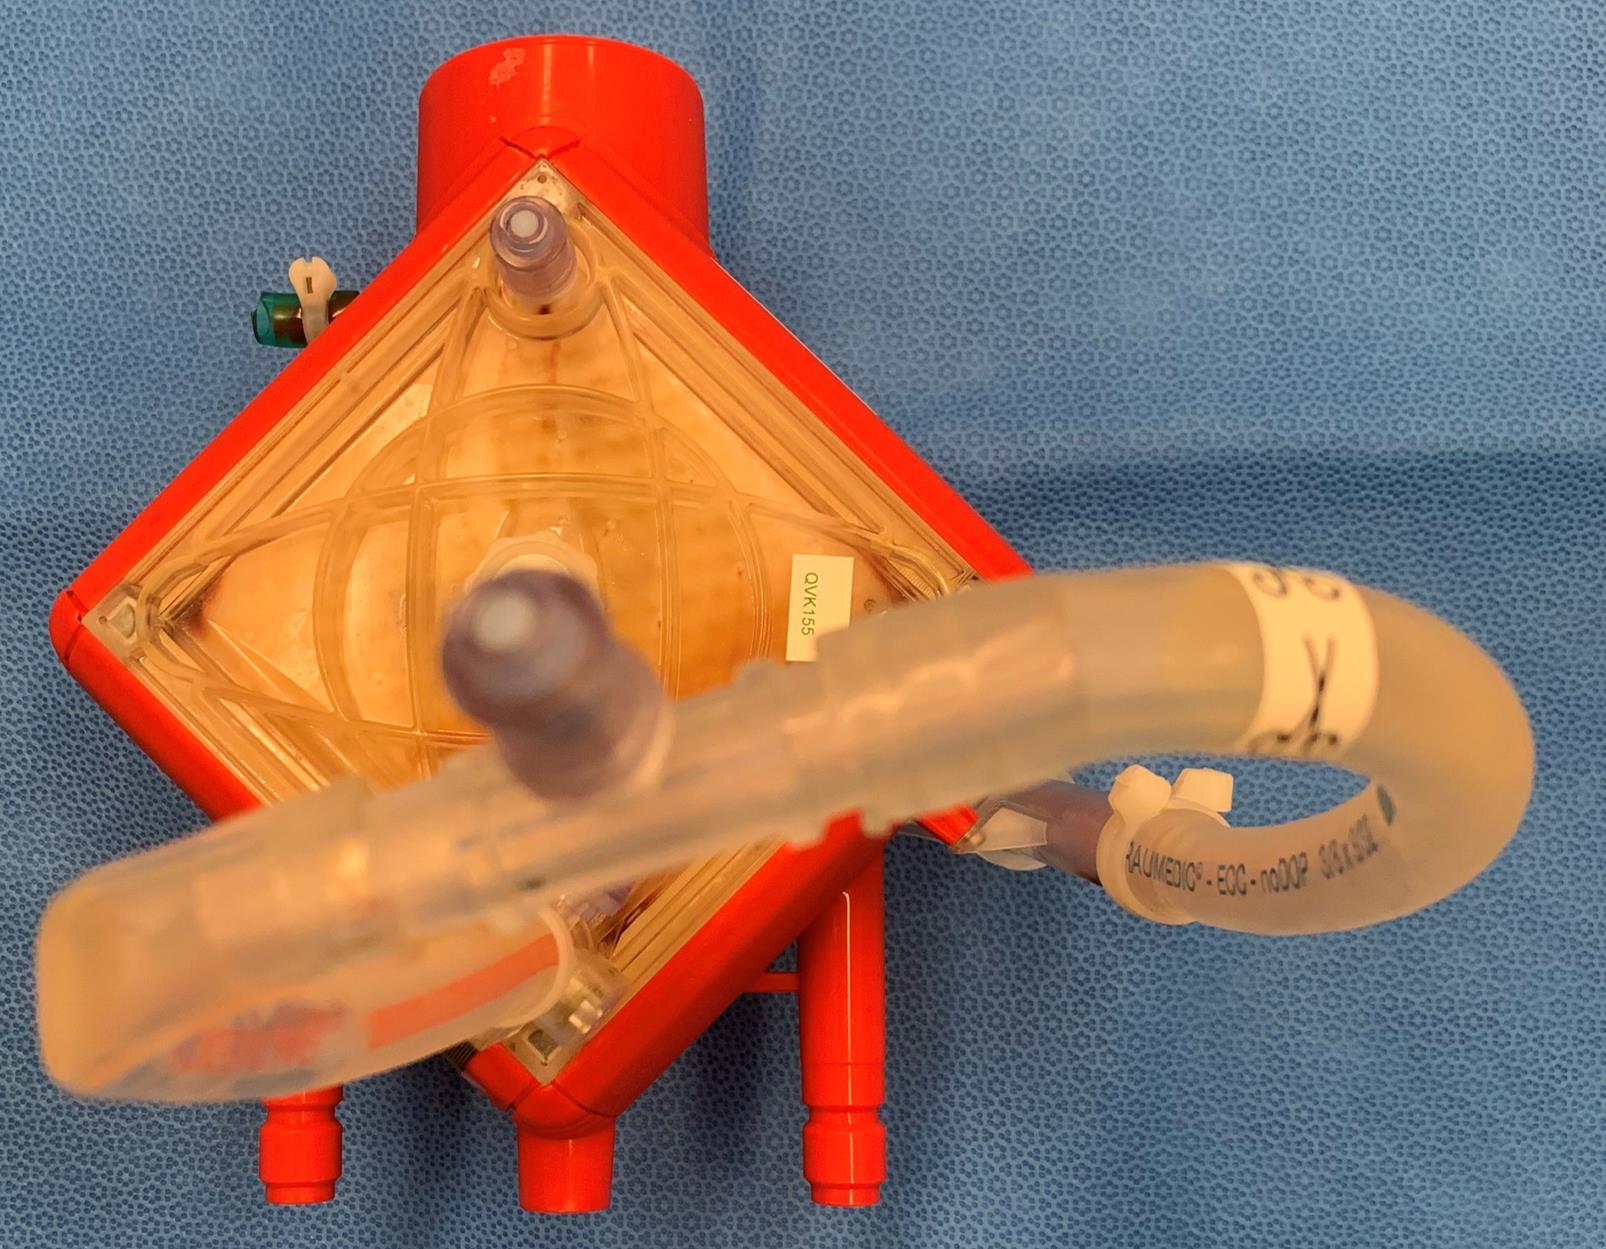
Figure 1. Membrane oxygenator preservation with SEM fixative
Membrane oxygenator disassembly (General note 1)
Drain SEM fixative slowly into SEM fixative/buffer waste bottle.
Rinse the membrane oxygenator with 500 mL of 1× PBS.
Unscrew and disassemble membrane oxygenator pump using a T10 Torx screwdriver.
Take digital images of membrane oxygenator pump, inlet face, and outlet face of the membrane oxygenator on sterilization wrap (use as a blue background) with labels and pathology metric ruler. Examples are in Figure 2.
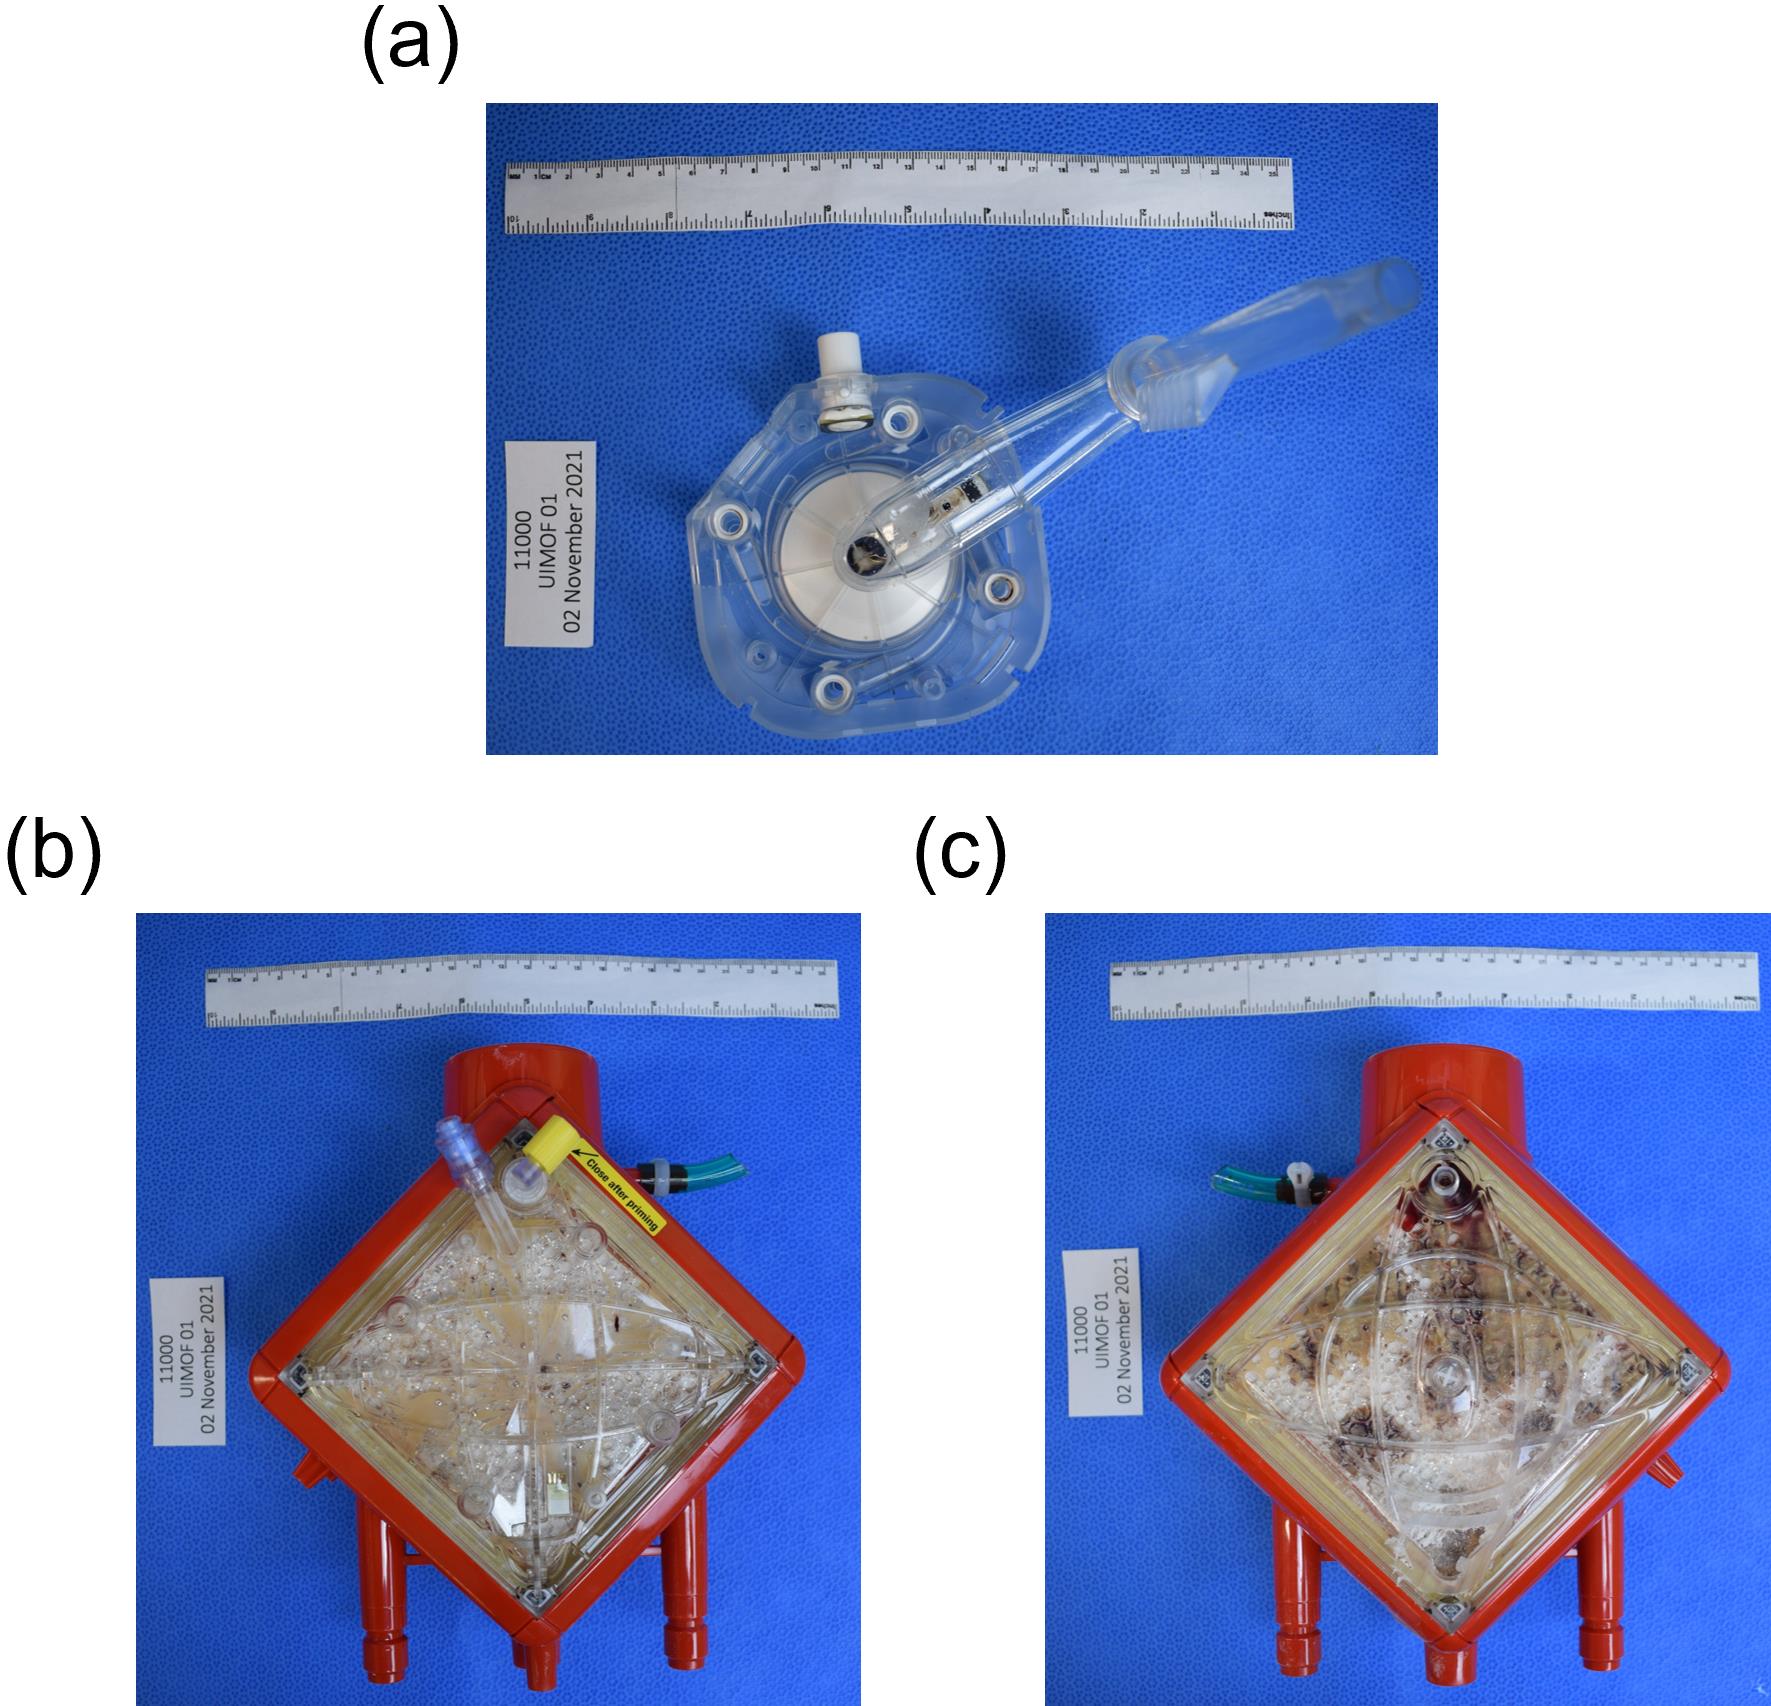
Figure 2. Example images of (a) membrane oxygenator pump, (b) inlet/top/pre-membrane/venous face of the membrane oxygenator, and (c) outlet/bottom/post-membrane/arterial face of the membrane oxygenatorCut off water connections to get a flat edge, then cut off post-membrane sample port on outlet side so that the membrane can sit flat on the miter saw table (Figure 3).
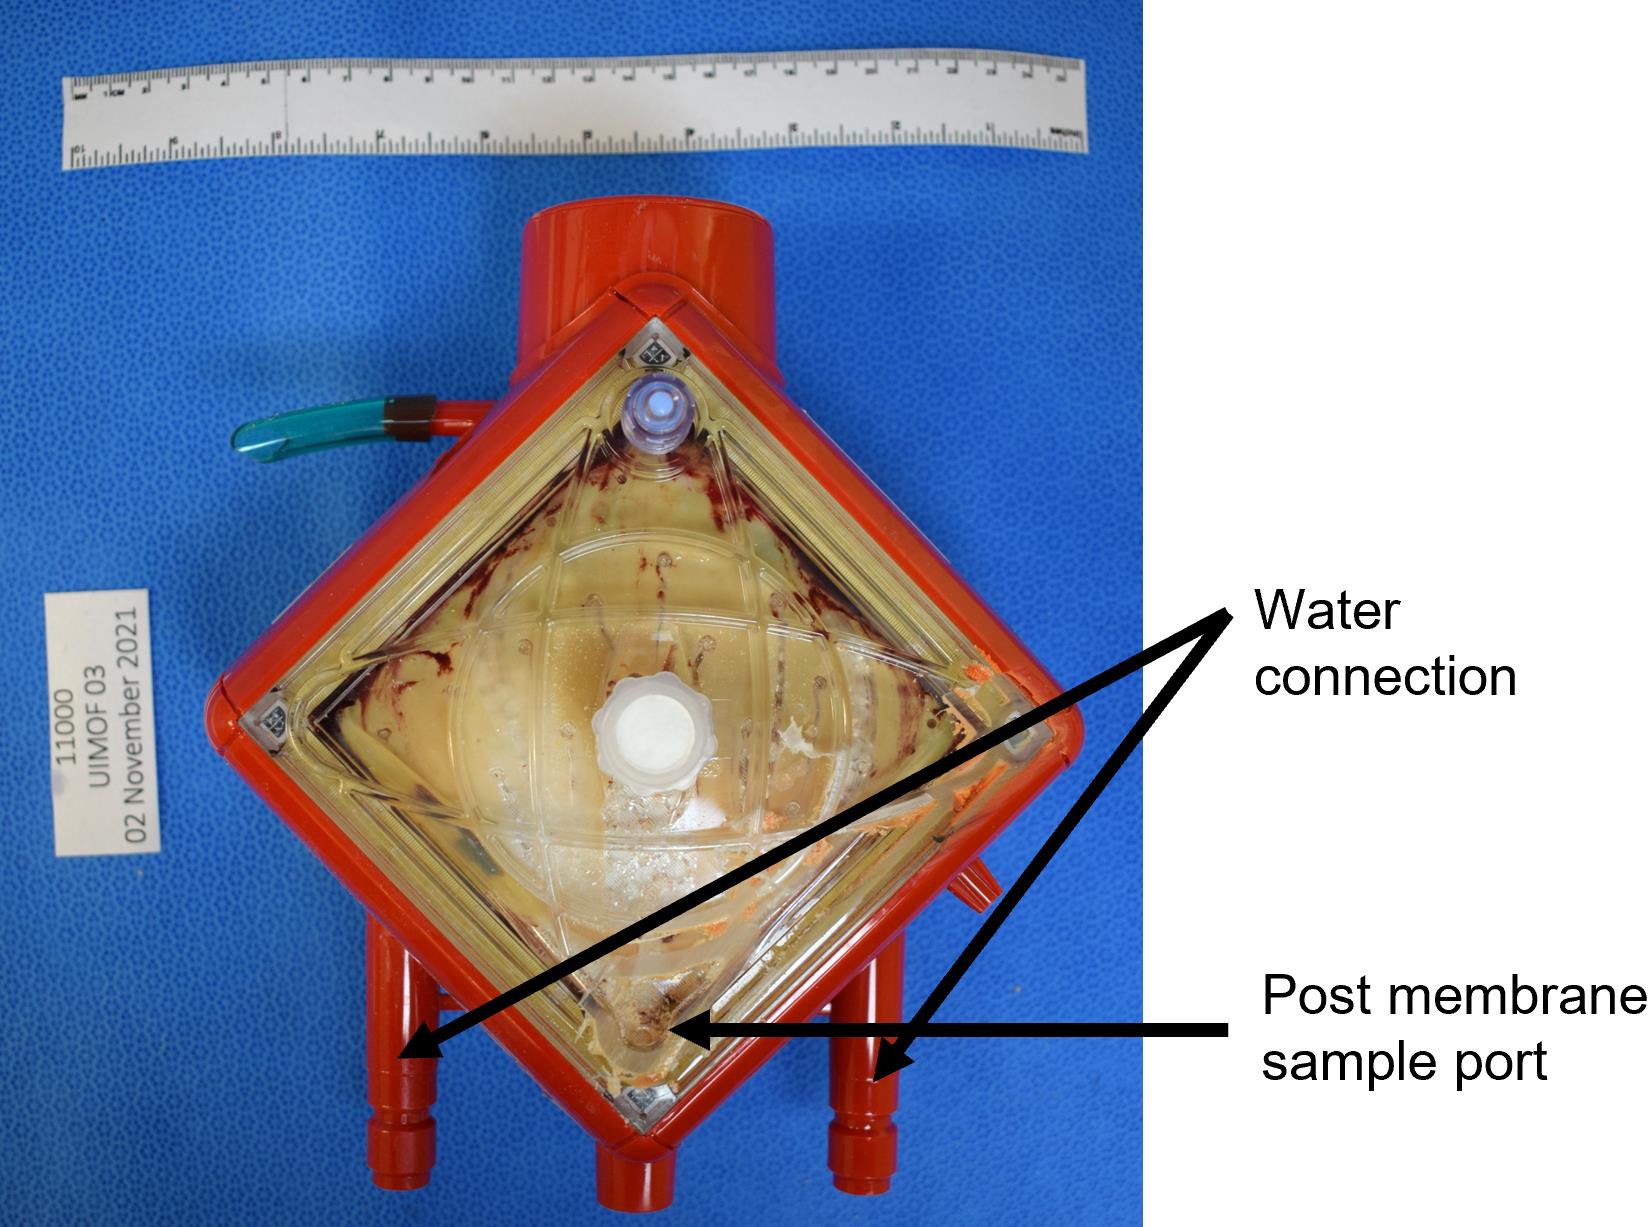
Figure 3. Examples of water connection and post-membrane sample port of a membrane oxygenatorCut the four sides of the membrane case with inlet face facing up using a miter saw coupled with vacuum system to remove debris (schematic shown in Figure 4).
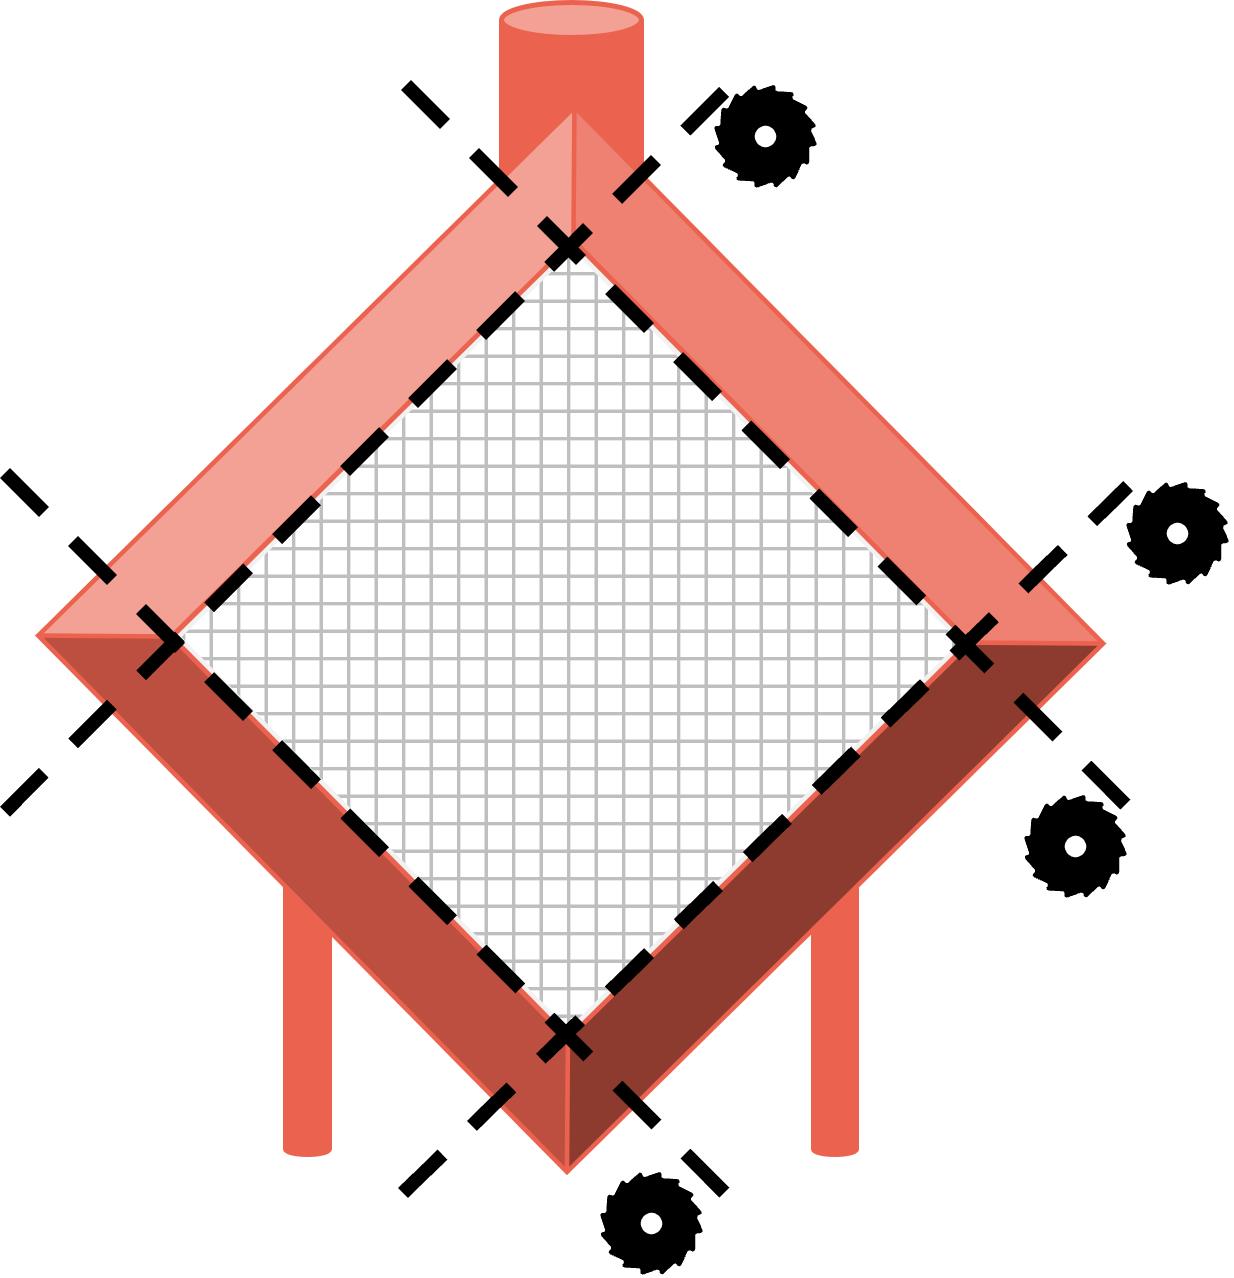
Figure 4. Schematic of membrane oxygenator dissectionGently remove inlet face plastic cover using forceps.
The first gas transfer fiber sheet should be exposed and ready for imaging.
Membrane oxygenator gas transfer fiber sheet digital imaging (Troubleshooting 1)
Gently remove gas transfer fiber sheets individually in order from inlet face to outlet face.
Place every four gas fiber sheets next to each other horizontally with total three rows.
Take digital images of every 12 gas fiber sheets with Study ID and number labels as shown in Figure 5.
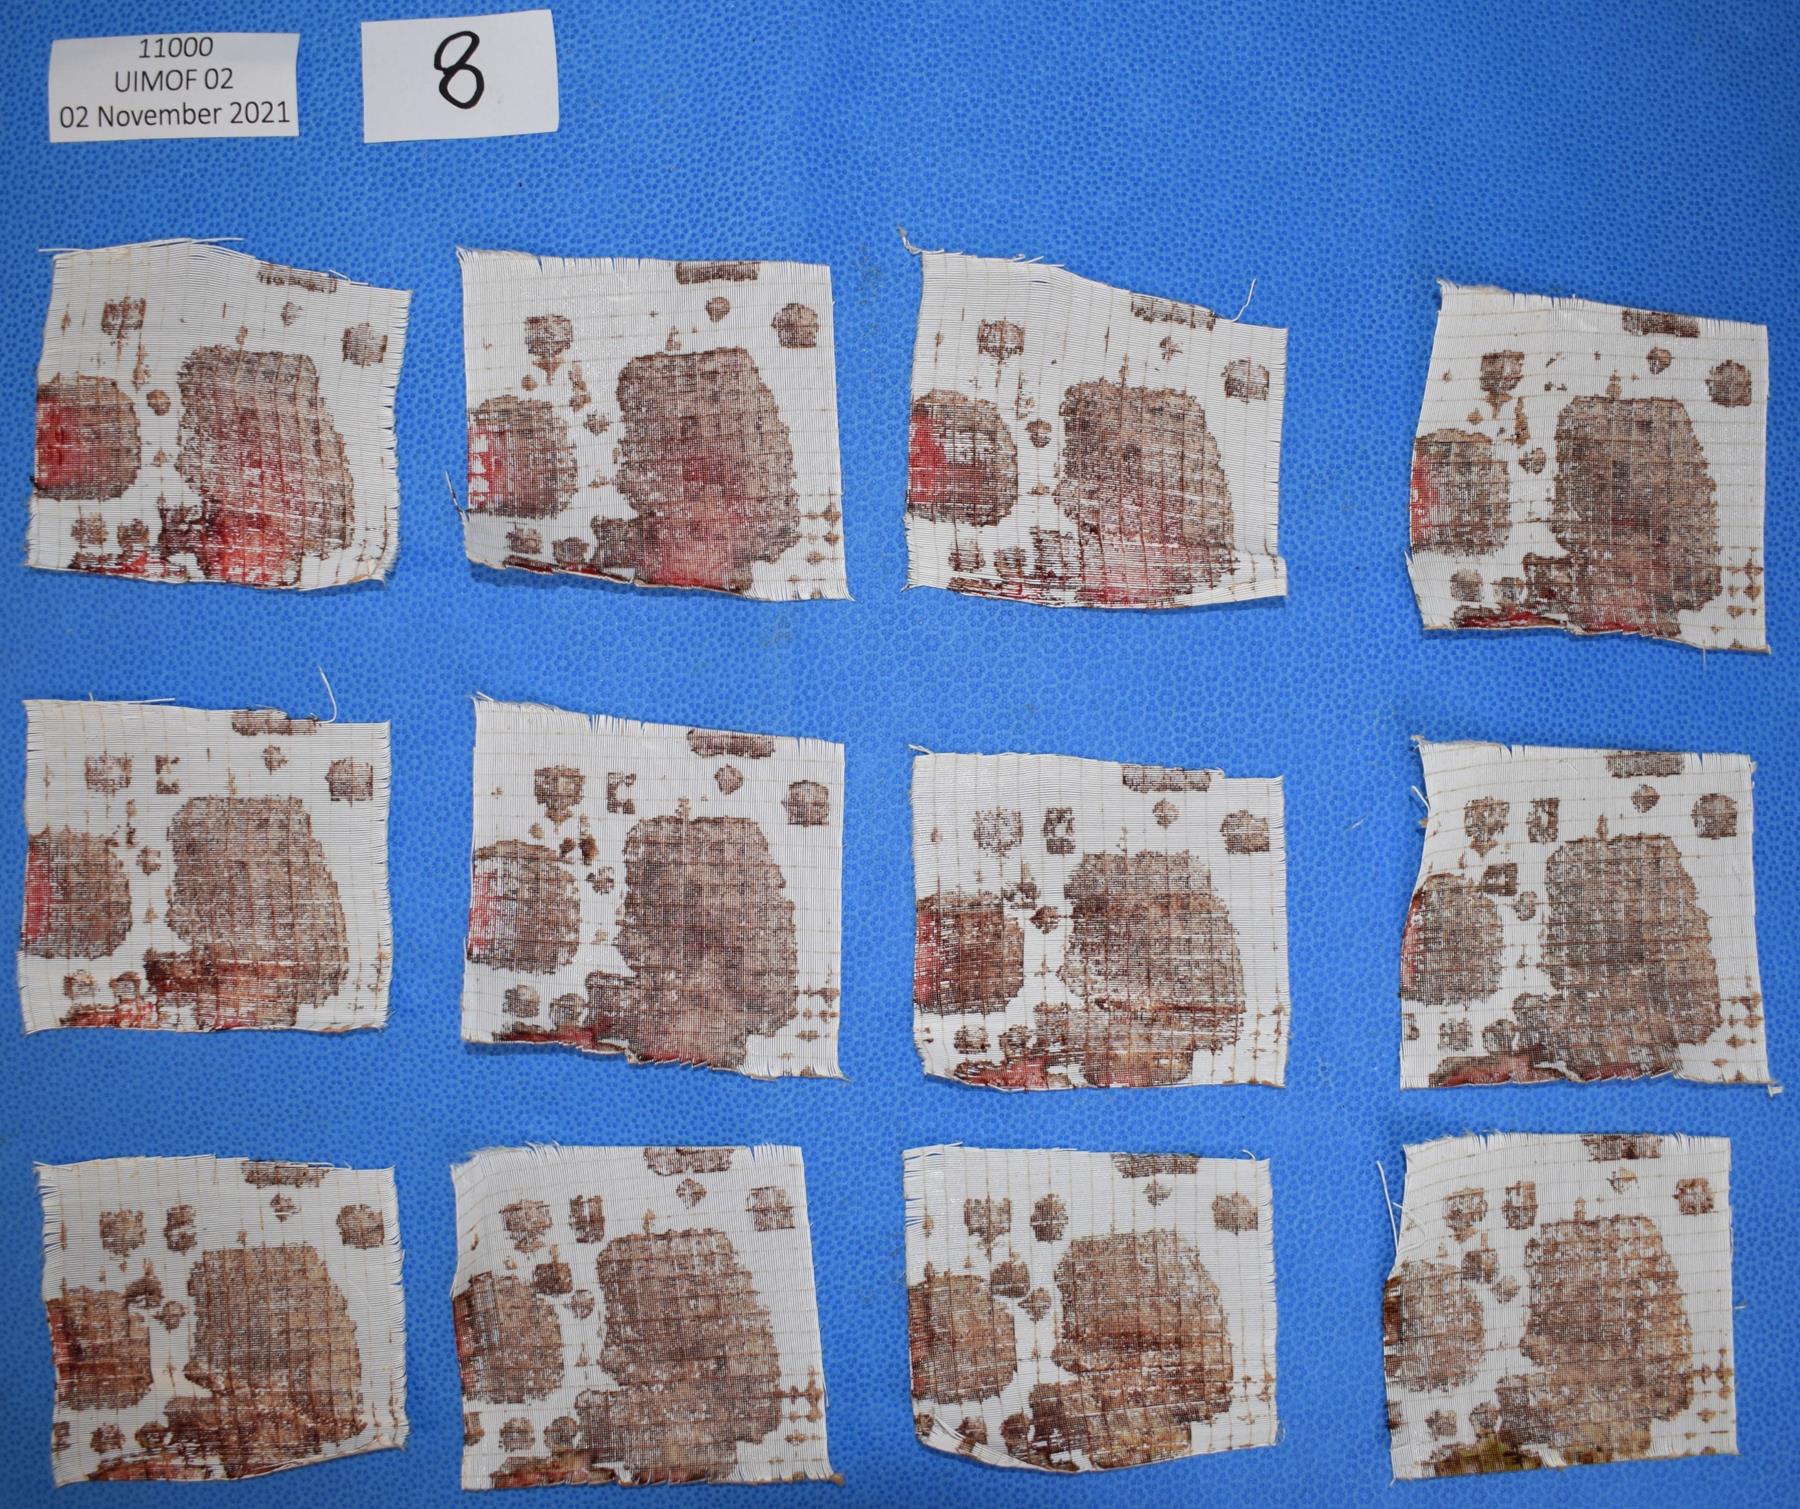
Figure 5. Layout example of membrane gas transfer fiber sheets for digital imagingTake individual images of top inlet membrane gas fiber sheet, middle membrane gas fiber sheet, and bottom outlet membrane gas fiber sheet with study ID, date, and pathology metric ruler as shown in Figure 6.
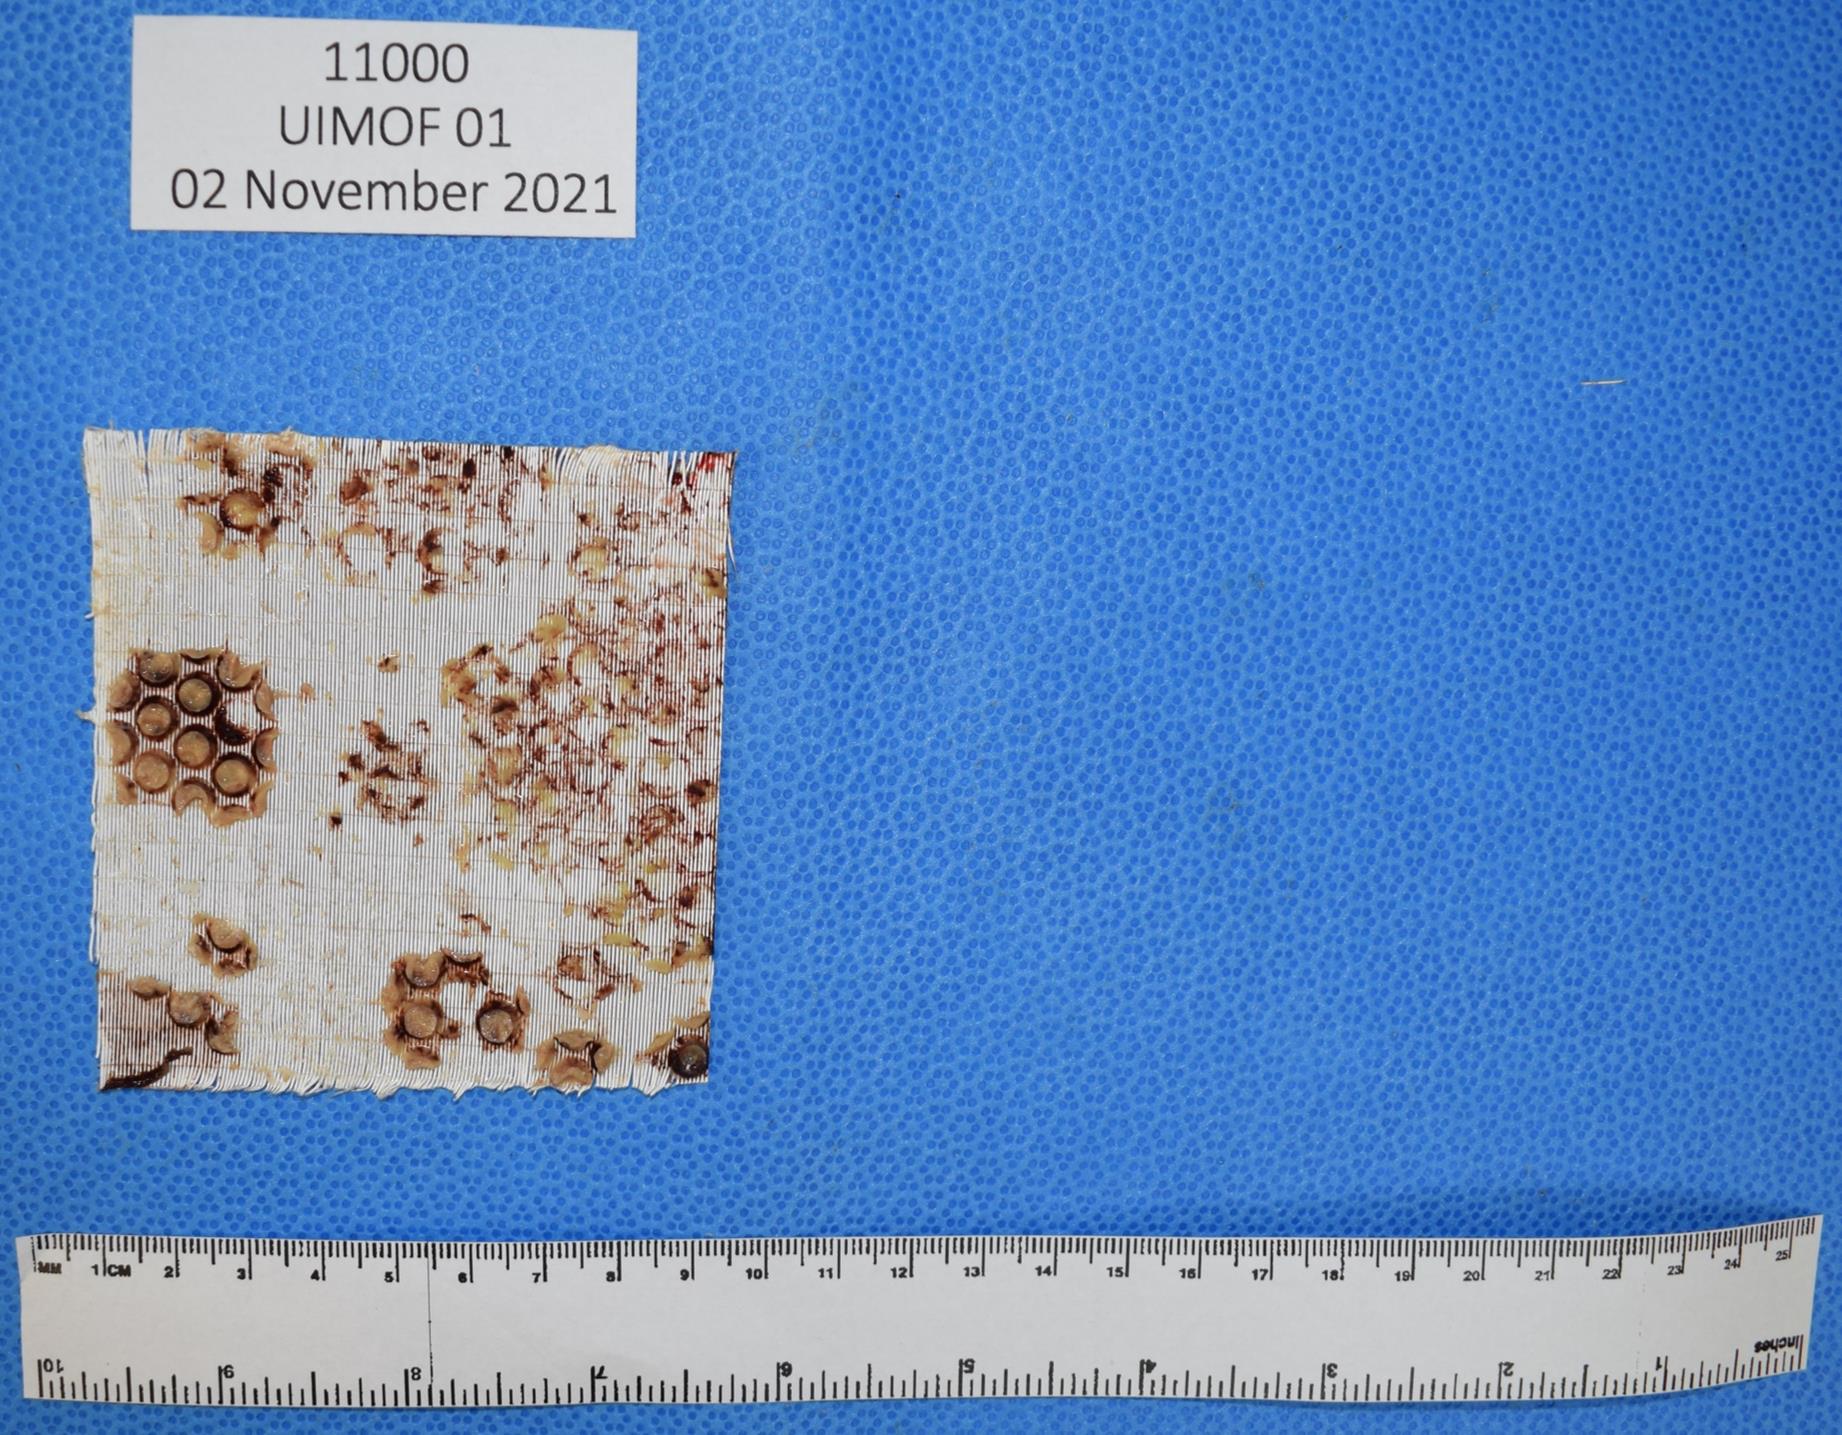
Figure 6. Example of individual membrane gas fiber sheet for digital imagingCut top inlet, middle, and bottom outlet membrane gas transfer fiber sheets each into nine squares (total 27 squares). Number squares from top inlet membrane gas fiber sheet from 1 through 9, middle membrane gas fiber sheet from 10 through 18, and bottom outlet membrane gas fiber sheet from 19 through 27, as shown in Figure 7.
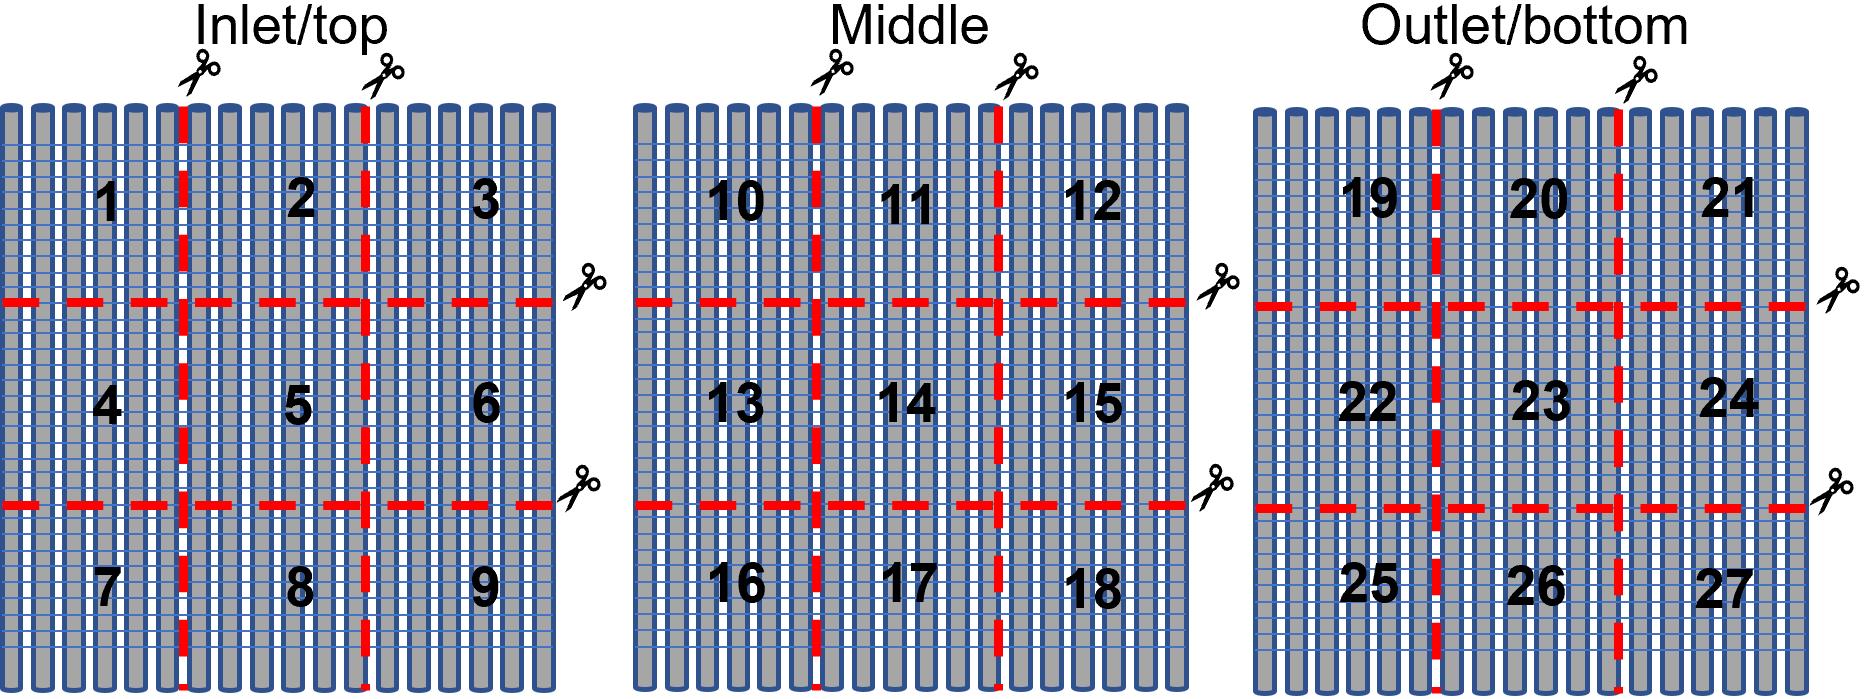
Figure 7. Schematic diagram of cutting individual membrane gas fiber sheets and numbering. Numbers 1–9 are assigned to inlet/top membrane gas fiber sheet (left), numbers 10–18 are assigned to middle membrane gas fiber sheet (middle), and numbers 19–27 are assigned to outlet/bottom membrane gas fiber sheet (right).Place randomly selected squares into labeled cassettes with the surface that was closest to the membrane inlet facing the lid of the cassette facing upward.
Place cassettes with sample into 120 mL container, add SEM fixative, and store in refrigerator (4 °C) until ready for section D.
SEM sample dehydration (General Note 2)
Drain SEM fixative from each container into SEM fixative/buffer waste bottle.
Add SEM buffer into each container and incubate for 10 min; drain SEM buffer into SEM fixative/buffer waste bottle.
Add 30% dehydrant into each container and incubate for 10 min; drain 30% dehydrant into dehydrant/ethanol waste bottle.
Add 50% dehydrant into each container and incubate for 10 min; drain 50% dehydrant into dehydrant/ethanol waste bottle.
Add 70% dehydrant into each container and incubate for 10 min; drain 70% dehydrant into dehydrant/ethanol waste bottle.
Add 100% dehydrant into each container and incubate for 10 min; drain 100% dehydrant into dehydrant/ethanol waste bottle.
Add 100% dehydrant into each container and incubate for 10 min; drain 100% dehydrant into dehydrant/ethanol waste bottle.
Place container with samples into desiccator overnight under vacuum.
After overnight vacuum drying, fill 1/5 of the container with silica gel desiccant beads and close the lid tightly.
Keep the container with samples at room temperature until ready to do SEM imaging.
SEM imaging
SEM sample preparation (Figure 8)
Attach sample onto an SEM sample holder using double-sided conductive carbon tape.
Sputter coat with 20 nm of gold nanoparticles using Denton Vacuum Desk II Gold sputter coater.
Tape the opposite borders of the sample with conductive copper tape perpendicular to the sample fibers.
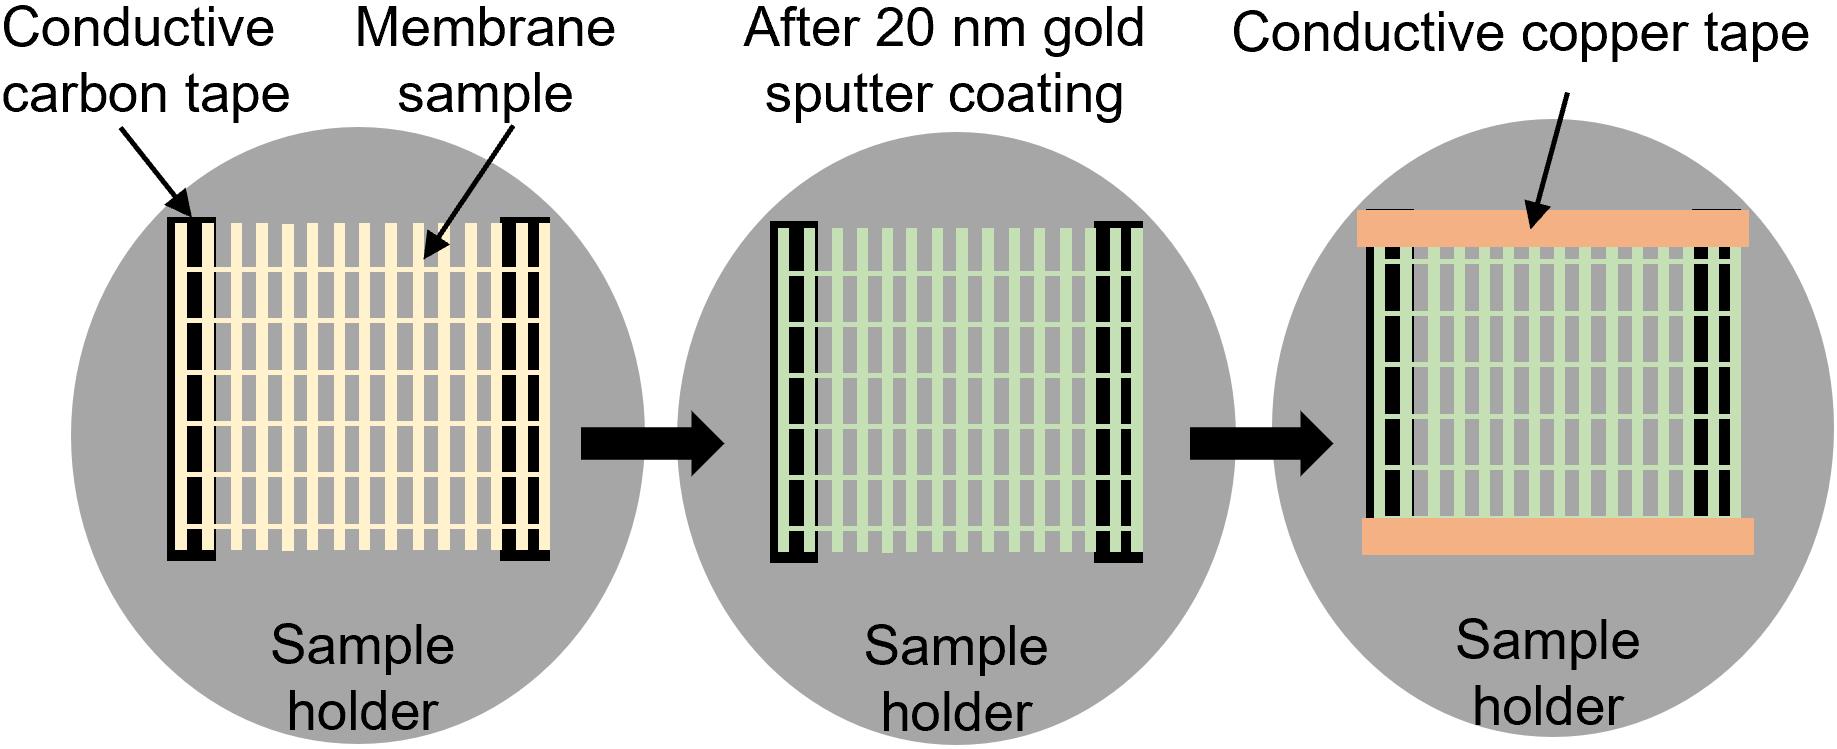
Figure 8. Schematic of SEM sample preparation process
SEM imaging for percentage of clot deposition quantitative analysis
Set up 14 kV accelerating voltage with 14 mm working distance using InTouchScopeTM scanning electron microscope.
Take images at 25× magnification horizontally from the upper left corner of sample to the lower right corner to cover the entire surface of each sample.
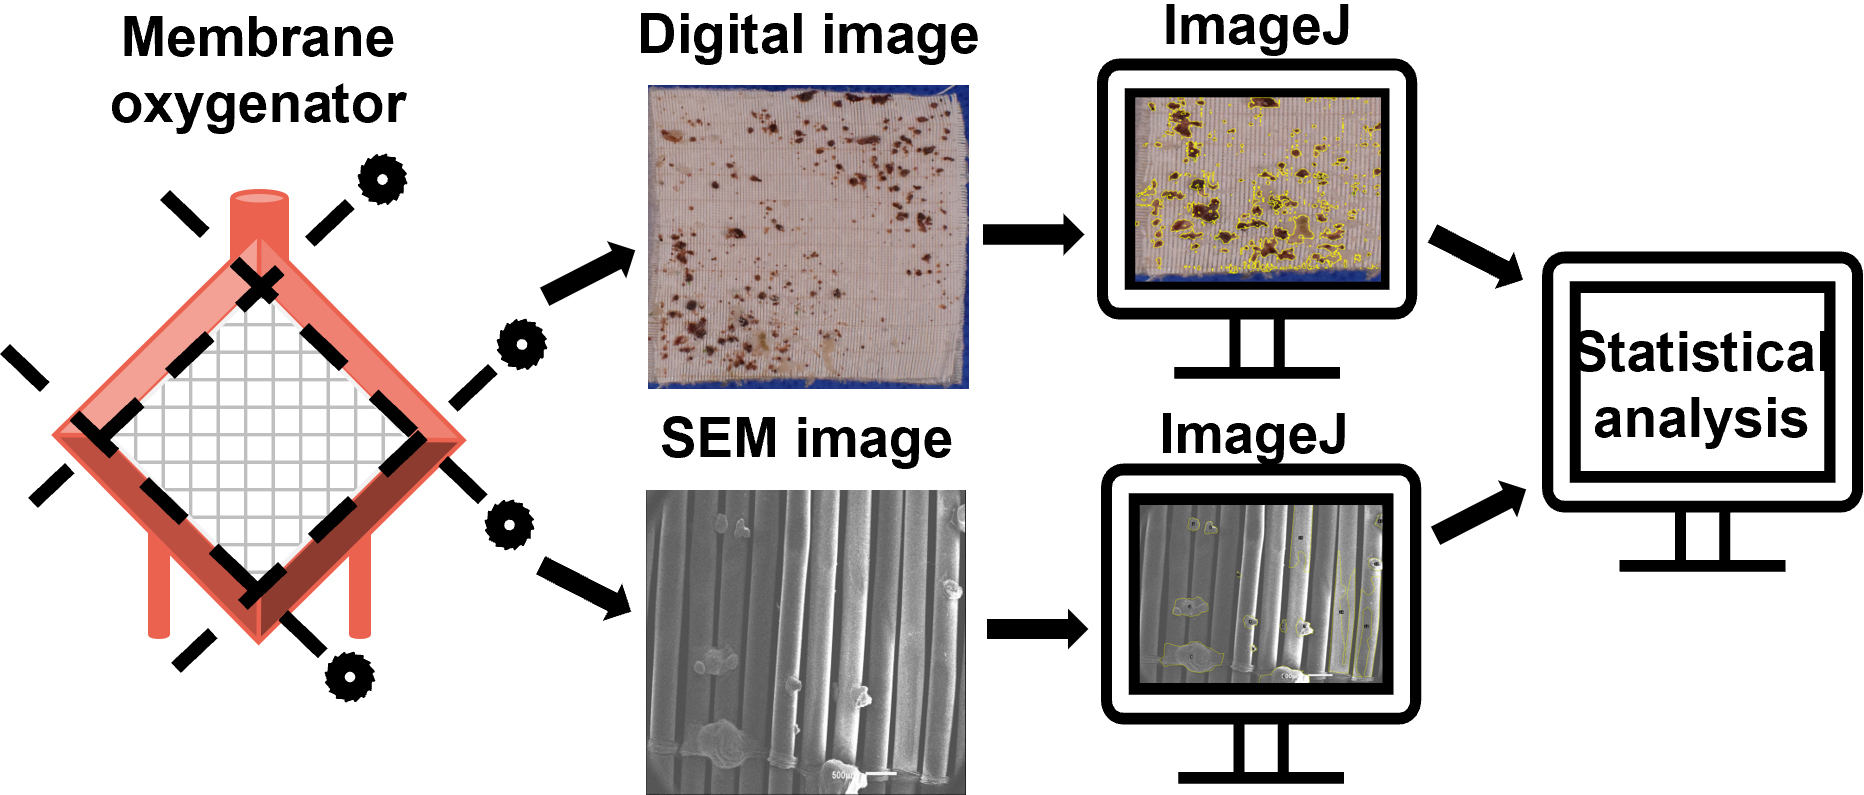
Quantitative analysis of digital images using ImageJ
Open ImageJ software and open the image for analysis. Click File and select Open to open an image.
Set up scale of the image (Figure 9).
Click Analyze and select Set Scale…
Enter 0 next to Known distance.
Enter pixels next to Unit of length.
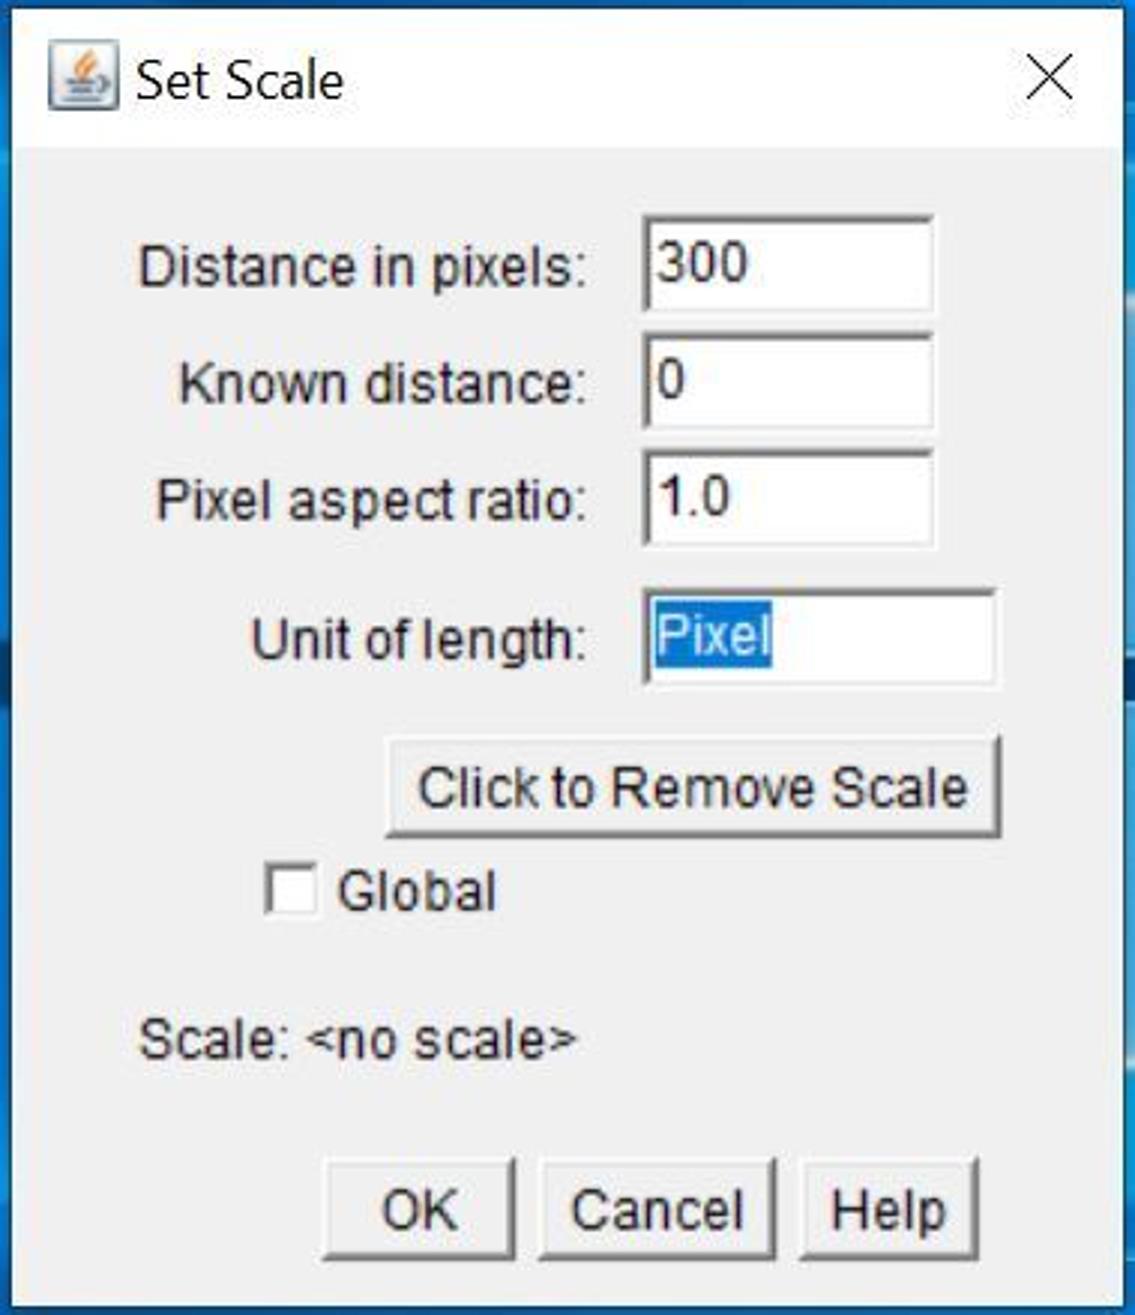
Figure 9. Screenshot of Set Scale window
Select total area of interest (Figure 10).
Click Image, Adjust, and then Color Threshold…
Set Thresholding method as Default.
Set Color space as HSB to start and change to RGB if needed.
Check Dark background box.
Set threshold to cover the entire surface of the membrane gas fibers and exclude blue background.
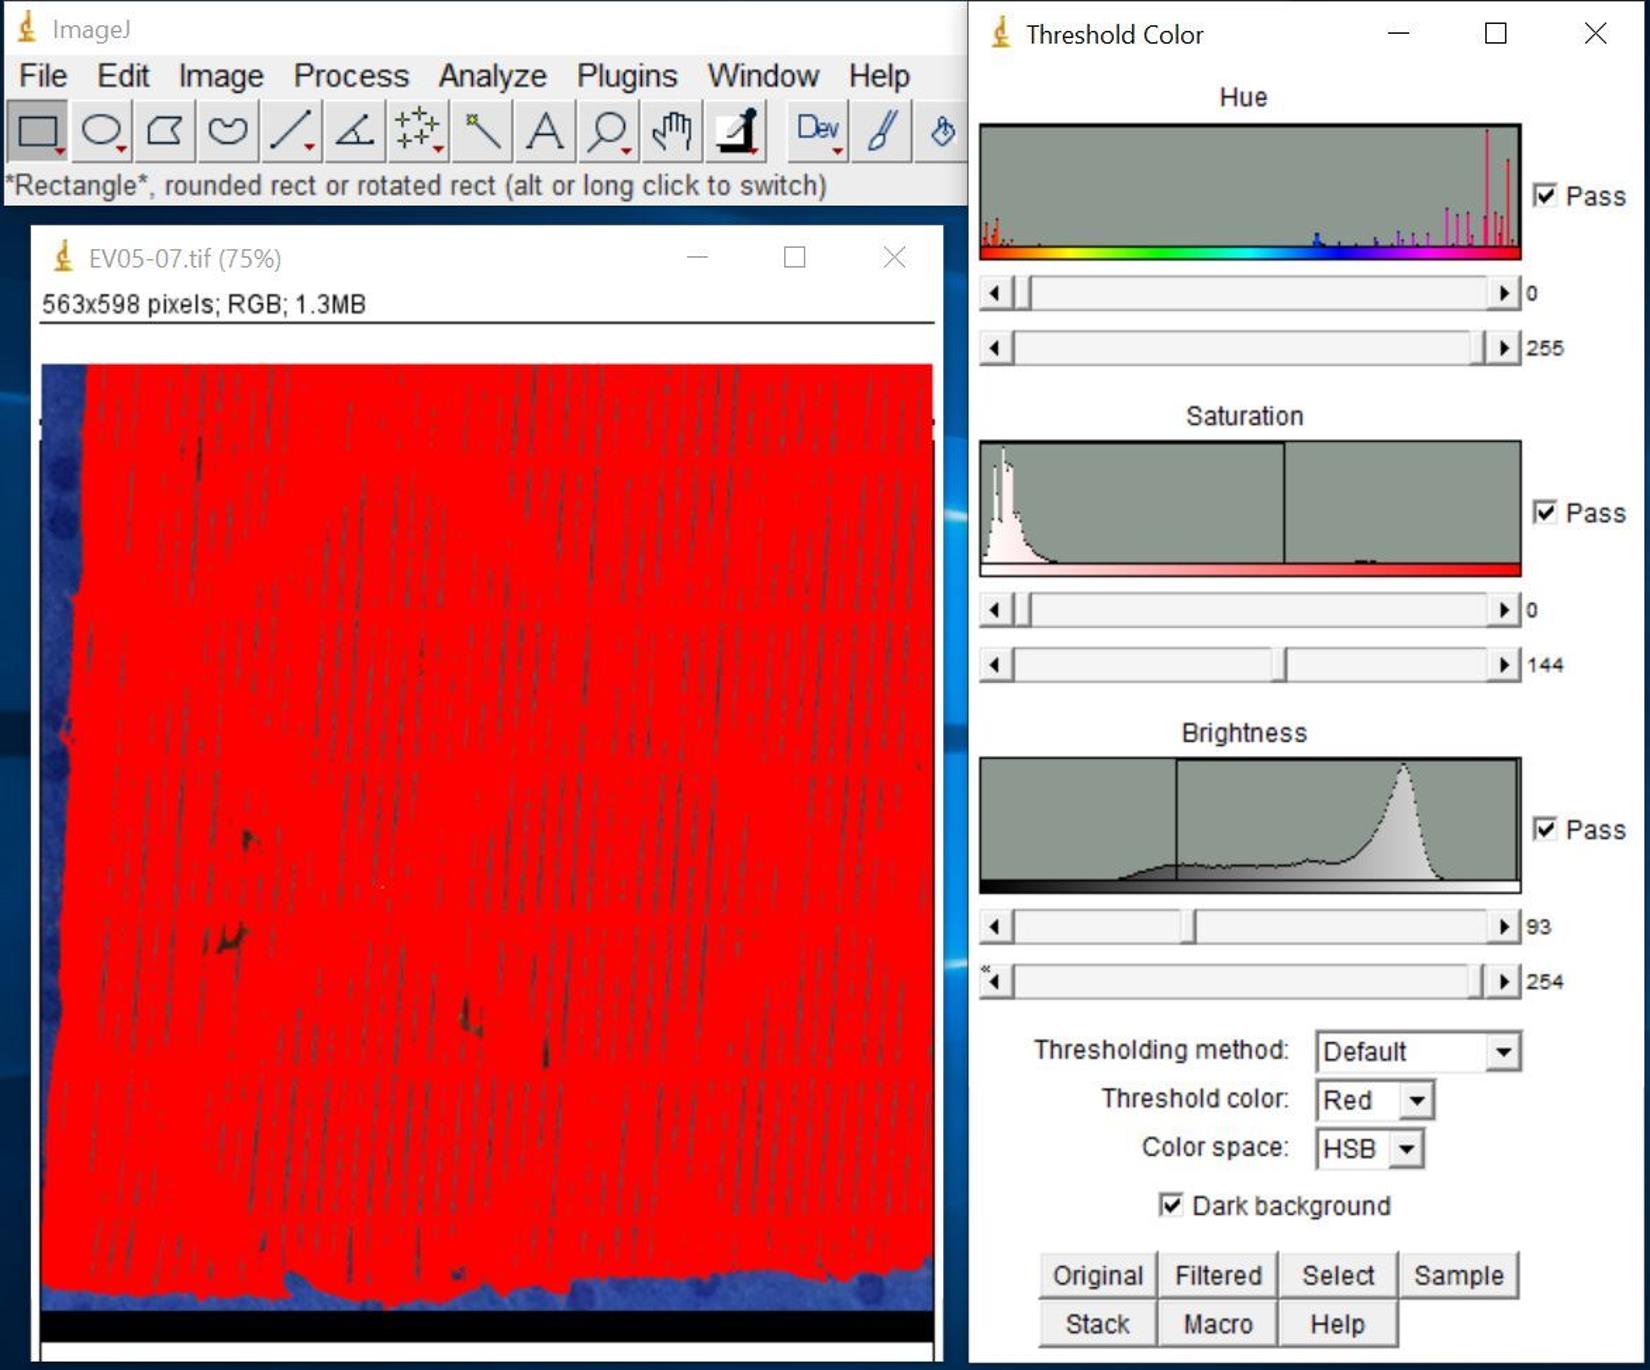
Figure 10. Screenshot after selecting total area of interestClick Select to highlight the total area of interest (Figure 11).
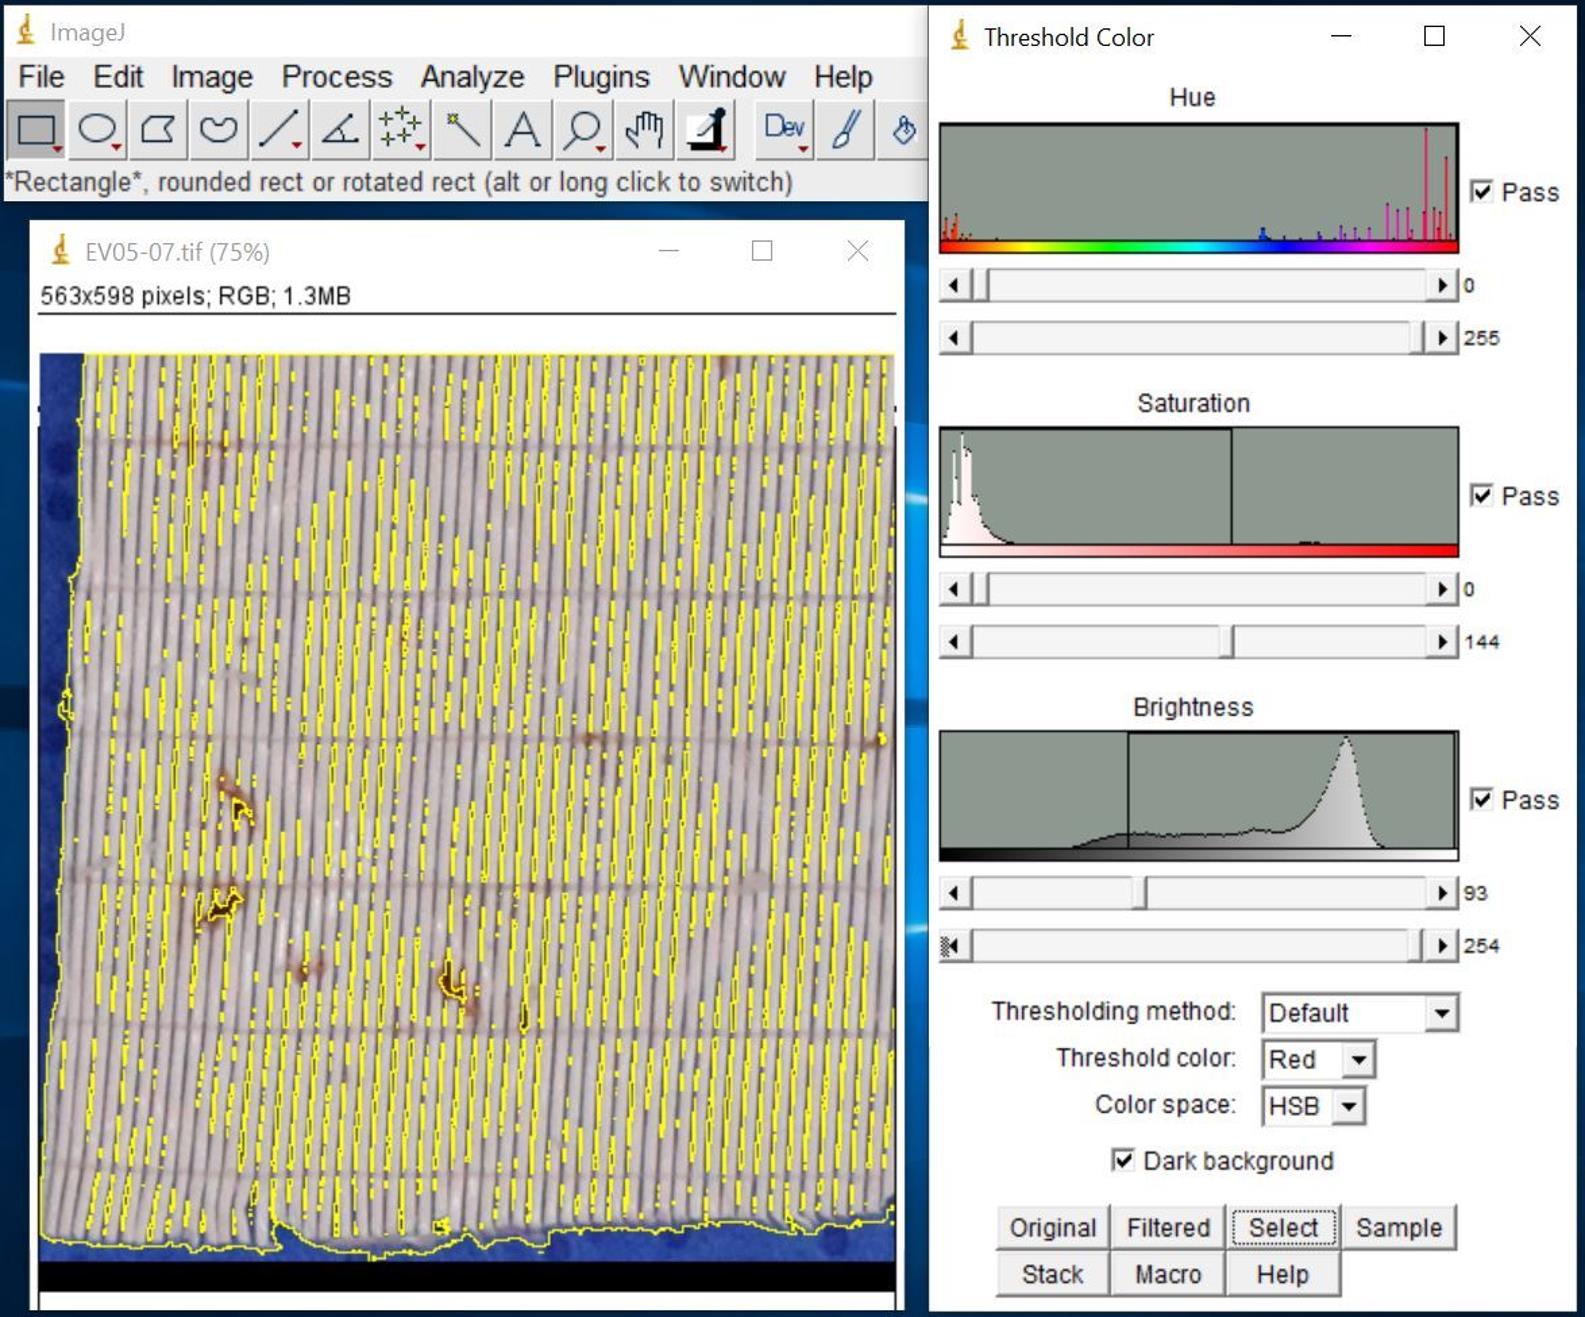
Figure 11. Screenshot of highlighted total area of interest after selectionClick Analyze and select Measure to show the results in Results window (Figure 12).
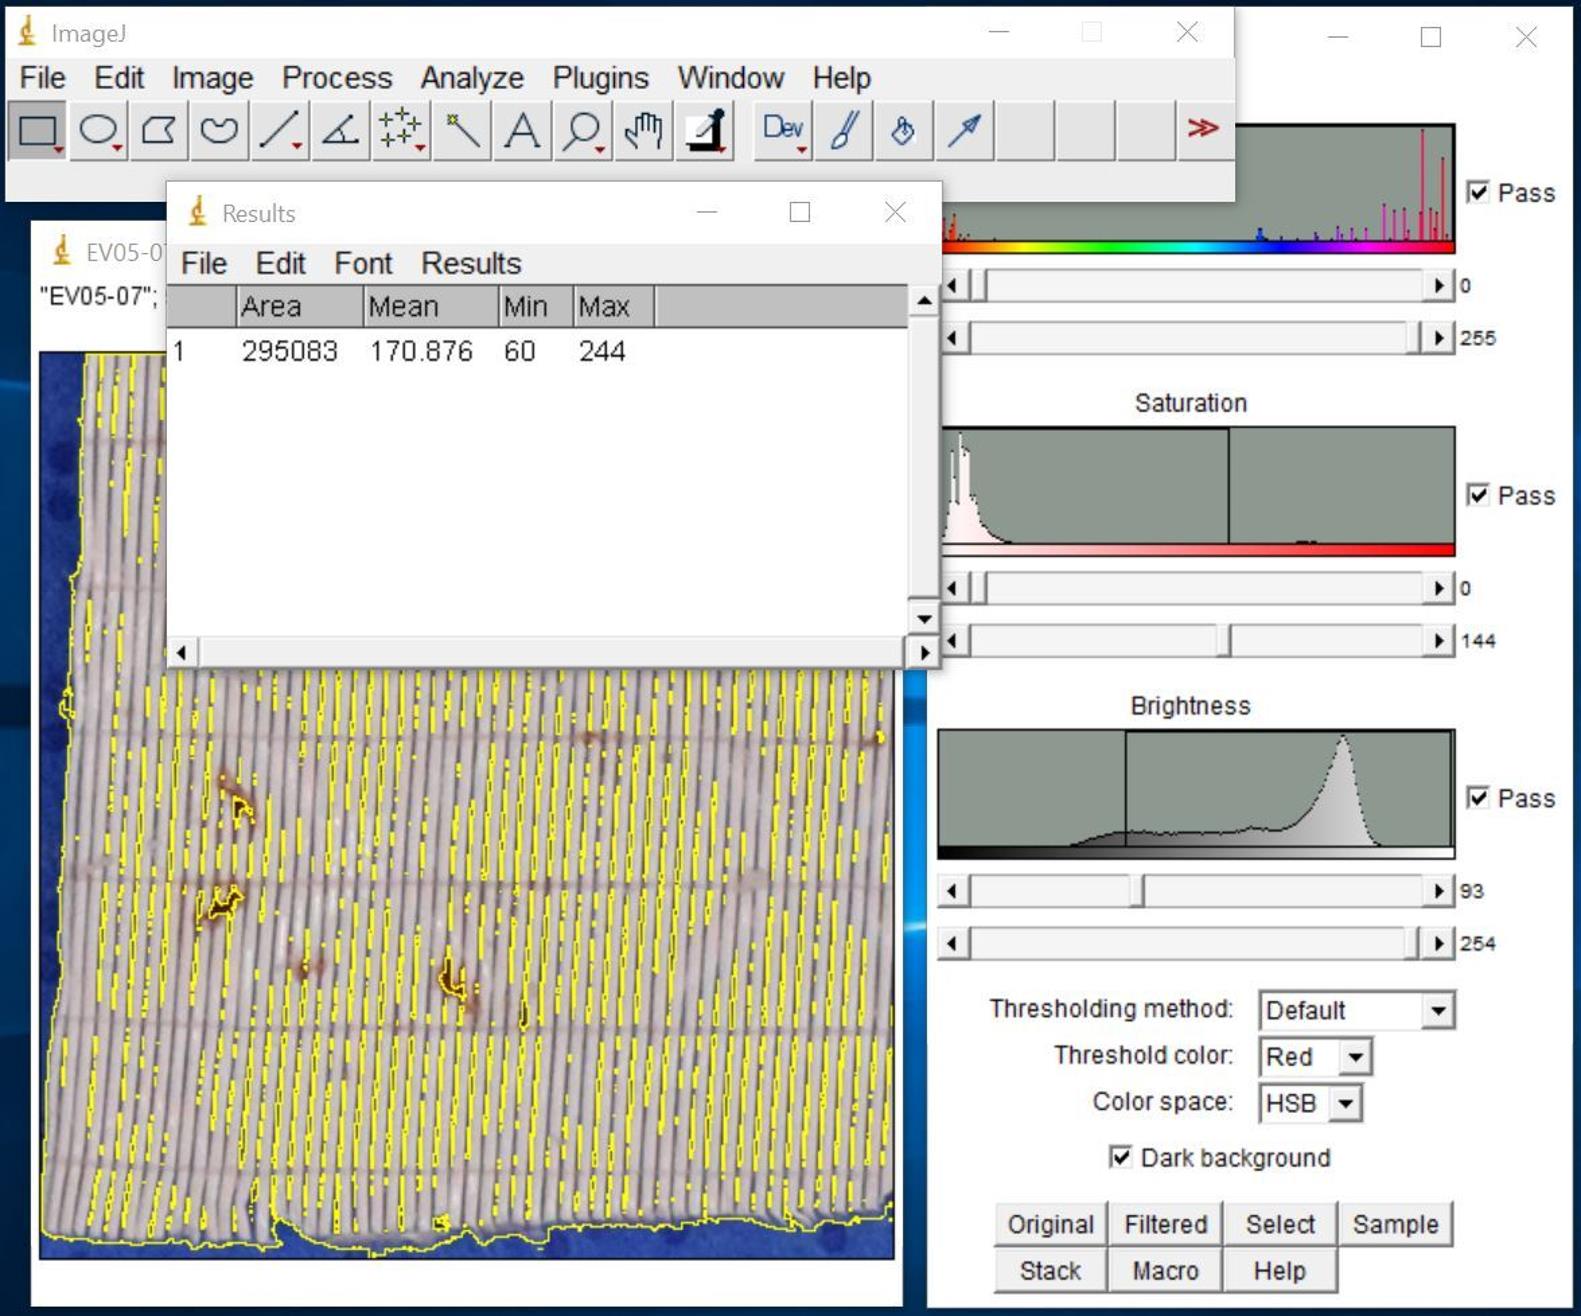
Figure 12. Screenshot of Results windowEnter the Area value into the Excel spreadsheet as total area.
Select clot deposition area of interest (Figure 13).
Click Original on the Threshold Color window to revert to the original image.
Adjust threshold to cover clot deposition area only.
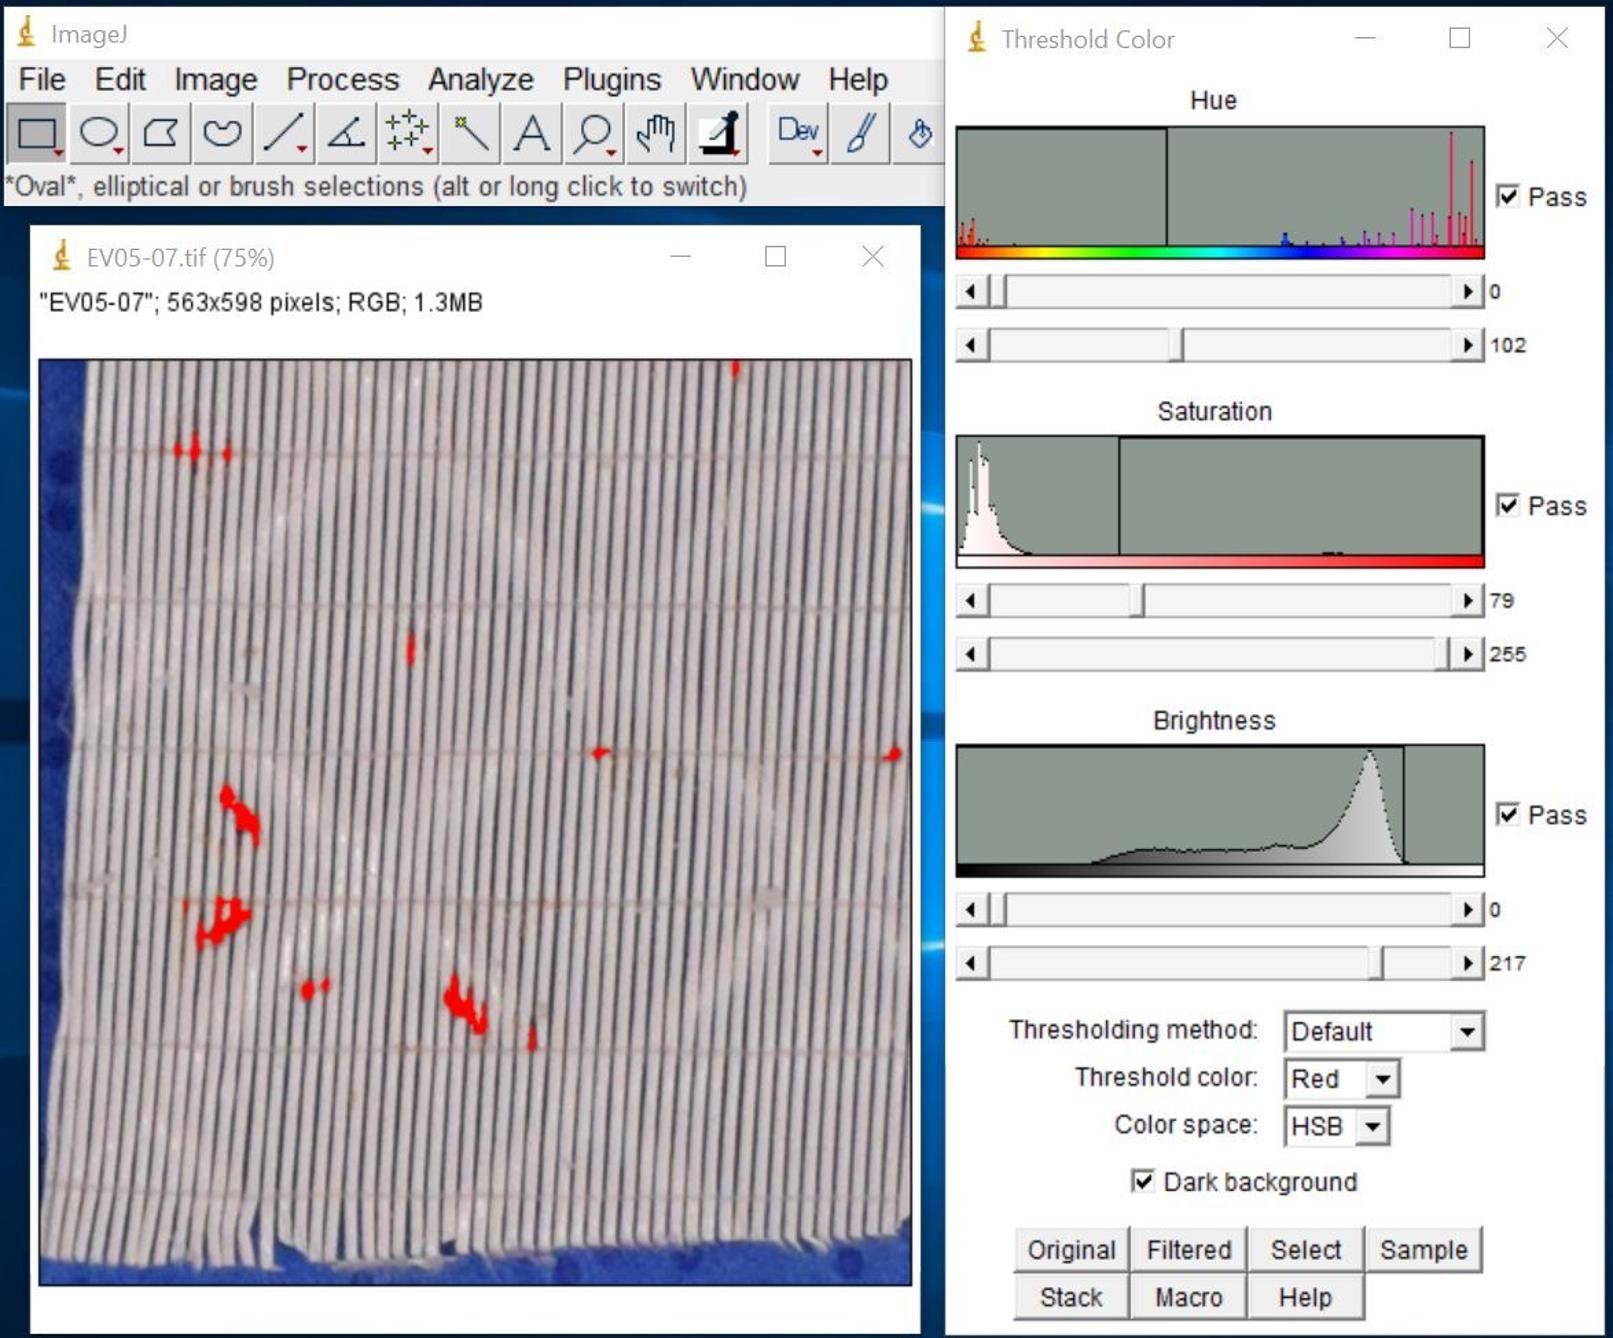
Figure 13. Screenshot after selecting clot deposition area of interestClick Select to highlight the clot deposition area.
Click Analyze and select Measure to show the results in Results window.
Enter the Area value into the spreadsheet as clot deposition area.
Calculate percentage of coverage using clot deposition area and total area on the spreadsheet (an example is shown below, Figure 14).
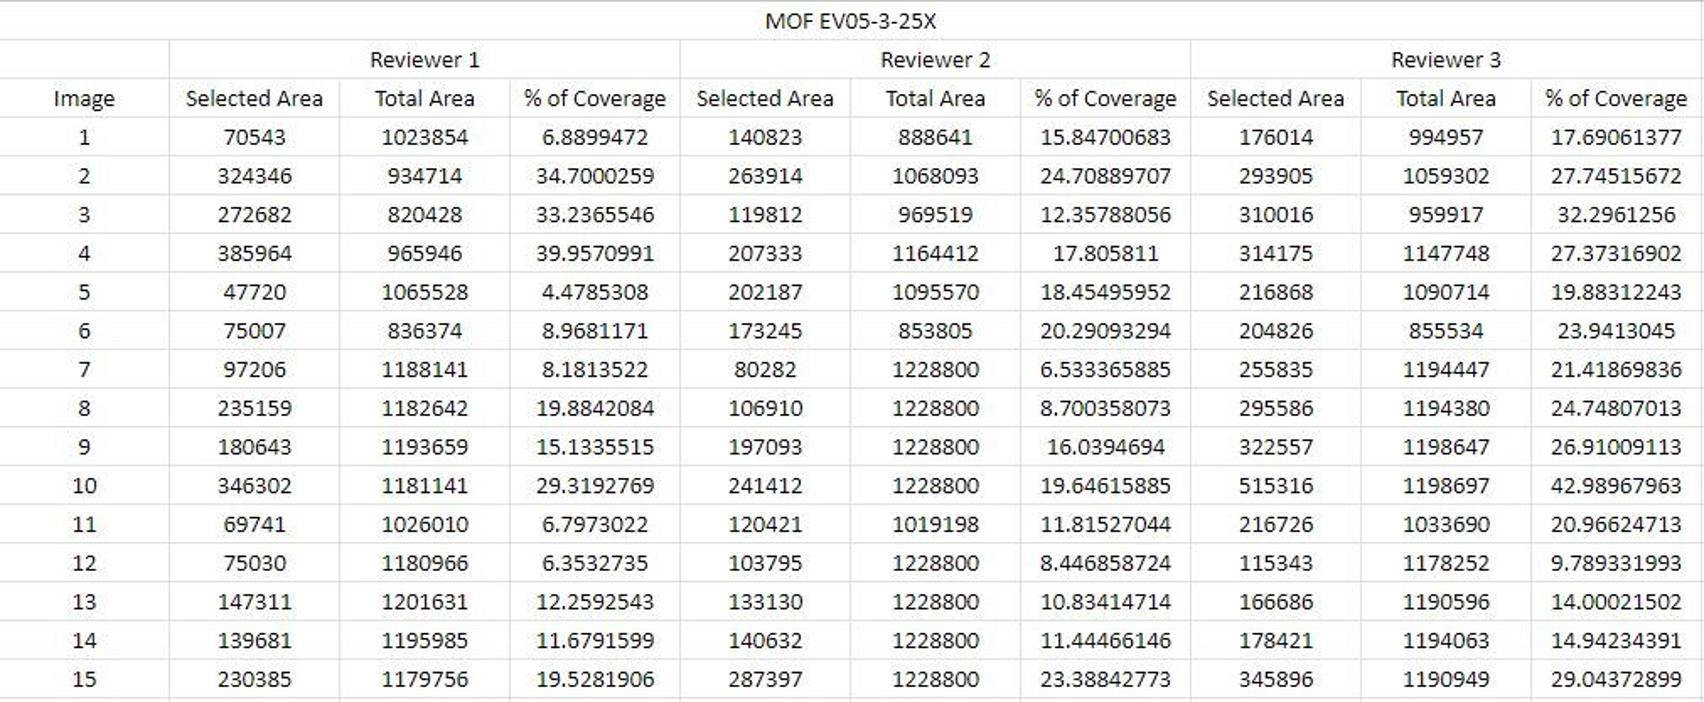
Figure 14. Screenshot of a calculation spreadsheet example
Quantitative analysis of SEM images using ImageJ (General Note 3)
Open ImageJ software and open the image for analysis. Click File and select Open to open an image.
Set up scale of the image.
Click Straight line icon and draw a line on the scale bar (Figure 15).
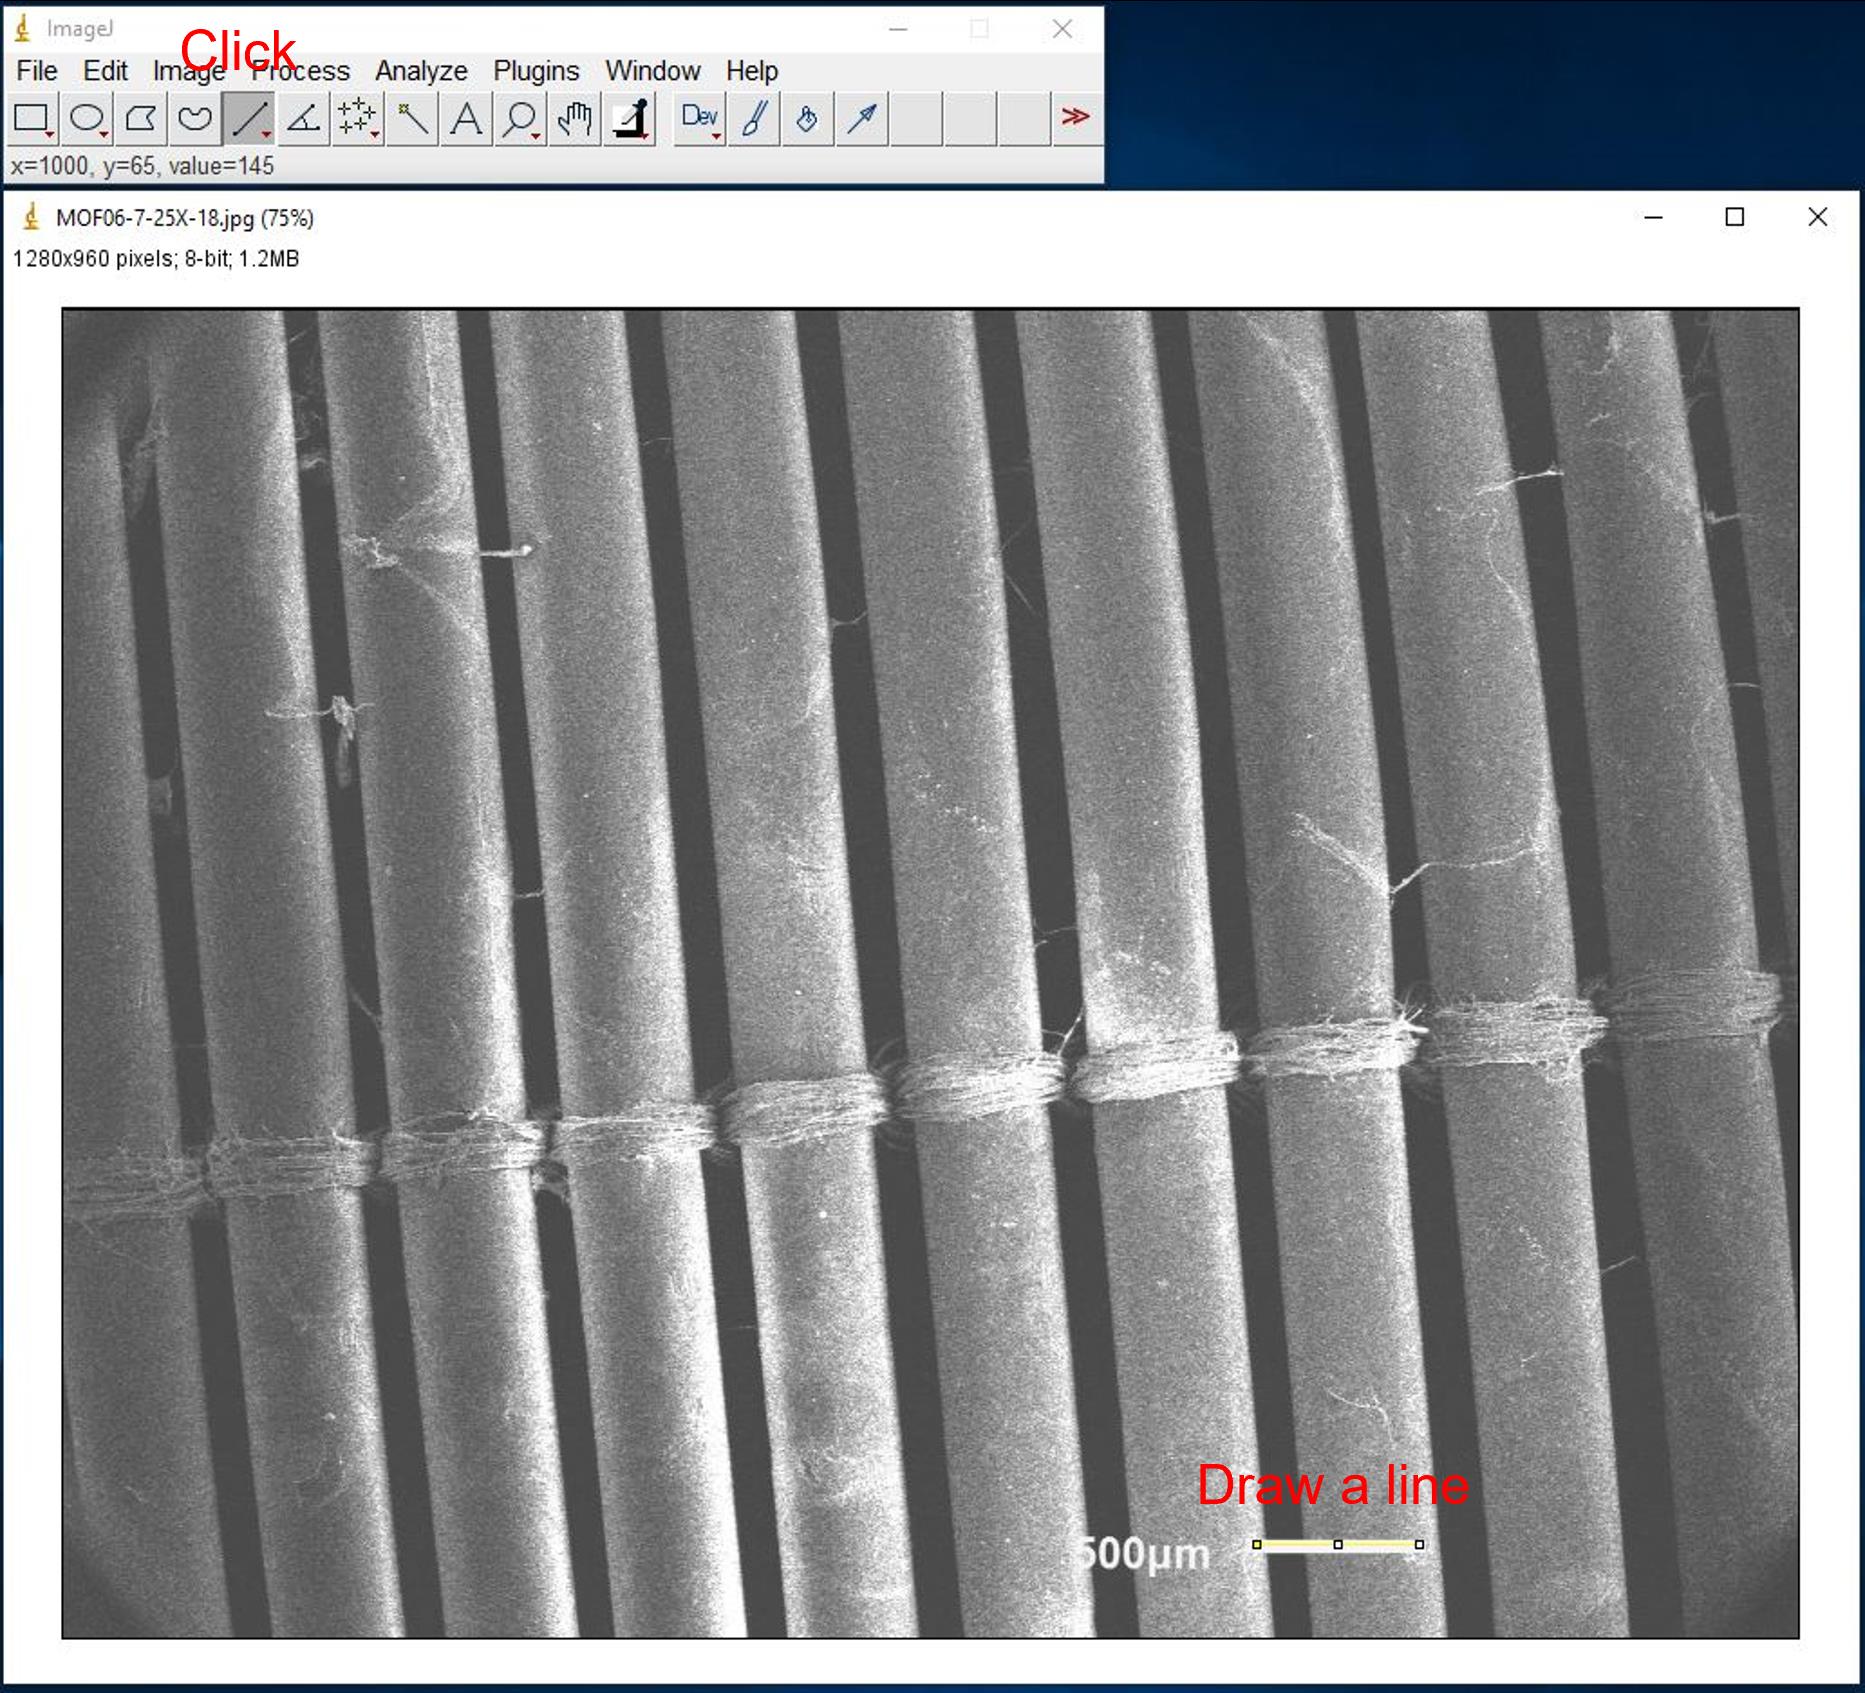
Figure 15. Screenshot of setting up scale for SEM imagesClick Analyze and select Set Scale… to change unit from pixel to micrometer (Figure 16).
Enter scale bar value next to Known distance (Figure 16).
Enter scale bar unit next to Unit of length (Figure 16).
Click OK.
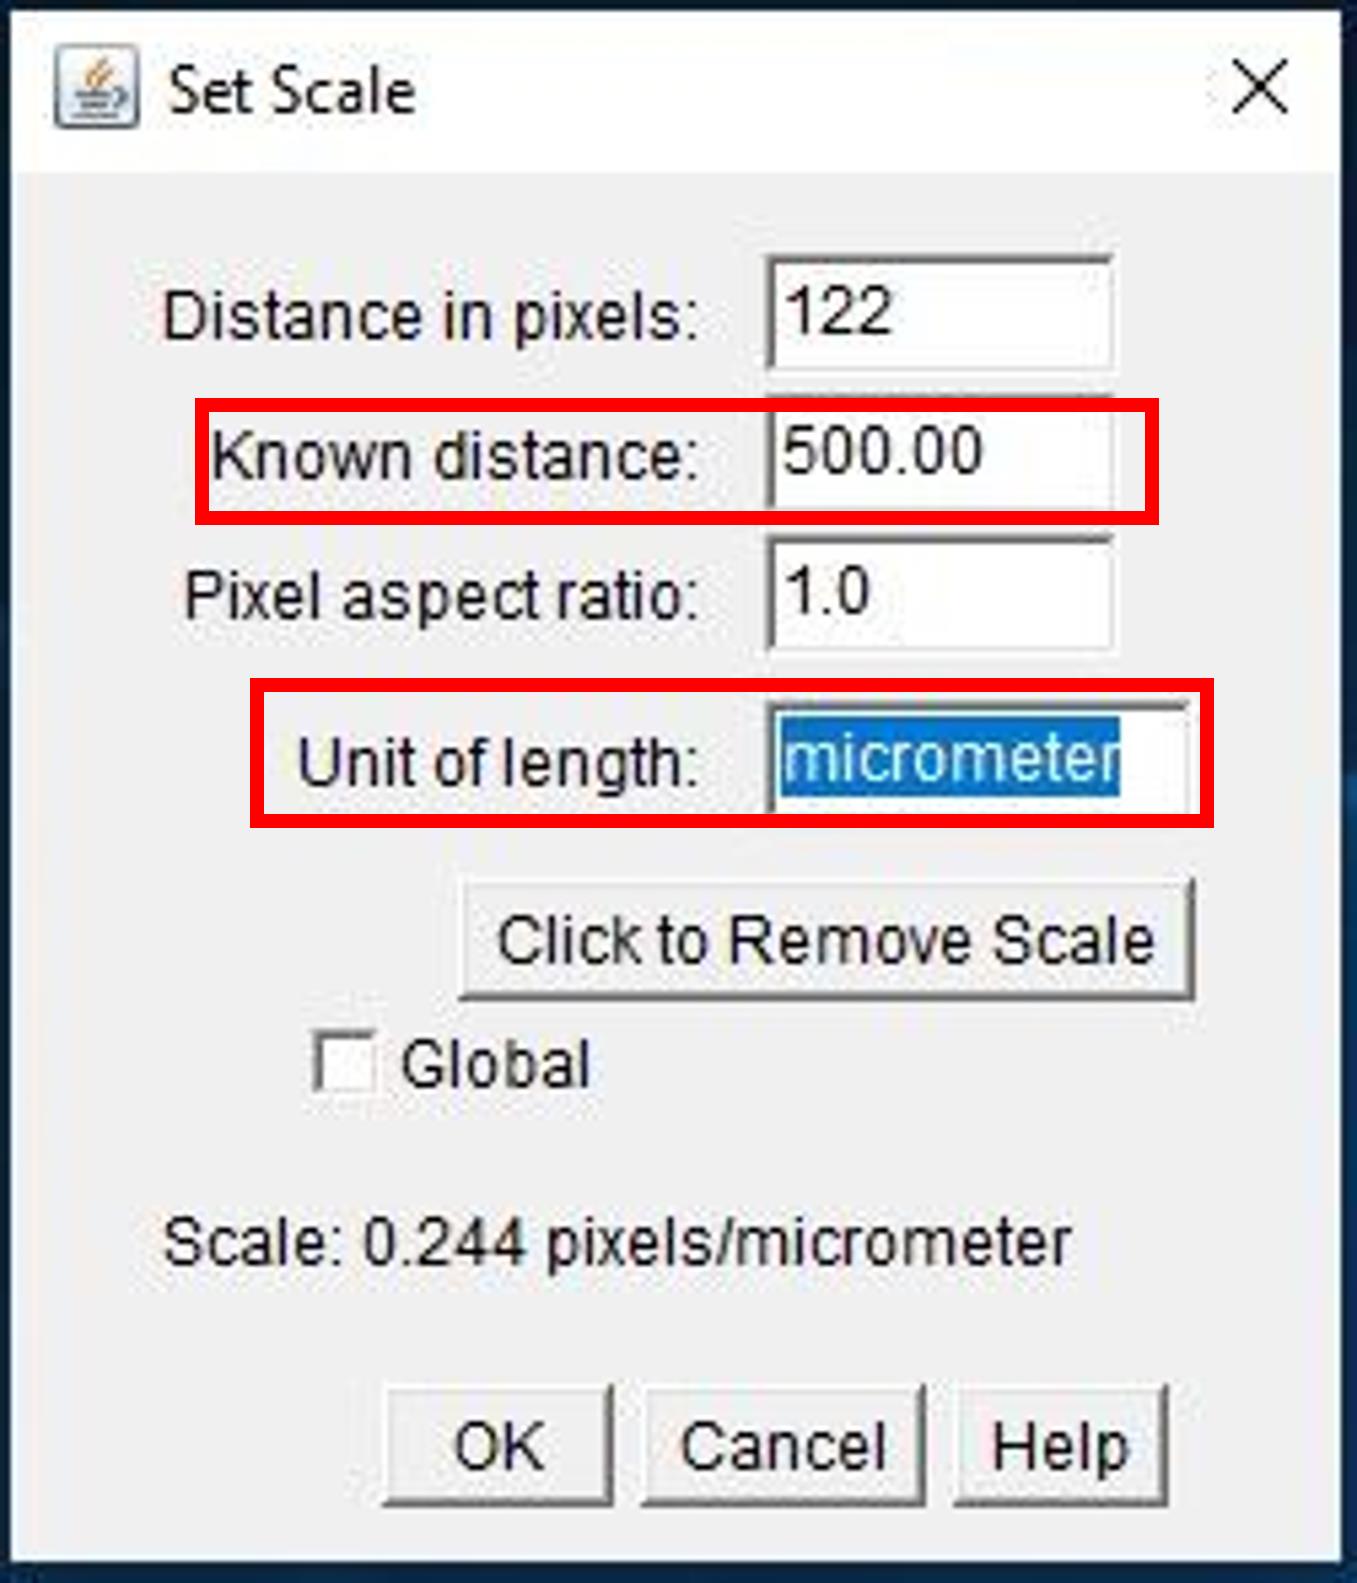
Figure 16. Screenshot of Set Scale window for SEM images
Click Analyze and then Set Measurements. Check boxes Area and Display Label. Click OK.
Click Analyze, Tools, and then ROI Manager… Check boxes Show All and Labels.
Use Polygon selections or Freehand selections to draw areas of interest (Figure 17).
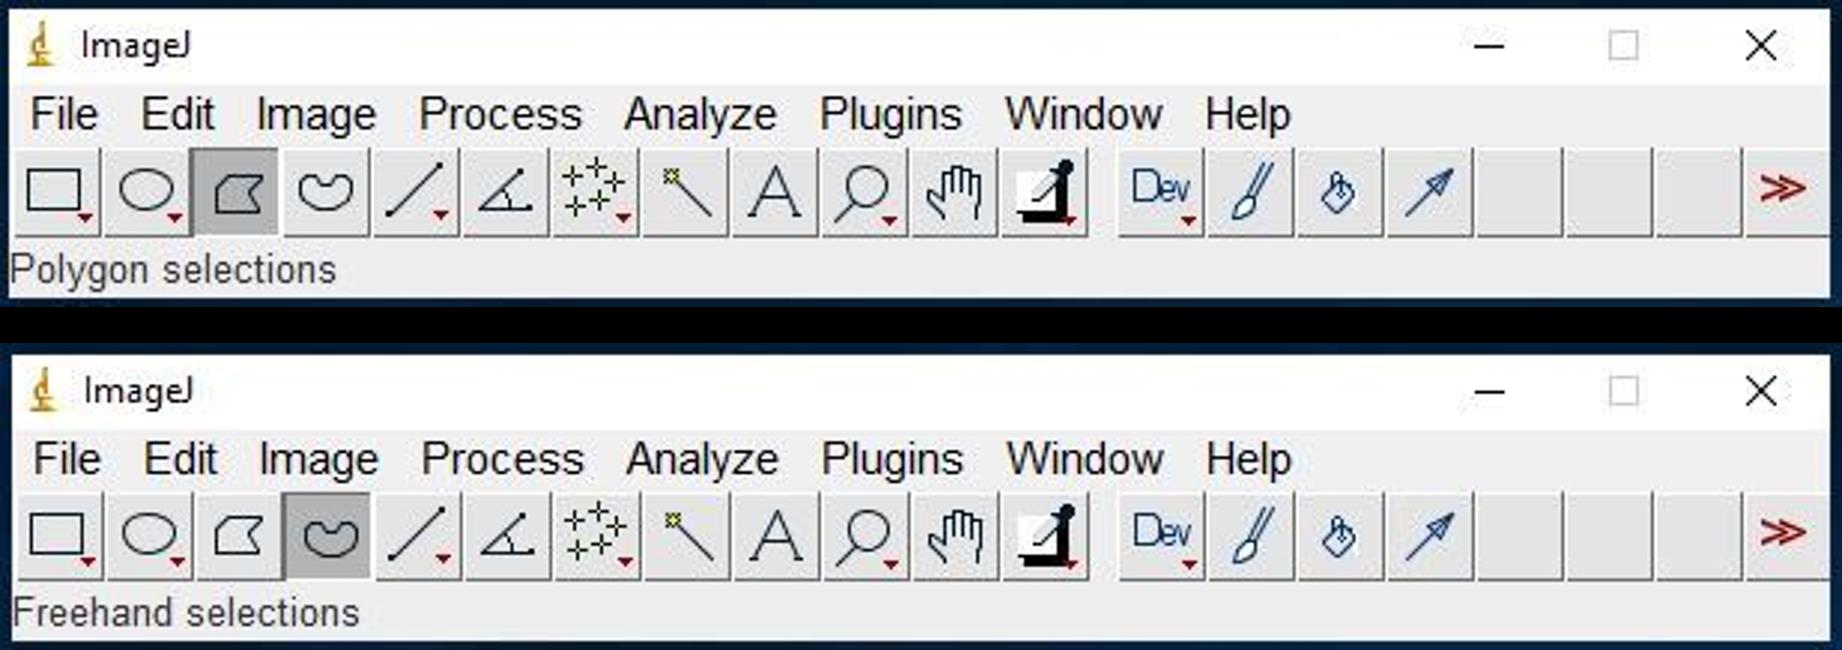
Figure 17. Screenshot of Polygon and Freehand selectionsAfter drawing area of interest, click Add [t] to add it to the list (same for all other areas of interest) (Figure 18).
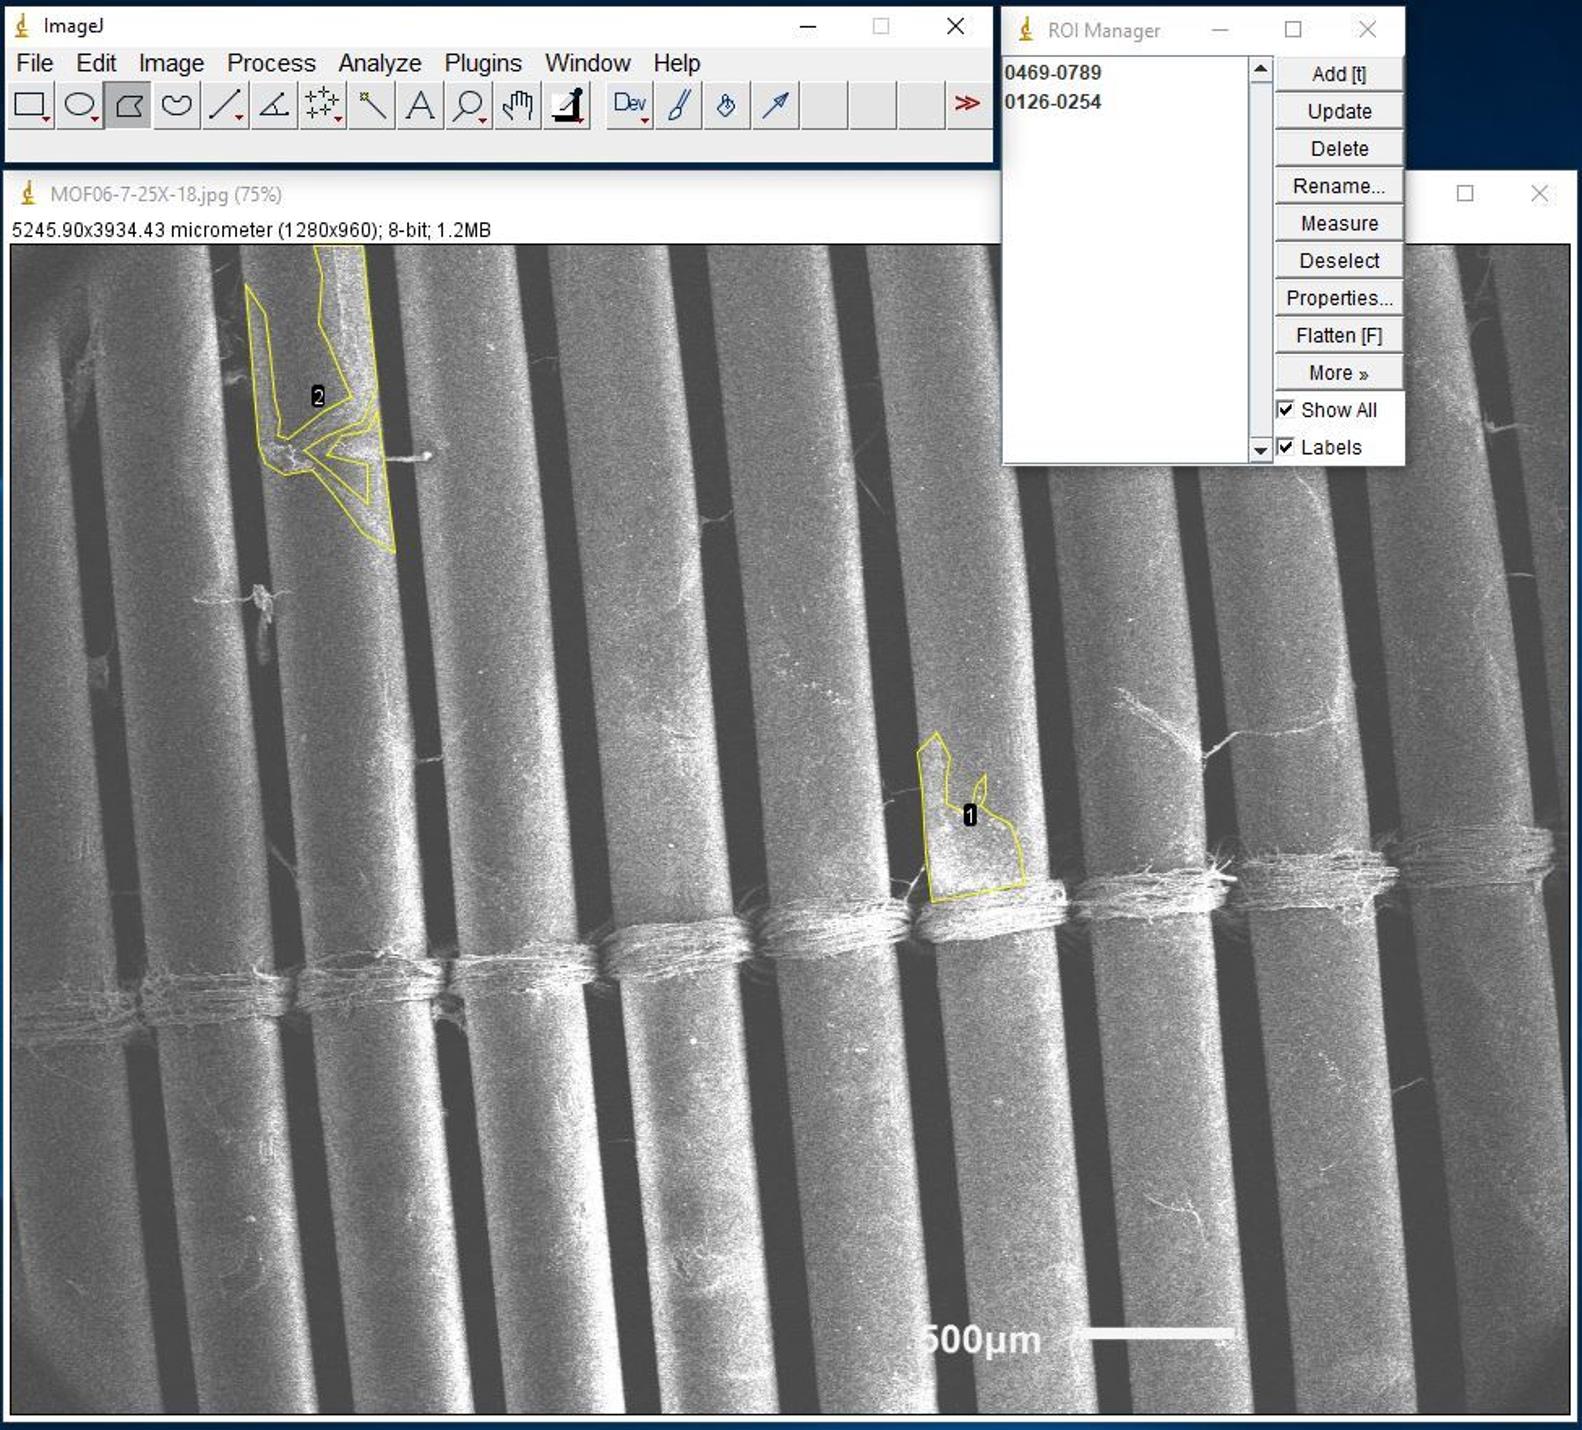
Figure 18. Screenshot of drawing area of interest example for SEM imagesClick one of the areas of interest. Click Rename and then enter the number of areas of interest next to Rename As. Click OK (same for all other areas of interest).
Select all areas of interest, and then click Measure.
Save Results into .csv format. Click File, and then Save As…
Open saved file.
Use the value under Area column divided by total area (Figure 19), which is shown above each image in ImageJ to get percentage of coverage.
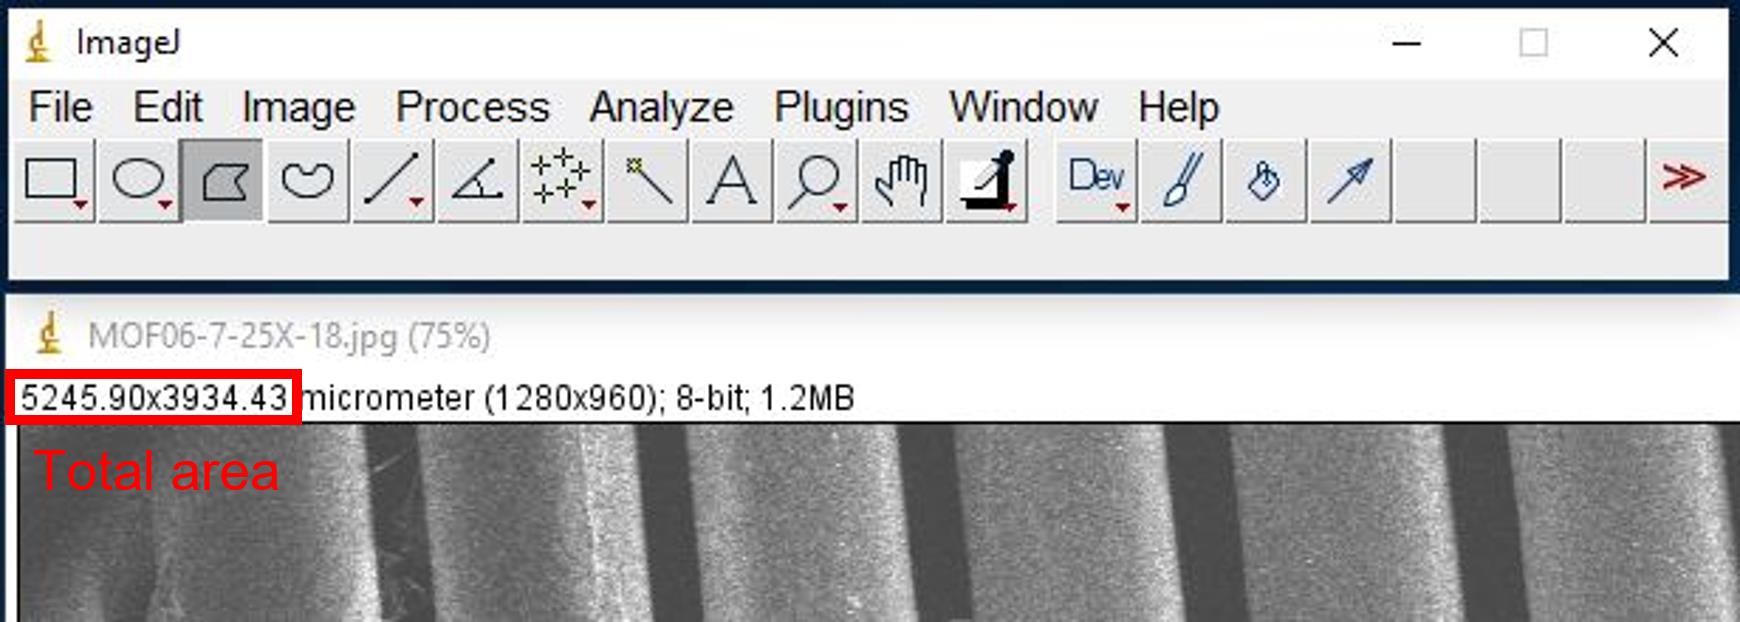
Figure 19. Screenshot of the location of total areaScreenshot and save image with areas of interest as for recorder cord.
Data analysis
Perform statistical comparison on digital and SEM images percentage of total clot coverage of each set of samples (two-sided test with α = 0.05 for significance via SAS 9.4). Perform interrater reliability of quantitative analysis to evaluate the agreement among reviewers (General note 4).
Validation of protocol
Currently, there is no gold standard method for determining total clot deposition on medical device surfaces, therefore limiting the ability to compare our methods tested to an established methodology. This protocol has been validated through a blind review process in which individuals that are not familiar with this method were required to follow the protocol and perform the analysis without help. By the end of the process, we collected feedback and improved the protocol. So far, at least six individuals from three institutions have tried this protocol and there are no outstanding concerns or issues. In addition, this protocol results in a podium presentation at 37th Annual Children’s National Symposium: ECMO & the Advanced Therapies for Respiratory Failure (Virtual).
Zang et al. (2021). Quantitative Analysis of Digital vs. Scanning Electron Microscopy Images as An Assessment Tool for Post-Extracorporeal Life Support Clot Formation Evaluation. Oral Presentation at Bradley Hill Best Abstract Session.
General notes and troubleshooting
General notes
These steps only apply to Maquet HLS7.0 membrane and may require modifications for other membrane oxygenators.
It is recommended to perform SEM imaging the day after SEM dehydration to avoid sample moisturization during storage. If it is not practicable, we recommend checking and changing silica gel desiccant beads on a regular basis.
It took approximately 28 h to image and process a set of SEM images for one sample compared to approximately 3 min for one digital image of the same sample.
To avoid bias, we suggest choosing individuals who are not familiar with the studies involved in membrane oxygenator or de-identified samples before performing the analysis. For routine post-study analysis, interrater reliability score is used to see the reliability and validity to ensure the results are accurate and replicable.
Hazardous exposure (e.g., blood, hazardous chemicals in fixative, etc.) that could occur when assessing materials after clinical use may raise safety and health concerns.
SEM is expensive and time consuming, especially at institutions where SEM is not available or there are not enough trained technicians to perform SEM on a routine basis. Digital imaging could be an alternative approach to access clot deposition; however, some nanoscale clots will be missing from digital images. Therefore, we recommend the researchers and clinicians to balance the advantages and disadvantages of these methods and make a conscious decision based on their needs.
The most challenging part during the development of this protocol is section B. We highly recommend trying at least one test membrane oxygenator before performing on the membrane oxygenator to be analyzed.
Troubleshooting
Some of the thrombi were noticed to be stripped from the sample surface during sample processing and handling as the thrombus did not adhere to the surface tightly. This may lead to variability in quantitative analysis vs. the clinical state of the device during use. Please be as gentle as possible in this step.
Acknowledgments
The work was supported by the Assistant Secretary of Defense for the Health Affairs endorsed by the Department of Defense through the Peer Reviewed Medical Research Program, Technology/Therapeutic Development Award, under Grant no. W81XWH-18-2-0048, PI Andriy Batchinsky MD; Co-PI Teryn Roberts PhD.
The authors acknowledge Dr. Patrick McCurdy and Dr. Roy Geiss from the Central Instrument Facility at Colorado State University for their help on SEM. The authors also acknowledge the SEM facility at the School of Mathematics, Science and Engineering, University of the Incarnate Word and Dr. Carlos Garcia, the dean, for his support on SEM.
Competing interests
There are no conflicts of interest.
Ethical considerations
Membrane oxygenators were obtained from animal studies that were carried out in compliance with the Animal Welfare Act, implementing Animal Welfare Regulations, and the principles of the Guide for the Care and Use of Laboratory Animals, National Research Council at the Autonomous Reanimation and Evacuation Research Program (AREVA) (San Antonio, TX). The University of Texas at San Antonio Institutional Animal Care and Use (UTSA IACUC) approved all research conducted (Protocol SU001-03-23). The AREVA laboratory facility is fully accredited by the Association for the Assessment and Accreditation of Laboratory Animal Care. The protocol and facility were also approved by the Department of Defense, Medical Research and Development Command Animal Care and Use Review Office.
References
- Beely, B. M., Campbell, J. E., Meyer, A., Langer, T., Negaard, K., Chung, K. K., Cap, A. P., Cancio, L. C. and Batchinsky, A. I. (2016). Electron Microscopy as a Tool for Assessment of Anticoagulation Strategies During Extracorporeal Life Support: The Proof Is on the Membrane. ASAIO J. 62(5): 525–532.
- Chlebowski, M. M., Baltagi, S., Carlson, M., Levy, J. H. and Spinella, P. C. (2020). Clinical controversies in anticoagulation monitoring and antithrombin supplementation for ECMO. Crit. Care 24(1): e1186/s13054-020-2726-9.
- Di Iorio, D., Traini, T., Degidi, M., Caputi, S., Neugebauer, J. and Piattelli, A. (2005). Quantitative evaluation of the fibrin clot extension on different implant surfaces: Anin vitro study. J. Biomed. Mater. Res. Part B Appl. Biomater. 74B(1): 636–642.
- Diehl, A. and Gantner, D. (2018). Pump head thrombosis in extracorporeal membrane oxygenation (ECMO). Intensive Care Med. 44(3): 376–377.
- Doyle, A. J. and Hunt, B. J. (2018). Current Understanding of How Extracorporeal Membrane Oxygenators Activate Haemostasis and Other Blood Components. Front. Med. 5: e00352.
- Jaffer, I. H., Fredenburgh, J. C., Hirsh, J. and Weitz, J. I. (2015). Medical device-induced thrombosis: what causes it and how can we prevent it?. J. Thromb. Haemost. 13: S72–S81.
- Kundu, S. K., Klein, M. D., Whittlesey, G. C., Barmatoski, S. P. and Salley, S. O. (1988). Quantitative scanning electron microscopy for the evaluation of thrombosis in extracorporeal circuits. ASAIO Trans. 34(3): 568–572.
- Lehle, K., Philipp, A., Gleich, O., Holzamer, A., Müller, T., Bein, T. and Schmid, C. (2008). Efficiency in Extracorporeal Membrane Oxygenation—Cellular Deposits on Polymethypentene Membranes Increase Resistance to Blood Flow and Reduce Gas Exchange Capacity. ASAIO J. 54(6): 612–617.
- MacLaren, G., Peek, G., Lorusso, R., Brodie, D., Thiagarajan, R. and Vercaemst, L. (2022). Extracorporeal Life Support: The ELSO Red Book 6th Edition. Extracorporeal Life Support Organization.
- Naito, N., Ukita, R., Wilbs, J., Wu, K., Lin, X., Carleton, N. M., Roberts, K., Jiang, S., Heinis, C., Cook, K. E., et al. (2021). Combination of polycarboxybetaine coating and factor XII inhibitor reduces clot formation while preserving normal tissue coagulation during extracorporeal life support. Biomaterials 272: 120778.
- Roberts, T. R., Garren, M. R., Handa, H. and Batchinsky, A. I. (2020a). Toward an artificial endothelium: Development of blood-compatible surfaces for extracorporeal life support. J. Trauma Acute Care Surg. 89: S59–S68.
- Roberts, T. R., Harea, G. T., Singha, P., Sieck, K. N., Beely, B. M., Wendorff, D. S., Choi, J. H., Ande, S., Handa, H., Batchinsky, A. I., et al. (2020b). Heparin-Free Extracorporeal Life Support Using Tethered Liquid Perfluorocarbon: A Feasibility and Efficacy Study. ASAIO J. 66(7): 809–817.
- Zang, Y., Olivera Perez, L., Roberts, T., Ande, S., Lee, J., Reynolds, M. M. and Batchinsky, A. I. (2021). Quantitative Analysis of Digital vs. Scanning Electron Microscopy Images as An Assessment Tool for Post-Extracorporeal Life Support Clot Formation Evaluation. Virtual, February 23rd, 2021 (Oral Presentation at Bradley Hill Best Abstract Session).
Article Information
Copyright
© 2023 The Author(s); This is an open access article under the CC BY-NC license (https://creativecommons.org/licenses/by-nc/4.0/).
How to cite
Zang, Y., Roberts, T. R., Harea, G. T., Beely, B. M., Olivera Perez, L. J., Ande, S., Batchinsky, M., Lee, J. H., Thrailkill, M. A., Reynolds, M. M. and Batchinsky, A. I. (2023). Quantitative Analysis of Clot Deposition on Extracorporeal Life Support Membrane Oxygenators Using Digital and Scanning Electron Microscopy Imaging Techniques. Bio-protocol 13(18): e4814. DOI: 10.21769/BioProtoc.4814.
Category
Biological Engineering > Biomedical engineering
Biophysics > Bioengineering > Medical biomaterials
Do you have any questions about this protocol?
Post your question to gather feedback from the community. We will also invite the authors of this article to respond.