- Protocols

- Articles and Issues
- For Authors
- About
- Become a Reviewer

Methods to Quantify the Dynamic Recycling of Plasma Membrane Channels

Published: Vol 13, Iss 17, Sep 5, 2023 DOI: 10.21769/BioProtoc.4800 Views: 1712
Reviewed by: Emilia KrypotouXin XuAnonymous reviewer(s)

Original research article
The authors used this protocol in:

Sep 2018
Advertisement


Protocol Collections
Comprehensive collections of detailed, peer-reviewed protocols focusing on specific topics


Related protocols
Abstract
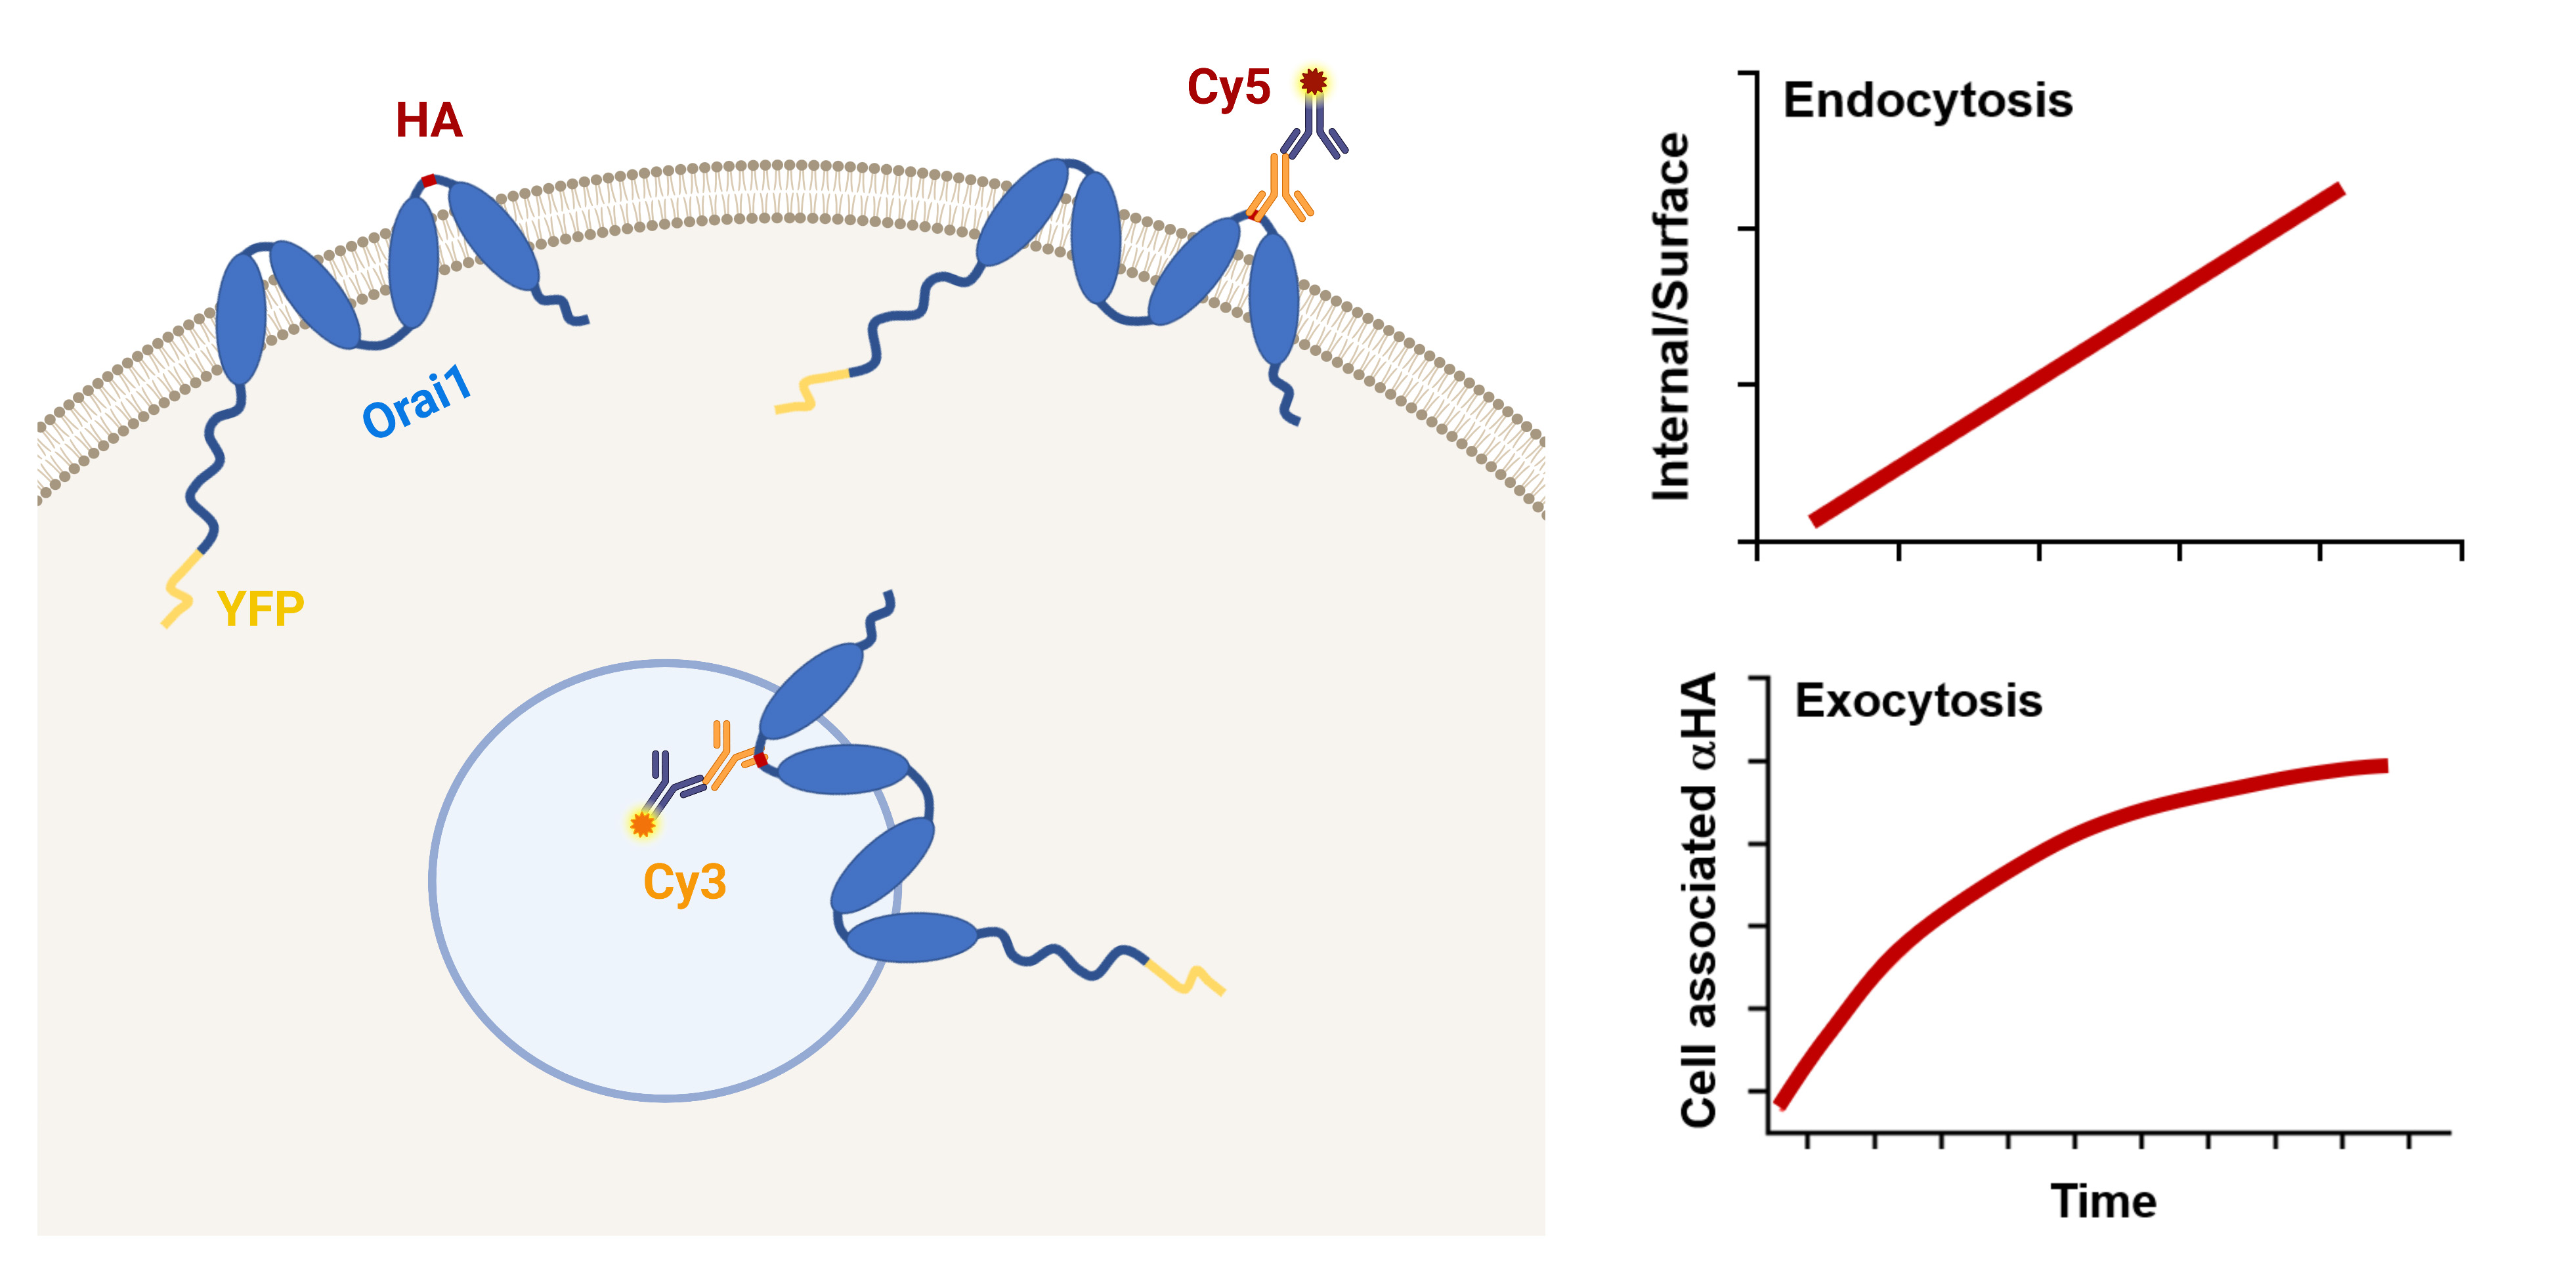
Store-operated Ca2+ entry (SOCE) is a ubiquitous Ca2+ signaling modality mediated by Orai Ca2+ channels at the plasma membrane (PM) and the endoplasmic reticulum (ER) Ca2+ sensors STIM1/2. At steady state, Orai1 constitutively cycles between an intracellular compartment and the PM. Orai1 PM residency is modulated by its endocytosis and exocytosis rates. Therefore, Orai1 trafficking represents an important regulatory mechanism to define the levels of Ca2+ influx. Here, we present a protocol using the dually tagged YFP-HA-Orai1 with a cytosolic YFP and extracellular hemagglutinin (HA) tag to quantify Orai1 cycling rates. For measuring Orai1 endocytosis, cells expressing YFP-HA-Orai1 are incubated with mouse anti-HA antibody for various periods of time before being fixed and stained for surface Orai1 with Cy5-labeled anti-mouse IgG. The cells are fixed again, permeabilized, and stained with Cy3-labeled anti-mouse IgG to reveal anti-HA that has been internalized. To quantify Orai1 exocytosis rate, cells are incubated with anti-HA antibody for various incubation periods before being fixed, permeabilized, and then stained with Cy5-labeled anti-mouse IgG. The Cy5/YFP ratio is plotted over time and fitted with a mono-exponential growth curve to determine exocytosis rate. Although the described assays were developed to measure Orai1 trafficking, they are readily adaptable to other PM channels.
Key features
• Detailed protocols to quantify endocytosis and exocytosis rates of Orai1 at the plasma membrane that can be used in various cell lines.
• The endocytosis and exocytosis assays are readily adaptable to study the trafficking of other plasma membrane channels.
Graphical overview
Background
Orai1 is the pore-forming subunit of the store-operated Ca2+ entry (SOCE) channel. It mediates Ca2+ influx into the cell following direct coupling with ER Ca2+ sensor STIM1, in response to store depletion following Ca2+ release from stores (Luik et al., 2006; Prakriya et al., 2006; Vig et al., 2006; Yeromin et al., 2006). SOCE is central to various physiological processes, and its dysfunction is associated with serious pathologies in humans (Feske, 2011, Feske et al., 2015; Gruszczynska-Biegala et al., 2021; Yu et al., 2021). A key feature in SOCE regulation is the residence of Orai1 at the plasma membrane (PM) and the amount of reserve Orai1 in intracellular compartments that can potentially contribute to the PM pool following SOCE activation.
The steady-state amount of Orai1 at the PM is determined by the rates of endocytosis and exocytosis. Alterations in these rates modulate Orai1 PM levels. Several protocols have been used to quantify the amount of surface and intracellular Orai1, including imaging of fluorescently tagged Orai1 and biotinylation (Yu et al., 2009; Cox et al., 2013; Yeh et al., 2020; Kim et al., 2021; Wrennall et al., 2022). These methodologies provide crude estimates of Orai1 distribution, but they lack the sensitivity and time resolution to determine Orai1 recycling kinetics at the PM. Herein, we describe protocols to quantify the kinetics of Orai1 trafficking using a dually tagged human Orai1 (YFP-HA-Orai1) with a cytosolic YFP at the N-terminus and a hemagglutinin (HA) tag inserted in the second extracellular loop (Park et al., 2009; Hodeify et al., 2015 and 2018). This dual reporter allows quantification of total Orai1 using YFP fluorescence and concomitantly follows its trafficking using the HA-antibody at the single-cell level. The PM and intracellular pools can be differentially labeled by staining unpermeabilized and permeabilized cells with different secondary antibodies (Cy5- or Cy3-labeled). Combining these approaches with time courses of anti-HA antibody feeding allows one to carefully quantify Orai1 endocytosis and exocytosis rates. The presented protocols can be easily adapted to study recycling dynamics of PM channels in a wide range of mammalian cells.
Materials and reagents
Biological materials
TRVb-1 cells, a CHO cell line lacking the endogenous transferrin receptor and stably expressing the human transferrin receptor (McGraw et al., 1987). Any readily transfectable cell line can be substituted for CHO cells
Materials
Plasmid pDS-YFP-HA-Orai1 encoding a dually tagged Orai1 with YFP at the N-terminus and an HA tag inserted in the second extracellular loop (see Hodeify et al., 2015)
Bicarbonate-buffered Ham’s F-12 medium (Invitrogen, catalog number: 11765054)
Cy3- and Cy5-conjugated anti-mouse secondary antibodies (Invitrogen, catalog numbers: A10521 and A10524)
Purified monoclonal anti-HA.11 Epitope Tag antibody (Covance, catalog number: MMS-101P)
Poly-D-lysine coated glass-bottomed plates (MatTek Corporation, catalog number: P35GC-1.5-14-C)
Lipofectamine 2000 (Invitrogen, catalog number: 11668019)
GibcoTM Opti-MEMTM I reduced serum medium, 500 mL (Thermo Fisher Scientific, catalog number: 31985047)
Dulbecco’s phosphate buffered saline (PBS) (Sigma, catalog number: D8537-500ML)
Penicillin-streptomycin (GIBCO REF, catalog number: 15140122)
Paraformaldehyde (PFA) (Sigma-Aldrich, catalog number: 16005-1KG-R)
Triton X-100 (Sigma, catalog number: T8787-50ML)
10% heat-inactivated FBS (Sigma, catalog number: F4135-500ML)
FalconTM 15 mL conical centrifuge tubes, polypropylene
FalconTM conical centrifuge tubes, 15 mL (Corning, catalog number: 352095)
Microcentrifuge tubes, 1.5 mL (Sigma-Aldrich, catalog number: HS4323)
250 mL glass Erlenmeyer flask (VWR, catalog number: 89000-362-250ML)
Solutions
Paraformaldehyde, 4% in PBS (see Recipes)
PBS containing 0.1% (w/v) Triton X-100 (see Recipes)
Recipes
Paraformaldehyde, 4% in PBS
Add 80 mL of 1× PBS into a 250 mL glass Erlenmeyer flask with a clean magnetic stir bar.
Heat the solution while stirring to approximately 60 and add 4 g of PFA powder (powder will not immediately dissolve).
Slowly raise the pH by adding 1 N NaOH dropwise until the solution clears.
Remove from heat and allow to cool to room temperature (RT).
Adjust the volume to 100 mL with 1× PBS.
Filter through aqueous filter paper to remove undissolved particles.
PBS containing 0.1% (w/v) Triton X-100
Add 5 μL of Triton X-100 to 50 mL of 1× PBS.
Equipment
Leica SP inverted confocal imaging microscope (Leica; Lasertechnik; S/N: 5100001464)
Magnetic stirrer with hotplate (IKA magnetic stirrer RCT basic, Ident. No.: 0025006052)
Cell culture incubator model: Sanyo MIR-262 Lab Incubator 153 L Capacity w/ Two Shelves S/N: 08020051 (Sanyo)
Software
ImageJ software (http://imagej.net/mbf/)
Adobe Photoshop CS3
Origin (v 2019b)
Procedure
Endocytosis assay protocol
To measure Orai1 endocytosis rate, cells are incubated with excess anti-HA antibody (Ab) to label the entire Orai1 pool at the PM (Figure 1). As Orai1 recycles at the plasma membrane, HA-associated Orai1 will be internalized by endocytosis, thus labeling the intracellular pool. Over time, one can then label the PM Orai1 pool by incubating with a Cy5 secondary Ab. This is followed by permeabilizing the cells and incubating with Cy3 secondary to label intracellular Orai1. The time course of the ratio of intracellular (Cy3) over surface (Cy5) Orai1 is fitted to quantify the endocytosis rate.
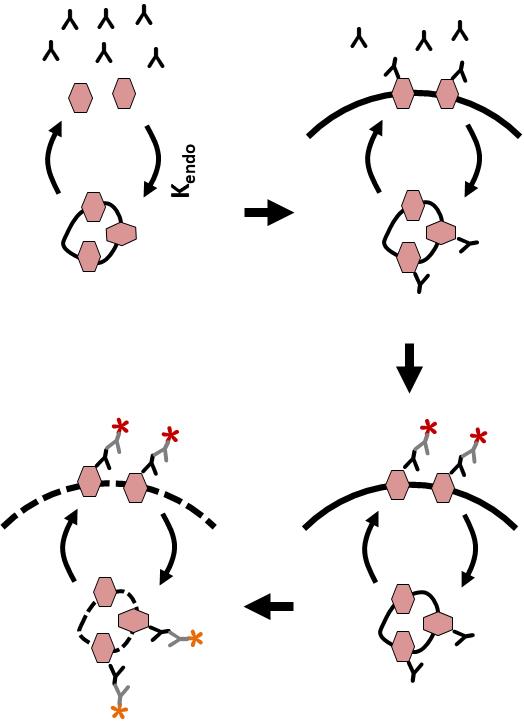
Figure 1. Outline of the endocytosis assay. CHO cells expressing YFP-HA-Orai1 are incubated with monoclonal anti-HA antibody for various periods of time. Cells are fixed and stained with Cy5-conjugated anti-mouse IgG, then washed and fixed again, permeabilized, and stained with Cy3-conjugated anti-mouse IgG. Cy5 and Cy3 intensities are then measured using quantitative fluorescence microscopy.
Cell preparation and transfection (Figure 2)
Cells are grown at 37 °C and 5% CO2 in bicarbonate-buffered Ham’s F-12 medium, supplemented with 10% heat-inactivated FBS and 5% (v/v) of a stock solution containing penicillin and streptomycin. For transient transfections, seed 300,000 cells on poly-D-lysine coated glass-bottomed plates for 18–20 h to 50%–60% confluency to initiate the experiment on the following day.
For transfection of each glass-bottom plate, prepare the transfection mixture as follows:
In two separate Eppendorf tubes, add 50 μL of Opti-MEMTM I reduced serum medium.
Add 1.5 μg of pDS-YFP-HA-Orai1 plasmid DNA to one tube and 2 μL of Lipofectamine 2000 to the other tube and vortex gently.
Incubate for 5 min at RT.
Combine the two mixtures in one tube, mix gently, and incubate for 20 min at RT.
While waiting, remove media from plates and wash with 500 μL of Opti-MEMTM.
After 20 min of incubation, add 300 μL of Opti-MEMTM to each mixture and add to the cells. Incubate for 18–20 h at 37 °C.
After overnight incubation, replace transfection mixture with normal medium and incubate cells for another 18–20 h.
Labeling and imaging (Figure 1)
Remove media from the transfected cells and incubate with 400 μL of monoclonal anti-HA.11 Epitope Tag antibody (1:100 dilution in 1× PBS) at 37 °C.
At various timepoints (2, 4, 6, 10, and 20 min), remove the PBS containing HA antibody and immediately fix cells for 10 min in 500 μL of 4% PFA at RT.
Then, remove PFA and wash cells twice with 1 mL of PBS.
Note: If a break point is needed, a few drops of PBS can be added to the cells, keeping those at RT for staining.
Stain cells with Cy5-conjugated anti-mouse secondary antibody (1:400 dilution in 1× PBS with 5% FBS) for 30 min at 37 °C.
Remove secondary antibody, wash cells with 1 mL of PBS, re-fix with 500 μL of 4% PFA for 10 min at RT, and then wash with 1 mL of PBS.
Permeabilize cells using 1 mL of 1× PBS with 0.1 % Triton for 10 min at RT.
Wash cells with 1 mL of PBS and then stain with Cy3-conjugated anti-mouse secondary antibody (1:400 dilution) for 30 min at 37 °C, before washing twice with 1 mL of PBS.
Notes:
During and after labeling with secondary antibodies, cover the plates in aluminum foil to minimize light exposure.
If a break point is needed, add a few drops of PBS to the cells and cover them with aluminum foil to reduce light exposure.
The fluorescence intensities of Cy3 and Cy5 are measured using quantitative fluorescence microscopy. The imaging parameters were as follows: for YFP, λex = 514, λem = 516–545; for Cy3, λex = 561, λem = 566–622; and for Cy5, λex = 633, λem = 648–703. The Cy5 signals show surface Orai1, whereas the Cy3 signal measures accumulation over time of intracellular Orai1 pool bound to the anti-HA antibody.
The (Cy3/YFP)Internal/(Cy5/YFP)Surface ratio is plotted over time and fitted with a linear regression function.
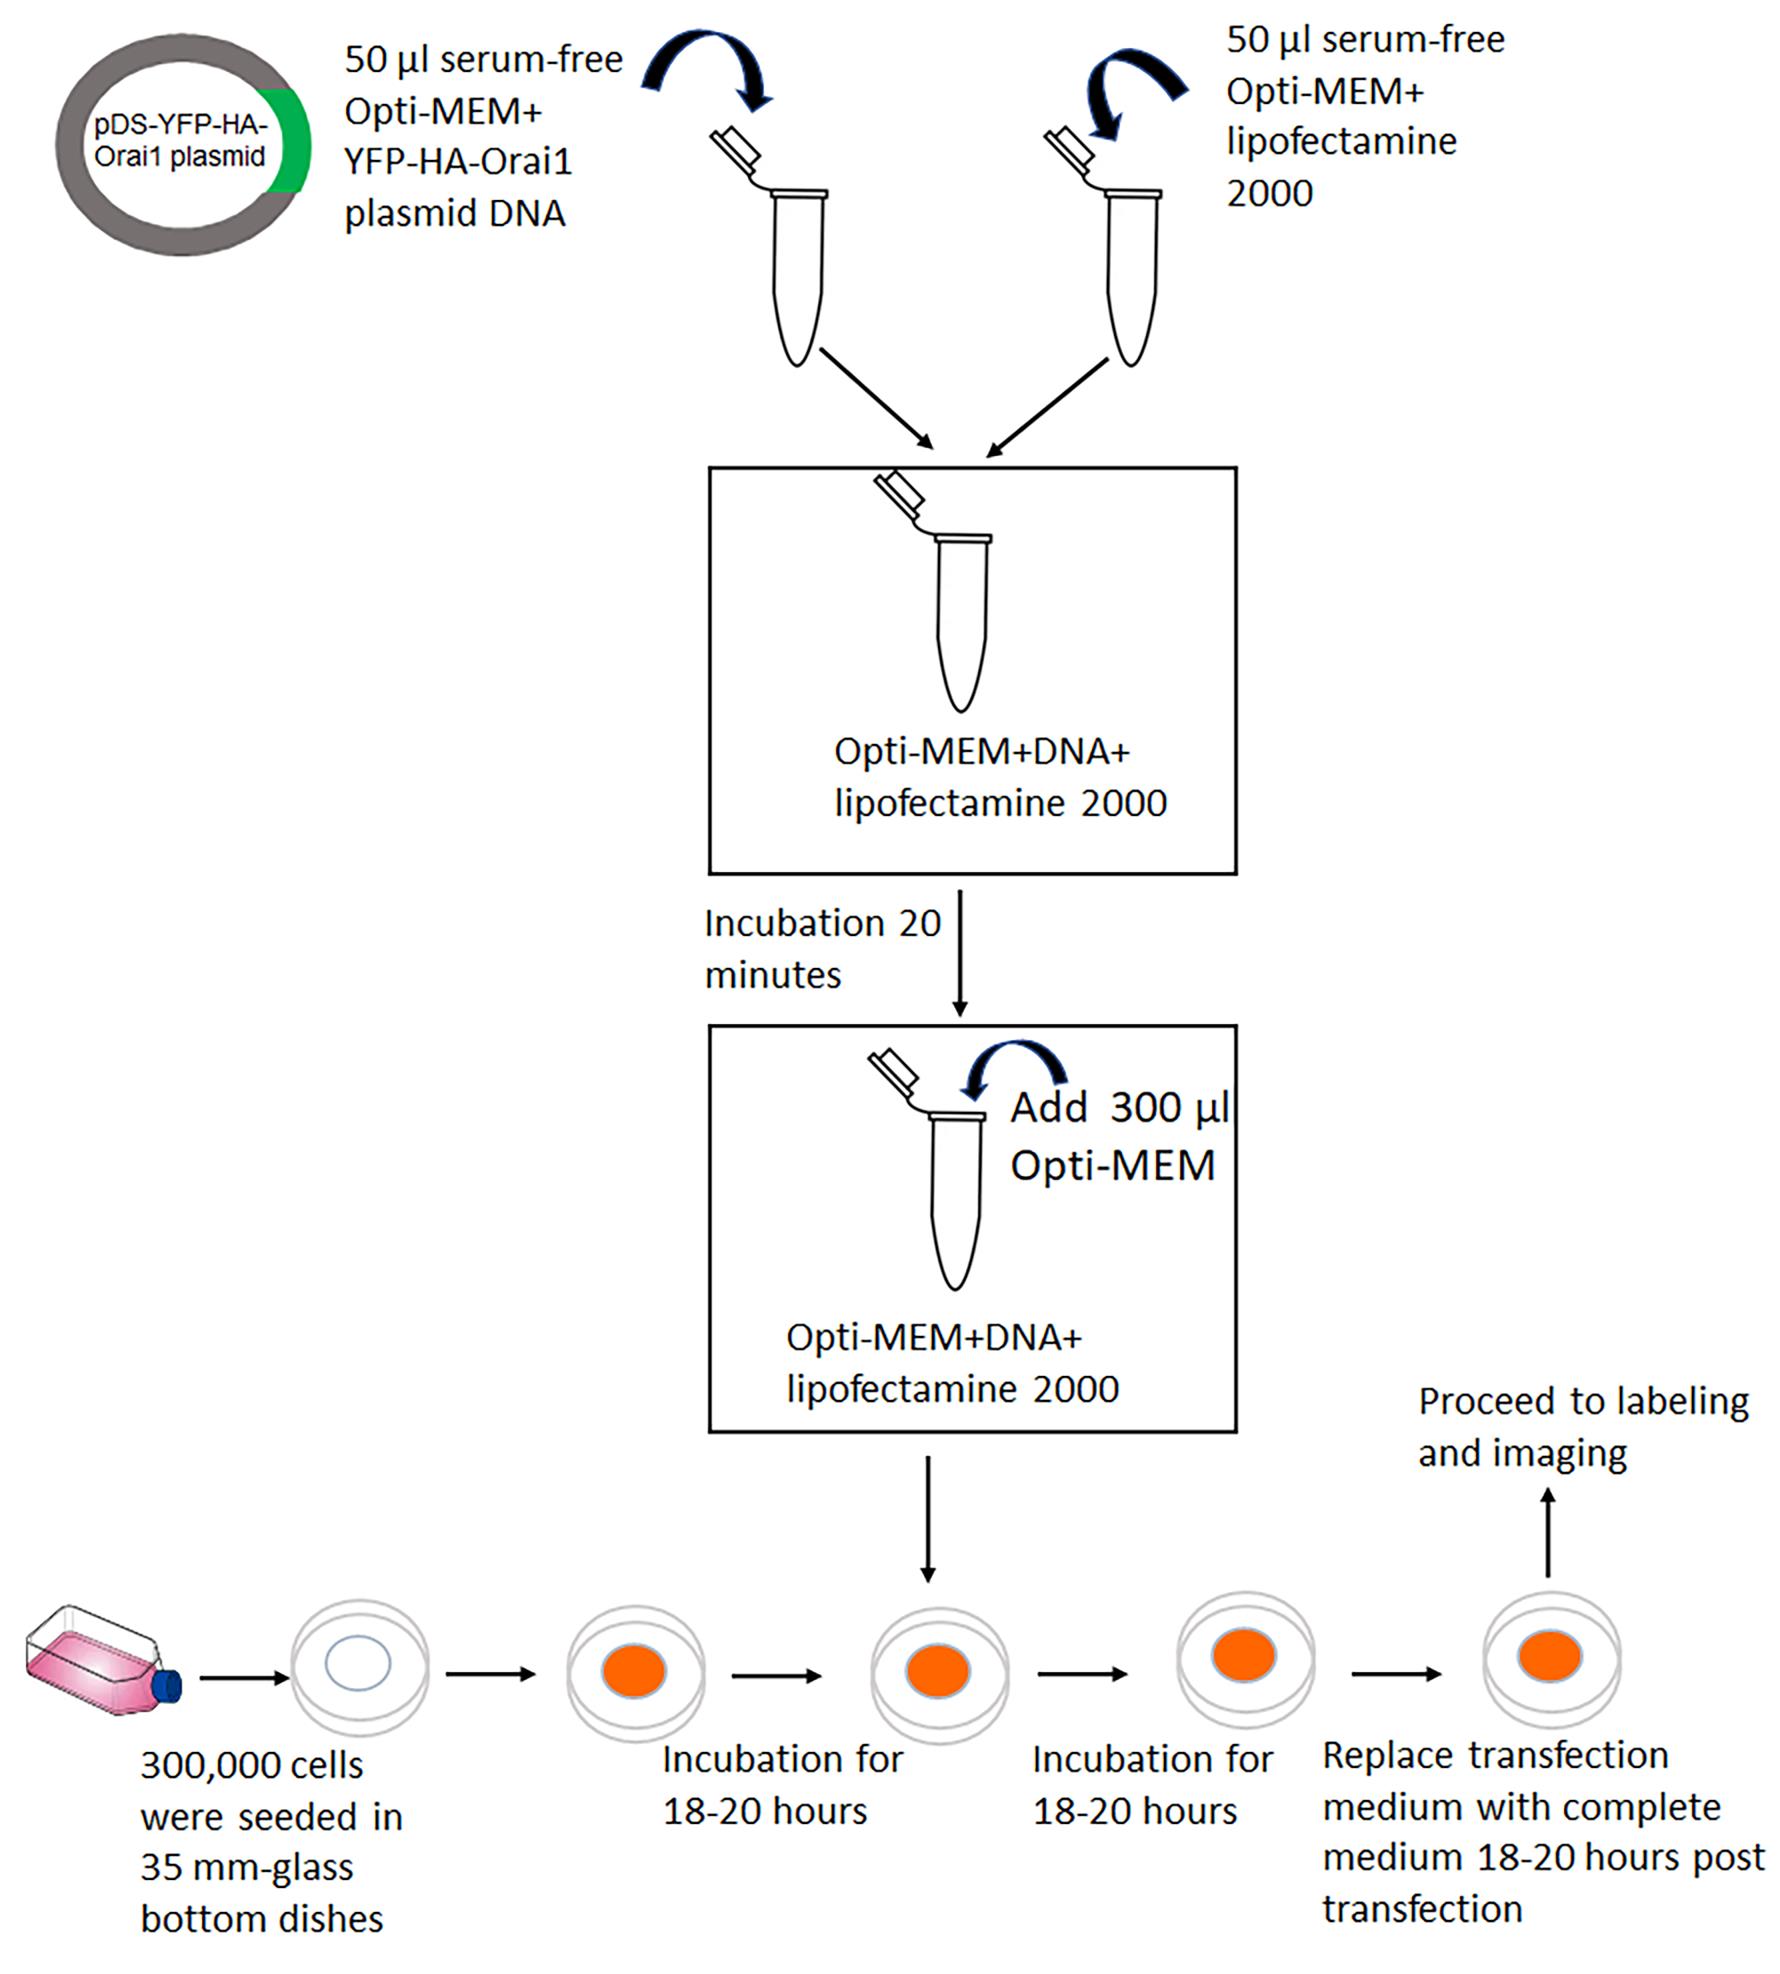
Figure 2. Flowchart depicting cell preparation and transfection with YFP-HA-Orai1 DNA
Imaging
The fluorescence intensities of the Cy3 and Cy5 were measured using quantitative fluorescence microscopy using Leica SP inverted confocal imaging microscope equipped with a 63× 1.4 NA oil lens. At early time points in the assay, Cy5 labeling of surface Orai1 was apparent, and intracellular Orai1 gradually became Cy3 positive (Figure 3).
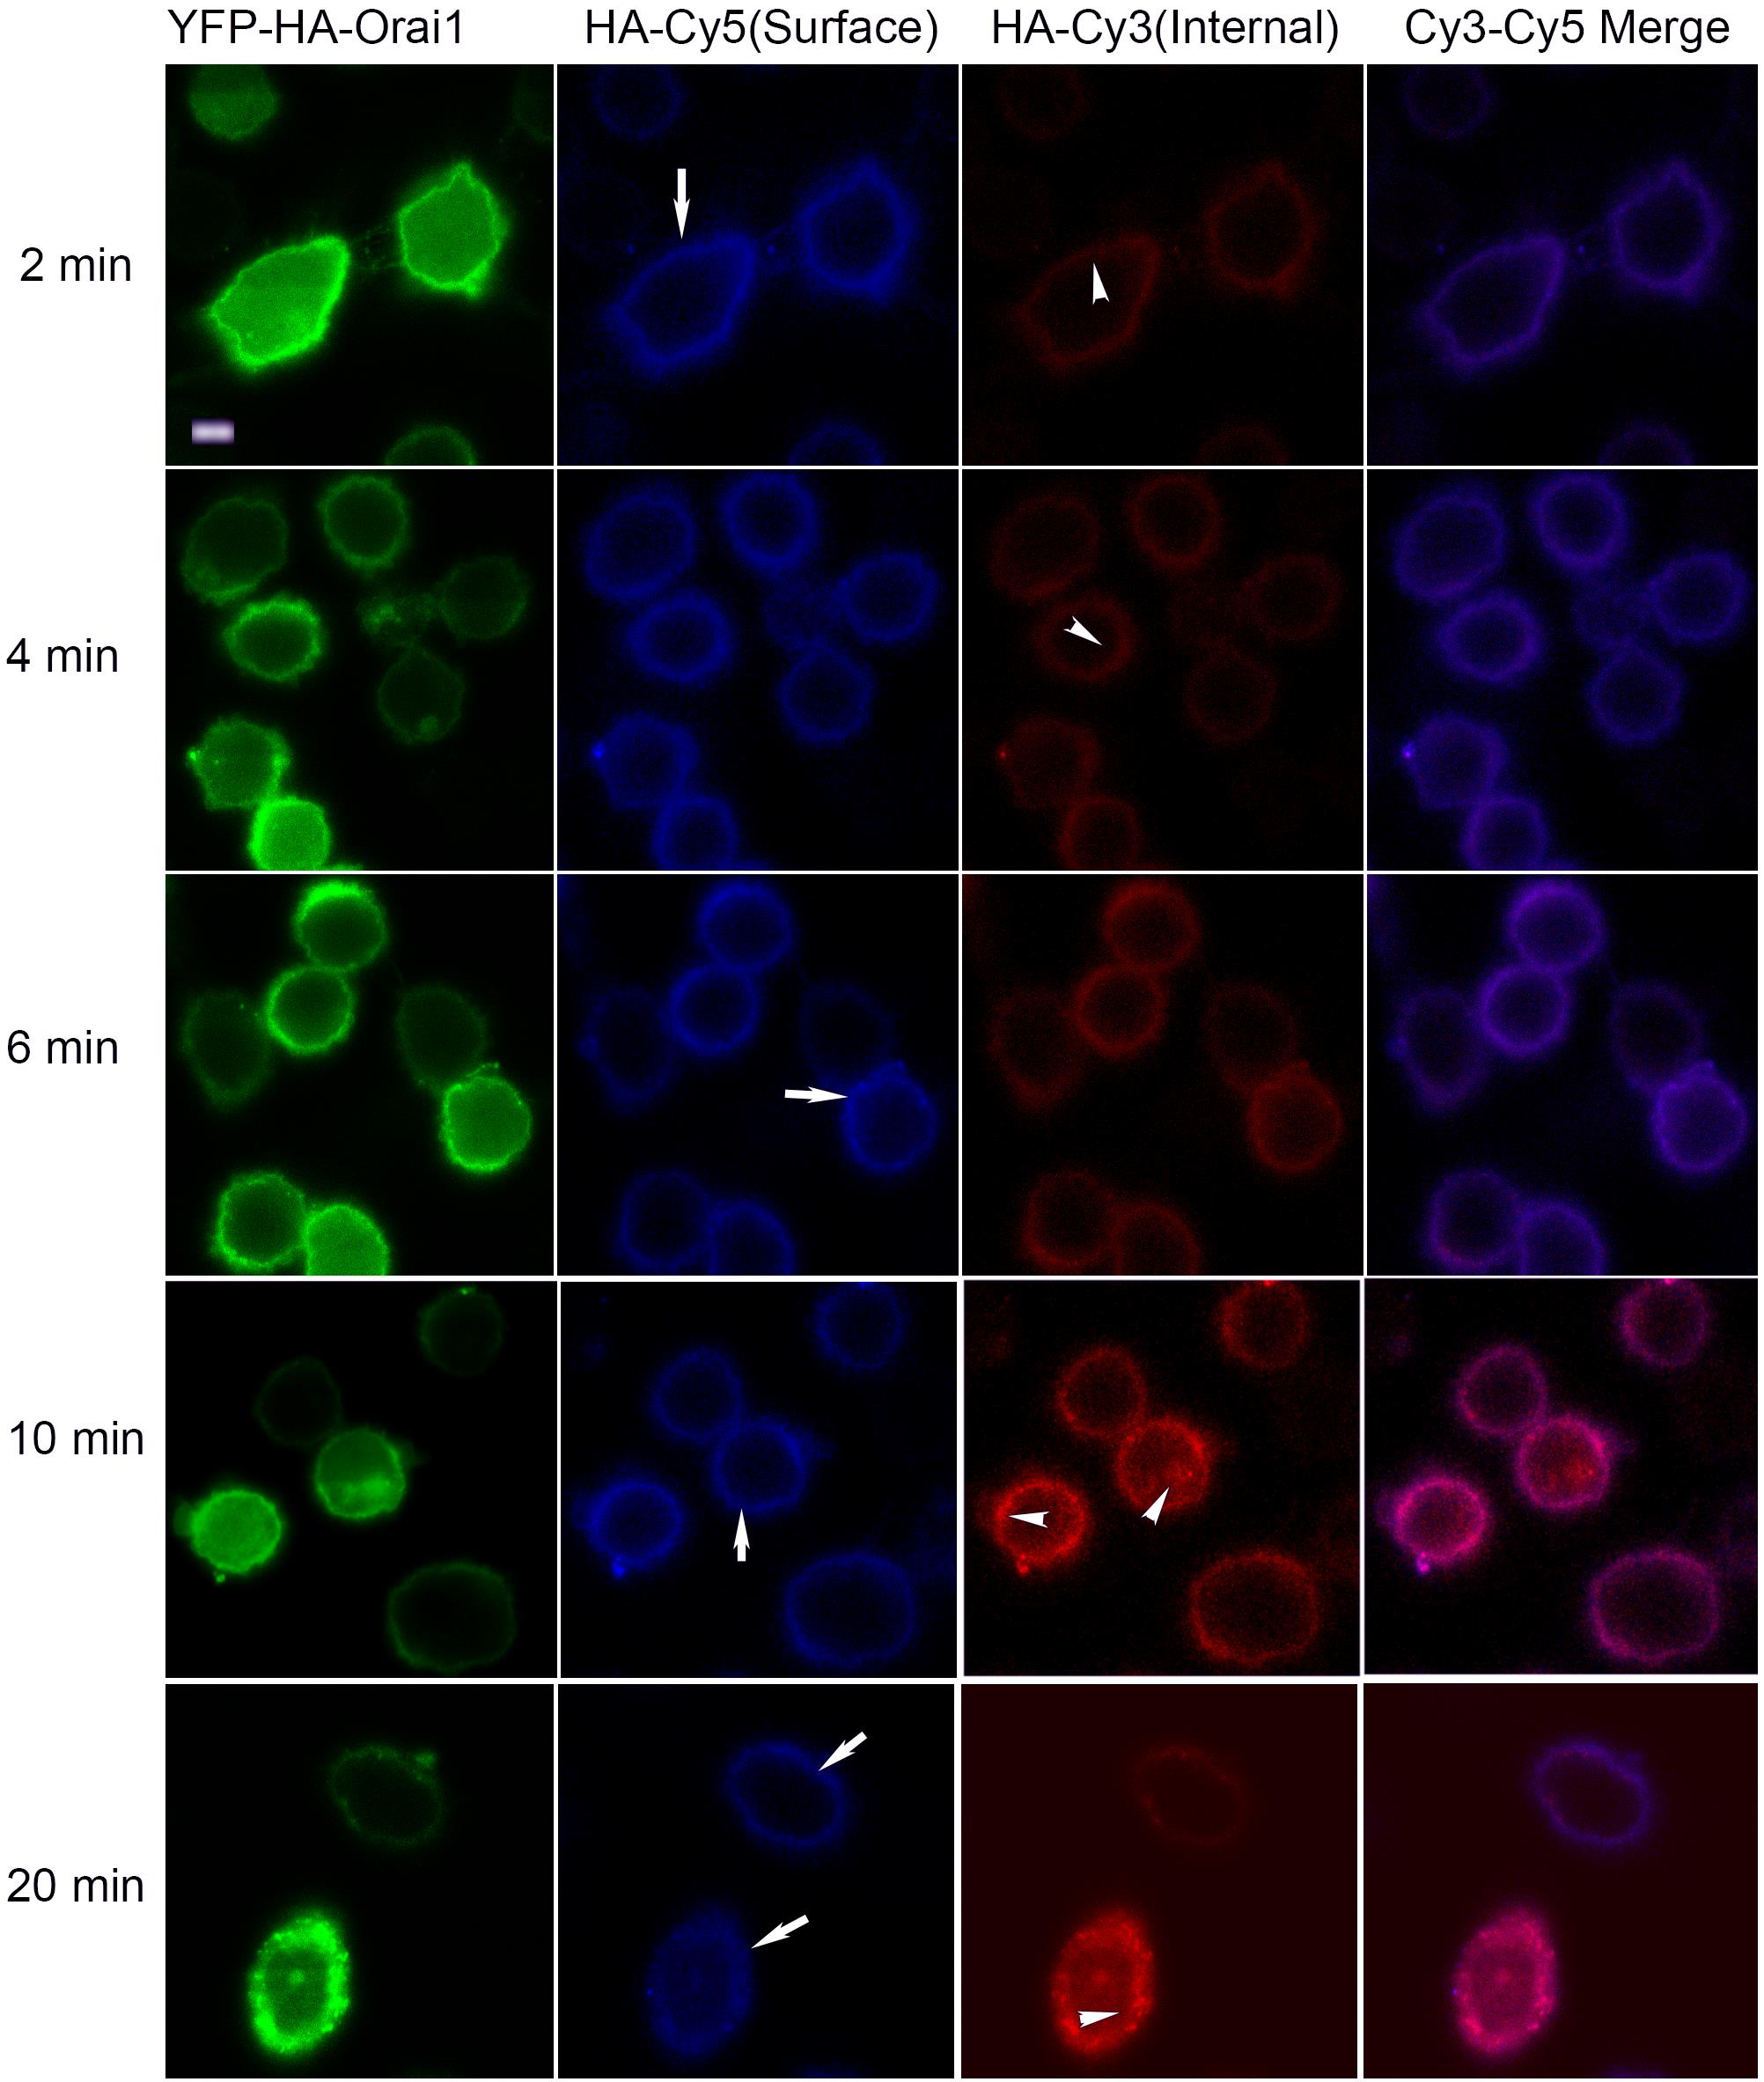
Figure 3. Representative images of CHO cells expressing YFP-HA-Orai1 and fed with anti-HA antibody. Cells showing YFP distribution and stained for surface and internal Orai1 using an anti-HA antibody followed by a Cy5- and Cy3-conjugated secondary antibodies. Surface staining (Cy5 signal) is indicated by arrows and internal staining (Cy3) is represented by arrowheads. Scale bar, 5 μm.
Data analysis
Fluorescence of YFP, Cy5, and Cy3 was analyzed using ImageJ software at the single-cell level. Non-transfected cells (no YFP expression) were used for background correction. YFP, Cy3, and Cy5 signals at single-cell level were determined using ImageJ measure intensity tool after individually selecting cells (oval selection tool). Intensity was measured for both the Cy3 and YFP channels to allow for ratio calculations. Similarly, the ratio of Cy5 over YFP fluorescence at the single-cell level was determined. Unlabeled cells that did not express YFP-HA-Orai1 were used for background correction. The HA-bound to surface YFP-HA-Orai1 is labeled with Cy5-conjugated anti-mouse IgG. Cy5 labeling is followed by staining with an anti-mouse IgG conjugated to Cy3. The initial staining with Cy5-anti-mouse IgG blocks all PM HA epitopes, thereby limiting Cy3 labeling to internal HA epitope on YFP-HA-Orai1. The (Cy3/YFP)Internal/(Cy5/YFP)Surface ratio was plotted over time and fitted with a linear regression function to yield a straight line, whose slope is proportional, but not equal, to the Orai1 endocytosis rate, because two different fluorophores are used (Figure 4). The endocytosis rate constant can be calculated from levels of surface and internal Orai1 and the exocytosis rate constant using the equation:
Orai1Surface × Kendo = Orai1Internal × Kex
These methods have been validated for characterization of Orai1 recycling kinetics with CHO cells and HEK293 cells in Machaca Lab (Hodeify et al., 2015). A similar method was used by McGraw lab to successfully characterize GLUT4 transporter endocytosis (Karylowski et al., 2004; Blot and McGraw, 2008).
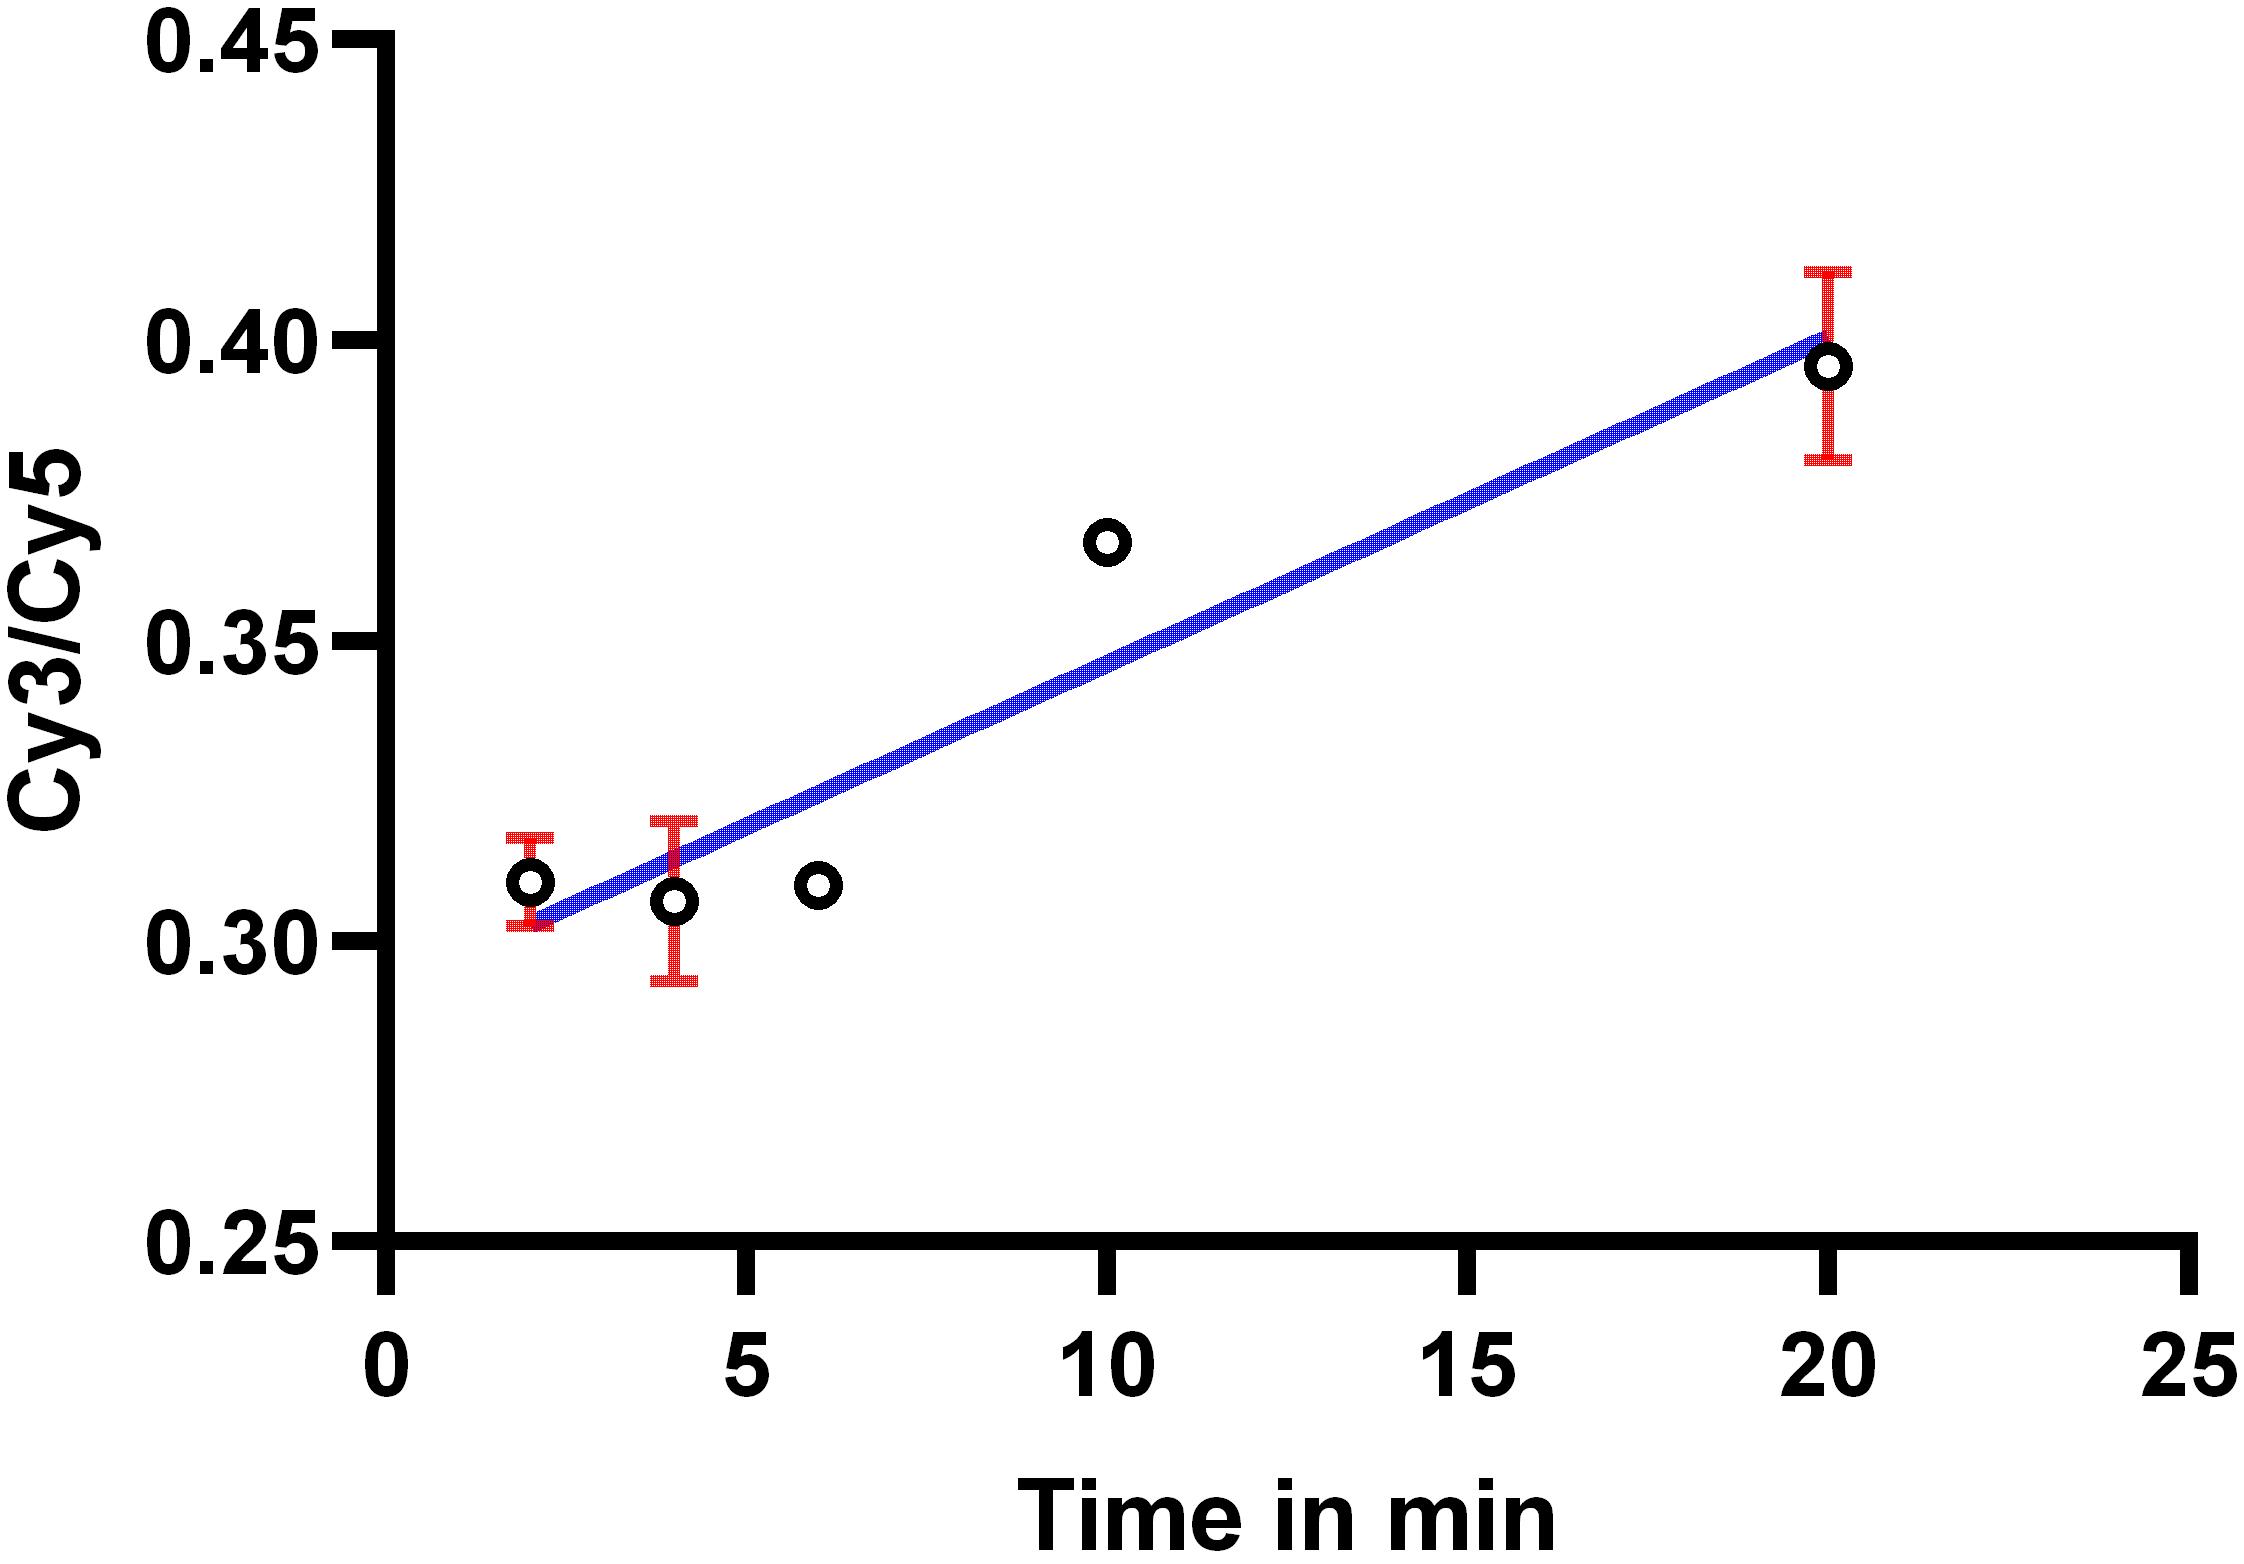
Figure 4. Intracellular accumulation of anti-HA-bound Orai1 measured as internal (Cy3/YFP) over surface (Cy5/YFP) Orai1 vs. time. Data were fitted by a linear regression. The slope of the straight line is proportional to endocytosis rate.
Exocytosis assay protocol
To quantify Orai1 exocytosis rates, cells are incubated with excess anti-HA Ab for various times to allow for HA-labeled Orai1 molecules to be internalized, and intracellular Orai1 to reach the PM. Initially, anti-HA antibody will bind to YFP-HA-Orai1 at the PM and binding will gradually increase overtime, as more intracellular Orai1 is translocated to the surface. As new Orai1 molecules reach the PM through recycling, they will be labeled by the HA Ab until the entire recycling Orai1 pool is labeled. Quantifying the amount of cell-associated anti-HA over time allows the quantification of Orai1 exocytosis rate.
Cell preparation and transfection
Prepare and transfect cells with YFP-HA-Orai1 as described above in the endocytosis assay.
Labeling and imaging (Figure 5)
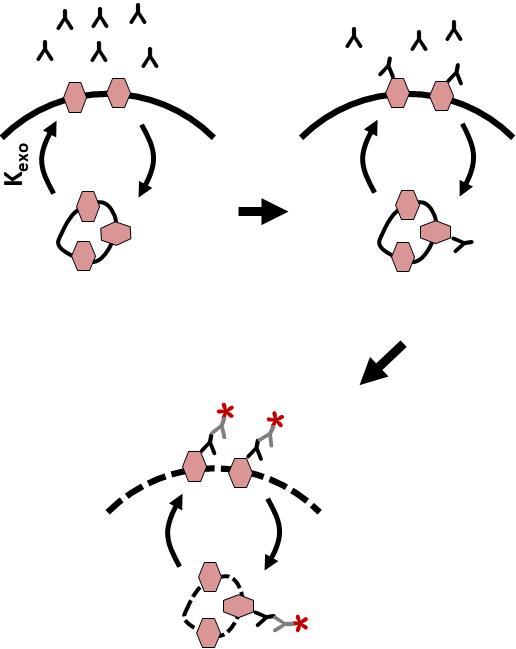
Figure 5. Outline of the exocytosis assay. CHO cells expressing YFP-HA-Orai1 were incubated with monoclonal anti-HA antibody for various periods of time. Cells were fixed, permeabilized, and stained with Cy5-conjugated anti-mouse IgG. YFP and Cy5 intensities were measured using quantitative fluorescence microscopy.Remove media from the transfected cells and incubate with monoclonal anti-HA.11 antibody (1:100 dilution in 1× PBS) at 37 °C.
At various timepoints (2, 5, 15, 30, and 45 min), remove the 1× PBS containing HA antibody and immediately fix cells for 10 min in 4% PFA at RT.
Remove PFA, wash cells with 1× PBS, and then permeabilize using 0.1% Triton for 10 min at RT.
Wash cells with 1× PBS and then stain with Cy5-conjugated anti-mouse secondary antibody (1:400 dilution) for 30 min at 37 °C.
The fluorescence intensities of YFP and Cy5 are measured using quantitative fluorescence microscopy.
Plotting the Cy5/YFP ratio over time and fitting with a mono-exponential growth curve
Data analysis
Fluorescence of YFP and Cy5 was analyzed using ImageJ software at the single-cell level. To correct for background, non-transfected cells (no YFP expression) were used for background correction. The ratio of Cy5/YFP fluorescence was calculated. The Cy5/YFP ratio was plotted over time and fitted with a mono-exponential growth curve (Figure 6). The ratio increases over time until it reaches a plateau, when the total pool of YFP-HA-Orai1 had sampled the PM and became attached to the anti-HA antibody. The exocytosis rate constant can be determined using the equation:
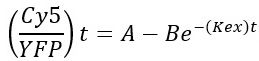
where A is the plateau of maximal uptake, B is the amplitude of the signal, t is the time, and Kex is the exocytosis rate constant. (Cy5/YFP)t is the fraction of YFP-HA-Orai1 bound by anti-HA monoclonal antibody.
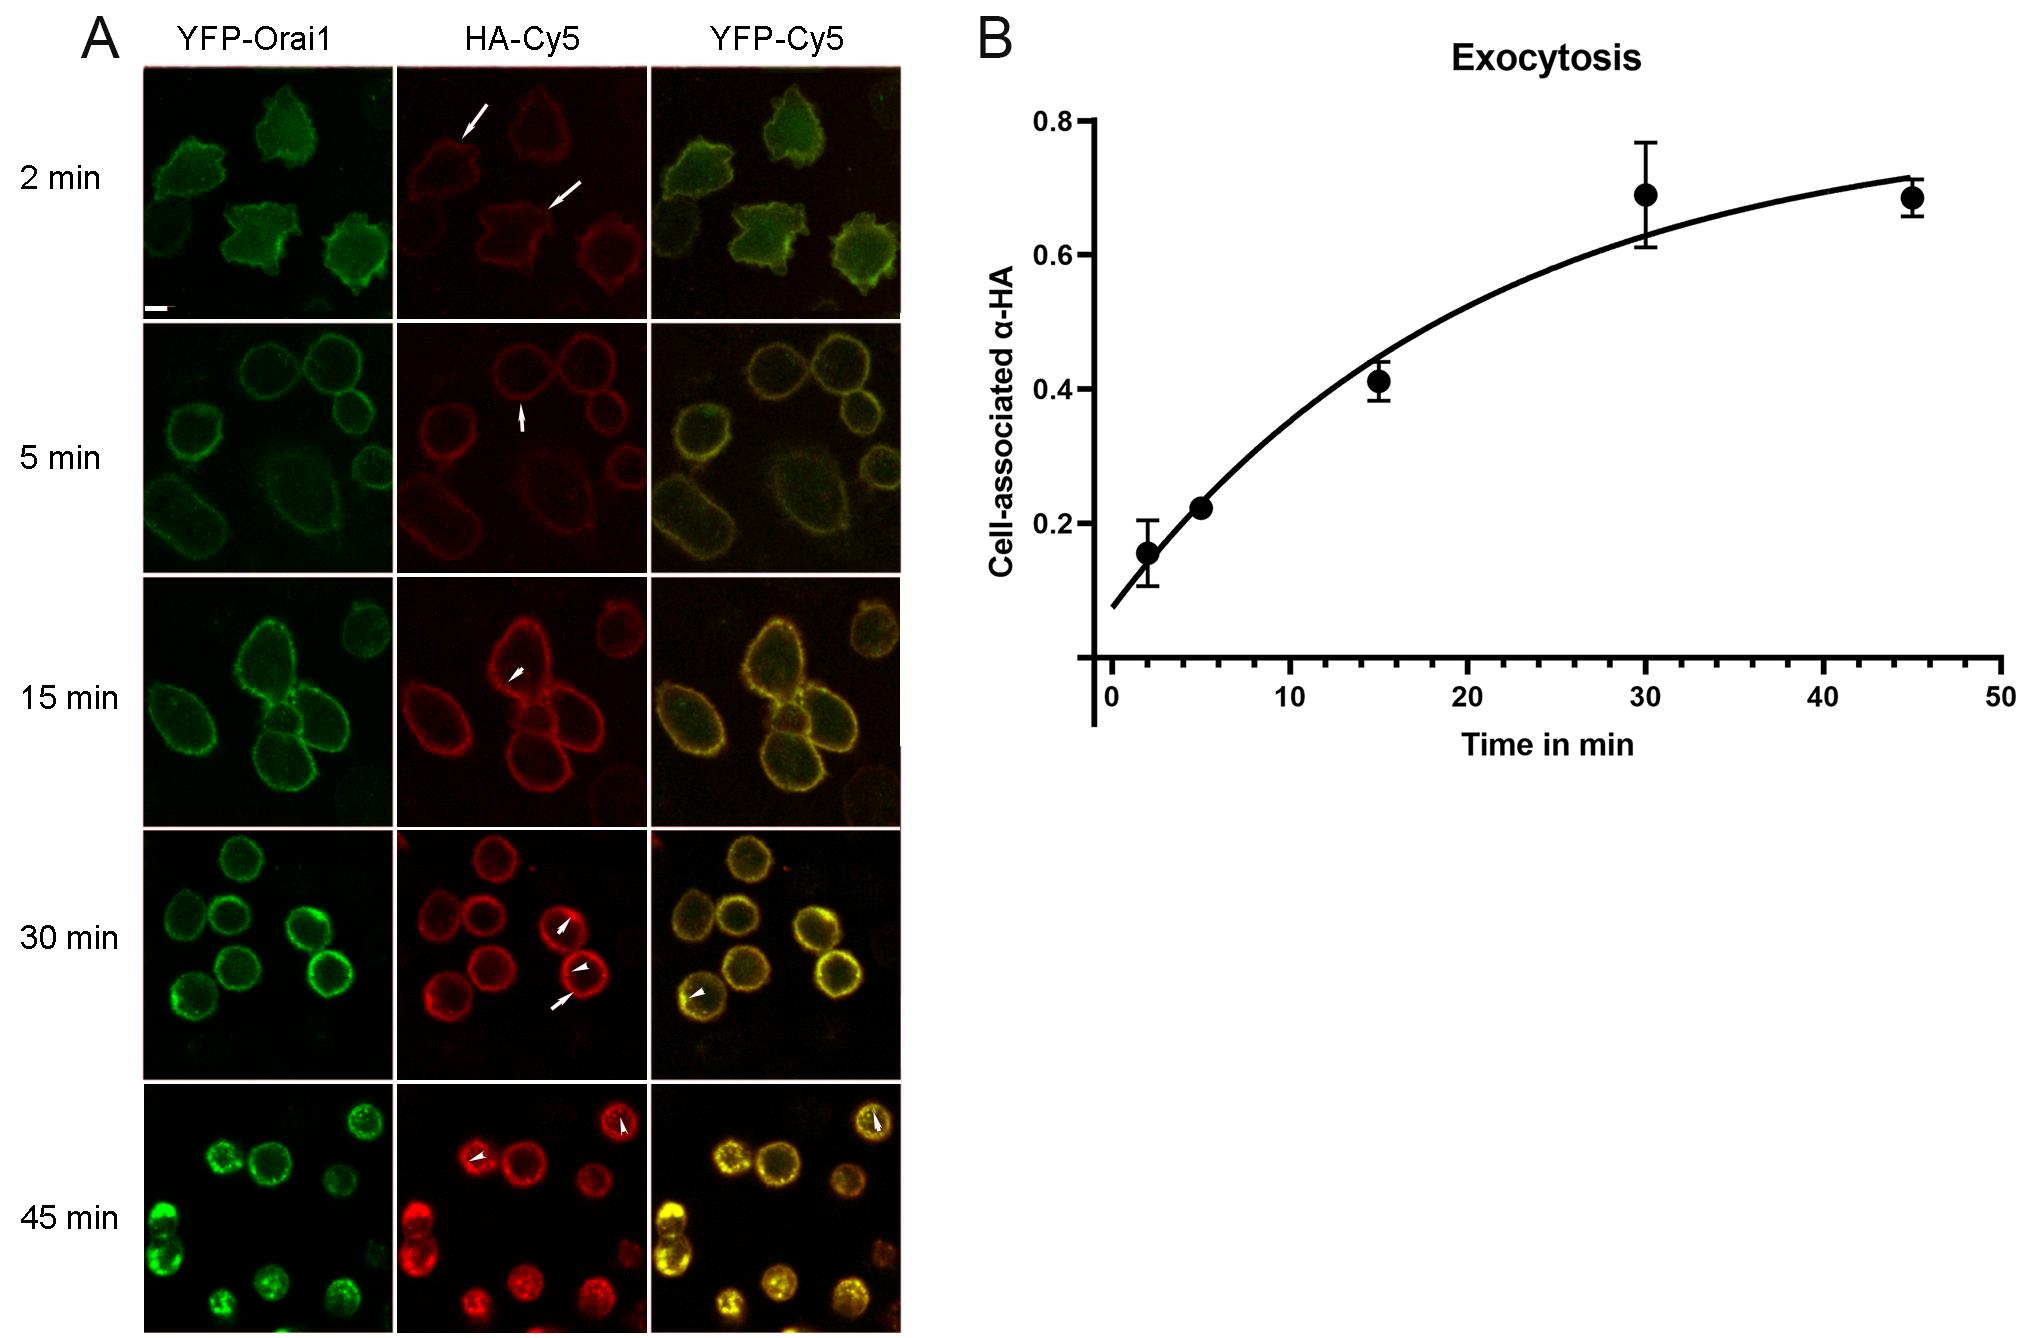
Figure 6. Representative images from the exocytosis assay. A. Cells fed with anti-HA antibodies for various periods of time were fixed, permeabilized, and stained with Cy5 anti-mouse IgG. Scale bar, 5 μm. B. Cy5/YFP ratio was plotted and fitted with mono-exponential growth curve.
Surface/total ratio assay protocol
Cell preparation and transfection
Prepare and transfect cells with YFP-HA-Orai1 as described above in the endocytosis and exocytosis assay.
Labeling and imaging
Remove media from the transfected cells, wash once with 1× PBS, and fix immediately with 4% PFA for 10 min at RT.
In parallel, detect internal Orai1 in similar cells fixed with 4% PFA for 10 min at RT, washed with 1× PBS, and then permeabilized using 0.1 % Triton for 10 min at RT.
Wash non-permeabilized and permeabilized cells with 1× PBS and then incubate with saturating concentrations (1:300) of monoclonal anti-HA antibodies for 45 min at 37 °C. Wash cells with 1× PBS and then stain with Cy5-conjugated anti-mouse secondary antibody (1:400 dilution) for 30 min at 37 °C.
The fluorescence intensities of YFP and Cy5 are measured using quantitative fluorescence microscopy.
Surface Orai1 is determined by dividing the Cy5/YFP for non-permeabilized cells by the Cy5/YFP value for permeabilized cells.
As an example for calculating Kexo and Kendo, we used the data shown in Figures 4 and 6.
The exocytosis data in Figure 6 showing a time course of Cy5/YFP is fit to a mono-exponential curve using this formula:
The maximum uptake plateau A = 0.7969,
The initial value Y0 = 0.07393,
The amplitude of the signal, B = plateau – Y0 = 0.7895.
Solving the equation with these values for Kex gives 0.048 ± 0.006 min-1
Using the surface to total ratio protocol described above, we have also calculated that 45% of total Orai1 is at the surface at steady state. This provides a relative Orai1 surface of 0.45 and internal of 0.55. Using the calculated Kex from the exocytosis assay and this value, we can calculate Kendo using the formula:
Orai1Surface × Kendo = Orai1Internal × Kex
So, Kendo = 0.05866/min.
General notes and troubleshooting
This protocol can be adapted to be used in any transfectable cell line. One limitation is due to the non-homogenous expression of the protein of interest following transient transfection, which may lead to overexpression and saturation of the endogenous trafficking machinery. To assess this possibility, one can assess the surface/total ratio of the protein of interest as a measure of total expression using the fluorescent tag (YFP, in this case). If the trafficking machinery is not saturated, surface/total ratio should be stable over a wide range of expression. Alternatively, one can generate stable cell lines that express low levels of the tagged protein (see Hodeify et al., 2015).
Precautions should be taken when preparing PFA, as it is irritating to eyes, respiratory system, and skin. Wear appropriate personal protective equipment and prepare solution in a certified chemical fume hood.
Acknowledgments
This work was supported by NPRP 9-767-3-208 grant from the Qatar National Research Fund to K.M and by the Biomedical Research Program at Weill Cornell Medical College in Qatar, a program funded by Qatar Foundation.
This protocol was derived from the original work of Hodeify et al. (2018).
Competing interests
The authors declare no conflict of interests.
References
- Blot, V. and McGraw, T. E. (2008). Molecular Mechanisms Controlling GLUT4 Intracellular Retention. Mol. Biol. Cell 19(8): 3477–3487.
- Cox, J. H., Hussell, S., Søndergaard, H., Roepstorff, K., Bui, J. V., Deer, J. R., Zhang, J., Li, Z. G., Lamberth, K., Kvist, P. H., et al. (2013). Antibody-Mediated Targeting of the Orai1 Calcium Channel Inhibits T Cell Function. PLoS One 8(12): e82944.
- Feske, S. (2011). Immunodeficiency due to defects in store-operated calcium entry. Ann. N. Y. Acad. Sci. 1238(1): 74–90.
- Feske, S., Wulff, H. and Skolnik, E. Y. (2015). Ion Channels in Innate and Adaptive Immunity. Annu. Rev. Immunol. 33(1): 291–353.
- Gruszczynska-Biegala, J., Martin-Romero, F. J., Smani, T. and Secondo, A. (2021). Editorial: Molecular Components of Store-Operated Calcium Entry in Health and Disease. Front. Cell. Neurosci. 15: e771138.
- Hodeify, R., Nandakumar, M., Own, M., Courjaret, R. J., Graumann, J., Hubrack, S. Z. and Machaca, K. (2018). The CCT chaperonin is a novel regulator of Ca2+ signaling through modulation of Orai1 trafficking. Sci. Adv. 4(9): eaau1935.
- Hodeify, R., Selvaraj, S., Wen, J., Arredouani, A., Hubrack, S., Dib, M., Al-Thani, S. N., McGraw, T. and Machaca, K. (2015). A STIM1-dependent ‘trafficking trap’ mechanism regulates Orai1 plasma membrane residence and Ca2+ influx levels. J. Cell Sci. 128(16): 3143–3154.
- Karylowski, O., Zeigerer, A., Cohen, A. and McGraw, T. E. (2004). GLUT4 Is Retained by an Intracellular Cycle of Vesicle Formation and Fusion with Endosomes. Mol. Biol. Cell 15(2): 870–882.
- Kim, J. H., Park, E. Y., Hwang, K. H., Park, K. S., Choi, S. J. and Cha, S. K. (2021). Soluble αKlotho downregulates Orai1-mediated store-operated Ca2+ entry via PI3K-dependent signaling. Pflugers Arch. - Eur. J. Physiol. 473(4): 647–658.
- Luik, R. M., Wu, M. M., Buchanan, J. and Lewis, R. S. (2006). The elementary unit of store-operated Ca2+ entry: local activation of CRAC channels by STIM1 at ER–plasma membrane junctions. J. Cell Biol. 174(6): 815–825.
- McGraw, T. E., Greenfield, L. and Maxfield, F. R. (1987). Functional expression of the human transferrin receptor cDNA in Chinese hamster ovary cells deficient in endogenous transferrin receptor. J. Cell Biol. 105(1): 207–214.
- Prakriya, M., Feske, S., Gwack, Y., Srikanth, S., Rao, A. and Hogan, P. G. (2006). Orai1 is an essential pore subunit of the CRAC channel. Nature 443(7108): 230–233.
- Park, C. Y., Hoover, P. J., Mullins, F. M., Bachhawat, P., Covington, E. D., Raunser, S., Walz, T., Garcia, K. C., Dolmetsch, R. E., Lewis, R. S., et al. (2009). STIM1 Clusters and Activates CRAC Channels via Direct Binding of a Cytosolic Domain to Orai1. Cell 136(5): 876–890.
- Vig, M., Peinelt, C., Beck, A., Koomoa, D. L., Rabah, D., Koblan-Huberson, M., Kraft, S., Turner, H., Fleig, A., Penner, R., et al. (2006). CRACM1 Is a Plasma Membrane Protein Essential for Store-Operated Ca2+ Entry. Science 312(5777): 1220–1223.
- Wrennall, J. A., Ahmad, S., Worthington, E. N., Wu, T., Goriounova, A. S., Voeller, A. S., Stewart, I. E., Ghosh, A., Krajewski, K., Tilley, S. L., et al. (2022). A SPLUNC1 Peptidomimetic Inhibits Orai1 and Reduces Inflammation in a Murine Allergic Asthma Model. Am. J. Respir. Cell Mol. Biol. 66(3): 271–282.
- Yeh, Y. C., Lin, Y. P., Kramer, H. and Parekh, A. B. (2020). Single-nucleotide polymorphisms in Orai1 associated with atopic dermatitis inhibit protein turnover, decrease calcium entry and disrupt calcium-dependent gene expression. Hum. Mol. Genet. 29(11): 1808–1823.
- Yeromin, A. V., Zhang, S. L., Jiang, W., Yu, Y., Safrina, O. and Cahalan, M. D. (2006). Molecular identification of the CRAC channel by altered ion selectivity in a mutant of Orai. Nature 443(7108): 226–229.
- Yu, F., Agrebi, N., Mackeh, R., Abouhazima, K., KhudaBakhsh, K., Adeli, M., Lo, B., Hassan, A. and Machaca, K. (2021). Novel ORAI1 Mutation Disrupts Channel Trafficking Resulting in Combined Immunodeficiency. J. Clin.Immunol. 41(5): 1004–1015.
- Yu, F., Sun, L. and Machaca, K. (2009). Orai1 internalization and STIM1 clustering inhibition modulate SOCE inactivation during meiosis. Proc. Natl. Acad. Sci. U.S.A. 106(41): 17401–17406.
Article Information
Copyright
© 2023 The Author(s); This is an open access article under the CC BY-NC license (https://creativecommons.org/licenses/by-nc/4.0/).
How to cite
Readers should cite both the Bio-protocol article and the original research article where this protocol was used:
- Hodeify, R. and Machaca, K. (2023). Methods to Quantify the Dynamic Recycling of Plasma Membrane Channels. Bio-protocol 13(17): e4800. DOI: 10.21769/BioProtoc.4800.
- Hodeify, R., Nandakumar, M., Own, M., Courjaret, R. J., Graumann, J., Hubrack, S. Z. and Machaca, K. (2018). The CCT chaperonin is a novel regulator of Ca2+ signaling through modulation of Orai1 trafficking. Sci. Adv. 4(9): eaau1935.
Category
Cell Biology > Cell-based analysis > Endocytosis
Cell Biology > Cell imaging > Fluorescence
Cell Biology > Cell signaling > Intracellular Signaling
Do you have any questions about this protocol?
Post your question to gather feedback from the community. We will also invite the authors of this article to respond.