- Protocols

- Articles and Issues
- For Authors
- About
- Become a Reviewer

Isoform-specific, Semi-quantitative Determination of Highly Homologous Protein Levels via CRISPR-Cas9-mediated HiBiT Tagging
Published: Vol 13, Iss 14, Jul 20, 2023 DOI: 10.21769/BioProtoc.4777 Views: 2551
Reviewed by: David PaulManoj B. MenonTalita Diniz Melo Hanchuk
Original research article
The authors used this protocol in:

May 2022
Advertisement


Protocol Collections
Comprehensive collections of detailed, peer-reviewed protocols focusing on specific topics


Abstract
Many protein families consist of multiple highly homologous proteins, whether they are encoded by different genes or originating from the same genomic location. Predominance of certain isoforms has been linked to various pathological conditions, such as cancer. Detection and relative quantification of protein isoforms in research are commonly done via immunoblotting, immunohistochemistry, or immunofluorescence, where antibodies against an isoform-specific epitope of particular family members are used. However, isoform-specific antibodies are not always available, making it impossible to decipher isoform-specific protein expression patterns. Here, we describe the insertion of the versatile 11 amino acid HiBiT tag into the genomic location of the protein of interest. This tag was developed and is distributed by Promega (Fitchburg, WI, USA). This protocol describes precise and specific protein expression analysis of highly homologous proteins through expression of the HiBiT tag, enabling protein expression quantification when specific antibodies are missing. Protein expression can be analyzed through traditional methods such as western blotting or immunofluorescence, and also in a luciferase binary reporter system, allowing for reliable and fast relative expression quantification using a plate reader.
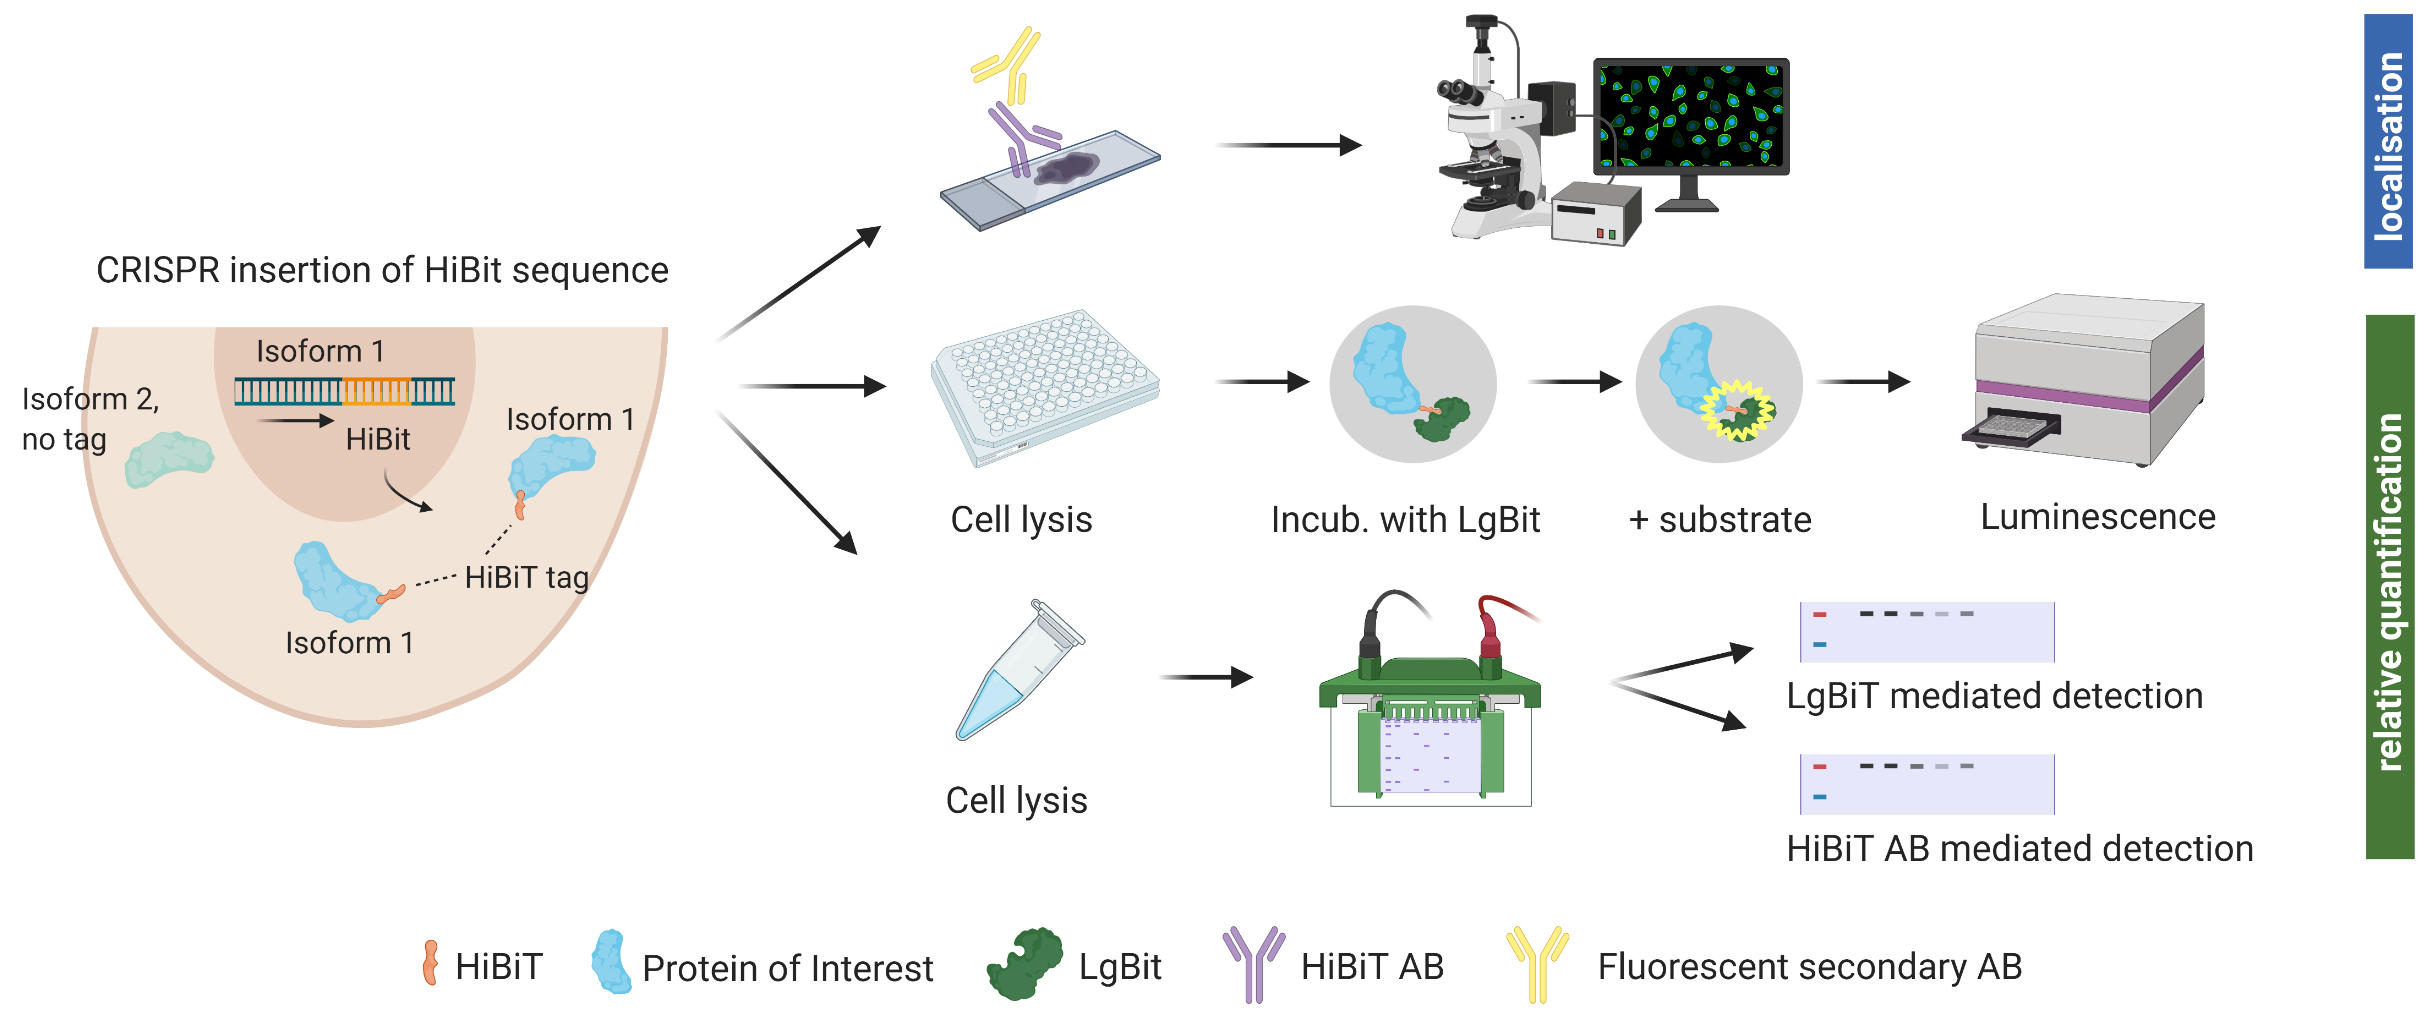
Graphical overview
Background
There is hardly a protein to be found within the human body that does not share extensive sequence homology to a family member or isoform, as the human cell requires redundancies to ensure continuous work. Protein isoforms are sometimes encoded by different genes and, often, specific genes have multiple transcripts, returning slightly different proteins depending on how they are spliced. Many diseases are characterized by the predominant expression of specific enzyme isoforms, and isoform expression is often quantified at RNA levels by RT-qPCR, sequencing, or microarrays. Quantifying levels of highly homologous proteins, on the other hand, is difficult and limited by the availability of isoform-specific antibodies. Additionally, batch-to-batch variations in antibody performance as well as recognition of unspecific binding partners sometimes hamper precise protein identification through this method (Voskuil, 2017). Furthermore, when studying newly identified isoforms or lesser studied protein families, there are often no monoclonal, isoform-specific antibodies available. We encountered this issue in our investigation of hexokinase 2 (HK2) and HK3, glycolytic enzymes of the hexokinase family. While sequence homology between HK2 and HK3 is only roughly 54%, we struggled to find appropriate antibodies detecting specifically one isoform or the other when 293T cells were transfected with either HK1, HK2, or HK3 and subsequently stained with a monoclonal antibody for HK2 as well as three antibodies for HK3 (two polyclonal, one monoclonal). The use of polyclonal antibodies should be assessed carefully, as larger immunogens increase the likelihood of producing signals from various family members. If the proteins do not vary in size, their distinction is impossible. HK2 and HK3 are both roughly 100 kDa in size; using antibodies against HK3, we detected signals on western blot in samples that were confirmed HK3-negative through mass spectrometry. This prompted us to generate a protocol for isoform-specific detection of endogenous protein expression without cross-reaction bias.
We hereby suggest the use of an endogenous tag that can be inserted into precise genomic locations and allows relative quantification and identification of protein isoforms through various methods. The system was developed by Promega (Fitchburg, WI, USA) (Schwinn et al., 2018 and 2020). The HiBiT® peptide tag used is 11 amino acids small and binds tightly to an adaptor protein (LgBiT®) when supplied. Through this interaction, the bright luminescent protein NanoBiT® is reconstituted (Dixon et al., 2016). Luminescent intensity from reconstituted NanoBiT is directly proportional to the amount of HiBiT present. This allows for relative protein quantification using a common plate reader. Cell lysate can also be analyzed via SDS gel and subsequent incubation of the membrane with LgBiT®. Furthermore, Promega recently launched an anti-HiBiT monoclonal antibody, which allows visualizing protein localization and expression within a cell using fluorescent microscopy. The anti-HiBiT antibody can also be used in traditional western blotting.
In order to insert the tag into the genomic locus of interest, CRISPR/Cas9-mediated genome editing is used. For successful editing, a sgRNA that binds very close to the desired insertion of the HiBiT tag is complexed with Cas9, and single-strand donor DNA templates (ssODN) for homology-directed repair are supplemented. A few days after electroporation of the cells with Cas9/sgRNA ribonucleoprotein complex (RNP) and ssODN, cells can be assessed for insertion of the tag using a plate reader. While luminescent signal for bulk edited cells in culture was stable during cell propagation, we recommend growing monoclonal populations with 100% of cells expressing the tag for reliable protein quantification.
With the recently launched anti-HiBiT monoclonal antibody, further downstream experiments such as fluorescent microscopy are possible but will require prior optimization.
This example follows the tagging of two hexokinase proteins (HK2 and HK3), two highly homologous proteins encoded on different chromosomes (Figure 1). Here, we show the results of adding the HiBiT tag to the C-terminal end, but inserting the tag at the N-terminus resulted in the generation of a luminescent signal as well. While this strategy is therefore applicable to splice isoforms that differ in either the first or last exon, we do not currently know whether insertion of the tag within the gene body will allow for binding of the adaptor protein and whether this technique can be applied for splice isoforms that share the first and last exon. Insertion of the tag within the gene body could potentially alter protein folding and/or function, presenting a potential limitation for this technique.
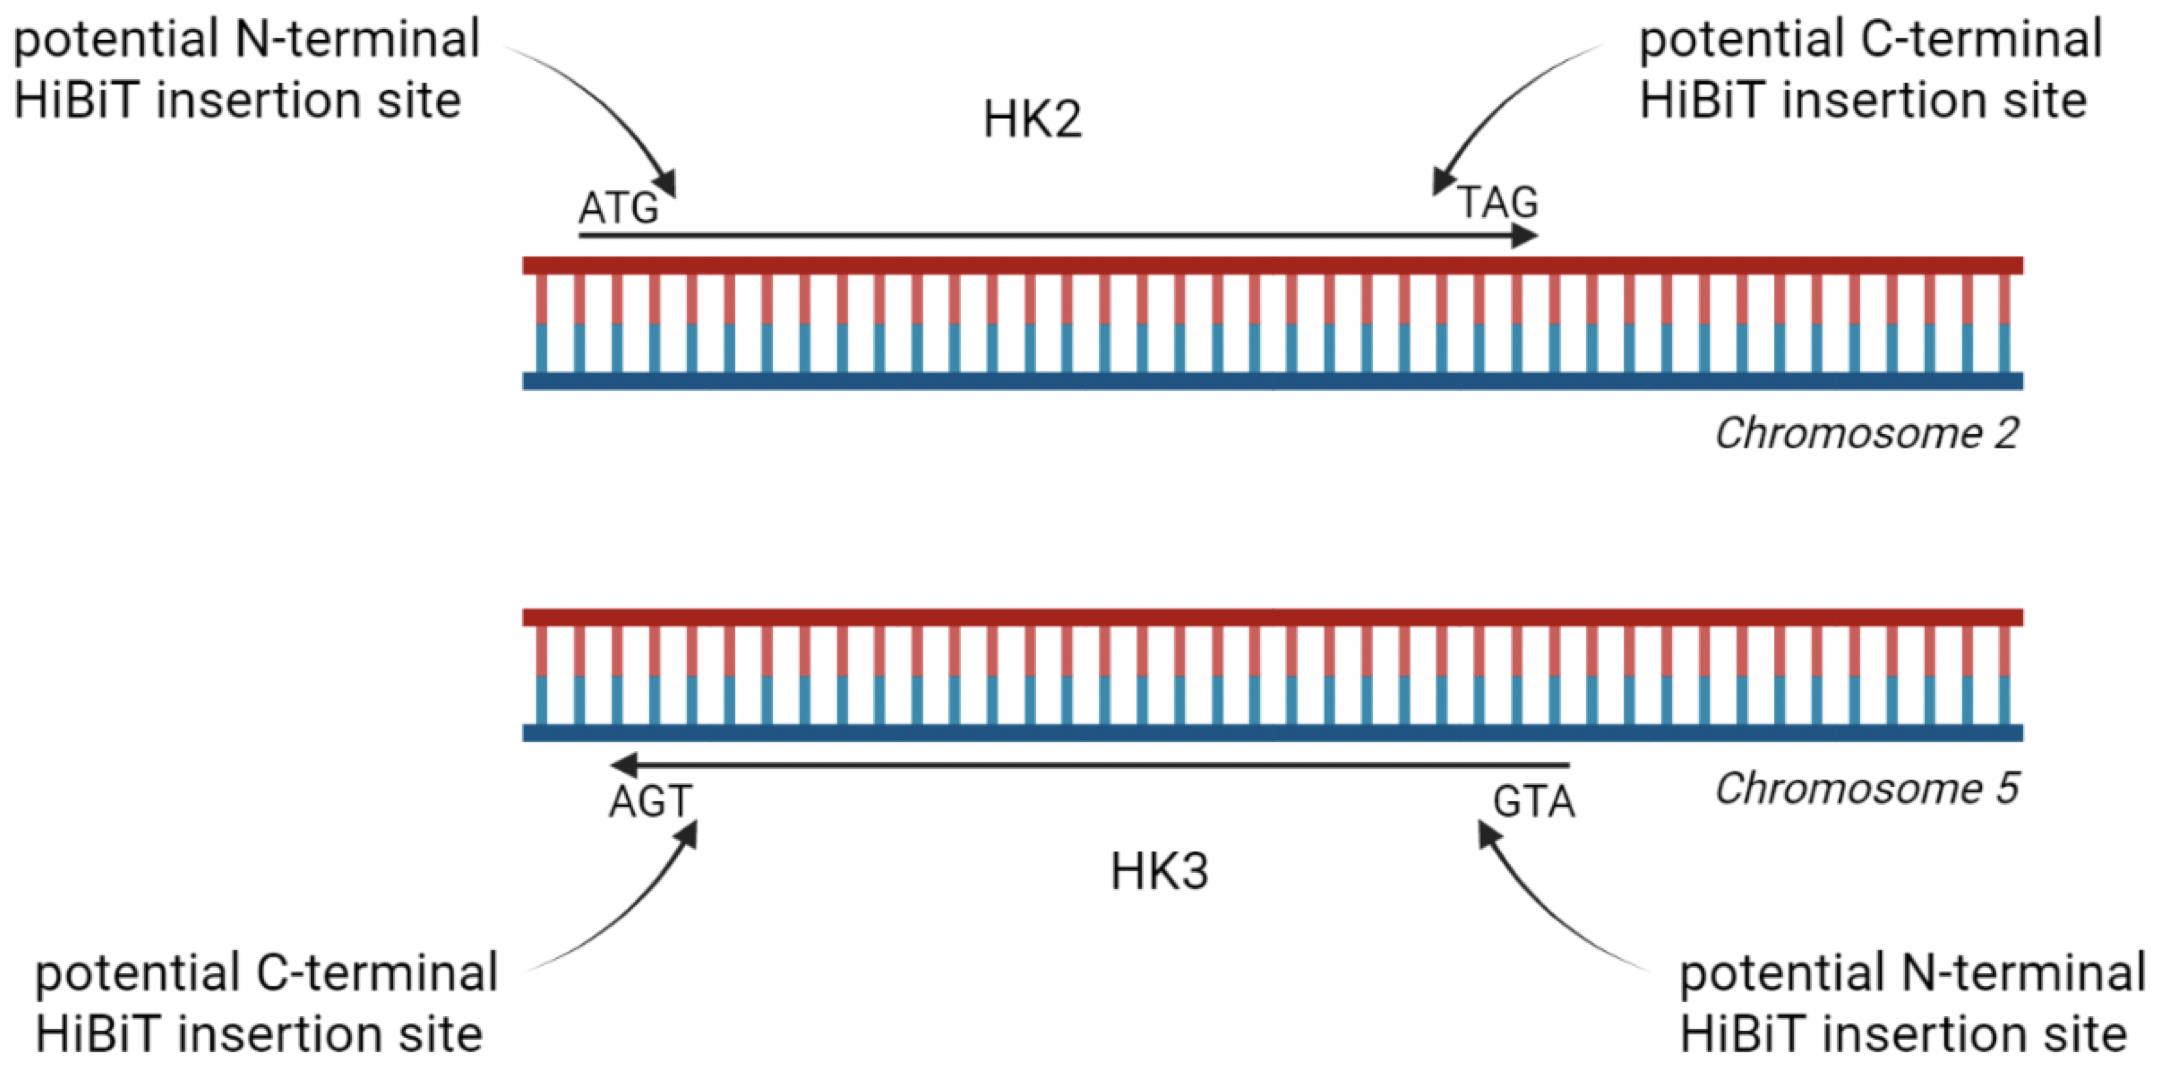
Figure 1. Schematic illustration of tagging options for homologous proteins hexokinase 2 (HK2) and HK3. HiBiT tag can be inserted at either the N- or C-terminal end. Data shown in this protocol are generated with HK2 and HK3 tagged at their C-terminal end.
Materials and reagents
Gene-specific Alt-R® CRISPR-Cas9 sgRNA [Integrated DNA Technologies (IDT)], store at -80 °C
ssODN: gene-specific Alt-R® HDR Donor Oligos (IDT)
eSpCas9-GFP protein (Sigma-Aldrich, catalog number: ECAS9GFPPR-50UG), store at -20 °C
Note: Using a GFP-tagged Cas9 helps visualize electroporation efficiency, but is not needed
Alt-R® HDR enhancer 100 μL (IDT, catalog number: 1081072), store at -20 °C
NeonTM Transfection System 10 μL kit, containing buffers R, T, and E, as well as NeonTM tips and NeonTM electroporation tubes (Thermo Fisher Scientific, catalog number: MPK1025), store buffers at 4 °C after opening; store the remaining components at room temperature (RT)
Sodium chloride (NaCl) (Sigma-Aldrich, catalog number: S3014)
Potassium chloride (KCl) (Sigma-Aldrich, catalog number: P9541)
Sodium phosphate dibasic (Na2HPO4) (Sigma-Aldrich, catalog number: S9763)
Potassium phosphate monobasic (KH2PO4) (Sigma-Aldrich, catalog number: P5655)
Growth medium suitable for the cell type used [here, we used RPMI 1640 (Sigma Aldrich, catalog number: R8758) supplemented with 10% fetal bovine serum]
Nano-Glo® HiBiT lytic detection system (Promega, catalog number: N3030), store at -20 °C
cOmpleteTM proteinase inhibitor cocktail (Roche, catalog number: 11697498001), store at -20 °C
Nano-Glo® HiBiT blotting system (Promega, catalog number: N2410), store at -20 °C
White microplates suitable for luminescence
4%–20% Mini-PROTEAN® TGC Stain-FreeTM protein gel (Bio-Rad, catalog number: 4568093)
Molecular weight marker, such as Precision Plus ProteinTM KaleidoscopeTM Standard (Bio-Rad, catalog number: 1610375EDU)
Trans-Blot Turbo RTA Mini 0.2 μm Nitrocellulose Transfer kit (Bio-Rad, catalog number: 1704270)
Tris-HCl (Sigma-Aldrich, catalog number: 1083190100)
Triton® X-100 (Sigma-Aldrich, catalog number: X100)
Sodium deoxycholate (Sigma-Aldrich, catalog number: D6750)
Tris base (Trizma® base, Sigma-Aldrich, catalog number: 93352)
Tween® 20 (Sigma-Aldrich, catalog number: P1379)
PBS (see Recipes)
Lysis buffer for HiBiT blotting (see Recipes)
TBS-T (see Recipes)
Equipment
NeonTM transfection system (Thermo Fisher Scientific, catalog number: MPK5000)
Luminescence plate reader (Tecan Group, Tecan Infinite® 200 PRO)
2-D protein electrophoresis equipment (Mini-PROTEAN Tetra Vertical Electrophoresis Cell and PowerPac Power supply, Bio-Rad)
Trans-Blot Turbo transfer system
ChemiDoc XRS+ imaging system (Bio-Rad)
Software
gRNA design tools:
https://chopchop.cbu.uib.no/, https://eu.idtdna.com/site/order/designtool/index/CRISPR_SEQUENCE
ImageLab: acquisition of chemiluminescent images using ChemiDoc imaging system
ImageJ: relative quantification of chemiluminescent signal
Procedure
Design of gRNA and ssODN
Identify desired locus of HiBiT tag insertion (for example at the C- or N-terminal end, directly after the start codon or right before the stop codon).
Identify appropriate gRNA sequences within ± 30 nucleotides of locus of insertion; for improved result, compare gRNA efficiency over various publicly available algorithms (we have not tested gRNA sequences more than 30 nt away from the site of insertion).
Design ssODN with at least 80 nucleotides homology arms upstream and downstream of Cas9 cut site (total length of ssODN is 180–200 nt).
To prevent Cas9 from binding to and cutting the ssODN, insert 2–3 silent mutations into the gRNA sequence within the ssODN, preferentially the PAM sequence if possible.
Table 1. Sequences for homology-directed repair–mediated insertion of HiBiT-tag into C-terminus of Hexokinase isoforms
Protein sgRNA sequence PAM ssODN HK2 ATAGAACCCCTGAAATCGGA AGG CTGCAGTCAGAGGATGGCAGCGGGAAGGGGGCGGCGCTCATCACTGCTGTGGCCTGCCGCATCCGTGAGGCTGGACAGCGAGTGAGCGGCTGGCGGCTGTTCAAGAAGATTAGCTAGATCCCCTGAAATCGAAAGCGACTTCCTCTTTCTCTCCTTCTTCCCTGTTTTAAATTATAAGATGTCATCCCCTTGTGT HK3 TCGTGTCTGAGGAAACCTCC CGG GATGGGTCCGGCAAAGGTGCGGCCCTGGTCACCGCTGTTGCCTGCCGCCTTGCGCAGTTGACTCGTGTCGTGAGCGGCTGGCGGCTGTTCAAGAAGATTAGCTGAGGAAACCTCCACGCTGAGGAGGTCTCCGCCGCAGCCTTGCTGGAGCCGGGTCGGGGTCTGCCTGTTTCCCAGCCAGGCCC blue: HiBiT tag; orange: sgRNA sequence; red: Stop codon; green: PAM sequence; purple: silent mutations inserted to prevent Cas9 from binding to ssODN
Electroporation
Prepare stock solutions:
Cas9: 20 μM
sgRNA: 50 μM
ssODN: 100 μM
In a total volume of 7 μL, add 15 pmol of Cas9 and 75 pmol of sgRNA to buffer R or T (depending on the cell type, see NeonTM instructions).
Note: The ratio between sgRNA and Cas9 can be empirically titrated for best efficiency. We recommend a ratio of 5:1–9:1.
Example, per reaction:
1.5 μL of sgRNA (75 pmol)
0.75 μL of Cas9 (15 pmol)
4.75 μL of buffer R or T
Incubate for 15 min at RT. RNP complexes are stable for 1 h at RT.
Note: RNPs can be complexed prior to the experiment and stored for two weeks at 4 °C or up to at least 10 weeks at -80 °C without loss in performance.
Prepare a 96-well plate with 100 μL of growth medium (suitable for your cell type) containing 30 μM of HDR enhancer to collect cells after electroporation. Prewarm to 37 °C.
Add 75 pmol of ssODN (0.75 μL of 100 μM stock) to the complexed RNPs.
Wash in PBS.
Prepare the electroporator station: fill electroporation tube with 3 mL of buffer E. Settings vary depending on the cell line, and optimized settings and cell numbers for many cell lines can be found at Thermo Fisher (https://www.thermofisher.com/us/en/home/life-science/cell-culture/transfection/neon-transfection-system/neon-transfection-system-cell-line-data.html).
Count cells, take the appropriate cell number, and resuspend in 5 μL of buffer R or T per electroporation, including appropriate controls (electroporation only, untargeted sgRNA).
Add 5 μL of cell suspension to 7 μL of RNP complex. Keep cell exposure to buffers R or T at a minimum (≤ 15 min).
Using a 10 μL NeonTM electroporation tip, electroporate cells and transfer into prewarmed media (step B4).
Transfer cells to a humidified incubator at 37 °C with 5% CO2 immediately.
Do not disturb cells for 24 h.
After 24 h, electroporation efficiency can be assessed visually by examining the presence of eCas9-GFP in live cells using a fluorescent microscope. Handle plate with care and avoid extended exposure to ambient temperature.
Check for HiBiT insertion
Let cells grow until you can comfortably remove 5 × 10⁴ cells.
Prepare Nano-Glo® HiBiT lytic detection reagent by allowing buffer to thaw to RT.
Note: This assay can be performed in various well formats. We prefer using the 384-well format and adding 20 μL of detection reagent to 20 μL of cell suspension. For statistical reasons, we recommend performing the assay in no less than triplicates.
Dilute assay reagents into assay buffer according to the manufacturer’s instructions.
Count cells and add equal numbers of cells per well.
Note: We use 15,000 cells per 384-well plate.
Add detection reagent and ensure homogeneous lysis by pipetting up and down. Be sure to include a no-HiBiT-expressing negative control.
Equilibrate to RT for 10 min.
Measure luminescence.
Monoclonal population
In case editing efficiency or endogenous protein expression is very low, single-cell monoclonal populations can be obtained through limiting dilution assay.
To improve efficiency in growing edited monoclonal populations, we recommend preselecting HiBiT-expressing populations grown from 10 cells and performing limiting dilution assay after preselection.
Of edited bulk population, plate 10 cells/well in a 96-well format.
After enough cells have grown, screen populations for highest HiBiT expression using Nano-Glo® HiBiT lytic detection.
From the highest expressing populations, perform limiting dilution assay.
Grow and screen monoclonal populations.
HiBiT blotting (optional)
To ensure the HiBiT insertion has occurred at the correct protein, the size of the fusion protein can be tested via blotting.
Isolate protein using the lysis buffer for HiBiT blotting (see Recipes) and quantify protein content (e.g., Bradford assay).
Separate the appropriate volume of protein for the expected protein expression on a gel (e.g., 4%–20% Mini-PROTEAN® TGC Stain-FreeTM protein gel) and include a molecular weight marker.
If using stain-free gel technology, activate gel according to the manufacturer’s protocol.
Transfer protein onto a nitrocellulose membrane (e.g., via semi-dry Turbo-Blot transfer).
After transfer, wash membrane in TBS-T (see Recipes). Do not allow membrane to dry.
Acquire total protein image to allow for relative quantification.
Prepare Nano-Glo® HiBiT blotting solution according to the manufacturer’s instructions: dilute LgBiT protein 200-fold with 1× Nano-Glo® blotting buffer, mix by inversion, remove TBS-T, and cover the membrane in blotting solution.
Incubate for 1 h at RT while gently rocking.
Note: For increased signal, incubation can be prolonged up to overnight incubation at 4 °C. If incubating at 4 °C, allow equilibration to RT before adding the substrate after incubation.
Dilute the Nano-Glo® Luciferase Assay Substrate 500-fold into the solution covering the membrane.
Incubate for 5 min at RT.
Acquire chemiluminescent image using an appropriate imager (e.g., ChemiDoc XRS+).
Note: As an alternative to the HiBiT blotting system, a conventional immunoblot can be performed using Promega’s mouse anti-HiBiT mAB (catalog number: N7200).
Perform your experiment
Quantify relative endogenous protein expression at desired time points using NanoGlo® HiBiT lytic detection (Figure 2), Nano-Glo® HiBiT blotting system (Figure 3), or conventional immunoblot.
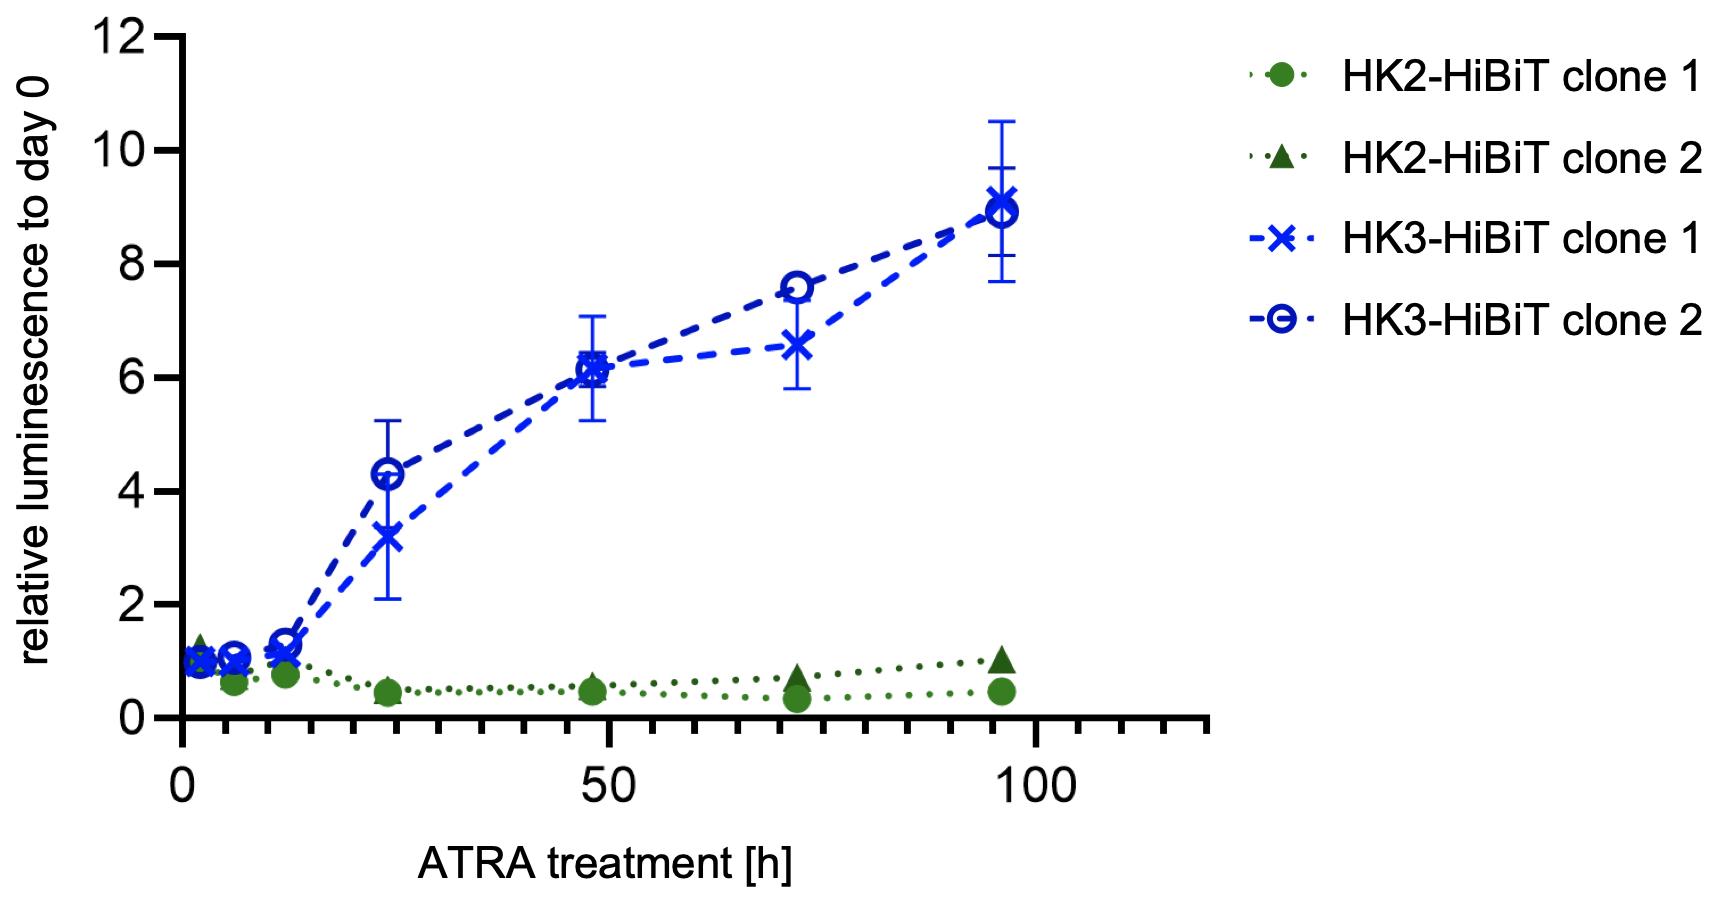
Figure 2. Relative quantification of hexokinase 2 (HK2) and HK3 protein levels upon all-trans retinoic acid (ATRA, 1 μM) treatment of HiBiT-tagged HL60 AML cell lines. Endogenous tagging allows to specifically detect upregulation of isoform 3, while levels of isoform 2 remain constant.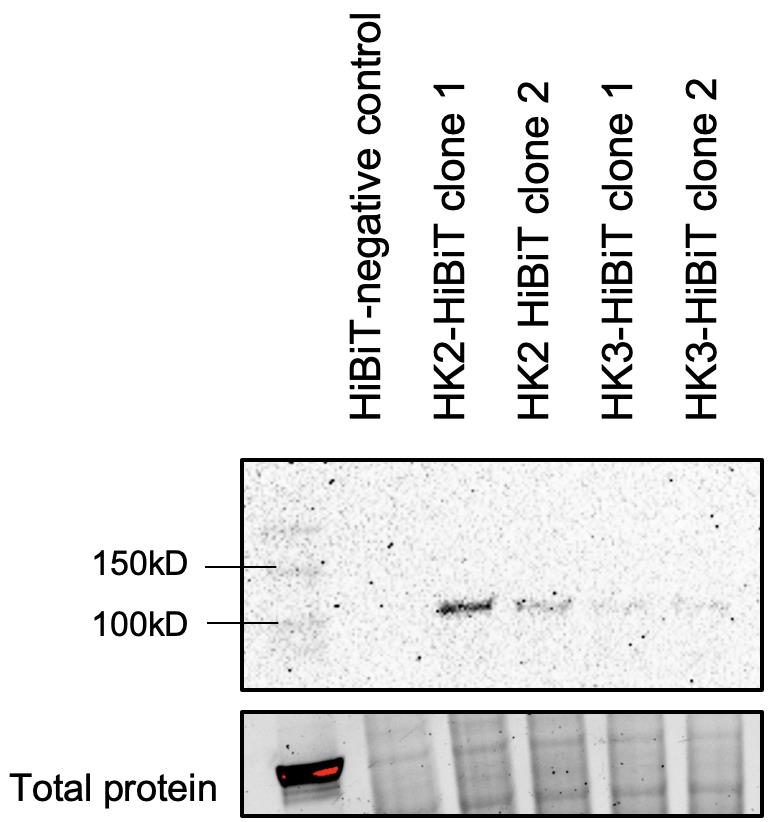
Figure 3. Nano-Glo® HiBiT blotting system. Steady-state hexokinase 2 (HK2) and HK3 levels in HL60 AML cells detected via HiBiT tag. Of note, HK3 is very lowly expressed at steady-state level in AML cells.
Data analysis
Nano-Glo® HiBiT lytic detection: quantify relative protein expression using luminescence readings, subtracting readings of negative control.
Nano-Glo® HiBiT blotting system: quantify relative protein expression via luminescence signal on images, using software like ImageJ. Normalize to the volume of total protein or to a housekeeping reference protein (β-tubulin, GAPDH).
Notes
To verify insertion of HiBiT tag, it is also possible to perform a PCR reaction using a primer pair that is specific for both the tag as well as the locus of insertion.
Insertion locus of the tag: the optimal tag-insertion locus for each protein of interest should be determined individually. Tag insertion at either the C- or N-terminal end of HK2 and HK3 resulted in the generation of a luminescent signal. We do not currently know if insertion of the tag at genomic regions other than the termini allows for binding of the LgBiT adaptor protein.
Splice variants: this protocol is applicable for highly homologous proteins encoded on different chromosomes as well as splicing variants that differ in either their first or last exon. For other splice isoforms, it would need to be tested whether integration of the HiBiT tag internally allows for binding of the LgBiT adaptor protein while preserving protein function.
Recipes
PBS
137 mM NaCl, 2.7 mM KCl, 10 mM Na2HPO4, 1.8mM KH2PO4
Lysis buffer for HiBiT blotting
50 mM Tris-HCl, 150 mM NaCl, 1% Triton® X-100, 0.1% sodium deoxycholate, pH 7.5
TBS-T
20 mM Tris base, 150 mM NaCl, 0.1% Tween® 20
Acknowledgments
We thank Promega for technical support during optimization of this protocol. This study was supported by grants from the Swiss National Science Foundation and Krebsforschung Schweiz (31003A_173219 to MPT and MD-PhD 03/17 Scholarship to KS).
Competing interests
The authors declare no conflict of interests.
References
- Dixon, A. S., Schwinn, M. K., Hall, M. P., Zimmerman, K., Otto, P., Lubben, T. H., Butler, B. L., Binkowski, B. F., Machleidt, T., Kirkland, T. A., et al. (2016). NanoLuc Complementation Reporter Optimized for Accurate Measurement of Protein Interactions in Cells. ACS Chem Biol 11(2): 400-408.
- Schwinn, M. K., Machleidt, T., Zimmerman, K., Eggers, C. T., Dixon, A. S., Hurst, R., Hall, M. P., Encell, L. P., Binkowski, B. F. and Wood, K. V. (2018). CRISPR-Mediated Tagging of Endogenous Proteins with a Luminescent Peptide. ACS Chem Biol 13(2): 467-474.
- Schwinn, M. K., Steffen, L. S., Zimmerman, K., Wood, K. V. and Machleidt, T. (2020). A Simple and Scalable Strategy for Analysis of Endogenous Protein Dynamics. Sci Rep 10(1): 8953.
- Voskuil, J. L. A. (2017). The challenges with the validation of research antibodies. F1000Res 6: 161.
Article Information
Copyright
© 2023 The Author(s); This is an open access article under the CC BY-NC license (https://creativecommons.org/licenses/by-nc/4.0/).
How to cite
Seiler, K., Rafiq, S. and Tschan, M. P. (2023). Isoform-specific, Semi-quantitative Determination of Highly Homologous Protein Levels via CRISPR-Cas9-mediated HiBiT Tagging. Bio-protocol 13(14): e4777. DOI: 10.21769/BioProtoc.4777.
Category
Cancer Biology > General technique > Biochemical assays > Protein analysis
Molecular Biology > Protein > Detection
Do you have any questions about this protocol?
Post your question to gather feedback from the community. We will also invite the authors of this article to respond.