- Protocols

- Articles and Issues
- For Authors
- About
- Become a Reviewer

Fluorescent Biosensor Imaging of Nitrate in Arabidopsis thaliana

Published: Vol 13, Iss 16, Aug 20, 2023 DOI: 10.21769/BioProtoc.4743 Views: 3640
Reviewed by: David PaulLip Nam LOHAnonymous reviewer(s)
Original research article
The authors used this protocol in:
Oct 2022

Protocol Collections
Comprehensive collections of detailed, peer-reviewed protocols focusing on specific topics


Related protocols
Abstract
Nitrate (NO3–) is an essential element and nutrient for plants and animals. Despite extensive studies on the regulation of nitrate uptake and downstream responses in various cells, our knowledge of the distribution of nitrogen forms in different root cell types and their cellular compartments is still limited. Previous physiological models have relied on in vitro biochemistry and metabolite level analysis, which limits the ability to differentiate between cell types and compartments. Here, to address this, we report a nuclear-localized, genetically encoded fluorescent biosensor, which we named nlsNitraMeter3.0, for the quantitative visualization of nitrate concentration and distribution at the cellular level in Arabidopsis thaliana. This biosensor was specifically designed for nitrate measurements, not nitrite. Through genetic engineering to create and select sensors using yeast, Xenopus oocyte, and Arabidopsis expression systems, we developed a reversible and highly specific nitrate sensor. This method, combined with fluorescence imaging systems such as confocal microscopy, allows for the understanding and monitoring of nitrate transporter activity in plant root cells in a minimally invasive manner. Furthermore, this approach enables the functional analysis of nitrate transporters and the measurement of nitrate distribution in plants, providing a valuable tool for plant biology research. In summary, we provide a protocol for sensor development and a biosensor that can be used to monitor nitrate levels in plants.
Key features
• This protocol builds upon the concept of FRET biosensors for in vivo visualization of spatiotemporal nitrate levels at a cellular resolution.
• Nitrate levels can be quantified utilizing the biosensor in conjunction with either a plate reader or a fluorescence microscope.
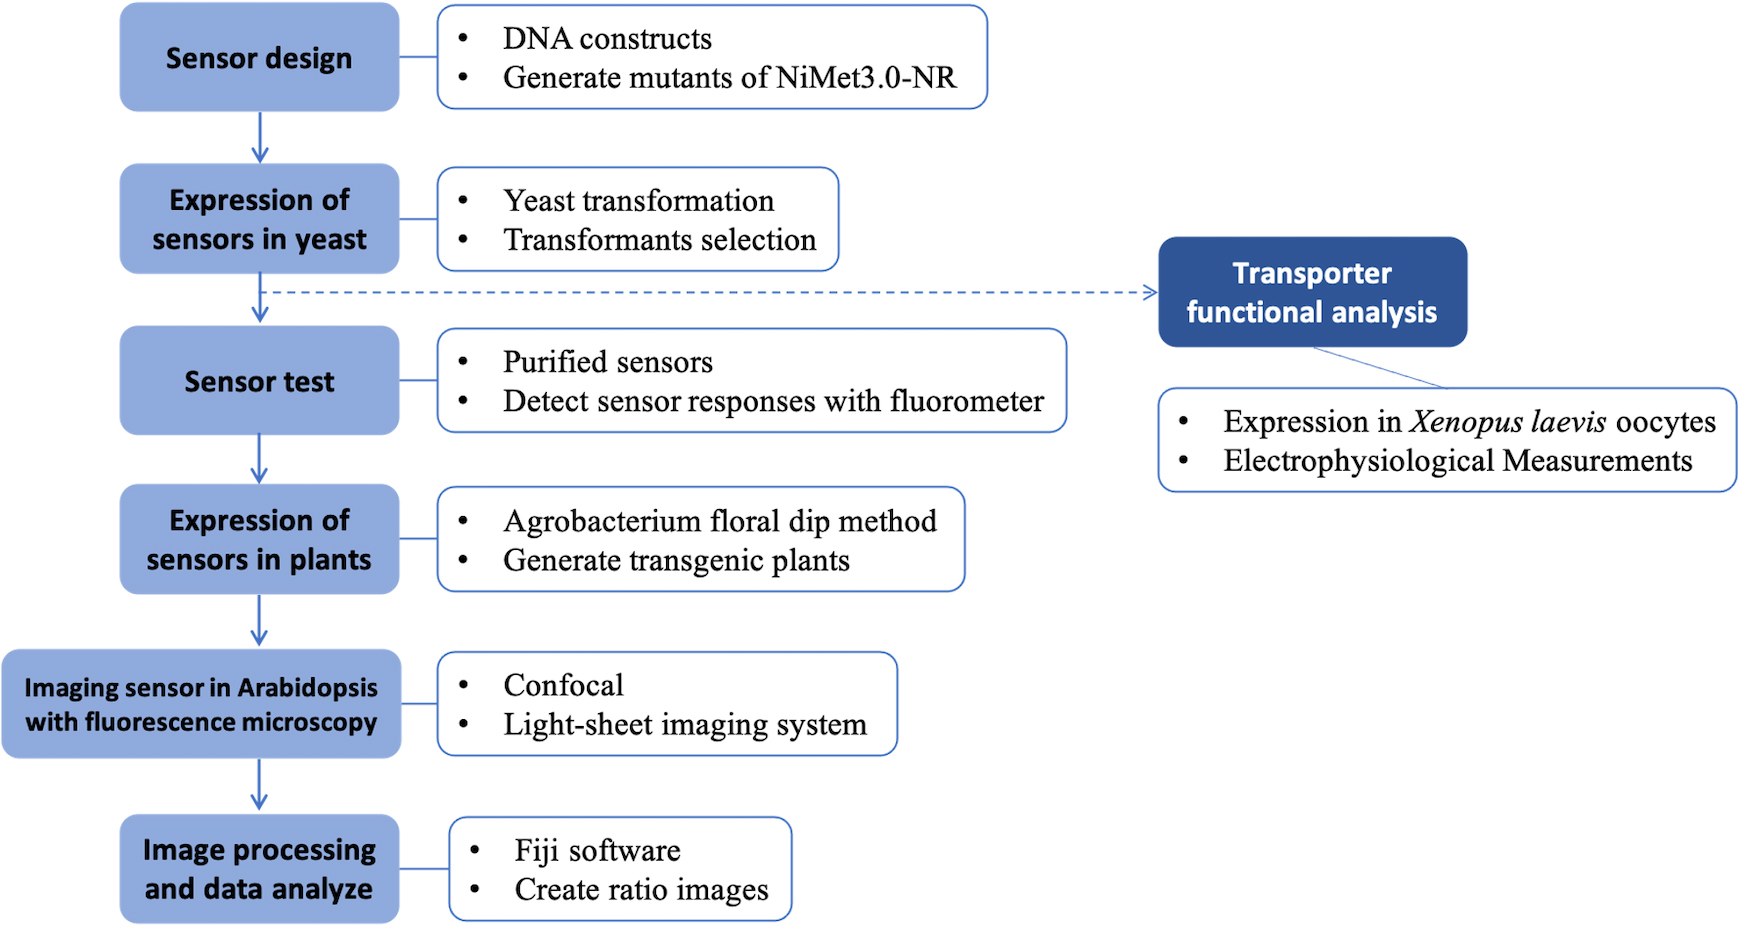
Graphical overview
Background
Genetically encoded sensors have been developed over the past decade. The first fluorescence protein–based calcium sensor, Cameleon, was created and utilized to monitor calcium signaling processes in plant stomata (Allen et al., 2001). Since then, other sensors have been developed and applied in both plant and animal biology. One example is the glucose sensors FLIPglu600μΔ13V and FLIPsuc90μ∆1V, which were created by Chen et al. (2010 and 2012, respectively). These optical sensors have proven useful not only for monitoring analyte levels and fluxes but also for identifying elusive sucrose efflux transporters required for phloem loading. Overall, genetically encoded sensors have proven to be highly versatile tools with broad applicability in a range of research settings.
In our study, we developed a Förster resonance energy transfer (FRET)-based nitrate sensor, named nlsNitraMeter3.0, to successfully monitor the steady-state levels, accumulation, and dynamic conditions of nitrate distribution and content in Arabidopsis thaliana through fluorescence confocal microscopy. Using this sensor, we can directly visualize the spatial and temporal distribution of nitrate with high resolution at the cellular level. In addition, the sensor can be used to acquire images through fluorescence microscopy before and after treatment with different media. Through image analysis software (e.g., Fiji), the images can be quantified. Furthermore, the concept and operation of nlsNitraMeter3.0 can be applied to develop new sensors that identify or characterize other molecules in plants. For instance, we previously reported that NPF1.3 plays a role as a nitrate transporter by some functional in vitro analysis (e.g., Xenopus laevis oocytes) (Chen and Ho, 2022).
Here, we provide the principles of engineering, detection methods, and application of nlsNitraMeter3.0. By following the protocol reported herein it will also be possible to develop further sensors (refer to Supplementary information).
Materials and reagents
Biological materials
Yeast strain: protease-deficient yeast strain BJ5465 (MATa, ura3–52, trp1, leu2Δ1, his3Δ200, pep4::HIS3, prb1Δ1.6R, can1, GAL+) (ATCC, catalog number: 208289TM), which was obtained from the Yeast Genetic Stock Center (University of California, Berkeley, CA).
Sensors: NIT domain/NasR
The full-length open reading frame of NasR from Klebsiella oxytoca (Boudes et al., 2012) in the pDONR221 GATEWAY Entry vector was used as a sensory domain to create the nitrate sensors NiMet3.0 and nlsNiMet3.0. Note: Constructs were inserted using an Entry clone by Gateway LR reactions into the yeast expression vectors pDRFlip30.
The NiMet3.0 is fused to the full-length of NasR with pDRFlip30 vector and sandwiched between an N-terminal Aphrodite t9 (AFPt9) variant (Deuschle et al., 2006), with nine amino acids truncated off the C terminus, and a C-terminal monomeric Cerulean (mCer) (Rizzo et al., 2006).
Note: The pDRFlip30 vector was modified from pDRFlip39 vector (Addgene, catalog number: 65517).
Agrobacterium strain: Agrobacterium tumefaciens strain GV3101 was used here to obtain high transformation rates and high levels of expression, typically leading to high copy insertion into the genome (Koncz and Schell, 1986).
Arabidopsis thaliana: wild type Col-0, a nitrate transporter mutant [npf6.3/NTR1;1/chl1-5 (Leran et al., 2014)], and a nitrate reductase mutant [nia1nia2 (Desikan et al., 2002)] were used.
Reagents
Potassium nitrate (KNO3) (Sigma-Aldrich, catalog number: P8394)
Potassium chlorate (KClO3) (STREM, catalog number: 93-1913)
Potassium chloride (KCl) (Sigma-Aldrich, catalog number: P5405)
Potassium nitrite (KNO2) (ARO, catalog number: 42306)
Potassium sulfate (K2SO4) (SHOWA, catalog number: 1648-4150-000-23)
Potassium sulfite (K2SO3) (ACROS, catalog number: 44021)
Potassium selenite (K2SeO3) (STREM, catalog number: 931971-000000-18)
Potassium molybdenum oxide, anhydrous (K2MoO4) (Alfa, catalog number: 22898-0000000-17)
Ammonium chloride (NH4Cl) (Merck, catalog number: 1.01145-0500)
Magnesium chloride hexahydrate (MgCl2·6H2O) (Sigma-Aldrich, catalog number: M9272)
Gly-Gly (Sigma-Aldrich, catalog number: G1002)
YNB, yeast nitrogen base w/o amino acids w/o ammonium sulfate (BD, Difco, catalog number: 233520)
DO supplement-Ura (Takara Bio Company, Clontech, catalog number: 630416)
D-(+)-Glucose monohydrate (Fluka Analytical, catalog number: 49159)
Sucrose (Merck, catalog number: 1.07687.1000)
Agar (BD BactoTM, catalog number: DIF214530)
Agar (PhytoagarTM, catalog number: 40100072)
MES hydrate (Sigma-Aldrich, catalog number: M2933)
MOPS (Sigma-Aldrich, catalog number: M3183)
Sodium hydroxide (NaOH) (Sigma-Aldrich, catalog number: S5881)
1,4-Dithiothreitol (DTT) (Sigma-Aldrich, catalog number: DTT-RO)
Carrier DNA [UltraPureTM salmon sperm DNA solution (Thermo Fisher Scientific, InvitrogenTM, catalog number: 115632-011)]
Ethylenediaminetetraacetic acid (EDTA) (Sigma-Aldrich, catalog number: E6758)
Polyethylene glycol 4000 (PEG4000) (Fluka Analytical, catalog number: 81240)
Lithium acetate dihydrate (LiOAc) (Sigma-Aldrich, catalog number: L4158)
Tris hydrochloride ultrapure bioreagent (Tris-Cl) (J.T. Baker, catalog number: 4103-02)
Sodium chloride (NaCl) (Merck, catalog number: 1.06404.1000)
Sodium hydroxide (NaOH) (Merck, catalog number: 1.06498.1000)
Peptone (BD BactoTM, catalog number: 211677)
Yeast extract (BD BactoTM, catalog number: 212750)
MS modified basal salt mixture without nitrogen (MS) (PhytoTech Labs, catalog number: M531)
MilliQ or distilled water
Spectinomycin
Kanamycin
Solutions
40% (w/v) glucose solution (sterile and filtrated)
MOPS buffer
MES buffer
Yeast extract peptone dextrose (YPD) medium (see Recipe 1)
Solid yeast nitrogen base (see Recipe 2)
PLATE mixture (the acronym of PEG, lithium acetate, Tris, and EDTA) (see Recipe 3)
Wash buffer (see Recipe 4)
Resuspension buffer (see Recipe 5)
Substrate addition (see Recipe 6)
Plant growth solid base (see Recipe 7)
Recipes
Yeast extract peptone dextrose (YPD) mediuma, c
Reagent Final concentration Amount Peptone 2.0% (w/v) 10 g Yeast extract 1.0% (w/v) 5 g Agar 2.4% (w/v) 12 g 40% sterile filtrated glucoseb 2% (w/v) 25 mL H2O n/a n/a Total n/a 500 mL Autoclave, 121 °C, 15 psi, 15 min
For liquid medium, when hand-warm, add glucose from 40% sterile filtrated stock to a final concentration of 2% under a sterile hood (e.g., biosafety cabinet).
For solid medium, add 20 g/L agar before autoclaving. Add sterile filtrated glucose from 40% stock to a final concentration of 2% when the medium is hand-warm before pouring plates.
Solid yeast nitrogen base (-ura DropOut medium)a, c
Reagent Final concentration Amount Yeast nitrogen base w/o amino acids w/o ammonium sulfate 1.7 g/L 1.7 g DO supplement-Urad 0.77 g/L 0.77 g 40% sterile filtrated glucoseb 2% (w/v) 50 mL H2O n/a to 1,000 mL Total n/a 1,000 mL Autoclave, 121 °C, 15 psi, 15 min
For liquid medium, when hand-warm, add glucose from 40% sterile filtrated stock to a final concentration of 2% under a sterile hood (e.g., biosafety cabinet).
For solid medium, add 20 g/L agar before autoclaving. Add sterile filtrated glucose from 40% stock to a final concentration of 2% when the medium is hand-warm before pouring plates.
Adjust the pH of the -ura DropOut medium to pH 5.8 with NaOH before addition of agar and autoclaving.
PLATE mixture for yeast transformation
Reagent Amount 45% PEG4000 90 mL 1 M LiOAc 10 mL 1M Tris-Cl (pH7.5) 1 mL 0.5M EDTA 0.2 mL Total 100 mL Wash buffer
Reagent Final concentration Amount MES 50 mM 9.76 g Total n/a 1,000 mL Adjust the pH of the MES buffer to pH 5.5 with NaOH and autoclave.
Autoclave, 121 °C, 15 psi, 15 min.
Resuspension buffer
Reagent Final concentration Amount MES buffer (Recipe 4) 50 mM 250 mL Agar 0.05% 0.125 g Total n/a 250 mL Wait until the medium cools to room temperature (RT) to delay sedimentation of the cells during the measurement.
Plant growth solid basea–d
Reagent Final concentration Amount MS salts without nitrogen 1/2 strength 0.78 g 20% sterile filtrated sucrose 0.5 % (w/v) 25 mL Total n/a 1,000 mL Adjust the pH to pH 5.5 with KOH before addition of agar and autoclaving.
Autoclave, 121 °C, 15 psi, 15 min
For liquid medium, when hand-warm, add sucrose from 20% sterile filtrated stock to a final concentration of 0.5% under a sterile hood (e.g., biosafety cabinet).
For solid medium, add 12 g/L PhytoagarTM before autoclaving. Add sterile filtrated glucose from 20% stock to a final concentration of 0.5% when the medium is hand-warm before pouring plates.
Substrate addition
Reagent Final concentration Amount KNO3 or other substrates (Reagent 1–11) Depending on the experimental design - MES buffer 50 mM - Total n/a 50 mL Depending on the concentration of the nitrate needed, use the nitrate stock solution and dilute it with MES buffer or MOPS buffer.
Laboratory supplies
96-well microplates (flat bottom clear or black) (Greiner Bio-One, catalog numbers: 650101 and 650209)
Note: Black plates have a lower background.
Multichannel (12) pipette (for 100 μL) (e.g., Sartorius, catalog number: 725240)
50 mL sterile plastic tubes (Falcon®)
Petri dishes (diameter: 9 mm; height: 15 mm; sterile) (Alpha Plus, catalog number: BL6905)
Glass beads (3 mm) (BasicLife, catalog number: CEO-1169)
Vacuum-driven filter system (250 mL, upper cup, 0.22 μm PES) (AGC, catalog number: AGC-VC-PES22-250-1CS)
Equipment
Monochromator-based spectrofluorimeter for 96-well plates [Safire or Infinite® M1000 (Tecan Trading)]
Cell density meter (Amersham, model: Ultrospec 10)
Orbital shaker, with temperature and velocity control (Eppendorf, New Brunswick Scientific, model: Innova 44)
Incubator for 28–30 °C incubation of yeast cells (YIHDER, model: LM-570RD)
Centrifuge with swinging rotor for 50 mL tubes (Eppendorf, model: 5810R)
Inverted confocal plus super resolution microscope (Zeiss, LSM 780 + ELYRA): high sensitivity confocal microscope is equipped with GaAsP spectrum detector, and the super resolution microscope is a Structure Illumination Microscopy.
The laboratory-established light-sheet system was made in cooperation with Microlambda Pte Ltd (Singapore)
Growth chamber
Software and datasets
MetaMorph software (Downingtown, PA)
Fiji (http://fiji.sc/)
GraphPad Prism version 9.0.0 for Mac (www.graphpad.com)
Procedure
FRET sensor design
For a detailed account of the generation of the sensor DNA constructs and the sensor mutants, please refer to Chen and Ho (2022). In this section, we just report a few concepts of the sensor design.
DNA constructs
Based on the FRET characteristic, we designed the Gateway expression clones with an insert of the bacterial (K. oxytoca) NasR/NIT domain (Figure 1).
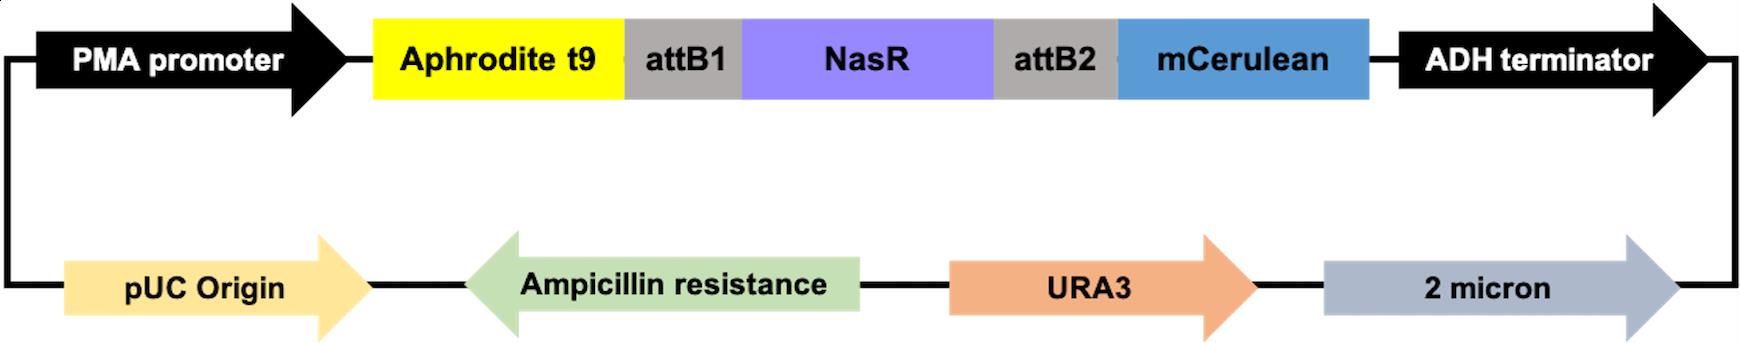
Figure 1. Map of pDRFlip30-NasR plasmids. NasR, an NO3– binding protein, was fused via attB1 and attB2 linkers to a fluorescent protein FRET pair (donor: Aphrodite, and acceptor: Cerulean). The NasR protein (purple) representation is from a published structure of NasR [PDB 4AKK (Boudes et al., 2012)]. The Aphrodite (yellow) representation is from a published structure of Venus [PDB 1MYW (Rekas et al., 2002)] and the Cerulean (blue) representation is from a published structure of Cerulean [PDB 2WSO (Lelimousin et al., 2009)].
Expression of sensors in yeast and fluorescence analysis
Yeast transformation
The protease-deficient yeast strain BJ5465 is transformed with the sensors containing the desired above (e.g., NiMet-NIT, NiMet1.0, NiMet2.0, NiMet3.0, nlsNiMet3.0, or NiMet3.0-NRs) by using the modified lithium acetate method from Gietz et al. (1992). In brief:
Inoculate cultures in YPD medium and grow at 30 °C overnight to absorbance ~0.5 at OD 600 nm.
Spin down (2,000× g) 1 mL of cells in a microfuge tube (15 s) for each transformation.
Decant the supernatant and resuspend the cells in 100 μL of YPD medium by vortexing.
Add 2 μL of 10 mg/mL carrier DNA and vortex.
Add ~1 μg plasmid and vortex.
Add 0.5 mL of PLATE mixture [100 mL stock containing 90 mL of 45% PEG4000, 10 mL of 1 M lithium acetate, 1 mL of 1 M Tris-Cl (pH 7.5), 0.2 mL of 0.5 M EDTA] and vortex.
Add 20 μL 1 M DTT and vortex.
Incubate at 25 for 6–8 h or overnight.
Heat-shock cells for 10 min at 42 °C.
Place a pipette tip directly into the bottom of the tube, withdraw 50–100 μL of cells, and plate cells on solid -ura DropOut medium. Wrap plates with plastic cling wrap to prevent dehydration.
Incubate plates (lid down) at 30 °C for 2–3 days.
Detection of NitraMeter responses in yeast using a fluorimeter
Select transformed yeast on solid YNB supplemented with 2% glucose and -ura DropOut medium.
Pick single colonies by using sterile pipette tips and grow in a 50 mL tube containing 10 mL of -ura DropOut liquid medium. Pick at least three independent colonies.
Note: Use fresh transformation. To avoid mutations in yeast or plasmid, do not keep colonies for more than one week on plates.
Place tubes in a rack and incubate in an incubator for ~15 h under agitation (220 rpm) at 30 °C until the culture reaches absorbance ~0.5 at OD600nm.
Subculture liquid cultures after dilution to OD600nm 0.01 in the same liquid medium and grow at 30 °C until absorbance reaches ~0.3 at OD600nm.
Collect the cells by centrifugation at 3,000× g for 10 min at RT to precipitate the cells.
Discard the supernatant and resuspend the precipitate by vortexing in 10 mL of wash buffer for 15 s at RT.
Centrifuge at 3,000× g for 10 min at RT again.
Wash the precipitate two more times as in Step e–f to remove traces of growth medium.
Resuspend the precipitate to absorbance ~0.5 at OD600nm in resuspension buffer.
Mix cells well and aliquot 100 μL of the culture into wells of a 96-well flat bottom plate.
Measure the fluorescence in a fluorescence plate reader in bottom reading mode using 7.5 nm bandwidth for both excitation and emission. Typically, emission spectra are recorded with the following instrument settings: λem 470–570 nm for donor (mCer), step size 5 nm, gain: 75; and λem 520–570 nm for AFPt9, step size 5 nm, gain: 75. Fluorescence from pDRFlip30 (donor, mCer), pDRFlip39 (donor, t7.ed.eCFPt9), and pDRFlip42-linker (donor, mCer) was measured by excitation at λexc 428 nm; AFPt9 is measured with excitation at λexc 500 nm.
Use a single or multichannel pipette to add 100 μL of the culture to wells (mix by pipetting up and down) and to add analyte solution to the cells. Set up at least three replicates per treatment. Try to add equal volumes of solutions to reduce variability and use well-calibrated pipettes, since the assays are quantitative and sensitive to differences in volumes/concentration of sensor and analyte.
Record the fluorescence immediately (as fast as possible) after addition of substrate or control solution. It takes approximately 10 min to read a full 96-well plate with the parameters mentioned above. For highly accurate analyses, measure only a few wells at a time to reduce differences in analysis time. It is also possible to use instruments with injectors that allow for immediate recording; use rapid switching between wells to record over time.
Note: The sensor exhibits functional activity when employed as a purified recombinant protein.
Expression of NiMet3.0, NiMet3.0-NR-R176A, and nlsNiMet3.0 in Arabidopsis
DNA constructs for expressing sensors in plants
Insert open reading sequence of NasR or NasR-NR-R176A into the multiple cloning site of the p16-Kan vector (Jones et al., 2014): 5′-, a sequence coding for the SV40-derived nuclear localization signal LQPKKKRKVGG (Schuster et al., 2014); a sequence coding for Aphrodite; a Gateway cassette including attR1, Chloramphenicol resistance gene, ccdB terminator gene, and attR2; a sequence coding for mCerulean (mCer); and a sequence coding for the cMyc epitope tag -3′, or pZPFlip UBQ10-KAN vector under the control of the UBQ10 promoter.
Note: The p16 promoter (Schuster et al., 2014) from the AT3G60245 gene encoding a 16S ribosomal subunit was used to drive the nuclear-localized NiMet3.0 fusion biosensor, whereas the CaMV 35S promoter (Battraw and Hall, 1990) was used to drive the NiMet3.0 and NiMet3.0-NR-R176A fusion biosensor in plants.
Recombine in Gateway LR reactions with NasR or NasR-NR-R176A Entry Clones, resulting in NiMet3.0, NiMet3.0-NR-R176A, and nlsNiMet3.0 expression clones.
Generate transgenic plants using the Agrobacterium floral dip method
Introduce sensors into Agrobacterium tumefaciens GV3101.
Grow healthy Arabidopsis plants in 12 h of light, 50% humidity, and at 22 °C until they begin to bolt and produce floral inflorescences (3–4 weeks in a growth chamber).
Remove siliques and mature flower clusters before floral dipping.
Inoculate a single Agrobacterium colony that was transformed with sensors into 5 mL of liquid LB medium containing the appropriate antibiotics [spectinomycin (final concentration 100 μg/mL)] for binary vector selection. Incubate the culture at 28 °C overnight.
The following morning, use this feeder culture to inoculate 200 mL of liquid LB with spectinomycin (final concentration 100 μg/mL) and grow the culture at 28 °C for 16–24 h.
Collect Agrobacterium cells by centrifugation at 3,000× g for 10 min at RT and discard the supernatant. Then, gently resuspend cells in one volume of the freshly made dipping medium.
Dilute Agrobacterium cells to 6 × 10⁹ cells/mL.
Spray the Agrobacterium on the floral part of the Arabidopsis. Then, lay down the dipped plants in a plastic basin and cover them with plastic wrap for 16–24 h to maintain high humidity.
The next day, remove the cover and allow them to grow normally for one month in the greenhouse or the growth chamber; withhold watering when siliques turn brown.
Select transformants on agar plates containing 1/2× MS medium with vitamins (PhytoTech Labs, M519) and kanamycin (30 mg/L).
Imaging the nitrate sensor in Arabidopsis with fluorescence microscopy confocal microscopy
Note: Although a fluorescence confocal microscope is the standard equipment used, light-sheet microscopy is another option. The settings for laser intensity, detector, and objective are similar to those for confocal microscopy. Please refer to the detailed procedure of the light-sheet system in the Supplementary information section.
Germinate and grow transgenic seedlings
Germinate and grow vertically on 1/2× MS modified basal salt mixture without nitrogen, 1% agar, and 0.05% (w/v) sucrose (pH 5.7) plates.
Place 5- or 6-day-old seedlings in the solution containing 1/2× MS medium [1/2× MS and 0.05% sucrose (pH 5.7)] and prepare for imaging on glass slides.
Nitrate treatments on glass slides for confocal microscopy
Place seedlings on glass slides with 50 μL of solution, surround with a rectangle of vacuum grease, and cover with a square coverslip equal in height and half the width of the vacuum grease rectangle.
Exchange the nitrate treatment solution beneath the coverslip by addition to the left and removal from the right side of the coverslip.
Acquire confocal images on a Zeiss 780 laser scanning microscope and use a 20×/0.8 Plan-Apochromat dry objective or 40×/1.2 C-Apochromat water objective. Excite CFP (440 nm) and yellow fluorescent protein (YFP; 514 nm) with lasers. Detect fluorescence emission using a GaAsP photomultiplier tube (PMT) detector, set to detect 463–508 nm for CFP, and a normal PMT detector, set to 520–585 nm for YFP. Set the laser power between 0.5% and 2% with detector gain set to 700–750 to image CFP or YFP.
Acquire images at time points based on the purpose of the research (refer to the note below for details on time point settings). Acquire three-dimensional images, with a z-step size of 1.5 μm and half the diameter of the primary root axis in Arabidopsis.
Notes:
i. For example, if the purpose is to observe the nitrate distribution in the root after different concentrations of medium supplement, it is suitable to set the range and interval of the time points to less than an hour, unless the sample can be kept moist. Additionally, fluorescence blenching should be considered when continuously recording.
ii. For other methods that can be used to obtain continuous images or video, please refer to the Supplementary information.
Data analysis
Fluorescence emission ratio response of purified NiMet3.0 to NO3− in vitro
Subtract background fluorescence of yeast (using cells transformed with vector only) from all fluorescence values (for both spectra as well as single point measurements).
The solution addition might trigger a change in the energy transfer rate between the emission at 530 nm [Dx acceptor emission (DxAm)] and the emission at 488 nm [Dx donor emission (DxDm)] that could act as a FRET ratio change sensor (ΔDxAm/DxDm). Through several optimizations, we obtained a fusion construct that shows a significantly substrate-triggered positive ratio change (ΔDxAm/DxDm) (e.g., NiMet3.0) (Figure 2).
Notes:
NiMet3.0 expressed in yeast responds to nitrate addition by changing the fluorescence intensity of donor and acceptor emission (obtained with excitation at 428 nm). Aphrodite-t9 emission was unaffected and served as a control or reference for normalization (obtained at 500 nm excitation). Nitrate addition (5 mM) induced a decrease in the emission spectrum of the donor, and the emission of the acceptor increased (Figure 2A). Besides, since the Aphrodite-t9 emission is unaffected by nitrate when excited directly, Aphrodite-t9 emission can be used as a control and for normalization by using ratios instead of absolute values to compare between different cultures.
The various nitrate concentrations from micromolar to millimolar were added externally to the primary root to monitor the NitraMeter sensor responses. The data showed that the FRET ratio changed to external nitrate addition was saturated after approximately 0.25–0.5 mM, indicating either that the NitraMeter sensor in root was all occupied by nitrate or the Vmax of NitraMeter sensor was reached after the concentrations of nitrate addition externally.
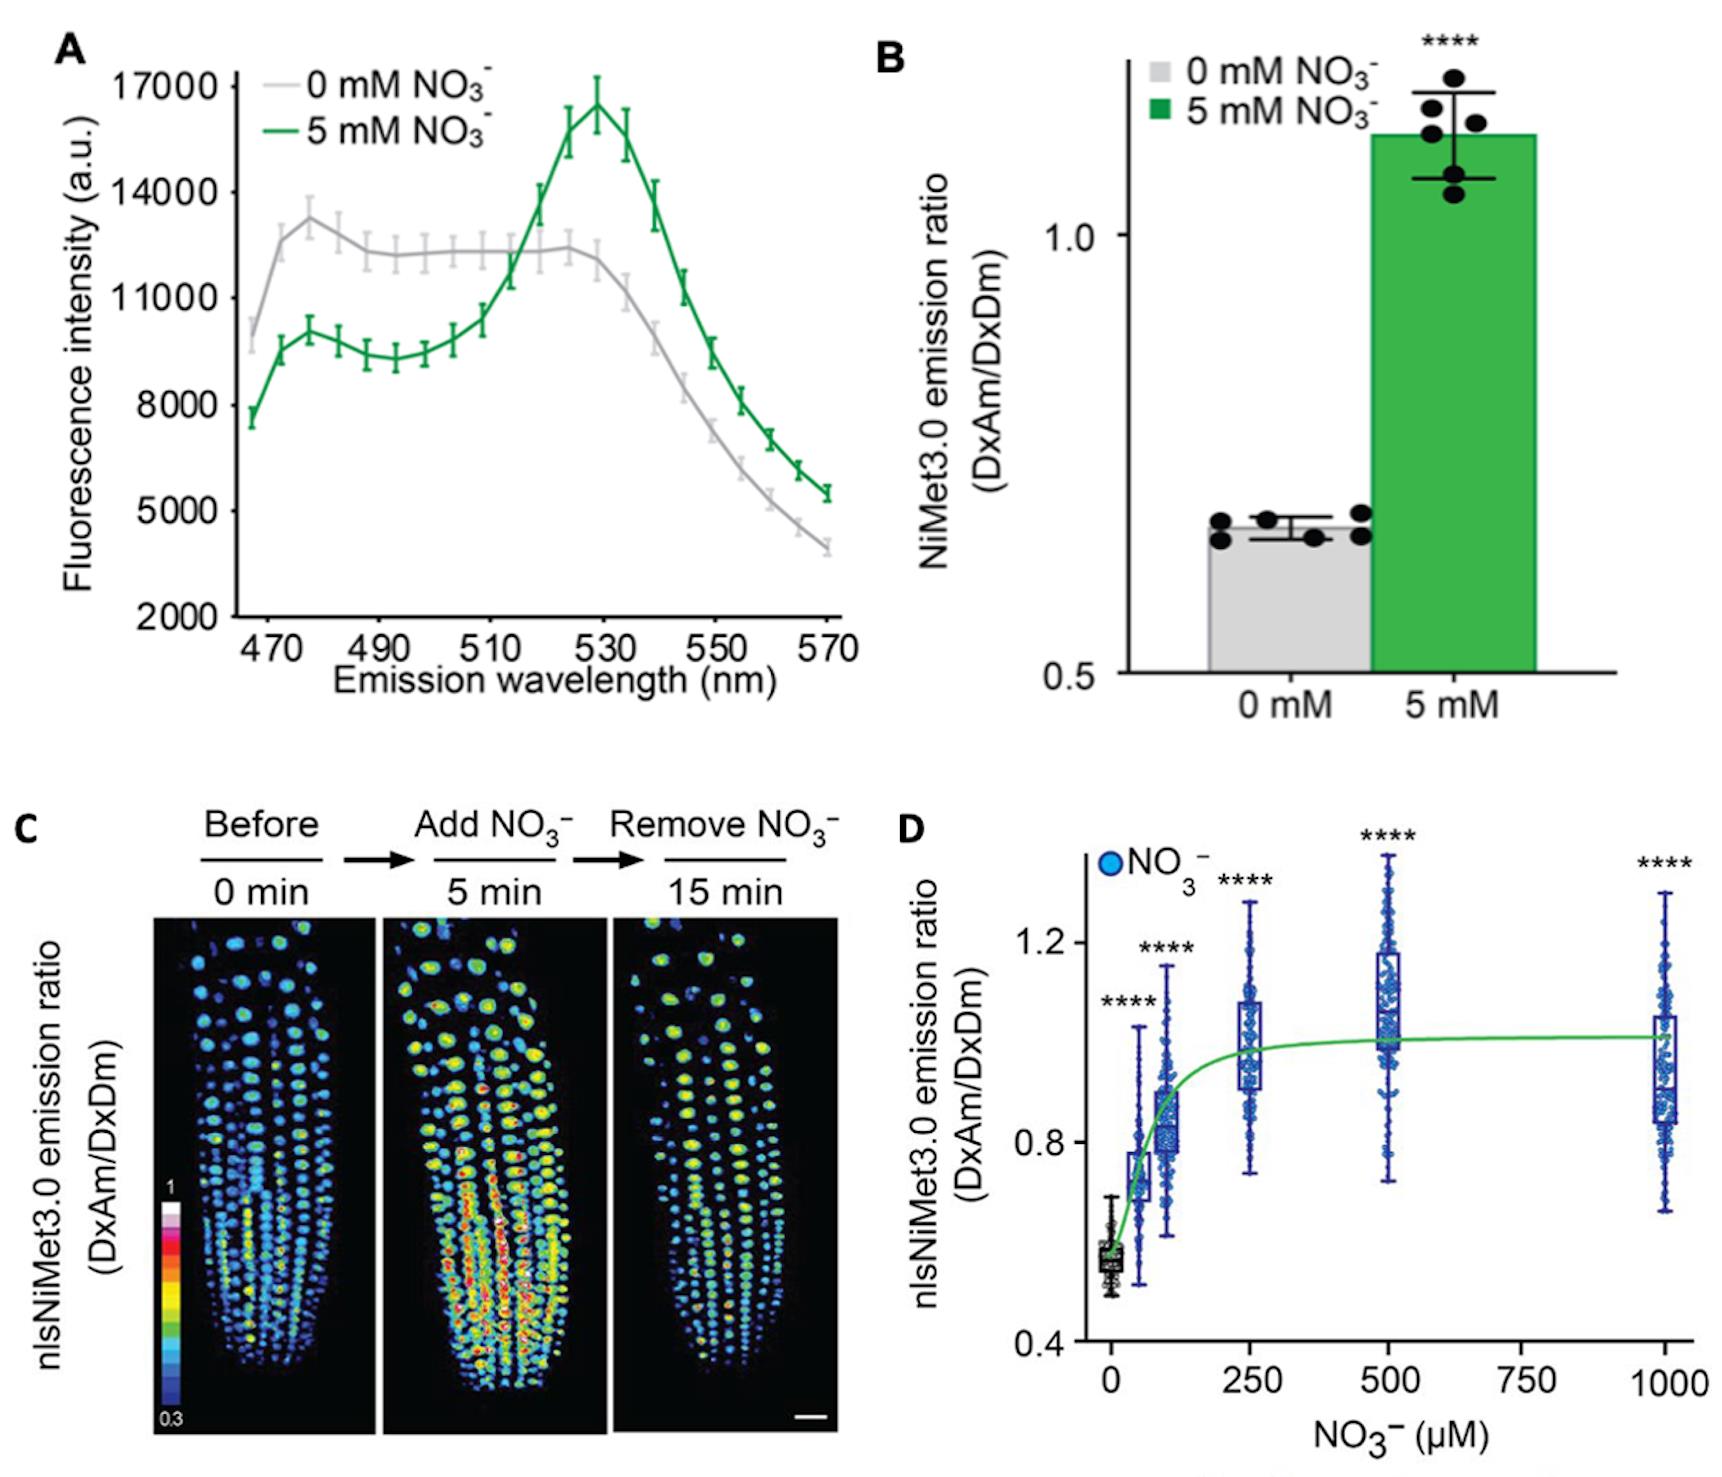
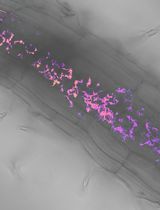
Figure 2. Fluorescence response of NiMet 3.0- and nlsNiMet 3.0-expressing yeast cells and Arabidopsis root. (A) Fluorescence emission wavelength scan (B) and emission ratio at 530 nm of purified NiMet3.0 protein with and without NO3−. Nitrate concentration is indicated in the figures. Nitrate was able to trigger responses that were significantly different from the control (*, P < 0.0001, t-test). The presented data are mean ± SD of six biological repeats. (C) Three-dimensional images of nlsNiMet3.0 emission ratios of 5-day-old root meristem zone in transgenic Col-0 before a NO3− pulse, after the NO3− pulse, and after removing the NO3−. NO3− (50 μM) was used. (D) Beeswarm and box plot of NO3− concentration-dependent nlsNiMet3.0 emission ratios for nuclei of root tips. ****, P < 0.0001, Student’s t-test. Means ± SD of three biological repeats are presented.
Quantification of the ratio of the fluorescence pixel intensity of the nitrate sensor in vivo
Use Fiji software to process the image and quantify the fluorescence pixel intensity. Calculate the mean gray values of regions of interest (ROIs) within the root meristem region.
Subtract the background from all measured intensities generated by ROIs where there was no plant material.
Measure the mean intensity values in all four channels (Dx/Dm, Dx/Am, Ax/Dm, and Ax/Am), and subtract that intensity from the entire image.
Create ratio images (DxAm/DxDm) by using the Ratio Plus plug-in for ImageJ (P. Magalhães, University of Padua, Italy) (Figure 2C). Select and analyze ROIs with the help of the ROI manager tool.
Import the fluorescence pixel intensity to GraphPad Prism to generate figures (e.g., Figure 2D) and present the data following the same setting rules as described below (see General notes).
General notes and troubleshooting
General notes
Despite the NitraMeter3.0 being able to visualize the nitrate dynamic within the cells in Arabidopsis thaliana, investigation of nutrient acquisition has relied heavily on techniques that integrate uptake over the entire root system. It is worth to note that the responses of NitraMeter to nitrate indicate the net fluxes of nitrate within where the NitraMeter is located in cell. In addition, net fluxes of NO3– into the roots vary both with position along the root axis and with time. These variations may not be consistent in different plants, in which different cells in different roots may not show exact temporal and spatial patterns of nitrate dynamics.
Present the data by using beeswarm and box plots of raw data. In the beeswarm and box plot graphs, the central rectangle spans the first quartile to the third quartile, while the line inside the rectangle shows the median. The whiskers denote 1.5 interquartile ranges from the box, and outlying values are plotted beyond the whiskers. Perform statistical analyses using GraphPad Prism version 9.0.0 for Mac (www.graphpad.com).
Acknowledgments
We acknowledge W. B. Frommer for discussion and suggestions. We thank Addgene for distributing the plasmids donated by W. B. Frommer. We thank the Advanced Optics Microscope Core Facility at Academia Sinica for technical support for fluorescence imaging. The core facility is funded by Academia Sinica Core Facility and Innovative Instrument Project (AS-CFII-108-116). We thank M.-J. Hung for efforts on this project. We thank A. K. Snyder and M. Loney for English editing.
Funding: This work was supported by Academia Sinica, Taiwan; Ministry of Science and Technology, Taiwan, grant 105-2311-B-001- 045 (C.-H.H.); and Ministry of Science and Technology, Taiwan, grant106-2311-B-001-037-MY3 (C.-H.H.). This protocol was derived from the original work of Chen et al. (2022).
Competing interests
The authors declare that they have no competing interests.
References
- Allen, G. J., Chu, S. P., Harrington, C. L., Schumacher, K., Hoffmann, T., Tang, Y. Y., Grill, E. and Schroeder, J. I. (2001). A defined range of guard cell calcium oscillation parameters encodes stomatal movements. Nature 411(6841): 1053-1057.
- Battraw, M. J. and Hall, T. C. (1990). Histochemical analysis of CaMV 35S promoter-?-glucuronidase gene expression in transgenic rice plants. Plant Mol Biol 15(4): 527-538.
- Boudes, M., Lazar, N., Graille, M., Durand, D., Gaidenko, T. A., Stewart, V. and van Tilbeurgh, H. (2012). The structure of the NasR transcription antiterminator reveals a one-component system with a NIT nitrate receptor coupled to an ANTAR RNA-binding effector. Mol Microbiol 85(3): 431-444.
- Chen, L. Q., Hou, B. H., Lalonde, S., Takanaga, H., Hartung, M. L., Qu, X. Q., Guo, W. J., Kim, J. G., Underwood, W., Chaudhuri, B., et al. (2010). Sugar transporters for intercellular exchange and nutrition of pathogens. Nature 468(7323): 527-532.
- Chen, L. Q., Qu, X. Q., Hou, B. H., Sosso, D., Osorio, S., Fernie, A. R. and Frommer, W. B. (2012). Sucrose Efflux Mediated by SWEET Proteins as a Key Step for Phloem Transport. Science 335(6065): 207-211.
- Chen, Y. N. and Ho, C. H. (2022). Concept of Fluorescent Transport Activity Biosensor for the Characterization of the Arabidopsis NPF1.3 Activity of Nitrate. Sensors 22(3): 1198.
- Chen, Y. N., Cartwright, H. N. and Ho, C. H. (2022). In vivovisualization of nitrate dynamics using a genetically encoded fluorescentbiosensor. Sci Adv 8(42): eabq4915.
- Desikan, R., Griffiths, R., Hancock, J. and Neill, S. (2002). A new role for an old enzyme: Nitrate reductase-mediated nitric oxide generation is required for abscisic acid-induced stomatal closure in Arabidopsis thaliana. Proc Natl Acad Sci U S A 99(25): 16314-16318.
- Deuschle, K., Chaudhuri, B., Okumoto, S., Lager, I., Lalonde, S. and Frommer, W. B. (2006). Rapid Metabolism of Glucose Detected with FRET Glucose Nanosensors in Epidermal Cells and Intact Roots of Arabidopsis RNA-Silencing Mutants. Plant Cell 18(9): 2314-2325.
- De Michele, R., Ast, C., Loqué, D., Ho, C. H., Andrade, S., Lanquar, V., Grossmann, G., Gehne, S., Kumke, M. and Frommer, W. (2013). Fluorescent sensors reporting the activity of ammonium transceptors in live cells. eLife 2: e00800.
- Gietz, D., Jean, A. S., Woods, R. A. and Schiestl, R. H. (1992). Improved method for high efficiency transformation of intact yeast cells. Nucleic Acids Res 20(6): 1425-1425.
- Huang, N. C., Liu, K. H., Lo, H. J. and Tsay, Y. F. (1999). Cloning and Functional Characterization of an Arabidopsis Nitrate Transporter Gene That Encodes a Constitutive Component of Low-Affinity Uptake. Plant Cell 11(8): 1381-1392.
- Jones, A., Danielson, J., ManojKumar, S., Lanquar, V., Grossmann, G. and Frommer, W. (2014). Abscisic acid dynamics in roots detected with genetically encoded FRET sensors. eLife 3: e01741.
- Koncz, C. and Schell, J. (1986). The promoter of TL-DNA gene 5 controls the tissue-specific expression of chimaeric genes carried by a novel type of Agrobacterium binary vector. Molecular and General Genetics MGG 204(3): 383-396.
- Leisgen, C., Kuester, M., and Methfessel, C. (2007). The Roboocyte: automated electrophysiology based on Xenopus oocytes. In: Molnar, P. and Hickman, J. J. (Eds.). Methods in Molecular Biology (pp. 59-72). Humana Press.
- Lelimousin, M., Noirclerc-Savoye, M., Lazareno-Saez, C., Paetzold, B., Le Vot, S., Chazal, R., Macheboeuf, P., Field, M. J., Bourgeois, D. and Royant, A. (2009). Intrinsic Dynamics in ECFP and Cerulean Control Fluorescence Quantum Yield. Biochemistry 48(42): 10038-10046.
- Pehl, U., Leisgen, C., Gampe, K. and Guenther, E. (2004). Automated Higher-Throughput Compound Screening on Ion Channel Targets Based on theXenopus laevis Oocyte Expression System. ASSAY Drug Dev Technol 2(5): 515-524.
- Rekas, A., Alattia, J. R., Nagai, T., Miyawaki, A. and Ikura, M. (2002). Crystal Structure of Venus, a Yellow Fluorescent Protein with Improved Maturation and Reduced Environmental Sensitivity. J Biol Chem 277(52): 50573-50578.
- Rizzo, M. A., Springer, G., Segawa, K., Zipfel, W. R. and Piston, D. W. (2006). Optimization of Pairings and Detection Conditions for Measurement of FRET between Cyan and Yellow Fluorescent Proteins. Microsc Microanal 12(3): 238-254.
- Schuster, C., Gaillochet, C., Medzihradszky, A., Busch, W., Daum, G., Krebs, M., Kehle, A. and Lohmann, J. U. (2014). A Regulatory Framework for Shoot Stem Cell Control Integrating Metabolic, Transcriptional, and Phytohormone Signals. Dev Cell 28(4): 438-449.
Supplementary information
The supporting information can be downloaded here.
Article Information
Copyright
© 2023 The Author(s); This is an open access article under the CC BY license (https://creativecommons.org/licenses/by/4.0/).
How to cite
Readers should cite both the Bio-protocol article and the original research article where this protocol was used:
- Chen, Y. N. and Ho, C. H. (2023). Fluorescent Biosensor Imaging of Nitrate in Arabidopsis thaliana. Bio-protocol 13(16): e4743. DOI: 10.21769/BioProtoc.4743.
- Chen, Y. N., Cartwright, H. N. and Ho, C. H. (2022). In vivo visualization of nitrate dynamics using a genetically encoded fluorescent biosensor. Sci Adv 8(42): eabq4915.
Category
Plant Science > Plant biochemistry > Metabolite
Biochemistry > Protein > Fluorescence
Do you have any questions about this protocol?
Post your question to gather feedback from the community. We will also invite the authors of this article to respond.