- Protocols

- Articles and Issues
- For Authors
- About
- Become a Reviewer

Fluorescent PCR–based Screening Methods for Precise Knock-in of Small DNA Fragments and Point Mutations in Zebrafish
Published: Vol 13, Iss 15, Aug 5, 2023 DOI: 10.21769/BioProtoc.4732 Views: 2266
Reviewed by: Alberto RissoneQin TangGülçin ÇAKAN AKDOĞAN
Original research article
The authors used this protocol in:

Dec 2022

Protocol Collections
Comprehensive collections of detailed, peer-reviewed protocols focusing on specific topics


Abstract
Generation of zebrafish (Danio rerio) models with targeted insertion of epitope tags and point mutations is highly desirable for functional genomics and disease modeling studies. Currently, CRISPR/Cas9-mediated knock-in is the method of choice for insertion of exogeneous sequences by providing a repair template for homology-directed repair (HDR). A major hurdle in generating knock-in models is the labor and cost involved in screening of injected fish to identify the precise knock-in events due to low efficiency of the HDR pathway in zebrafish. Thus, we developed fluorescent PCR–based high-throughput screening methods for precise knock-in of epitope tags and point mutations in zebrafish. Here, we provide a step-by-step guide that describes selection of an active sgRNA near the intended knock-in site, design of single-stranded oligonucleotide (ssODN) templates for HDR, quick validation of somatic knock-in using injected embryos, and screening for germline transmission of precise knock-in events to establish stable lines. Our screening method relies on the size-based separation of all fragments in an amplicon by fluorescent PCR and capillary electrophoresis, thus providing a robust and cost-effective strategy. Although we present the use of this protocol for insertion of epitope tags and point mutations, it can be used for insertion of any small DNA fragments (e.g., LoxP sites, in-frame codons). Furthermore, the screening strategy described here can be used to screen for precise knock-in of small DNA sequences in any model system, as PCR amplification of the target region is its only requirement.
Key features
• This protocol expands the use of fluorescent PCR and CRISPR-STAT for screening of precise knock-in of small insertions and point mutations in zebrafish.
• Allows validation of selected sgRNA and HDR template within two weeks by somatic knock-in screening.
• Allows robust screening of point mutations by combining restriction digest with CRISPR-STAT.
Graphical overview

Overview of the three-phase knock-in pipeline in zebrafish (created with BioRender.com)
Background
The use of zebrafish for functional genomics and disease modeling has gained popularity in recent years due to the availability of CRISPR/Cas9-based methods for generating desired gene knockout and knock-in models. These methods are based on the introduction of a double-strand break (DSB) at a desired site in the genome by CRISPR/Cas9 followed by non-homologous end joining (NHEJ)-mediated indels causing gene knockouts or homology-directed repair (HDR)-mediated knock-in of exogenous sequences by providing a donor DNA template. Several studies have shown that single-stranded oligonucleotides (ssODNs) with asymmetric homology arms based on Richardson et al., (2016) can be used to generate fish with targeted knock-in of in-frame epitope tags for proteomics analysis, LoxP sites for conditional knockout, and stop codons or patient-specific point mutations for in vivo disease modeling (Burg et al., 2018; Prykhozhij et al., 2018; de Vrieze et al., 2021; Sieliwonczyk et al., 2023). However, this is a challenging process due to the low efficiency of HDR in zebrafish, requiring extensive founder screening by either labor-intensive gel-based methods—such as allele-specific PCR and restriction fragment length polymorphism, cloning, and sequencing—or highly sophisticated computational analysis of next generation sequencing data (Bedell et al., 2012; Armstrong et al., 2016; Prykhozhij et al., 2018; Zhang et al., 2018; de Vrieze et al., 2021; Sieliwonczyk et al., 2023). Thus, easy, scalable, and robust screening methods are required to identify the rare precise knock-in events from the common NHEJ-mediated indels or recombination errors.
Here, we describe our recently demonstrated fluorescent PCR–based screening methods for successful generation of zebrafish knock-in models with epitope tags, point mutations, or any other small insertions using ssODNs (Carrington et al., 2022). Fluorescent PCR is highly sensitive and allows accurate sizing of all fragments in a PCR product even from mosaic samples using CRISPR-STAT (Carrington et al., 2015). For insertion of epitope tags or any other sequences of known size, we can distinguish knock-in alleles from the wildtype (WT) or CRISPR/Cas9-induced random indels by size of the expected peak. For knock-in of point mutations, we combined fluorescent PCR with a restriction digest so that exact sizes of digested products with or without the knock-in can be determined. The restriction site can be introduced in the repair template by the desired point mutation, change of the PAM site, or a silent change. Our screening method cannot be used if the same restriction site is also present in the amplicon upstream of the intended point mutation, or a restriction site cannot be introduced by the above methods. Overall, our screening methods allow the user to determine within a week if knock-in is occurring in injected embryos or if the design of sgRNA/repair template needs to be reevaluated. Our methods are easy to implement as many zebrafish researchers are already using fluorescent PCR for genotyping and CRISPR-STAT for sgRNA evaluations (Varshney et al., 2016; Ramanagoudr-Bhojappa et al., 2018; Hoshijima et al., 2019; Pillay et al., 2022). This method can also be adopted by researchers using other model systems, as it is a PCR-based screening method.
Materials and reagents
Biological materials
Zebrafish (Danio rerio): zebrafish strains can be obtained from collaborators or repositories, such as the Zebrafish International Resource Center (https://zebrafish.org/home/guide.php) or the European Zebrafish Resource Center (https://www.ezrc.kit.edu/).
General reagents
Instant ocean aquarium salt (Petco, catalog number: 77763)
Reverse osmosis water
TE, pH 8.0 (Quality Biological, catalog number: 351-011-131)
Ultrapure water (KD medical, catalog number: RGF-3410)
Project-specific restriction enzymes and associated buffers (New England Biolabs)
Primers and HDR template
M13F-FAM Primer-/56-FAM/TGTAAAACGACGGCCAGT (IDT)
Note: Primer should be resuspended to 100 μM using TE, pH 8.0.
Project-specific primers for fluorescent PCR designed as described in section A1, step 2: forward M13F tailed primer and reverse PIG-tailed primer (IDT)
Note: Primers should be resuspended to 100 μM using TE, pH 8.0.
Project-specific primers for fluorescent knock-in screening designed as described in section A4, step 2: knock-in screening forward M13F tailed primer and knock-in screening reverse PIG-tailed primer (IDT)
Note: Primers should be resuspended to 100 μM using TE, pH 8.0.
Project-specific top strand oligos (IDT) designed as described in section A1, step 1c.
Note: Top strand oligos should be resuspended to 100 μM using TE, pH 8.0. After resuspension, store indefinitely at -20 °C.
Universal bottom strand ultramer (5′-AAAAGCACCGACTCGGTGCCACTTTTTCAAGTTGATAACGGACTAGC CTTATTTTAACTTGCTATTTCTAGCTCTAAAAC-3′) (IDT)
Critical: Aliquots should not go through multiple freeze-thaw cycles. Resuspension in water is not recommended.
Note: Bottom strand ultramer should be resuspended to 100 μM using TE, pH 8.0. After resuspension, store indefinitely in 10–15 μL aliquots at -80 °C.
Project-specific HDR templates ordered as ultramers (IDT) or ssDNA (Azenta Life Sciences)
sgRNA and Cas9 synthesis reagents
Phusion High Fidelity DNA Polymerase and associated 5× buffer (NEB, catalog number: M0530S)
Advantage UltraPure PCR dNTP mix (10 mM each) (Takara, catalog number: 639125)
HiScribe T7 Quick High Yield RNA Synthesis kit (NEB, catalog number: E2050S)
RNA Clean and Concentrator-5 kit (Zymo Research, catalog number: R1016) Critical: Other RNA purification kits may not work as well due to the small size of the RNA being purified.
Ethyl alcohol, pure (EtOH) (Sigma, catalog number: 459844)
pT3TS-nls-zCas9-nls plasmid (Addgene, catalog number: 46757)
XbaI and CutSmart buffer (New England Biolabs, catalog number: R0145S)
QIAquick PCR Purification kit (Qiagen, catalog number: 28104)
mMessage mMachine T3 Transcription kit (Thermo Fisher, catalog number: AM1348)
Gel electrophoresis reagents
Note: Equivalent reagents can be used as substitutes.
GeneRuler 50 bp DNA ladder (Thermo Fisher, catalog number: SM0371)
GeneRuler 1 kb DNA ladder (Thermo Fisher, catalog number: SM0311)
5× DNA gel loading solution (Quality Biological, catalog number: 351-028-661)
10× TAE buffer (Quality Biological, catalog number: 351-009-131)
UltraPure agarose (Thermo Fisher, catalog number: 16500500)
UltraPure ethidium bromide (Thermo Fisher, catalog number: 15585-011)
Caution: Carcinogenic. Wear gloves when handling.
DNA extraction reagents
Extraction solution (Sigma, catalog number: E7526)
Tissue preparation solution (Sigma, catalog number: T3073)
Neutralization solution B (Sigma, catalog number: N3910)
PCR reagents
AmpliTaq Gold DNA Polymerase with Gold Buffer and MgCl2 (Thermo Fisher, catalog number: 4311820)
GeneAmp dNTP blend (100 mM) (Thermo Fisher, catalog number: N8080261)
Capillary electrophoresis reagents
GeneScan 400HD ROX dye size standard (Thermo Fisher, catalog number: 402985)
Hi-Di formamide (Thermo Fisher, catalog number: 4440753)
Caution: Carcinogenic and target organ and reproductive toxicity. Wear gloves when handling.
Note: Store at -20 °C until ready to use. Avoid freeze thawing. Once thawed, store at 4 °C and use contents within four weeks.
POP-7 polymer for 3730/3730xl DNA Analyzer (Thermo Fisher, catalog number: 4335615)
Note: Store at 4 °C. Do not freeze.
3730 running buffer (10×) (Thermo Fisher, catalog number: 4335613)
Note: Cheaper alternative from VWR (catalog number: 97063-502) also works well.
TOPO cloning and sequencing reagents
MinElute Reaction Cleanup kit (Qiagen, catalog number: 28204)
TOPO TA Cloning kit for Sequencing, with One Shot TOP10 Electrocomp E. Coli (Thermo Fisher, catalog number: K458001)
LB agar plates with 100 μg/mL ampicillin (Thermo Fisher, catalog number: J63197)
Note: These can be prepared in-house using standard techniques.
ExoSAP-IT PCR Product Cleanup (Thermo Fisher, catalog number: 78201)
BigDye Terminator v3.1 Cycle Sequencing kit (Thermo Fisher, catalog number: 4337455)
DyeEx 96 kit (Qiagen, catalog number: 63183)
Solutions
Egg water (see Recipes)
Fluorescent PCR primer mix (see Recipes)
Fluorescent PCR master mix (see Recipes)
Recipes
Egg water
Reagent Final concentration Amount Instant ocean aquarium salt n/a 1.92 g Reverse osmosis water n/a 32 L Total n/a 32 L Store solution at room temperature (RT) for up to six months.
Fluorescent PCR primer mix
Reagent Final concentration Amount TE, pH 8.0 n/a 485 μL Forward M13F tailed primer (100 μM) 1 μM 5 μL Reverse PIG-tailed primer (100 μM) 1 μM 5 μL M13F-FAM primer (100 μM) 1 μM 5 μL Total n/a 500 μL Store primer mix at 4 °C in a covered box to avoid exposure to light.
Fluorescent knock-in screening primer mix
Reagent Final concentration Amount TE, pH 8.0 n/a 485 μL Knock-in screening forward M13F tailed primer (100 μM) 1 μM 5 μL Knock-in screening reverse PIG-tailed primer (100 μM) 1 μM 5 μL M13F-FAM primer (100 μM) 1 μM 5 μL Total n/a 500 μL Store primer mix at 4 °C in a covered box to avoid exposure to light.
Fluorescent PCR master mix
Reagent Final concentration Amount 10× Gold Buffer 1.5× 7.94 mL 25 mM MgCl2 solution 3.97 mM 7.94 mL GeneAmp 100 mM dNTP blend 1.59 mM 795 μL AmpliTaq Gold DNA Polymerase 1.25 U 635 μL Ultrapure water n/a 32.69 mL Total n/a 50 mL Gold Buffer and MgCl2 come with the AmpliTaq Gold DNA Polymerase. Aliquot PCR master mix into 500 μL and 1 mL aliquots and store indefinitely at -20 °C.
Laboratory supplies
Note: Any equivalent supplies can be used.
Microcentrifuge tubes, 1.7 mL (VWR, GeneMate, catalog number: 490003-230)
Pipettes [Rainin, catalog numbers: 17014393 (0.1–2 μL), 17014388 (0.5–10 μL), 17014392 (2–20 μL), 17014391 (20–200 μL), 17014382 (100–1,000 μL), 17013808 (2–20 μL multichannel)]
Needle loading tips (Eppendorf, catalog number: 930001007)
Glass capillaries (World Precision Instruments, catalog number: TW100F-4)
96-well PCR plates (SSIbio, catalog number: 3400-00)
Plate seals (Azenta, catalog number: 4ti00500)
96-well semi-skirted plates for 3730xl DNA analyzer (SSIbio, catalog number: 3450-00)
Equipment
Note: Any equivalent device can be used.
Microcentrifuge (MidSci, catalog number: C2400)
Vortex (Diagger, catalog number: SI-0236)
Block heater at 37 °C (Thermo Fisher, catalog number: 13687720)
Owl D2 wide-gel electrophoresis system (Thermo Fisher, catalog number: D2)
NanoDrop spectrophotometer 1000 (Thermo Fisher)
PCR plate spinner (VWR, catalog number: 89184-608)
Veriti 96-well thermal cycler 0.2 mL (Thermo Fisher, catalog number: 4479071)
Microinjection apparatus (World Precision Instruments)
Needle puller (Kopf Instruments model 710)
-20 °C freezer (VWR, catalog number: 10819-850)
-80 °C freezer (Thermo Fisher, catalog number: TSX40086A)
3730xl DNA Analyzer equipped with a 36 cm capillary (Thermo Fisher, catalog number: A41046)
Incubator at 28.5 °C (Thermo Fisher, catalog number: 51028068)
Incubator at 37 °C (Thermo Fisher, catalog number: 50125590)
Software and datasets
UCSC genome browser (Zebrafish Assembly GRCz11/danRer11) https://genome.ucsc.edu/cgi-bin/hgGateway
Sequencher version 5.3 (Gene Codes)
Note: Any equivalent sequence analysis software can be used.
3730xl Data Collection Software 5 (Thermo Fisher).
Note: CRISPR-STAT module settings can be found in Varshney et al. (2016).
GeneMapper Software version 6 (Thermo Fisher, catalog number: 4475073)
Note: Panel manager and analysis method editor settings can be found in Varshney et al. (2016).
Procedure
Design phase
A1. sgRNA/Cas9 design and synthesissgRNA target selection
Access the “ZebrafishGenomics” (Varshney et al., 2016) and/or “CRISPRscan” (Moreno-Mateos et al., 2015) tracks on the UCSC Genome Browser (Figure 1).
Select ~30 bp of sequence flanking each site of the intended integration site (~60 bp total sequence) to search for target sequences. Select 2–3 targets that generate the DSB as close to the integration site as possible and obtain their CRISPR target sequences (Figure 1).
Note: See General notes for information about alternate sgRNA design.
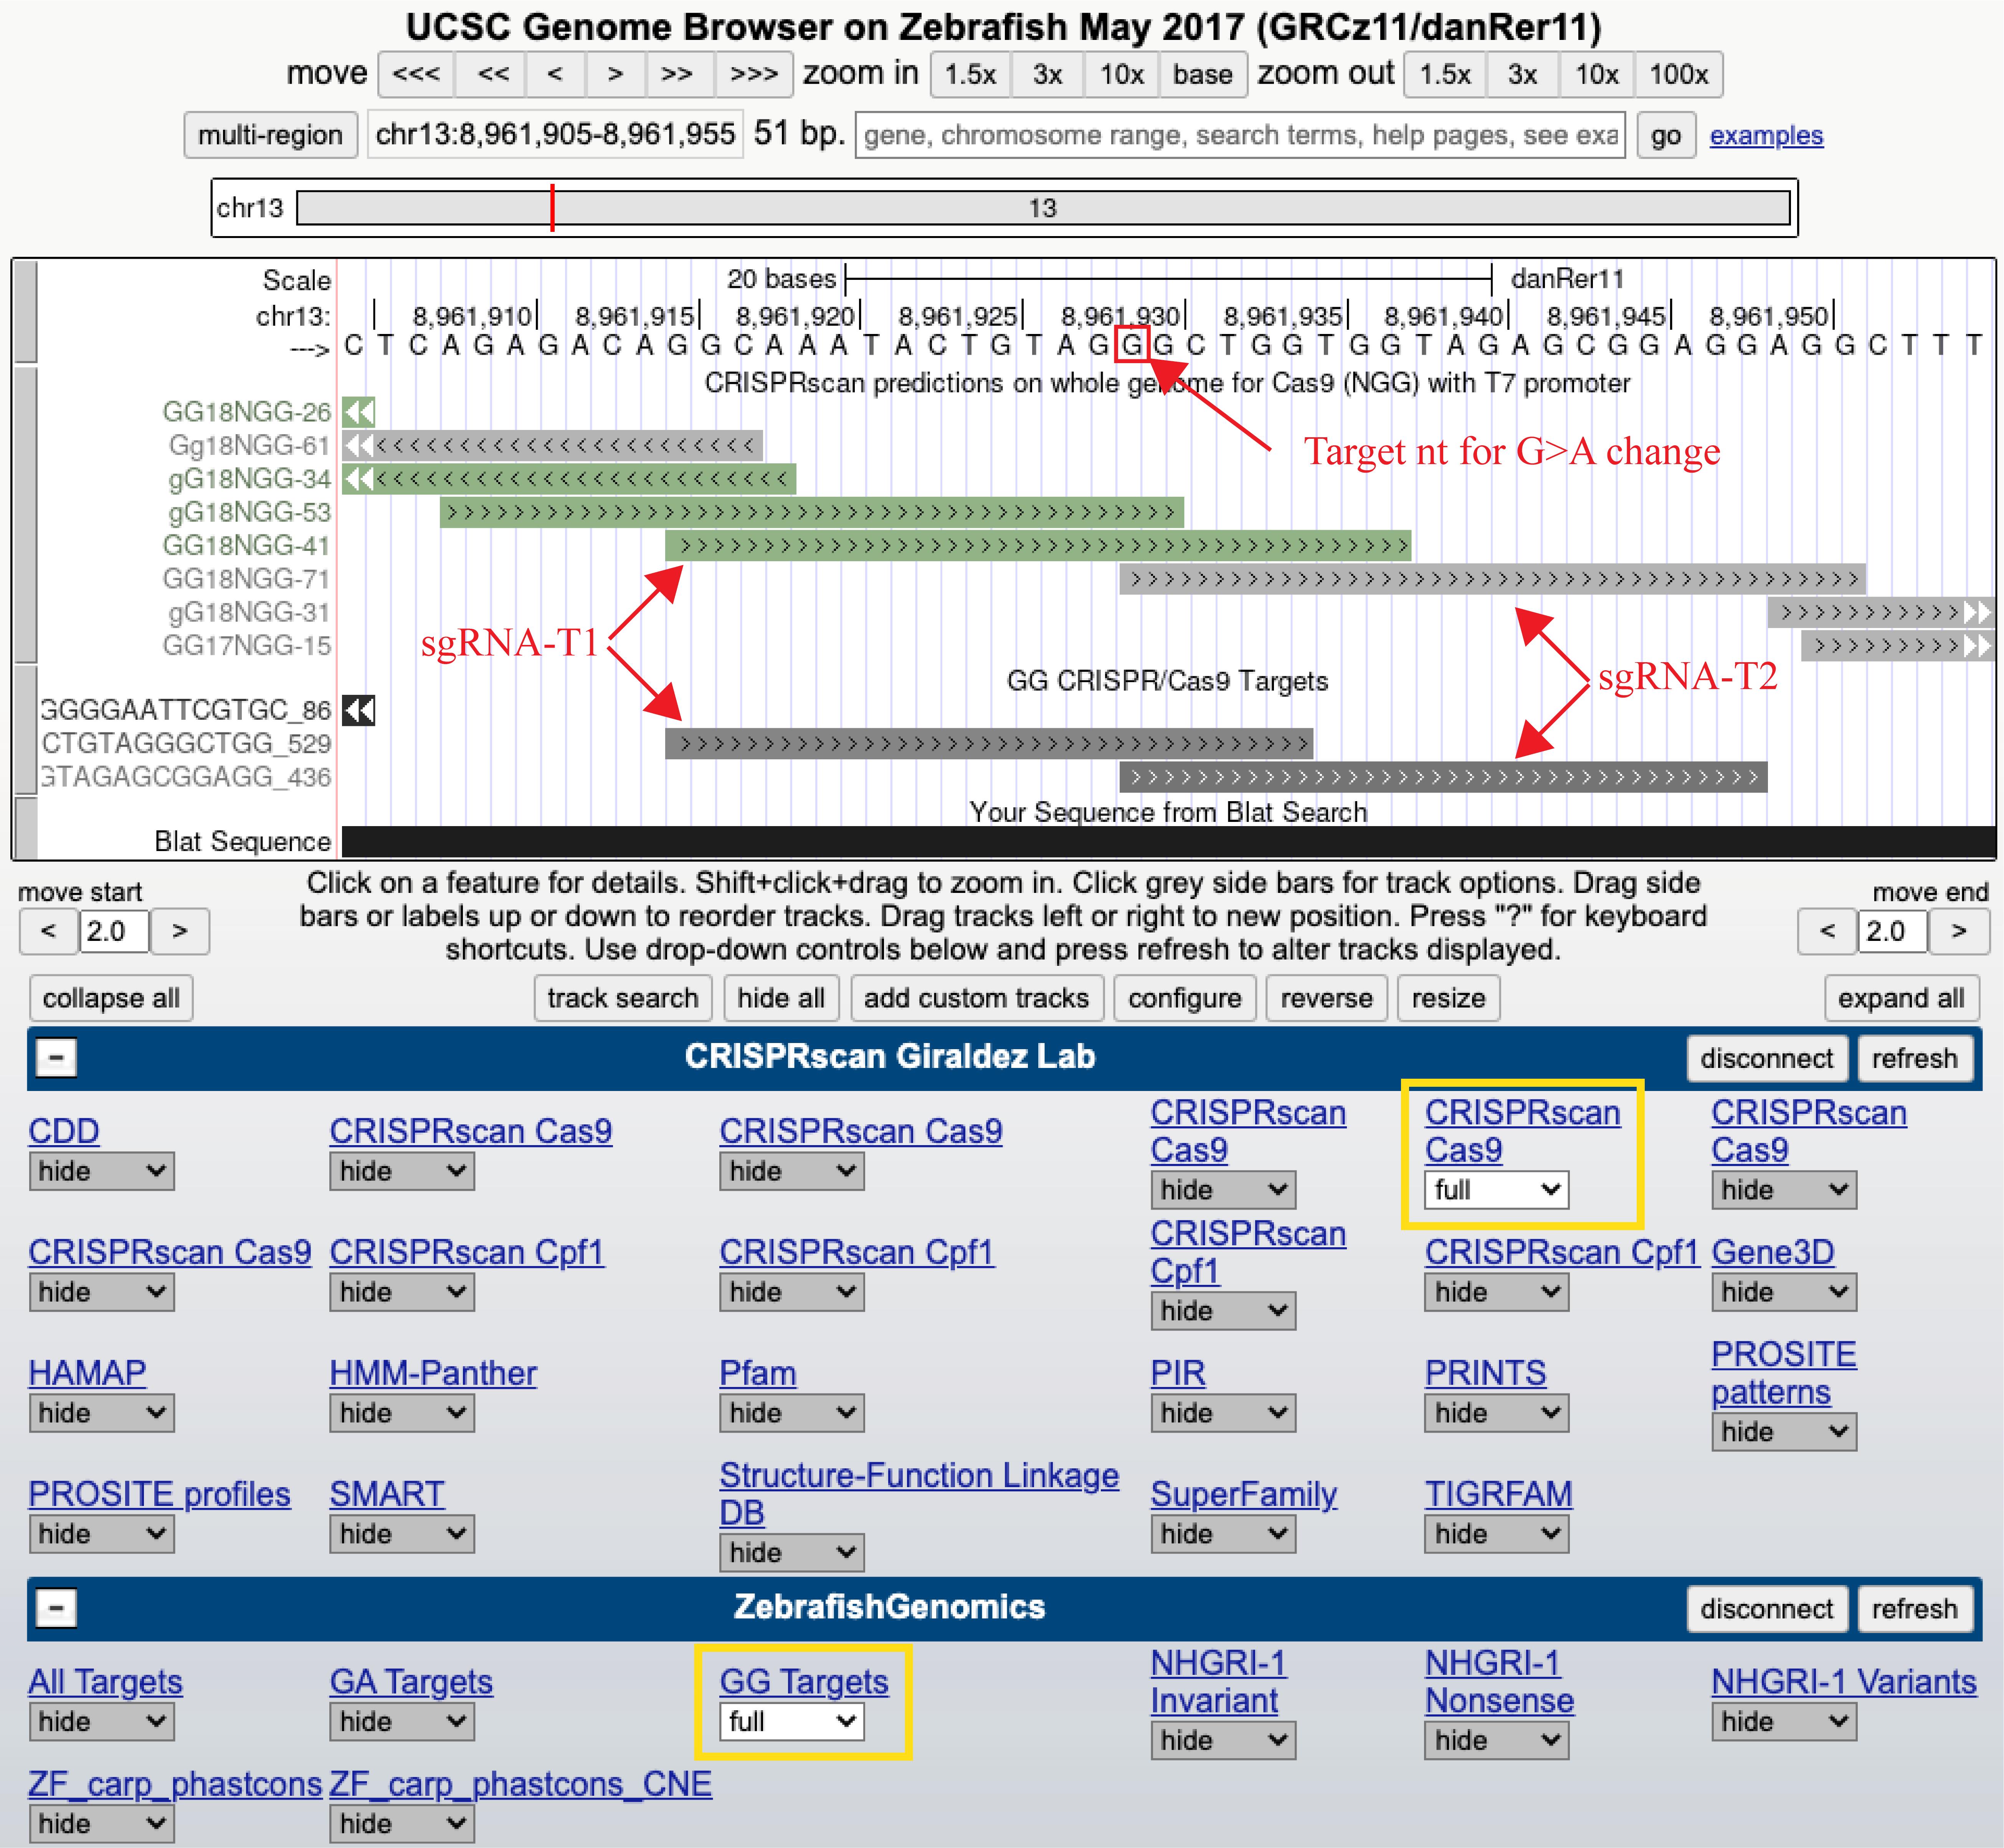
Figure 1. Screenshot of the UCSC Genome Browser with CRISPRscan and ZebrafishGenomics hubs enabled to identify sgRNA target sites. Use tracks (marked in yellow) to search for targets that can be synthesized with a T7 promoter (guide sequence begins with a “GG”) as close as possible to the intended nucleotide for point mutation or site of insertion. In this example, both CRISPRscan and ZebrafishGenomics predicted two overlapping targets (sgRNA-T1 and sgRNA-T2) close to the target nucleotide (marked in red box) and were selected for sgRNA synthesis.Add the T7 promoter sequence (TAATACGACTCACTATA) to the 5′ side of the target sequence (obtained from the genome browser) and the gRNA overlapping sequence (GTTTTAGAGCTAGAAATAGC) to the 3′ side of the target sequence to obtain the final sequence of the top strand oligo. The oligo sequence for a 20 bp sgRNA will be as follows:
5′-TAATACGACTCACTATAggn(18)GTTTTAGAGCTAGAAATAGC-3′. Critical: Do not include the PAM sequence in the oligo.
Order the top strand oligos as standard desalted oligos and universal bottom strand oligo as an ultramer (see Reagents).
Fluorescent PCR primer design
Design primers to amplify a 200–350 bp product surrounding the target region with the sgRNA binding sites approximately in the middle of the amplicon. Critical: Target sequences should be a minimum of 25 bp from the ends of the amplicon to prevent NHEJ from removing any of the primer binding sequence. If possible, design primers to avoid repetitive sequences or stretches of the same nucleotide, as it is important that the PCR from a WT sample gives a single peak to avoid false positive data. A primer design software can also be used.
Add the M13F sequence (5′-TGTAAAACGACGGCCAGT -3′) to the 5′ side of the forward primer and a PIG-tail sequence (5′-GTGTCTT-3′) to the 5′ side of the reverse primer. Tailed primers will be as follows:
Forward: 5′-TGTAAAACGACGGCCAGT (n)18–22 -3′
Reverse: 5′-GTGTCTT (n)18–22 -3′
Order tailed primers and the M13-FAM primer (see Reagents) as standard desalted primers. Critical: It is recommended that each primer set be run with a minimum of eight WT DNA samples to ensure the amplicon produces a single peak (see section A3 for PCR setup).
sgRNA synthesis
Set up the oligo annealing reactions as follows:
5× Phusion buffer 10 μL
Advantage UltraPure PCR dNTP mix (10 mM each) 1 μL
Top-strand oligo (10 μM) 1 μL
Bottom strand ultramer (10 μM) 1 μL
Phusion high fidelity DNA polymerase 0.5 μL
Ultrapure water 36.5 μL
Total 50 μL
Anneal and extend the oligos in a thermocycler using the following conditions:
98 °C, 2 min
50 °C, 10 min
72 °C, 10 min
4 °C, hold
Run 4 μL of the assembled oligo reaction along with a 50 bp DNA ladder on a 2.5% (w/v) agarose gel using standard conditions. A single band is expected at 120 bp (Figure 2).
Following gel validation, set up the sgRNA synthesis reaction using the HiScribe T7 Quick High Yield RNA Synthesis kit as follows:
NTP buffer mix 5 μL
Assembled oligo 4 μL
T7 RNA polymerase 1 μL
Total 10 μL
Incubate the reaction for 4 h at 37 °C followed by a 4 °C hold.
Add 1 μL of DNAse (included with HiScribe T7 Quick High Yield RNA Synthesis kit) to the reaction and incubate for 20 min at 37 °C.
Purify the RNA synthesis reaction using the RNA Clean and Concentrator-5 kit according to the manufacturer’s instructions and elute with 20 μL of ultrapure water.
Quantify the sgRNA using a NanoDrop and run ~300 ng along with a 50 bp DNA ladder on a 2.5% (w/v) agarose gel using standard conditions to confirm correct synthesis. A band between 100 and 200 bp is expected (Figure 2). Occasionally, a slightly larger band is also seen due to secondary structure. Dilute the remaining sgRNA to a final concentration between 100 and 300 ng/μL with an A260/280 ratio of 2.0–2.3. Pause point: sgRNA can be stored at -80 °C for several months.
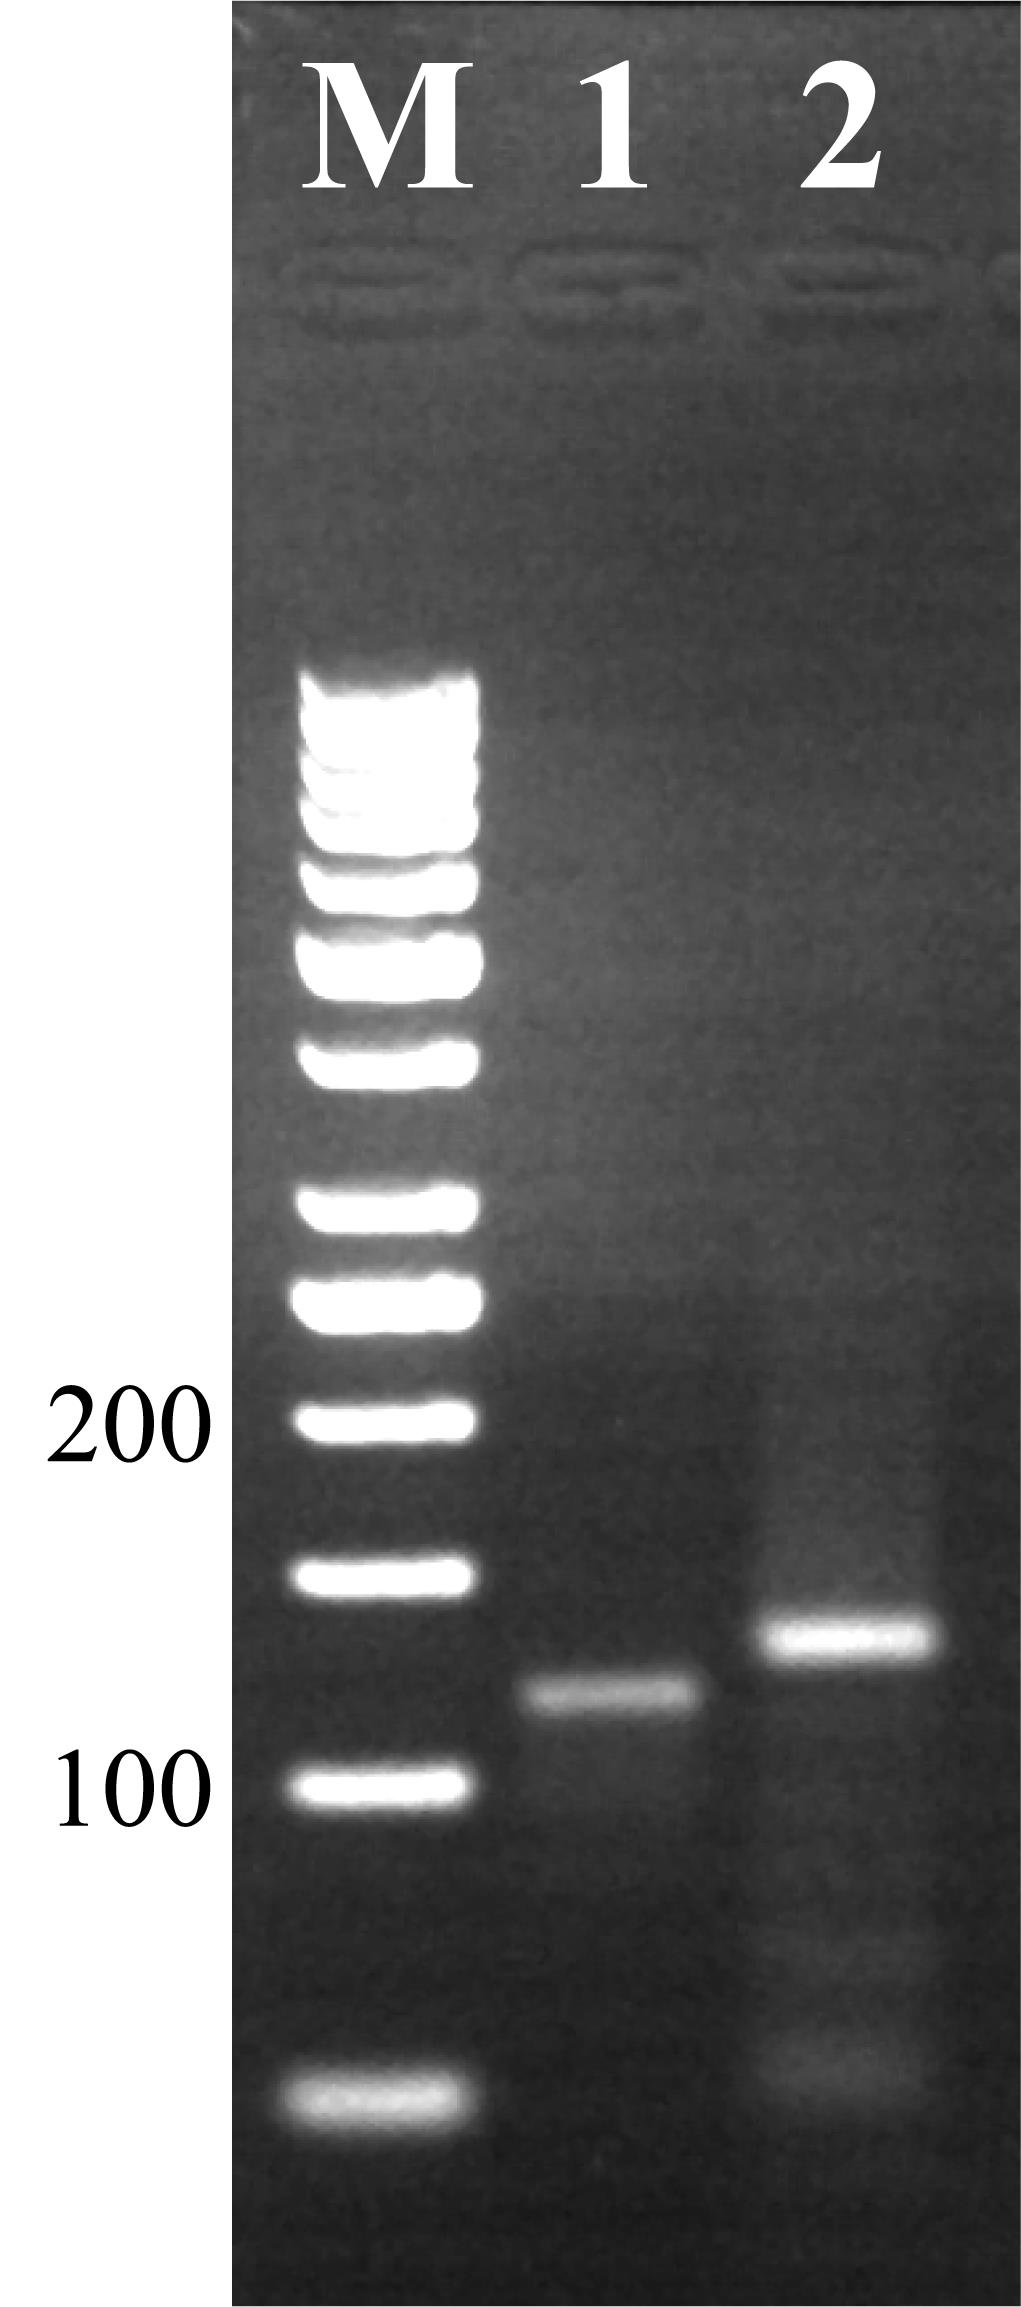
Figure 2. Agarose gel electrophoresis showing products of oligo assembly and sgRNA synthesis reactions. Lane M: marker (50 bp ladder); lane 1: correctly assembled oligo runs at ~120 bp; lane 2: successful sgRNA synthesis product runs between 100 and 200 bp.SpCas9 mRNA synthesis
Note: See General notes for information about alternate Cas options.
Linearize 5 μg of the pT3Ts-nls-zCas9-nls plasmid by digesting with XbaI in a total volume of 50 μL at 37 °C for 2 h.
Purify the linearized DNA with the QIAquick PCR Purification kit according to the manufacturer’s instructions.
Verify digestion on a 1% (w/v) agarose gel using standard protocols. A single band is expected at 7.3 kb. Example of a gel with expected band can be found in Varshney et al. (2016).
Quantify the digested DNA with a NanoDrop.
Set up the in vitro transcription reaction using the mMessage mMachine T3 Transcription kit:
2× NTP/CAP 10 μL
10× reaction buffer 2 μL
Linearized DNA template 1 μg
Enzyme mix 2 μL
Ultrapure water up to 20 μL
Total 20 μL
Incubate at 37 °C for 2 h.
Add 1 μL of TURBO DNase (included in the mMessage mMachine T3 Transcription kit) and incubate for 15 min and 37 °C.
Purify the RNA transcription reaction using LiCl (included in the mMessage mMachine T3 Transcription kit) according to the manufacturer’s instructions. Resuspend the RNA pellet with 20 μL of ultrapure water.
Quantify the mRNA using a NanoDrop. The concentration should be > 500 ng/μL with an A260/280 ratio of 2.0–2.3.
Run ~500 ng on an 1% (w/v) agarose gel to confirm quality using standard protocols. The expected band will run at ~1.6 kb.
Aliquot the Cas9 mRNA into 5 μL aliquots with a concentration of 500–1,000 ng/μL. Pause point: Cas9 aliquots can be stored at -80 °C for months. Multiple freeze-thaw cycles are not recommended.
Prepare injection apparatus and pull needles.
Prepare an injection mixture for each sgRNA from section A1, step 3 with SpCas9 mRNA from section A1, step 4 as follows:
sgRNA (354 ng) variable volume
Cas9 mRNA (2.1 μg) variable volume
Ultrapure water up to 10 μL
Total 10 μL
Load the injection mixture into a capillary injection needle and inject 1.4 nL per embryo into ~100 embryos. Repeat this step for each injection mixture.
Note: If a different volume is injected, adjust amounts of sgRNA and Cas9 mRNA in injection mixture such that each embryo receives 50 pg sgRNA and 300 pg Cas9 mRNA.
Incubate the injected embryos as well as uninjected controls from the same clutch in a 28.5 °C incubator in egg water. Remove any unfertilized and injected damaged embryos at 3–6 h post fertilization (hpf).
At 1 day post fertilization (dpf), remove any deformed and dead embryos.
At 1 dpf, collect and euthanize eight embryos from each injection group and uninjected WT as controls.
Place one embryo per well in a 96-well plate. Each injection group will use one column on the plate. Critical: If embryos are still in chorions, place the plate into a -20 or -80 °C freezer for 20–30 min to completely freeze and burst the chorion, allowing extraction reagents in following steps to access the tissue.
Mix 25 μL of extraction solution and 7 μL of tissue preparation solution for each embryo (i.e., 10 samples: 250 μL extraction solution and 70 μL tissue preparation solution). Add 32 μL of the extraction/tissue preparation solution mixture to each sample. Critical: Embryos should be submerged in the solution. Do not vortex.
Incubate the plate at RT for 10 min followed by 5 min at 95 °C.
Add 25 μL of neutralization solution B to each well and mix by vortexing. Pause point: DNA can be stored at -20 °C for up to four weeks.
Note: See General notes for information about alternate DNA extraction methods.
Dilute the extracted DNA 1:10 with ultrapure water for use in PCR reactions.
Add 30 μL of fluorescent PCR primer mix (see Recipes) to a 500 μL aliquot of fluorescent PCR master mix (see Recipes) and aliquot 10 μL/well of a new 96-well plate.
Note: These volumes are for 48 samples and can be adjusted depending on the number of samples being processed.
Add 3 μL of diluted DNA from section A3, step 6 to each well. Vortex the plate and spin down.
Run the fluorescent PCR reaction with the following conditions:
94 °C, 12 min
40 cycles
94 °C, 30 s
57 °C, 30 s
72 °C, 30 s
72 °C, 10 min
4 °C, hold
Pause point: Fluorescent PCR products can be stored at -20 °C for up to one month.
Make 1:50 dilution of GeneScan 400HD ROX using Hi-Di formamide.
Add 10 μL of the ROX/Hi-Di mixture to a plate that will fit onto a 3730xl DNA analyzer.
Add 3 μL of the fluorescent PCR product to the plate containing the ROX/Hi-Di mixture. Vortex the plate and spin down.
Incubate plate at 95 °C for 5 min using a thermocycler.
Load the plate into the 3730xl DNA analyzer and run using CRISPR-STAT settings.
Analyze data using the GeneMapper Software package to determine sgRNA activity and select the best target (Figure 3).
Note: Active sgRNAs show multiple peaks corresponding to the NHEJ-mediated indels. If all tested sgRNAs show good activity, choose the target that generates the DSB closest to the intended integration site.
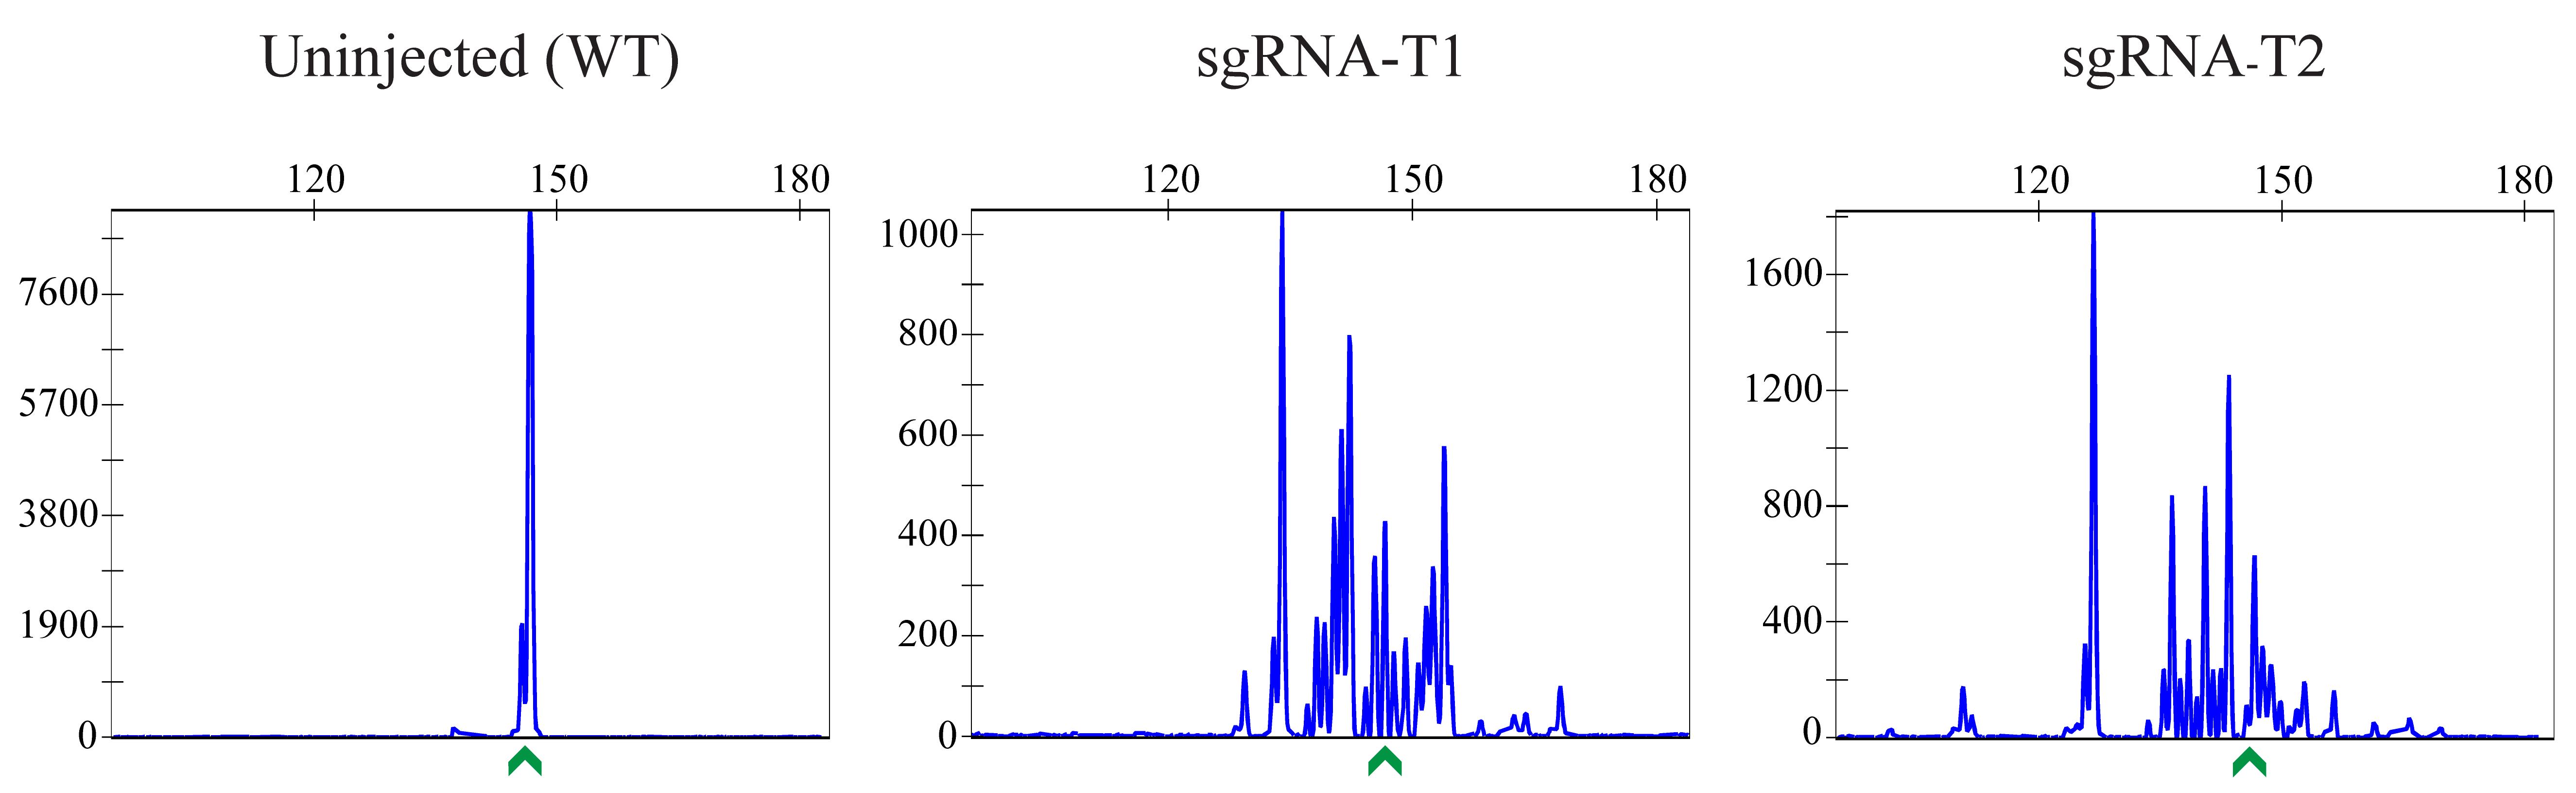
Figure 3. Examples of CRISPR-STAT plots showing sgRNA activity. In this example, both sgRNAs selected in Figure 1 are active. sgRNA-T1 would be selected as the best target and used in subsequent steps, as it generates the DSB closer to the intended nucleotide change. The x-axis shows the size of the peaks (bp), the y-axis shows fluorescent intensity, and the green arrow denotes the WT allele.
A4. Design of HDR template and screening primers
HDR template design
Note: The design described below is for a sgRNA in the reverse orientation (CCN PAM site) with respect to the open reading frame (ORF). If the sgRNA is in the forward orientation (NGG PAM site), it is recommended to align the guide in the reverse compliment orientation and follow the steps below.
Align the selected sgRNA target sequence to the reference sequence in the orientation that displays PAM as CCN.
Determine the sequence of homology arms by identifying the site of DSB. Select 91 bp of the sequence on the left side of the DSB site for the left homology arm. Select 36 bp of sequence on the right side of the DSB site for the right homology arm.
Note: For SpCas9, the DSB occurs 5 bp upstream of the PAM site [i.e., N18(DSB)NN NGG].
For insertion of DNA fragments: insert the desired sequence between these homology arms (Figure 4). Critical: If the inserted sequence separates the sgRNA binding and PAM sites, modification of the PAM site is not required to prevent recutting after HDR (example in Figure 4A). Otherwise, make a silent change in the PAM site. If a silent change cannot be made to the PAM site, 3–4 silent changes in the sgRNA binding site are typically sufficient to disrupt binding and prevent recutting from the sgRNA (example in Figure 4B).
Note: Depending on where the DSB occurs, it might be necessary to add additional sequences to maintain the ORF (example in Figure 4C).
For point mutations: modify the desired nucleotide in the homology arm sequence. If the desired point mutation disrupts the PAM site and generates a restriction site, additional nucleotide changes are not required (example in Figure 5A). If the desired point mutation does not disrupt the PAM site, silent changes are required to either destroy the PAM site (example in Figure 5B) or sgRNA binding site (example in Figure 5C). Any combination of these bp changes (desired change, PAM site, and/or sgRNA binding site) will need to generate a new restriction site that can be used for screening. Critical: It is important to generate a new restriction site instead of destroying a restriction site. Using loss of a restriction site for screening can lead to false positives, as this site can be destroyed by random indels instead of the integration of the DNA fragment.
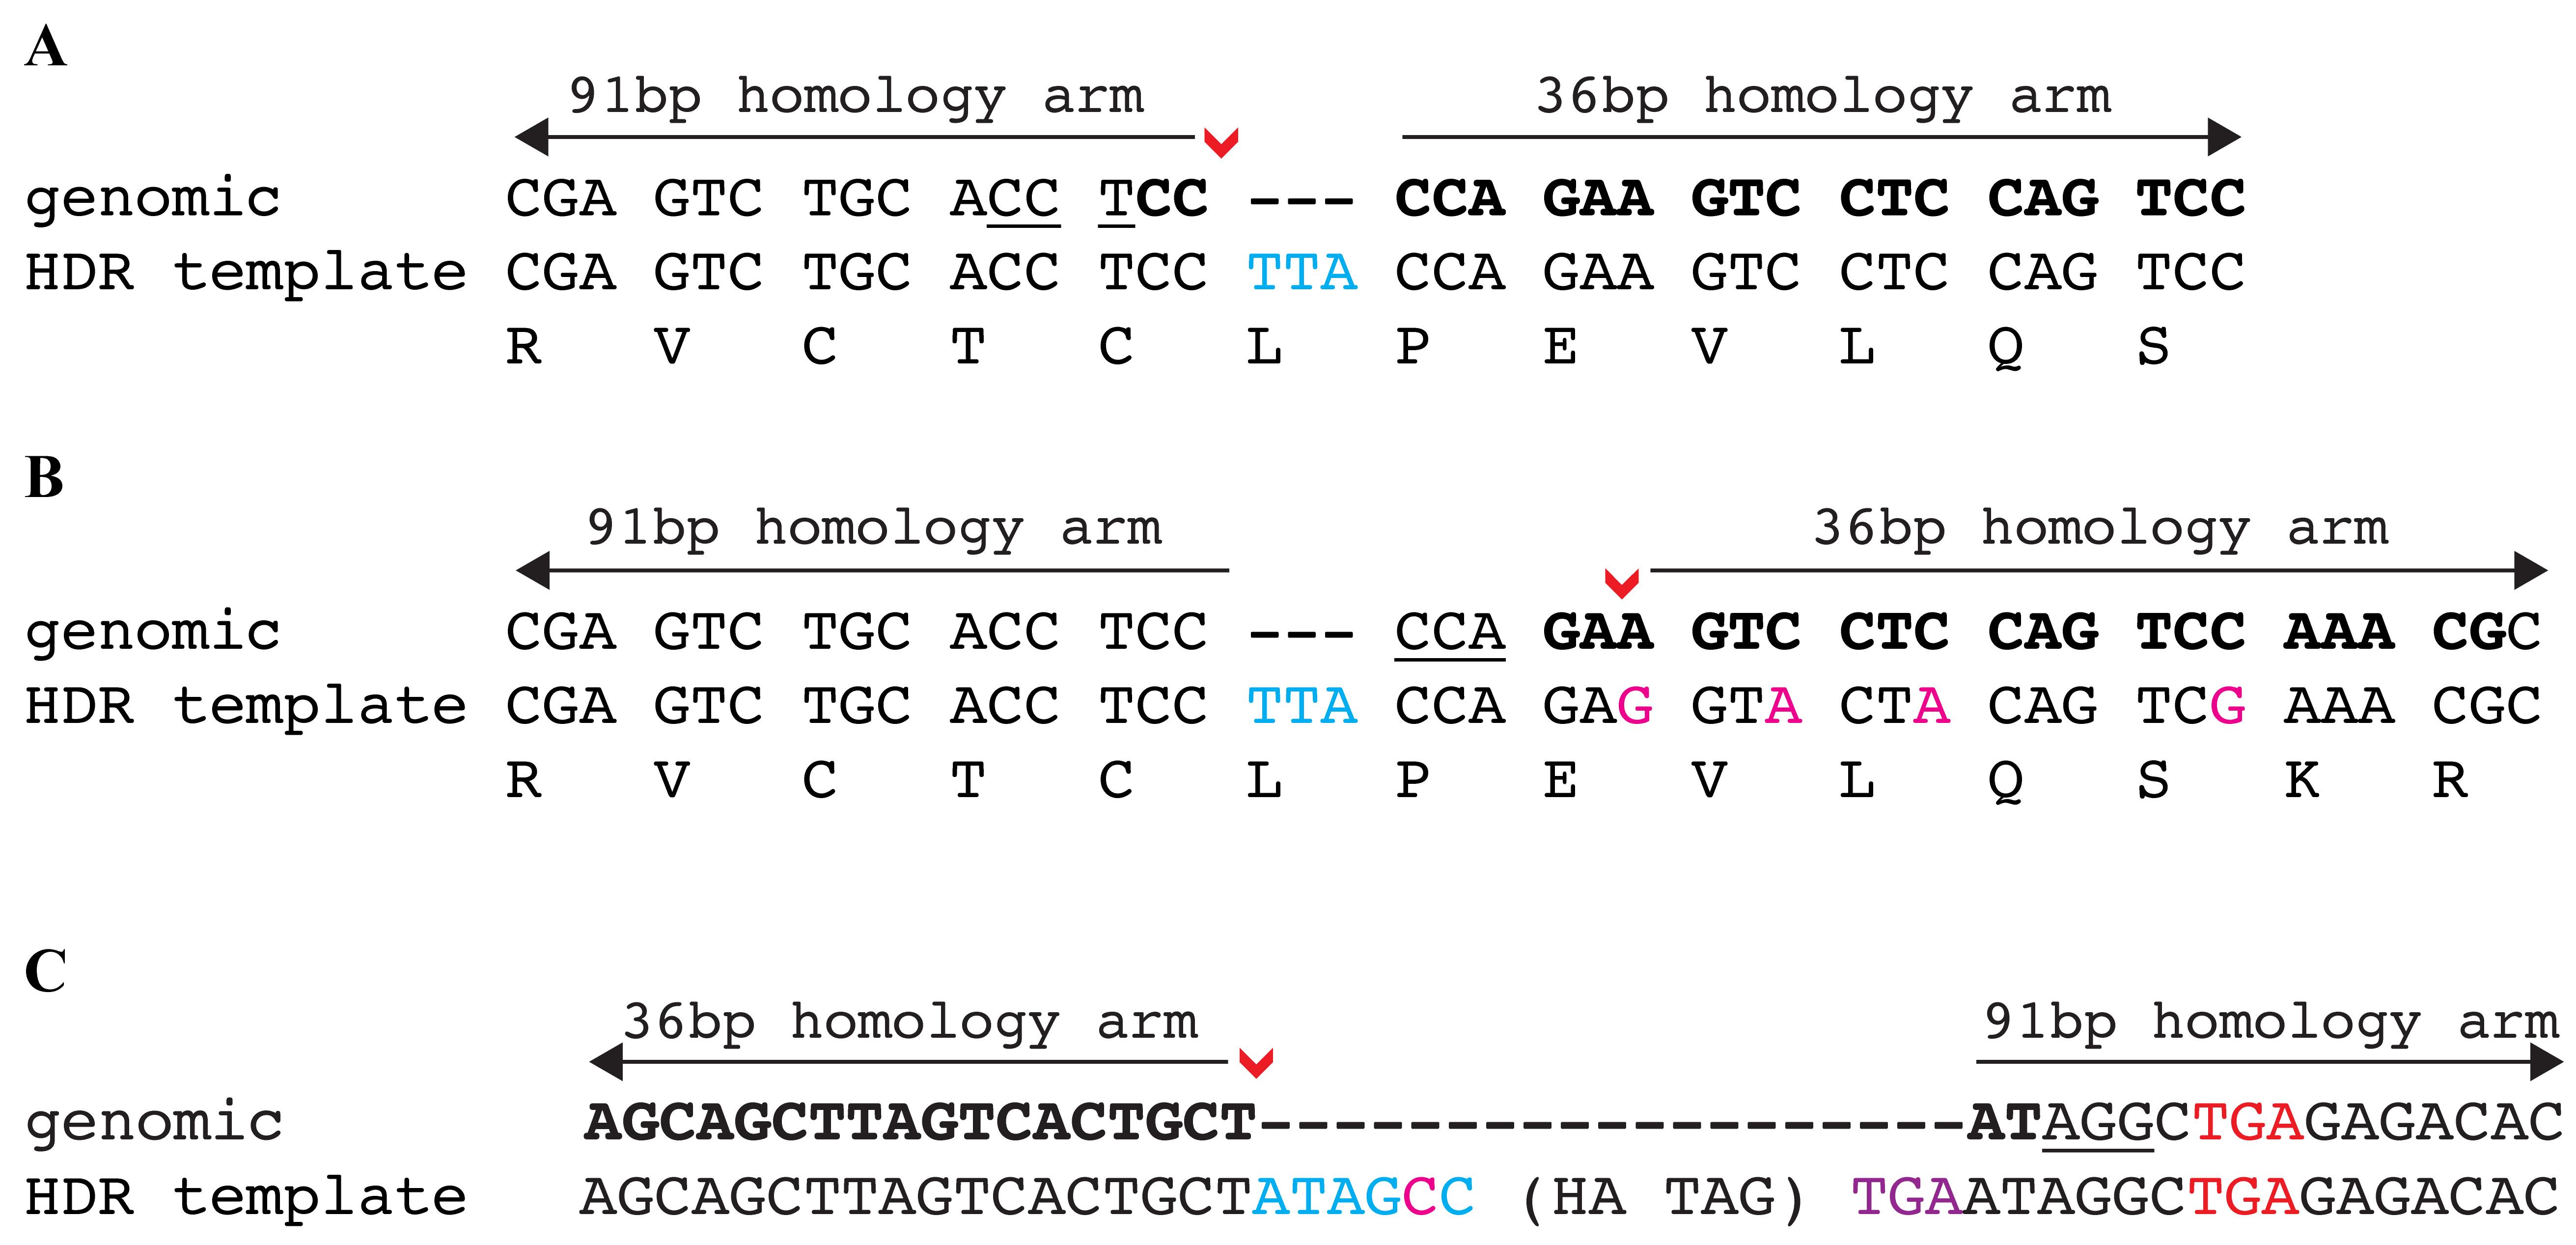
Figure 4. Examples of HDR template design to knock-in desired DNA sequences. (A) The DNA insertion of an in-frame codon TTA occurs directly at the DSB (denoted by red arrowhead). This insertion disrupts the sgRNA binding site and no additional modifications are required. (B) The DNA insertions occur 5 bp upstream of the DSB (denoted by red arrowhead). The insertion does not disrupt the sgRNA binding or the PAM site and a silent change cannot be made to the PAM site. Therefore, several silent changes (shown in magenta) are required to prevent recutting after HDR repair. (C) The HA epitope tag is inserted at the 3′ end of a gene’s ORF. The DSB (denoted by red arrowhead) occurs 6 bp upstream of the stop codon (shown in red font). To maintain the gene’s ORF, these 6 bp (shown in blue font) are added into the HDR template with one of the nucleotides (shown in magenta font) changed to a silent change to modify PAM site and prevent recutting after HDR repair. A new stop codon (shown in purple font) is added after the HA tag to terminate translation. In all examples, the sgRNA is in bold and the PAM site is underlined.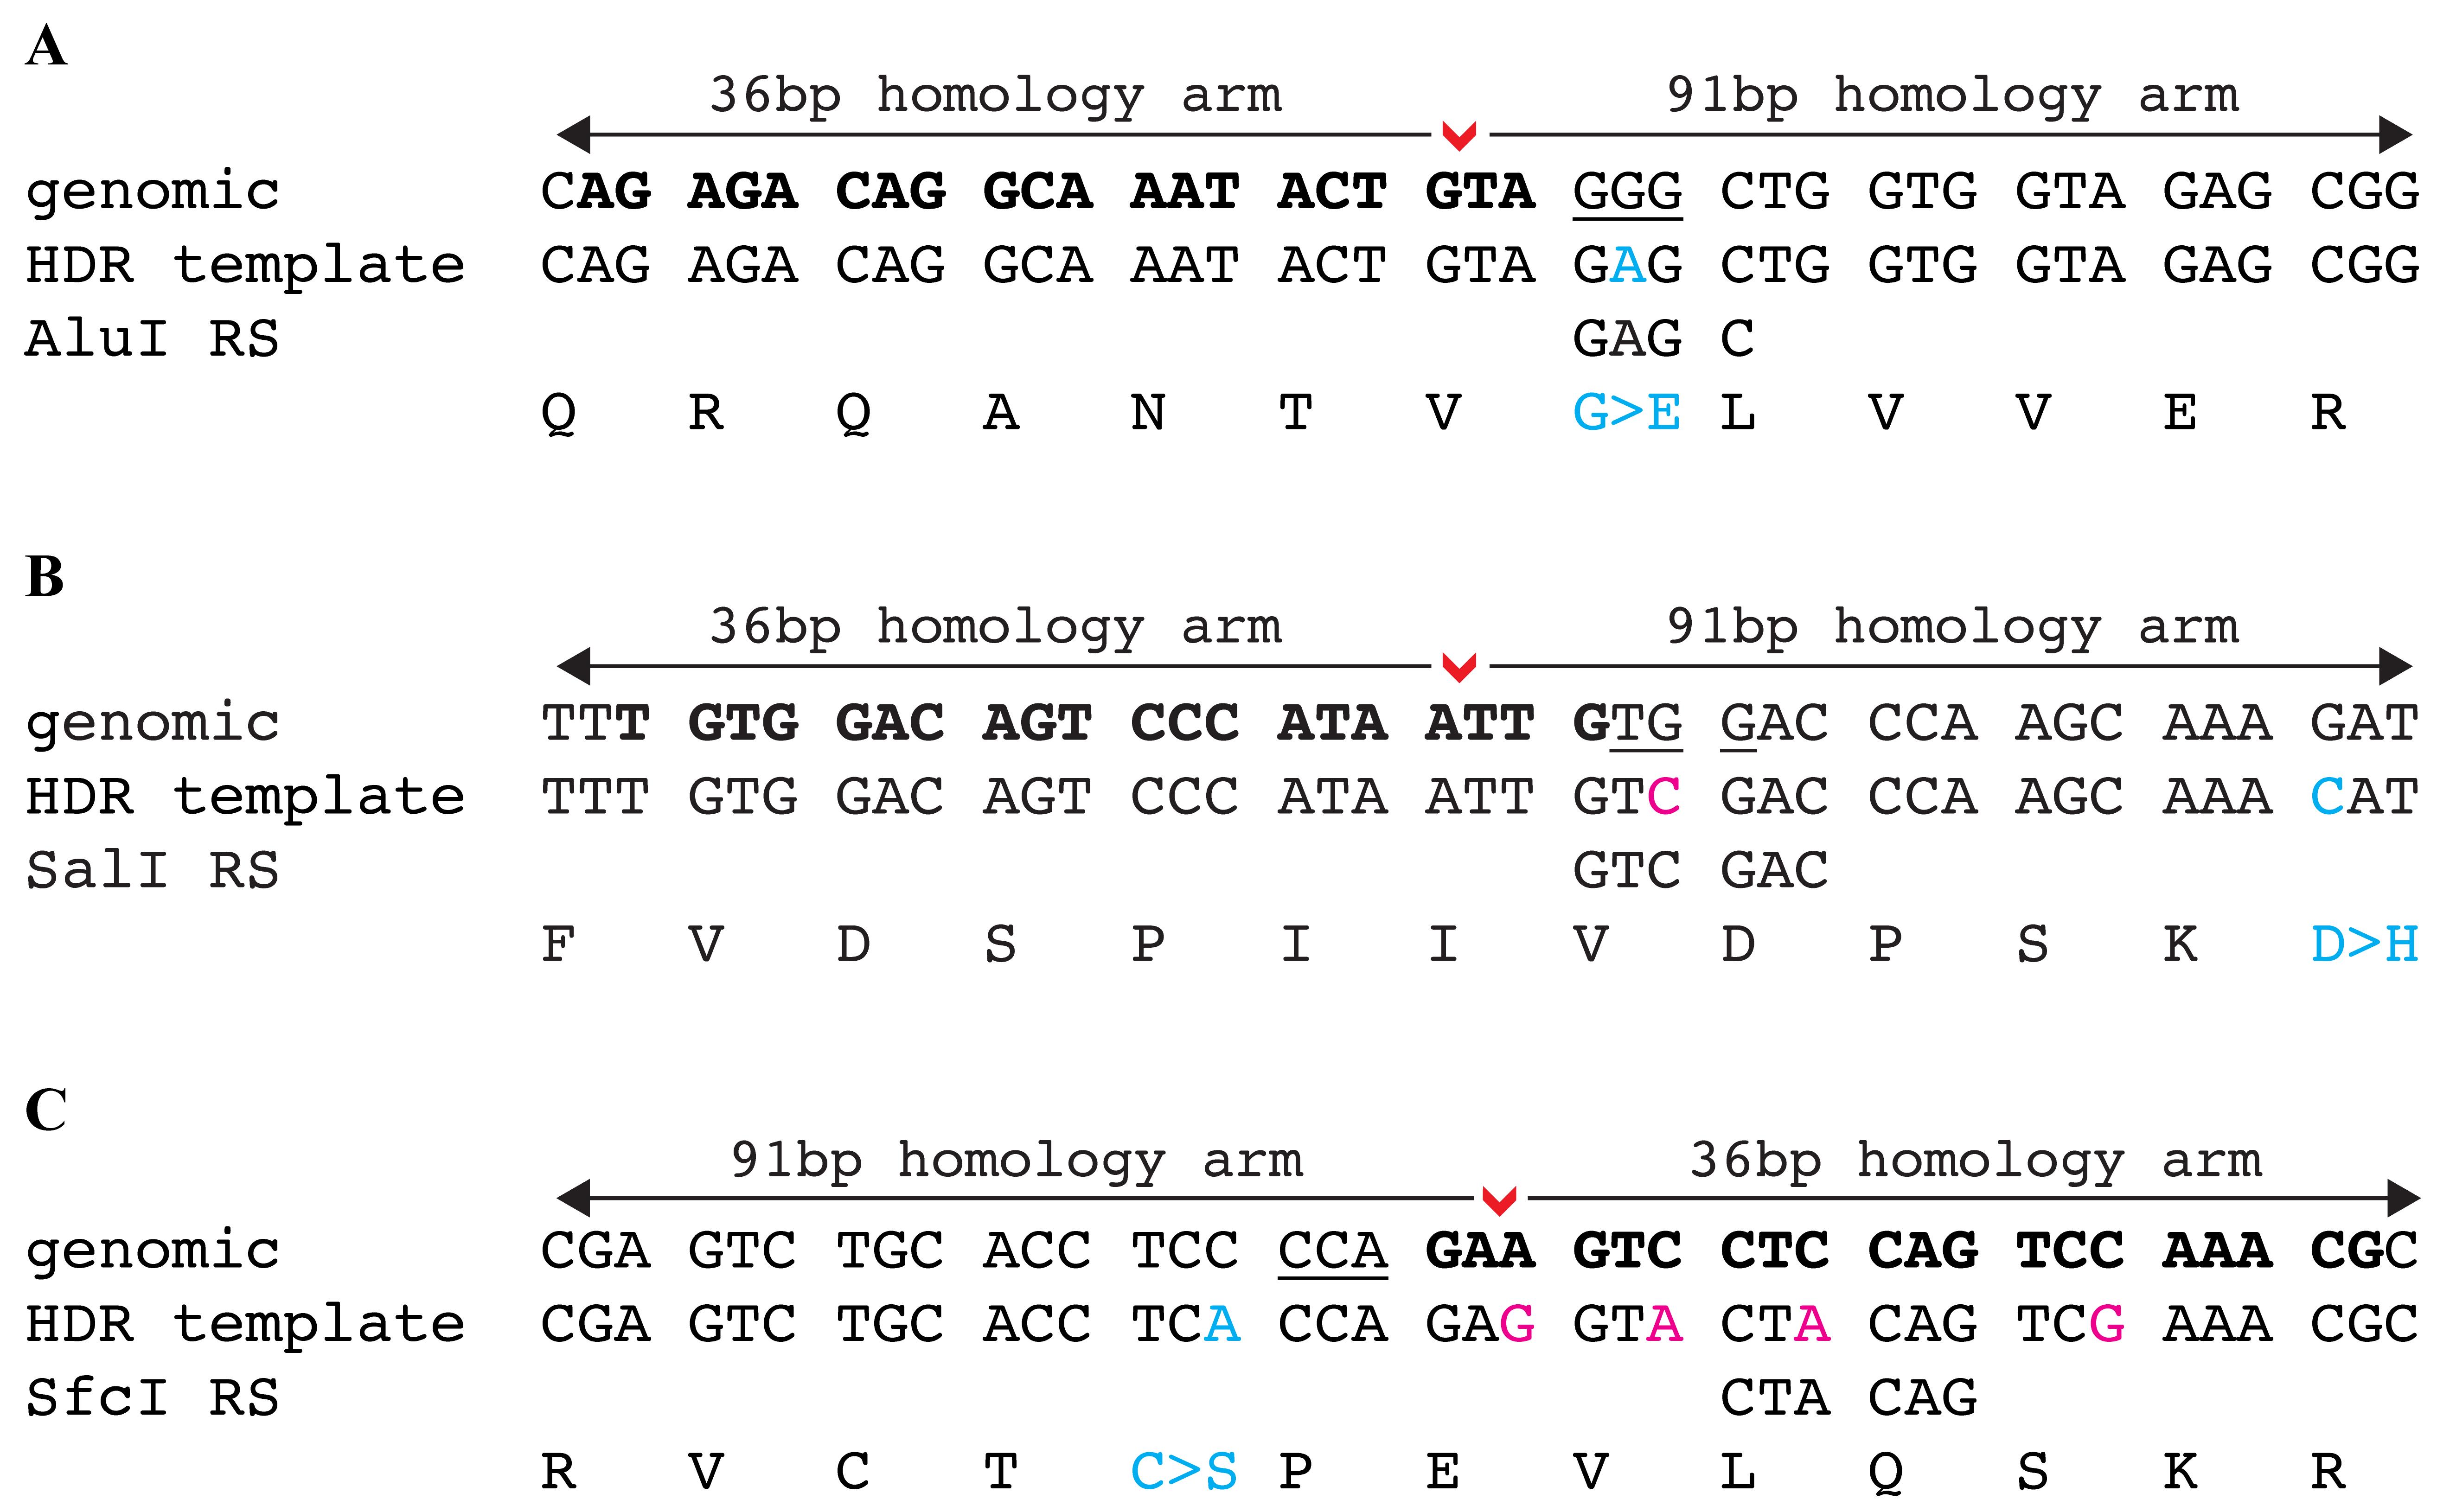
Figure 5. Examples of HDR template design to knock-in a point mutation. (A) The point mutation G>A (shown in blue font) modifies the PAM site as well as generates an AluI restriction site that can be used for screening. (B) The point mutation G>C (shown in blue font) is 17 bp downstream of the DSB site. A silent change is made to disrupt the PAM site (G>C, shown in magenta font) and this change also generates a SalI restriction site that can be used for screening. (C) The point mutation C>A (shown in blue font) is 6 bp upstream of the DSB site. In this example, a silent change cannot be made to the PAM site, and, therefore, four silent changes are required (shown in magenta font) to destroy the sgRNA binding site. One of these changes also generates a SfcI restriction site that can be used for screening. In all examples, the DSB site is denoted by a red arrowhead, sgRNA is shown in bold font, and the PAM site is underlined.Identify potential polymorphisms in the homology arms by fin clipping 24 male and 24 female adult fish followed by PCR and sequencing of the target region.
Note: The previously designed primers may be used for this step, depending on their binding sites.
Analyze the sequence data to identify any polymorphisms. If polymorphisms are identified, fish should be grouped into a cohort with 100% homology to the reference sequence used for design of HDR template. Alternately, modify the homology arms to match the sequence of your fish cohort.
To obtain the final sequence of the HDR template, orient the sequence with the 91 bp homology arm on the 5′ side and the 36 bp homology arm on the 3′ side. Order templates smaller than 200 bp as an ultramer (IDT) and larger than 200 bp as a ssDNA fragment (Azenta Life Sciences).
Note: Depending on the vendor used to synthesize the HDR template, the amount delivered varies widely. The HDR template should be resuspended in ultrapure water to a concentration that can be accurately pipetted to prepare the injection mix in section B3.
Design of knock-in screening primers
For knock-in of DNA fragments: design primers that amplify the target region but do not overlap with the HDR template. The primers should amplify a region of up to 350 bp (including the insertion sequence). Add the M13F sequence (5′-TGTAAAACGACGGCCAGT-3′) to the 5′ side of the forward primer and a PIG-tail sequence (5′-GTGTCTT-3′) to the 5′ side of the reverse primer (Figure 6).
Note: The previously designed fluorescent PCR primers may be used for screening if they meet these criteria.
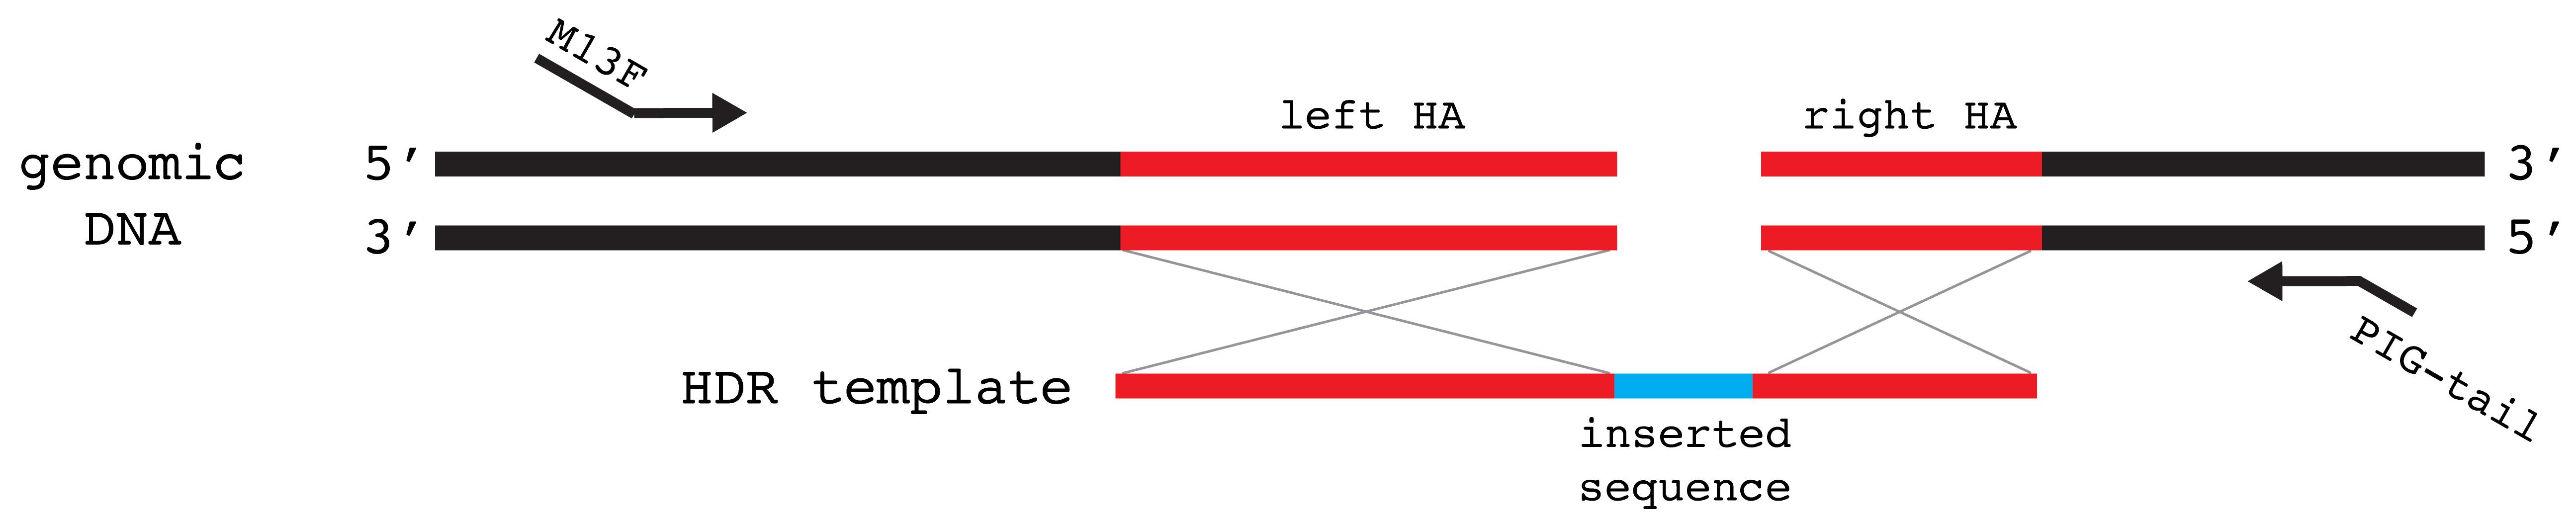
Figure 6. Schematic showing design of screening primers for insertion of a DNA fragment. Primers should not overlap with the HDR template to allow for screening of precise integration. Homology arms (left HA and right HA) are marked in red in both genomic DNA and HDR template. Inserted sequence is marked in blue on the HDR template. M13F sequence is added to the forward primer and the PIG-tail sequence is added to the reverse primer.For point mutations: design primers that amplify the target region but do not overlap with the HDR template. The primers should amplify a region up to 350 bp. Add the M13F sequence (5′-TGTAAAACGACGGCCAGT-3′) to the 5′ side of the forward primer and a PIG-tail sequence (5′-GTGTCTT plus restriction site sequence-3′) to the 5′ side of the reverse primer (Figure 7). Critical: This screening strategy will not work if the same restriction site is also present between the new knock-in restriction site and the forward primer. The digested PCR fragment must be > 100 bp for the fluorescent signal to be detected.
Note: The previously designed forward primer may be used for screening if it meets these criteria. The reverse primer will need to have the new restriction site added between the PIG-tail and binding sequence. A schematic of the fluorescent PCR digestion strategy can be found in Carrington et al. (2022) (Figure 3B).
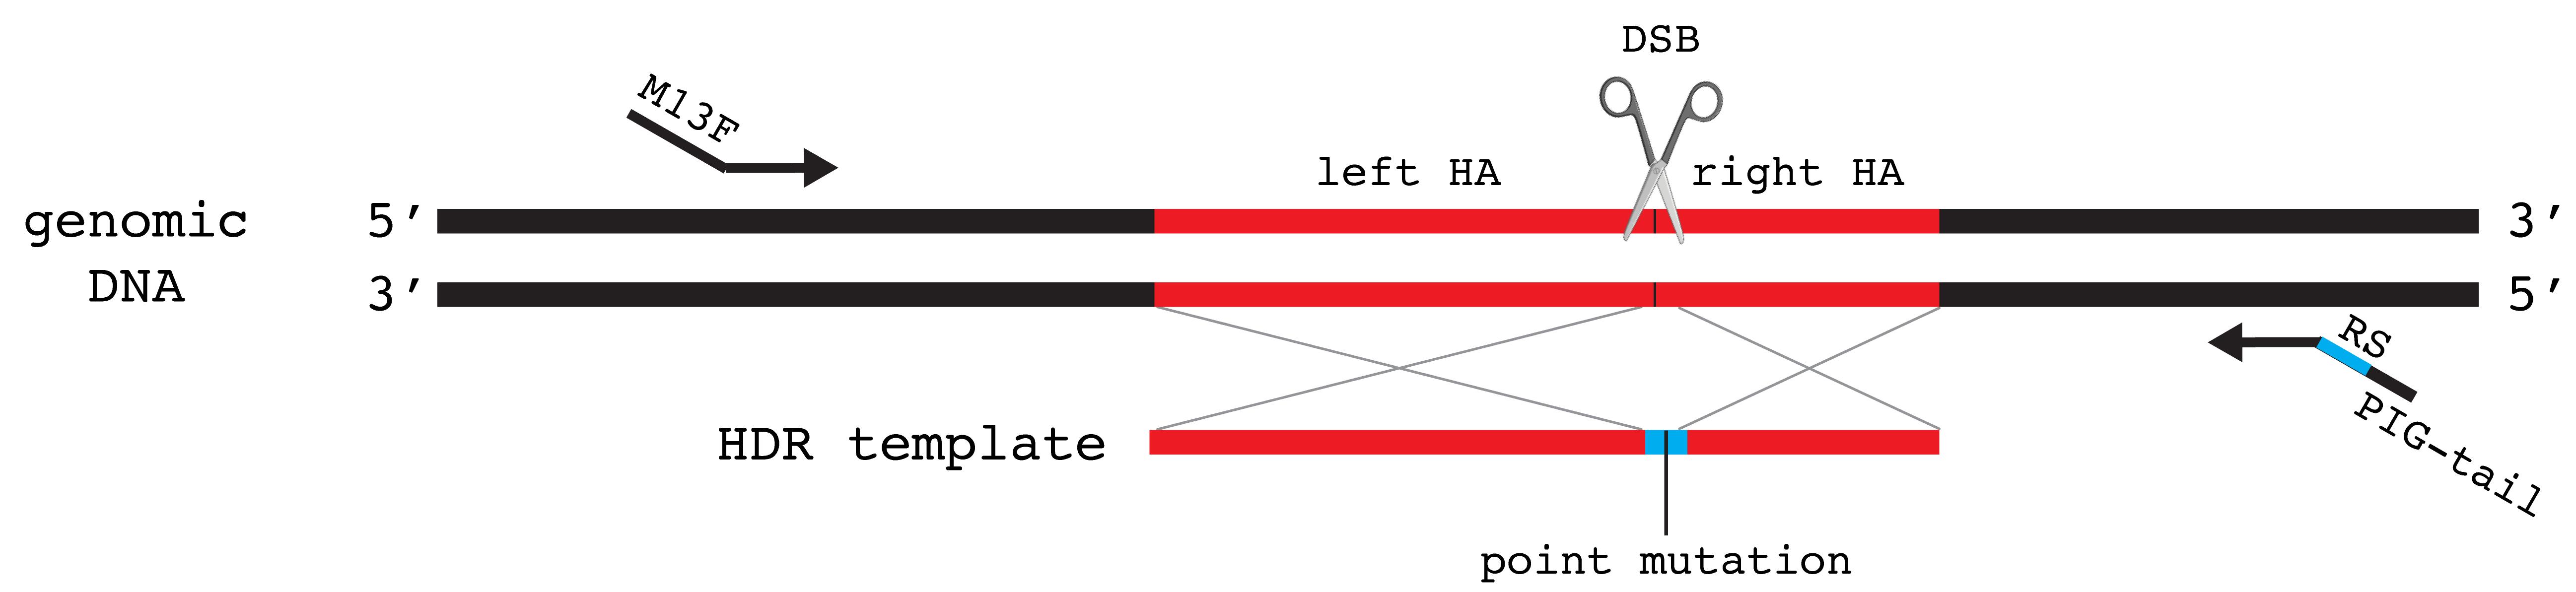
Figure 7. Schematic showing design of screening primers for knock-in of a point mutation. Primers should not overlap with the HDR template (shown with homology arms in red, restriction enzyme recognition sequence in blue, and point mutation by black line) to allow for screening of precise integration. M13F sequence is added to the 5′ end of forward primer. PIG-tail and the restriction enzyme recognition sequences (RS) are added to the 5′ end of reverse primer.
Somatic screening phase
B1. Injections to deliver sgRNA/Cas9 and HDR templatePrepare injection apparatus and pull needles.
Prepare injection mixture for sgRNA/Cas9 as described in section A2, step 2.
Prepare injection mixture for sgRNA/Cas9 plus HDR template as follows:
sgRNA (354 ng) variable volume
Cas9 mRNA (2.1 μg) variable volume
HDR template (175 ng) variable volume
Ultrapure water up to 10 μL
Total 10 μL
Note: These amounts are for injections of 1.4 nL per embryo. If a different volume is injected, adjust amounts of sgRNA, Cas9 mRNA, and HDR template in injection mixture such that each embryo receives 50 pg sgRNA, 300 pg Cas9 mRNA, and 25 pg of HDR template.
Load the injection mixture into a capillary injection needle and inject 1.4 nL per embryo. Repeat this step for each injection mixture. Inject ~100 embryos for the sgRNA/Cas9 mixture and ~200 embryos for the sgRNA/Cas9 plus HDR template mixture.
Incubate the injected embryos as well as uninjected controls in a 28.5 °C incubator in egg water. Remove any unfertilized and injected damaged embryos at 3–6 hpf.
At 1 dpf, remove any deformed or dead embryos.
At 1 dpf, collect 24 embryos from each injection group (sgRNA/Cas9 and sgRNA/Cas9 plus HDR template) and uninjected controls in a 96-well plate (one embryo per well). Keep the remaining embryos in the incubator to be raised after knock-in is confirmed. Critical: If embryos are still in chorions, place the plate into a -20 or -80 °C freezer for 20–30 min to completely freeze and burst the chorion, allowing extraction reagents in following steps to access the tissue.
Extract DNA, perform fluorescent PCR using primers designed for knock-in screening (section A4, step 2), and run samples as described in section A3. For DNA insertion projects, proceed to step 7 and skip digestion steps 3–6 that are used for point mutation screening.
Note: Store extracted DNA at -20°C, as it will be needed for confirmation by TOPO cloning.
Prepare digestion mixture as follows:
Enzyme (200 U/μL) 15 μL
10× digestion buffer 75 μL
Ultrapure water 660 μL
Total 750 μL
Note: This is an example using SalI-HF that should be modified based on the enzyme that is appropriate for the designed HDR template.
Add 5 μL of the digestion mixture to a new 96-well plate.
Add 5 μL of the fluorescent PCR products to the plate containing the digestion mixture.
Incubate with the following conditions using a thermocycler:
37 °C, 1.5 h (digestion)
60 °C, 20 min (heat inactivation of restriction enzyme)
4 °C, hold
Critical: It is highly recommended that restriction digestion conditions are modified based on the restriction enzyme being used and optimized using WT samples before using injected samples. WT sample digestion is assessed by removal of the PIG-tail, resulting in a product that is 7–10 bp shorter than undigested PCR products (see Figure 8 panel B to compare undigested and digested samples to see the shift in WT peak size after digestion).
Mix 3 μL of fluorescent PCR product (DNA insertion) or digested fluorescent PCR product (point mutation) with 10 μL of ROX-Hi-Di mixture and run plates on 3730xl DNA analyzer as described in section A3, steps 10–14.
Analyze data using the GeneMapper Software package to determine the number of samples in each group that have peaks at the expected knock-in allele size (Figure 8).
Note: For point mutations, it is important to confirm complete digestion in the uninjected WT samples, since incomplete digestion can result in false negatives.
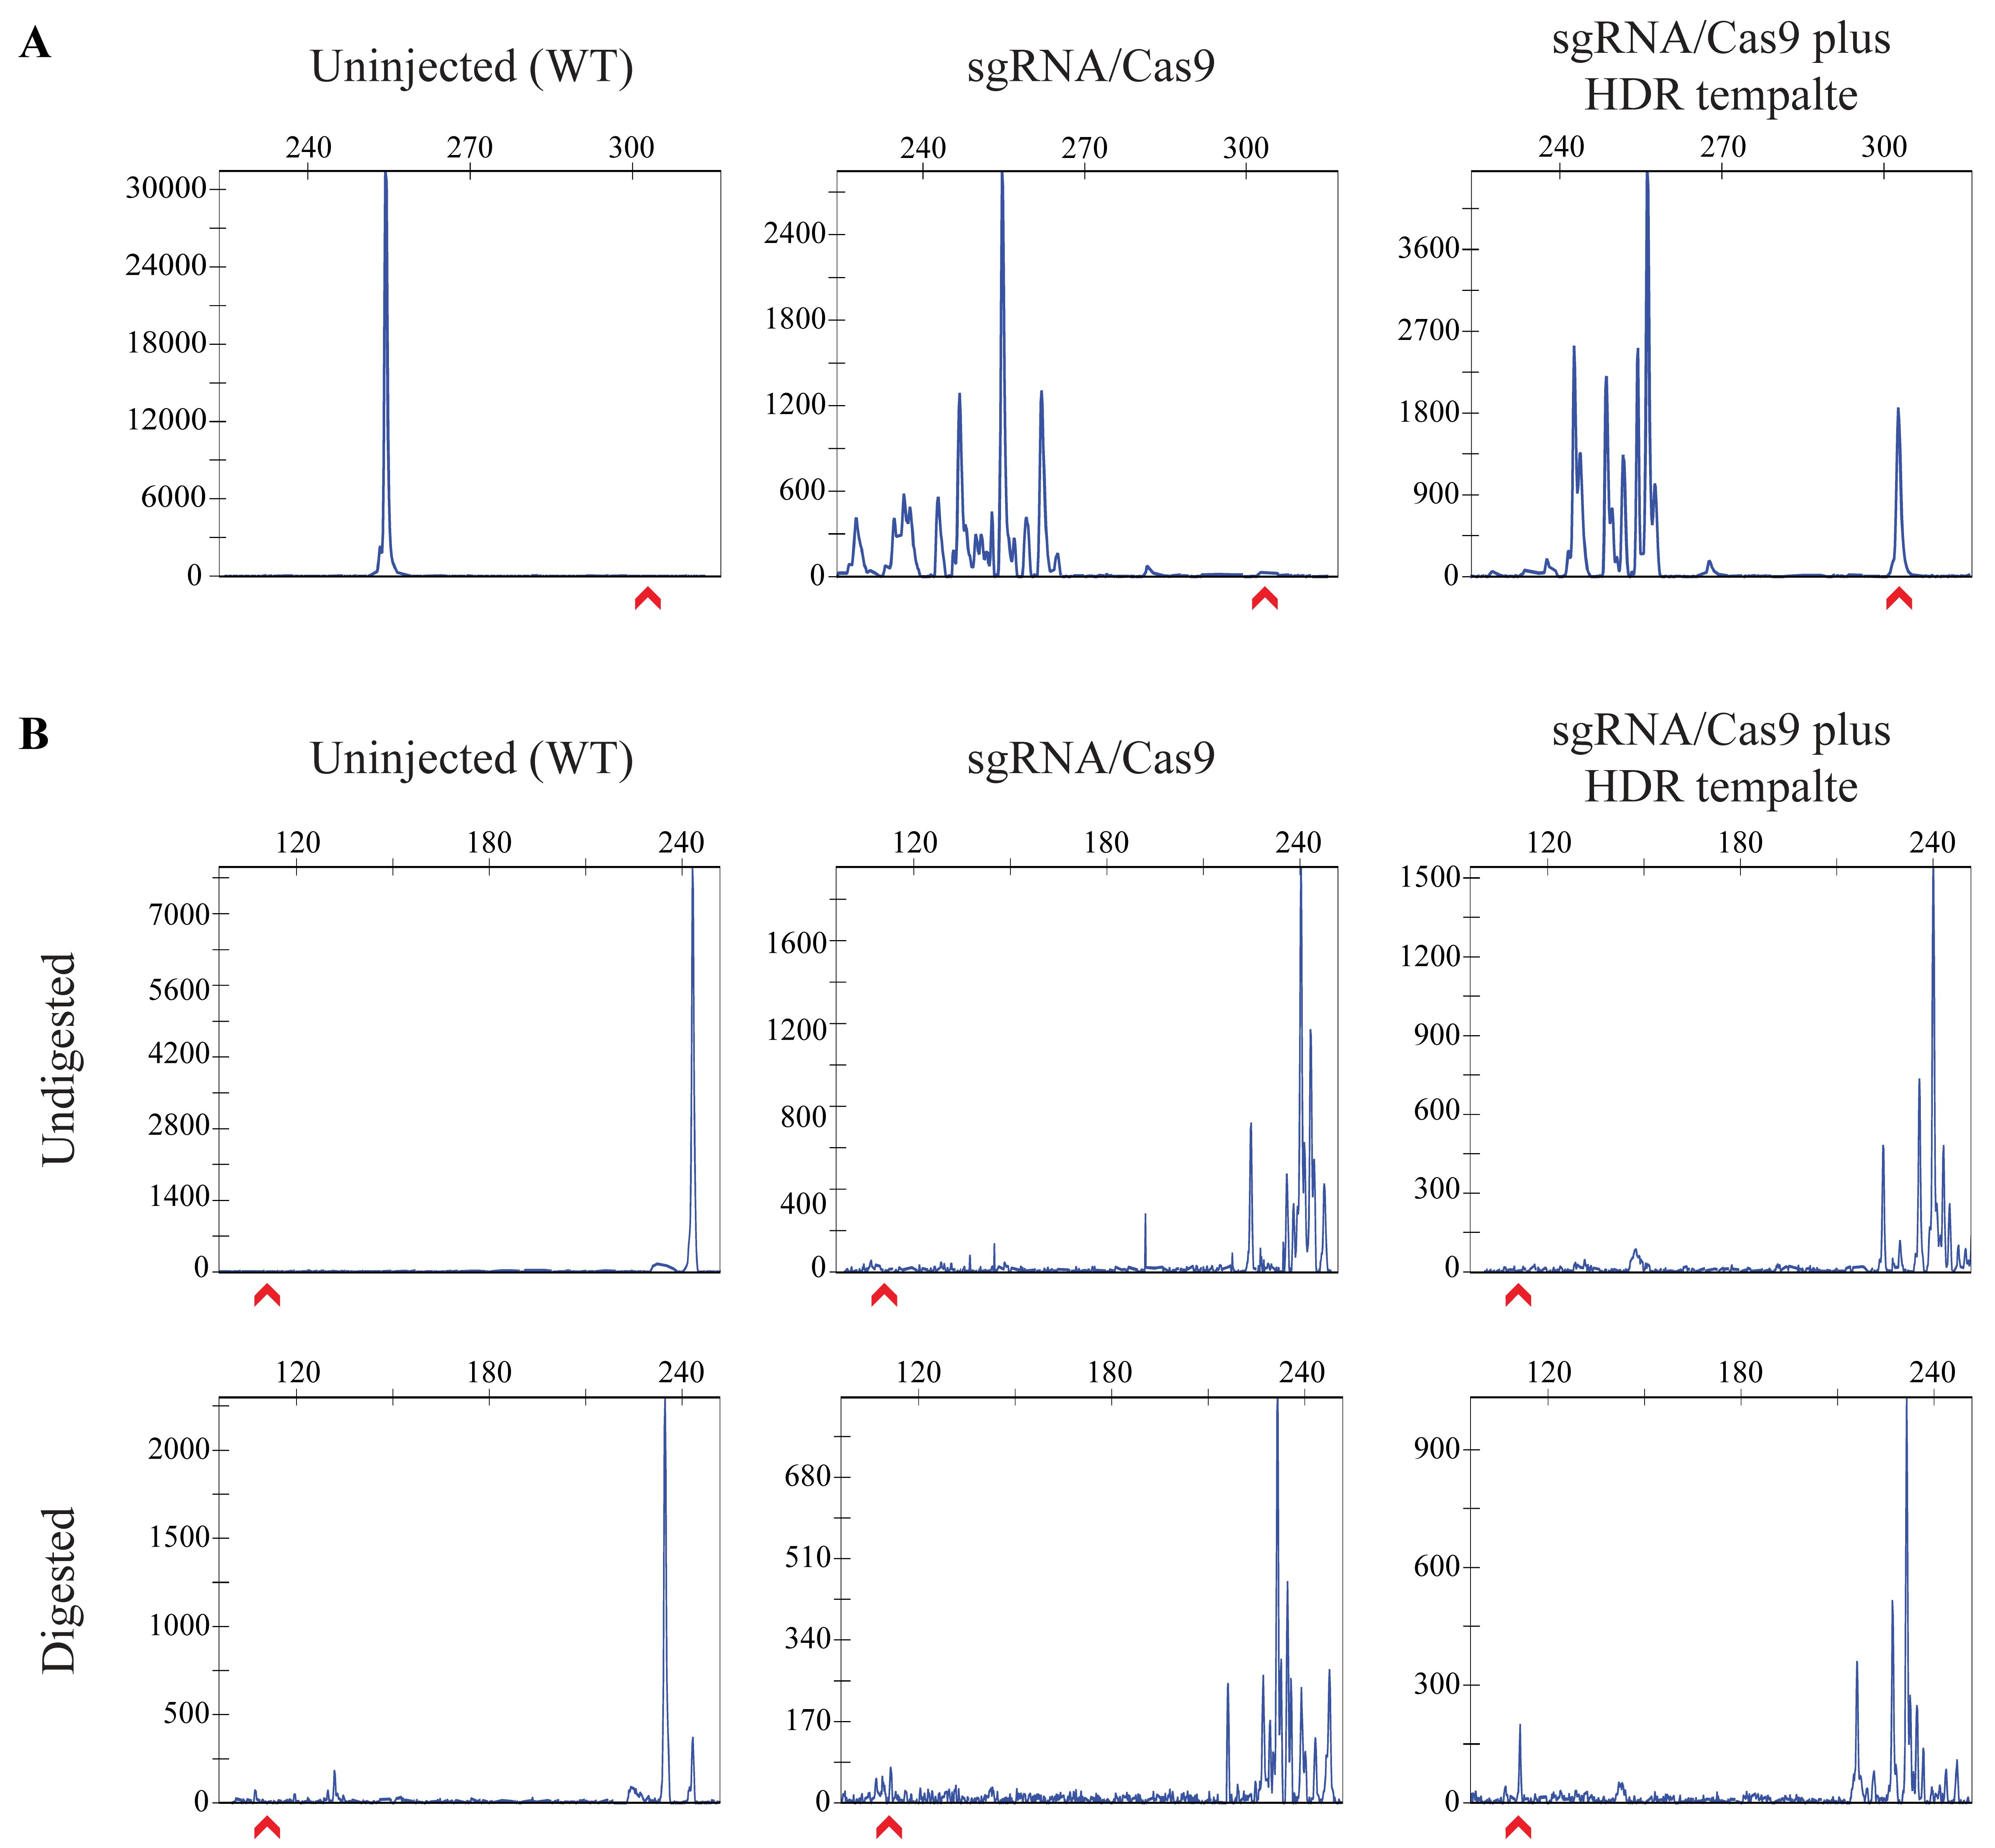
Figure 8. Examples of CRISPR-STAT plots from injected embryos to detect somatic knock-in. CRISPR-STAT plots from uninjected, sgRNA/Cas9-injected, and sgRNA/Cas9 plus HDR template–injected embryos are analyzed to determine if an enrichment of the peak corresponding to the knock-in allele size is seen in the presence of HDR template. The x-axis shows the size of the peaks (bp), the y-axis shows fluorescent intensity, and the red arrow denotes the expected knock-in allele. (A) Example of a DNA insertion with the knock-in peak being larger than the WT allele. (B) Example of a point mutation before and after digestion. The undigested samples serve as controls, with peak for WT allele at 7–10 bp larger than in the digested samples. The peak for knock-in allele should only be observed after digestion in sgRNA/Cas9 plus HDR template samples.Compare the number of samples with knock-in peaks for each treatment and determine if there is an enrichment of the desired knock-in peak in the sgRNA/Cas9 plus HDR template samples compared to the sgRNA/Cas9 alone. If an enrichment is not observed, repeat injections to rule out technical errors or design a new sgRNA/HDR template combination.
Select 2–3 samples that are positive for the expected size peak from the sgRNA/Cas9 plus HDR template group.
Note: Samples with a more robust peak at the expected knock-in size are preferred for this step.
Set up a PCR for each sample as follows:
10× Gold buffer 5 μL
25 mM MgCl2 3 μL
Advantage UltraPure PCR dNTP mix (10 mM each) 1 μL
Knock-in screening forward M13F tailed primer (20 μM) 3 μL
Knock-in screening reverse PIG-tailed primer (20 μM) 3 μL
AmpliTaq Gold DNA Polymerase 0.5 μL
Ultrapure water 31.5 μL
Diluted DNA (section B2, step 2) 3 μL
Total 50 μL
Run PCR with the following conditions:
94 °C, 12 min
35 cycles
94 °C, 30 s
57 °C, 30 s
72 °C, 30 s
72 °C, 10 min
4 °C, hold
Clean up PCR products with the MinElute Reaction Cleanup Kit following the manufacturer’s instructions and elute with 10 μL of ultrapure water.
Set up the TOPO cloning reaction using 4 μL of purified PCR product according to the manufacturer’s instructions. Critical: PCR product should be fresh.
Incubate reaction at RT for 1–2 h. Critical: Shorter incubation times may result in insufficient number of clones.
Transform 4 μL of the TOPO reaction using TOP10 cells according to manufacturer’s instructions. Plate 50 and 250 μL onto two separate agar plates containing ampicillin.
Incubate agar plates overnight at 37 °C.
Prepare PCR master mix for colony PCR as follows:
10× Gold buffer 250 μL
25 mM MgCl2 150 μL
Advantage UltraPure PCR dNTP mix (10 mM each) 50 μL
Knock-in screening forward M13F tailed primer (20 μM) 150 μL
Knock-in screening reverse PIG-tailed primer (20 μM) 150 μL
AmpliTaq Gold DNA Polymerase 25 μL
Ultrapure water 1,725 μL
Total 2,500 μL
Add 25 μL of the PCR master mix into each well of a 96-well plate.
Using clean pipette tips, touch the tip to individual clones followed by dipping the tip into a single well containing the PCR master mix. Repeat this to select 48 clones for each cloned sample. This allows for two cloned samples to be screened on a 96-well plate.
Run the colony PCR reaction with the following conditions:
94 °C, 12 min
35 cycles
94 °C, 30 s
57 °C, 30 s
72 °C, 30 s
72 °C, 10 min
4 °C, hold
Critical: If an alternative polymerase is used, the first denaturation should be a minimum of 10 min at 94 °C to lyse the bacteria.
Transfer 4 μL of the PCR product to a fresh 96-well plate and add 1 μL of ExoSAP-IT and 1 μL of ultrapure water to each reaction.
Using a thermocycler, run the following reaction:
37 °C, 15 min
80 °C, 15 min
4 °C, hold
Prepare BigDye Terminator master mix as follows:
Sequencing primer (5 μM) 100 μL
BigDye sequencing buffer (5×) 200 μL
BigDye terminator v3.1 100 μL
Total 400 μL
Note: Volumes are for 100 reactions and can be scaled as needed based on the number of samples to be processed. The sequencing primer is either the forward or reverse primer that was used for the colony PCR and is farthest away from the HDR template. The resulting sequence will need to cover both ends of the HDR template to confirm precise integration.
Add 4 μL of the BigDye Terminator master mix to each ExoSAP-IT-treated PCR reaction. Vortex the plate and spin down.
Run the BigDye Terminator reaction using the following conditions:
96 °C, 1 min
25 cycles
96 °C, 10 s
50 °C, 5 s
60 °C, 4 min
4 °C, hold
Clean up the BigDye Terminator reactions using DyeEx 96 kit plates according to the manufacturer’s instructions.
Run the purified products on a 3730xl DNA analyzer using standard sequencing programs.
Analyze clone sequences by aligning reads to reference sequence of the target region with the knock-in DNA fragment (see Data analysis section).
Grow remaining injected embryos or repeat injections to grow founder fish if precise knock-in is confirmed by cloning.
Germline screening phase
C1. Prioritization of founders to screenFin clip all adult founder fish and place each fin in a well of a 96-well plate.
Mix 50 μL of extraction solution and 12.5 μL of tissue preparation solution for each sample (i.e., 100 samples: 5.0 mL of extraction solution and 1.25 mL of tissue preparation solution).
Add 62.5 μL of the extraction/tissue preparation solution mixture to each sample. Critical: Fin tissue should be submerged in the solution. Do not vortex.
Incubate the plate at RT for 10 min followed by 5 min at 95 °C.
Add 50 μL of neutralization solution B to each well and mix by vortexing. Pause point: DNA can be stored at -20°C for up to four weeks.
Dilute DNA 1:10 with ultrapure water for use in PCR reactions.
Add 60 μL of fluorescent knock-in screening primer mix (see Recipes) to a 1 mL aliquot of fluorescent PCR master mix (see Recipes) and aliquot 10 μL/well of a new 96-well plate.
Note: These volumes are for 100 samples and can be adjusted depending on the number of samples being processed.
Using the multichannel pipette, transfer 3 μL of diluted DNA from step 6 to the plate with fluorescent knock-in screening primer mixture/fluorescent PCR master mix. Vortex the plate and spin down.
Run the fluorescent PCR reaction with the following conditions:
94 °C, 12 min
40 cycles
94 °C, 30 s
57 °C, 30 s
72 °C, 30 s
72 °C, 10 min
4 °C, hold
Pause point: Fluorescent PCR products can be stored at -20 °C for up to one month.
If screening for point mutations, perform restriction digest as described in section B2, steps 3–7.
Make 1:50 dilution of GeneScan 400HD ROX using Hi-Di formamide.
Add 10 μL of the ROX/Hi-Di mixture to a plate that will fit onto a 3730xl DNA analyzer.
Transfer 3 μL of the fluorescent PCR product from step 9 for DNA insertions and step 10 for point mutations to the plate containing the ROX/Hi-Di mixture. Vortex the plate and spin down.
Incubate plate at 95 °C for 5 min using a thermocycler.
Load the plate into the 3730xl DNA analyzer and run using CRISPR-STAT settings.
Analyze data using the GeneMapper Software package and identify founder fish that have an expected knock-in peak present in the fin clip. Pool these fish into a tank and use for screening (described below), as these fish are most likely to show germline transmission to their progeny. Founder fish that are negative for the knock-in peak in their fins should be kept separated until a positive germline transmitting fish is identified.
Set up pairwise crosses of each prioritized founder fish with a WT fish and collect embryos for screening.
Incubate embryos at 28.5 °C overnight.
At 1 dpf, collect three embryos per well (up to 24 wells per founder depending upon the clutch size) in a 96-well plate.
Note: This strategy allows for screening of 72 embryos per founder and four founders per plate.
Extract DNA, perform fluorescent PCR, and run samples as described in section C1, steps 2–15. For point mutations, perform restriction digest steps described in section B2, steps 3–7 after fluorescent PCR.
Analyze data using the GeneMapper software package to determine if any samples show the expected knock-in allele and identify the corresponding founder fish (Figure 9).
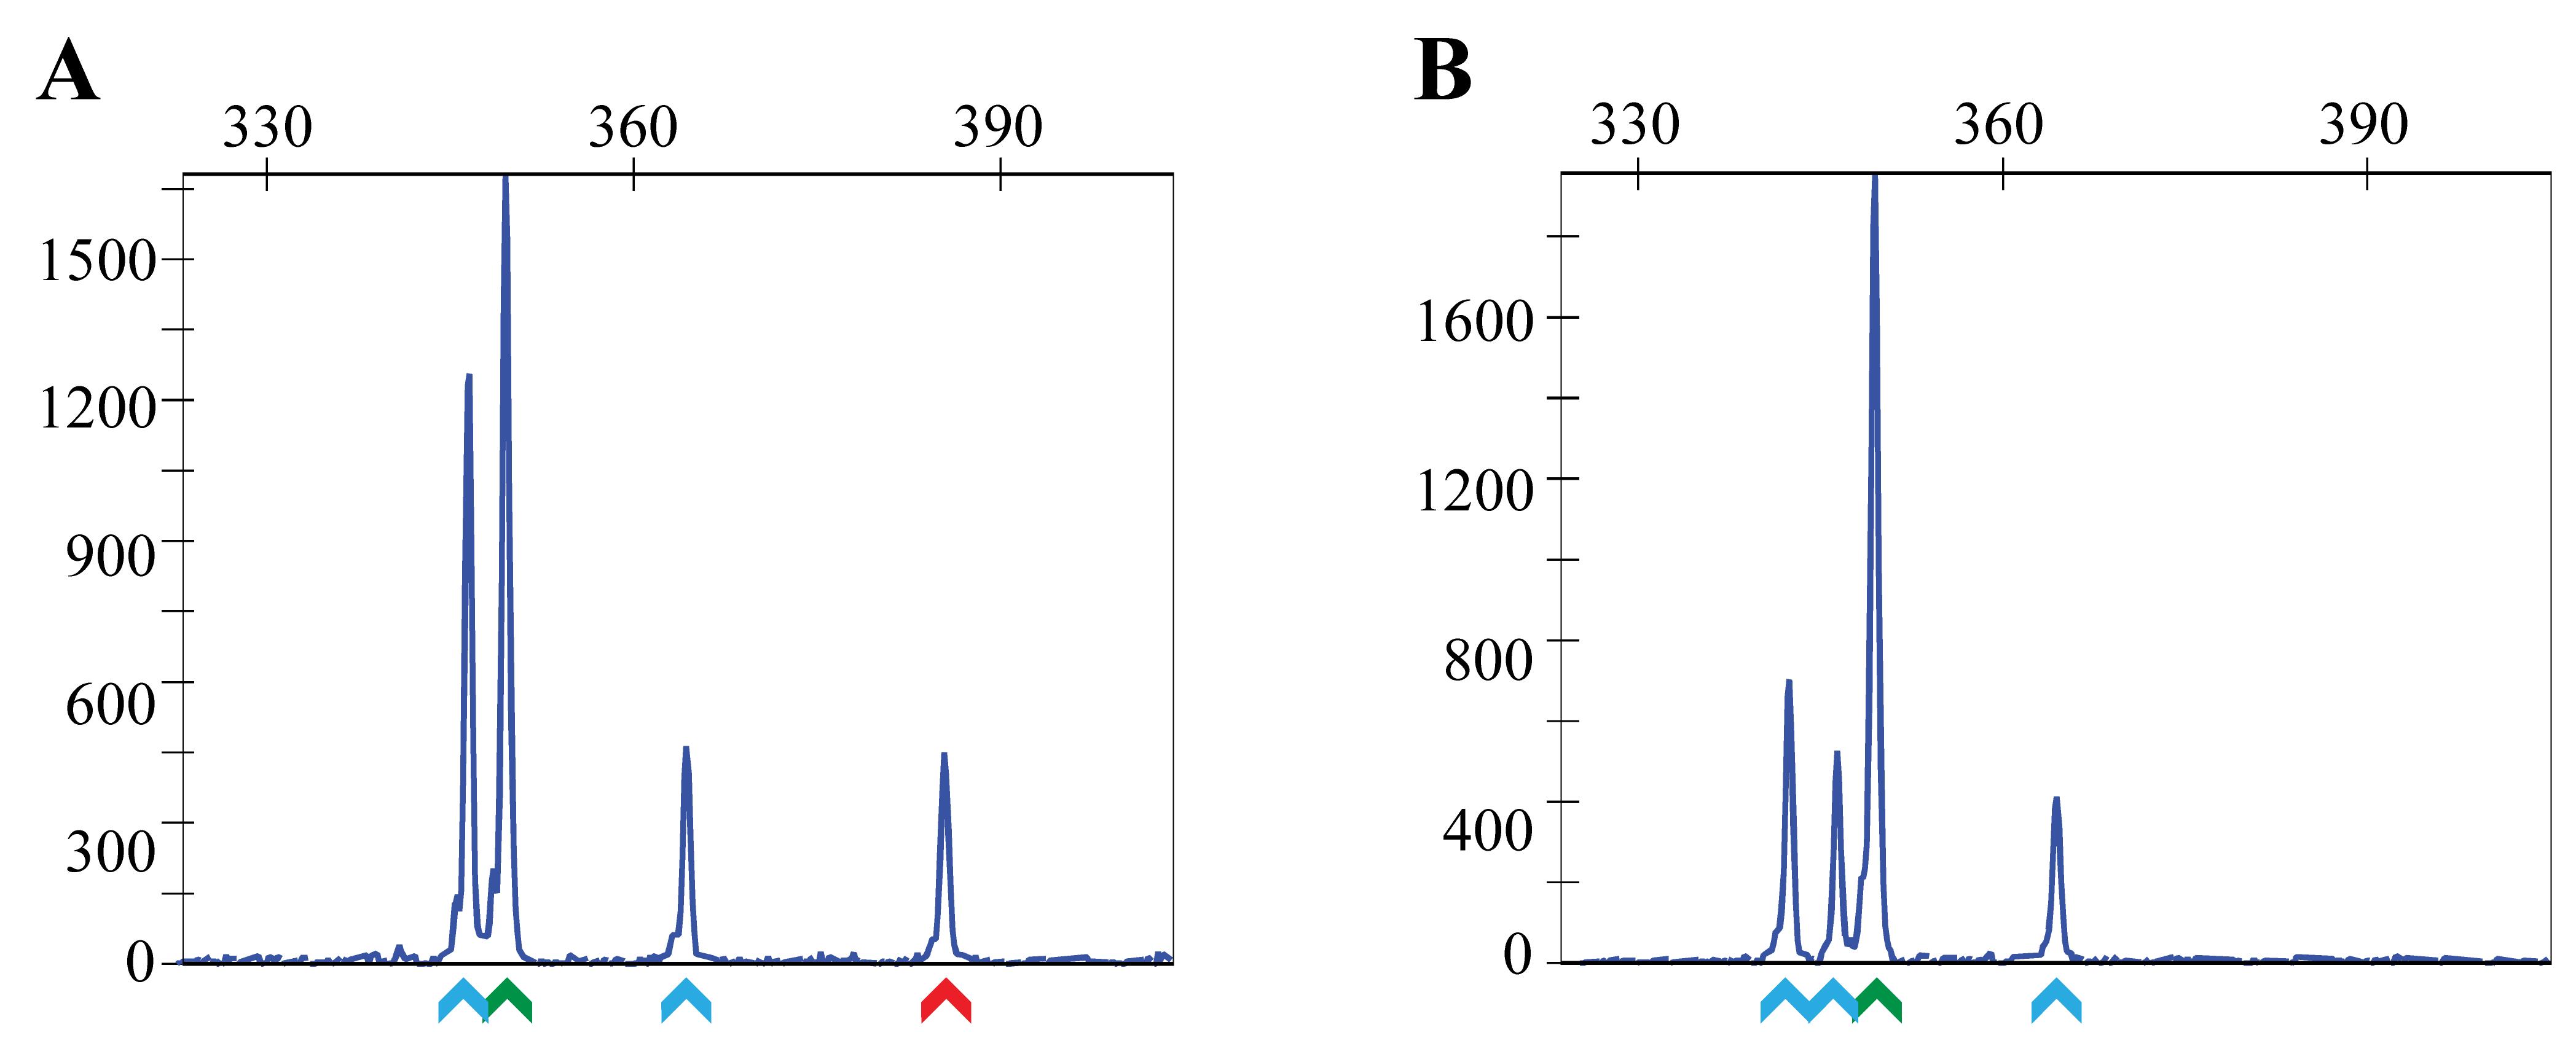
Figure 9. Examples of fluorescent PCR plots from pooled embryo screening to identify germline transmitting founders. Each embryo has a WT allele from the WT parent and an unknown allele (could be WT, indel, or knock-in) from the founder fish. Thus, a robust WT peak (denoted by green arrow) is detected in all pools with up to three additional peaks of unknown sizes. (A) Example of a positive pool with one embryo heterozygous for the knock-in allele (denoted by red arrow). Other peaks in this sample (denoted by the blue arrows) are random indels generated by NHEJ. (B) Example of a negative sample where all embryos are heterozygous for random indels (denoted by blue arrows). The x-axis shows the size of the peaks (bp), and the y-axis shows fluorescent intensity.
C3. Confirmation by screening individual embryos
At 1–5 dpf, collect 48 embryos (one embryo per well) in a 96-well plate from founders positive for germline transmission of knock-in peak in pooled embryo screening. This may require crossing the fish again and collecting a new clutch of embryos.
Extract DNA, perform fluorescent PCR, and run samples as described in section C1, steps 2–15. For point mutations, also perform restriction digest as described in section B2, steps 3–7.
Analyze data using the GeneMapper Software package to determine if any samples have the expected knock-in allele.
Note: Positive knock-in plots will have two peaks that represent the WT and knock-in allele. Examples can be seen in Carrington et al. (2022) in Figures 4, S2, and S5.
Verify precise knock-in by Sanger sequencing of positive samples and aligning reads to a reference knock-in DNA fragment.
Outcross germline transmitting founders with WT fish and grow progeny to adulthood.
Fin clip F1 fish as adults and extract DNA, perform fluorescent PCR, and run samples as described in section C1, steps 2–15. For point mutations, also perform restriction digest as described in section B2, steps 3–7.
Analyze data in GeneMapper software and determine samples with the knock-in allele.
Verify precise knock-in by Sanger sequencing and aligning reads to a reference knock-in DNA fragment.
Note: It is recommended that all F1 fish are sequence confirmed to ensure all fish have precise knock-in at both ends.
F1 fish can be incrossed for subsequent experiments or phenotyping.
Data analysis
CRISPR-STAT plots and sequence chromatograms are the two main types of data generated during this procedure that require further analysis. CRISPR-STAT plots are generated and analyzed using 3730xl Data Collection software or its equivalent if a different capillary electrophoresis machine is used. The plots show peaks corresponding to all fragments present in an amplicon by their size (bp) along the x-axis and relative amount as fluorescence intensity along the y-axis. For sgRNA evaluation, peaks are analyzed for a decrease in the intensity of the WT peak with simultaneous presence of additional peaks indicating the sgRNA is active (Figure 3). For somatic and pooled embryo screening, plots are analyzed for the presence of a peak at the expected size of the knock-in allele (Figures 8 and 9). Using these methods, we screen embryos injected with CRISPR/Cas9 alone as control to determine the likelihood of random insertions leading to the same size peak as the expected peak with precise insertion of the repair template. An enrichment of samples with the expected size peak in the presence of repair template indicates successful knock-in. Sequence chromatograms are generated during confirmation of somatic knock-in by Sanger sequencing of TOPO clones from the positive sample, and germline knock-in by Sanger sequencing of heterozygous F1 embryos or adults for establishing stable lines. Sequencher or any equivalent software can be used to align sequence chromatograms with the reference sequence of the amplicon. For sequence data from somatic knock-in samples, three types of clones can be identified: 1) clones with an exact match to the WT sequence; 2) clones with random indels; 3) clones with precise knock-in. Determine the number of each type of clones to estimate the knock-in efficiency. Sequence chromatograms from heterozygous F1 samples can be analyzed either manually using Sequencher or by online tools, such as Poly Peak Parser (Hill et al., 2014) or CRISP-ID (Dehairs et al., 2016).
Validation of protocol
We and others have successfully used the protocols described here for sgRNA and SpCas9 synthesis, injections, evaluation of sgRNA activity by CRISPR-STAT, and genotyping of CRISPR/Cas9-mediated indels by fluorescent PCR for generation of gene knockouts (Varshney et al., 2016; Ramanagoudr-Bhojappa et al., 2018; Hoshijima et al., 2019; Pillay et al., 2022). The screening strategy for somatic knock-in in injected embryos using CRISPR-STAT with or without restriction digest has been validated by generation of fish lines with in-frame epitope tag insertions in two genes and a single nucleotide substitution leading to the patient-specific point mutation in one gene (Carrington et al., 2022).
General notes and troubleshooting
General notes
This protocol is designed and written for use with sgRNAs that can be synthesized with a T7 promoter (guide sequence begins with a “GG”). Alternate protocols for sgRNA synthesis, commercially available guides, and alternatives to Cas9 mRNA such as commercially available recombinant protein are also acceptable for use, as the only requirement is that the sgRNA/Cas9 should efficiently generate a DSB near the intended knock-in site. In addition, this protocol describes the use of the Sigma Extract-N-Amp kit for DNA extraction from zebrafish embryos and fin biopsies. However, cheaper and alternative DNA extraction methods, such as the HotSHOT method (Meeker et al., 2007), can be used as long as the dilution factor is adjusted to ensure robust PCR amplification of the target loci.
As with all genome editing using CRISPR/Cas9-based methods, selection of active guides that generate a DSB as close to the integration site as possible may be limited due to its sequence constraints. This limitation can be overcome by use of alternate Cas proteins with different PAM requirements, thus expanding the repertoire of sgRNAs. When using alternative Cas proteins such as Cas12a, different size homology arms may be needed (Fernandez et al., 2018); however, the screening can still be performed as described here. Another limitation that is not specific to this protocol is when a targeted gene is necessary for survival. Use of highly active guides to induce DSB often generates biallelic indel mutations, resulting in death of founder fish before they can be screened for germline transmission. This limitation can be overcome by reducing the amount of sgRNA in injection mixtures but may also reduce the knock-in efficiency. Alternatively, Cas9 expression can be targeted to germ cells using Cas9-nanos-3′UTR (Moreno-Mateos et al., 2015; Vejnar et al., 2016) to reduce somatic mutations in the body for increased survival of the injected fish.
The timing for each section in this protocol is given below:
Design phase
A1. sgRNA/Cas9 design and synthesis (2–3 days)
A2. Injections of sgRNA/Cas9 mRNA for evaluation of sgRNA activity (1 day)
A3. Determine activity of each sgRNA using CRISPR-STAT (1 day)
A4. Design of HDR template and screening primers (1 day)
Somatic screening phase
B1. Injections to deliver sgRNA/Cas9 and HDR template (1 day)
B2. Evaluation of somatic knock-in using CRISPR-STAT (1 day)
B3. Somatic knock-in confirmation by TOPO cloning and sequencing (3–4 days)
Germline screening phase
C1. Prioritization of founders to screen (1 day*)
C2. Screening prioritized founder fish by pooled embryos (4–5 days)
C3. Confirmation by screening individual embryos (4–5 days)
C3. Establish stable lines (4–5 days*)
*Does not include three months to grow embryos to adults.
Troubleshooting
For successful use of our screening methods, robust amplification of the target region by fluorescent PCR is very important. Therefore, always test fluorescent PCR primers on a few WT samples. If no peak is observed, run PCR products on a gel to ensure amplification. If there is no amplification, test alternate PCR conditions depending upon the annealing temperature of the primers or redesign primers. If multiple peaks are observed, sequence PCR products to identify endogenous indels and design new primers to avoid indels or use a cohort of fish with identical sequences of the target region for all experiments.
Acknowledgments
This research was funded by the Intramural Research Program of the National Human Genome Research Institute, National Institutes of Health (ZIC HG200351). This protocol is associated with Carrington et al. (2022).
Competing interests
The authors declare no competing interests.
Ethical considerations
All zebrafish experiments were performed in compliance with the National Institutes of Health guidelines for animal handling and research under NHGRI Animal Care and Use Committee (ACUC) approved protocol G-05-5.
References
- Armstrong, G. A., Liao, M., You, Z., Lissouba, A., Chen, B. E. and Drapeau, P. (2016). Homology Directed Knockin of Point Mutations in the Zebrafish tardbp and fus Genes in ALS Using the CRISPR/Cas9 System. PLoS One 11(3): e0150188.
- Bedell, V. M., Wang, Y., Campbell, J. M., Poshusta, T. L., Starker, C. G., Krug, R. G., 2nd, Tan, W., Penheiter, S. G., Ma, A. C., Leung, A. Y., et al. (2012). In vivo genome editing using a high-efficiency TALEN system. Nature 491(7422): 114-118.
- Burg, L., Palmer, N., Kikhi, K., Miroshnik, E. S., Rueckert, H., Gaddy, E., MacPherson Cunningham, C., Mattonet, K., Lai, S. L., Marín-Juez, R., et al. (2018). Conditional mutagenesis by oligonucleotide-mediated integration of loxP sites in zebrafish. PLoS Genet 14(11): e1007754.
- Carrington, B., Ramanagoudr-Bhojappa, R., Bresciani, E., Han, T. U. and Sood, R. (2022). A robust pipeline for efficient knock-in of point mutations and epitope tags in zebrafish using fluorescent PCR based screening. BMC Genomics 23(1): 810.
- Carrington, B., Varshney, G. K., Burgess, S. M. and Sood, R. (2015). CRISPR-STAT: an easy and reliable PCR-based method to evaluate target-specific sgRNA activity. Nucleic Acids Res 43(22): e157.
- de Vrieze, E., de Bruijn, S. E., Reurink, J., Broekman, S., van de Riet, V., Aben, M., Kremer, H. and van Wijk, E. (2021). Efficient Generation of Knock-In Zebrafish Models for Inherited Disorders Using CRISPR-Cas9 Ribonucleoprotein Complexes. Int J Mol Sci 22(17): 9429.
- Dehairs, J., Talebi, A., Cherifi, Y. and Swinnen, J. V. (2016). CRISP-ID: decoding CRISPR mediated indels by Sanger sequencing. Sci Rep 6: 28973.
- Fernandez, J. P., Vejnar, C. E., Giraldez, A. J., Rouet, R. and Moreno-Mateos, M. A. (2018). Optimized CRISPR-Cpf1 system for genome editing in zebrafish. Methods 150: 11-18.
- Hill, J. T., Demarest, B. L., Bisgrove, B. W., Su, Y. C., Smith, M. and Yost, H. J. (2014). Poly peak parser: Method and software for identification of unknown indels using sanger sequencing of polymerase chain reaction products. Dev Dyn 243(12): 1632-1636.
- Hoshijima, K., Jurynec, M. J., Klatt Shaw, D., Jacobi, A. M., Behlke, M. A. and Grunwald, D. J. (2019). Highly Efficient CRISPR-Cas9-Based Methods for Generating Deletion Mutations and F0 Embryos that Lack Gene Function in Zebrafish. Dev Cell 51(5): 645-657.e4.
- Meeker, N. D., Hutchinson, S. A., Ho, L. and Trede, N. S. (2007). Method for isolation of PCR-ready genomic DNA from zebrafish tissues. Biotechniques 43(5): 610, 612, 614.
- Moreno-Mateos, M. A., Vejnar, C. E., Beaudoin, J. D., Fernandez, J. P., Mis, E. K., Khokha, M. K. and Giraldez, A. J. (2015). CRISPRscan: designing highly efficient sgRNAs for CRISPR-Cas9 targeting in vivo. Nat Methods 12(10): 982-988.
- Pillay, L. M., Yano, J. J., Davis, A. E., Butler, M. G., Ezeude, M. O., Park, J. S., Barnes, K. A., Reyes, V. L., Castranova, D., Gore, A. V., et al. (2022). In vivo dissection of Rhoa function in vascular development using zebrafish. Angiogenesis 25(3): 411-434.
- Prykhozhij, S. V., Fuller, C., Steele, S. L., Veinotte, C. J., Razaghi, B., Robitaille, J. M., McMaster, C. R., Shlien, A., Malkin, D. and Berman, J. N. (2018). Optimized knock-in of point mutations in zebrafish using CRISPR/Cas9. Nucleic Acids Res 46(17): e102.
- Ramanagoudr-Bhojappa, R., Carrington, B., Ramaswami, M., Bishop, K., Robbins, G. M., Jones, M., Harper, U., Frederickson, S. C., Kimble, D. C., Sood, R., et al. (2018). Multiplexed CRISPR/Cas9-mediated knockout of 19 Fanconi anemia pathway genes in zebrafish revealed their roles in growth, sexual development and fertility. PLoS Genet 14(12): e1007821.
- Richardson, C. D., Ray, G. J., DeWitt, M. A., Curie, G. L. and Corn, J. E. (2016). Enhancing homology-directed genome editing by catalytically active and inactive CRISPR-Cas9 using asymmetric donor DNA. Nat Biotechnol 34(3): 339-344.
- Sieliwonczyk, E., Vandendriessche, B., Claes, C., Mayeur, E., Alaerts, M., Holmgren, P., Canter Cremers, T., Snyders, D., Loeys, B. and Schepers, D. (2023). Improved selection of zebrafish CRISPR editing by early next-generation sequencing based genotyping. Sci Rep 13(1): 1491.
- Varshney, G. K., Carrington, B., Pei, W., Bishop, K., Chen, Z., Fan, C., Xu, L., Jones, M., LaFave, M. C., Ledin, J., et al. (2016). A high-throughput functional genomics workflow based on CRISPR/Cas9-mediated targeted mutagenesis in zebrafish. Nat Protoc 11(12): 2357-2375.
- Vejnar, C. E., Moreno-Mateos, M. A., Cifuentes, D., Bazzini, A. A. and Giraldez, A. J. (2016). Optimized CRISPR-Cas9 System for Genome Editing in Zebrafish. Cold Spring Harb Protoc 2016(10). doi: 10.1101/pdb.prot086850.
- Zhang, Y., Zhang, Z. and Ge, W. (2018). An efficient platform for generating somatic point mutations with germline transmission in the zebrafish by CRISPR/Cas9-mediated gene editing. J Biol Chem 293(17): 6611-6622.
Article Information
Copyright
© 2023 The Author(s); This is an open access article under the CC BY-NC license (https://creativecommons.org/licenses/by-nc/4.0/).
How to cite
Carrington, B. and Sood, R. (2023). Fluorescent PCR–based Screening Methods for Precise Knock-in of Small DNA Fragments and Point Mutations in Zebrafish. Bio-protocol 13(15): e4732. DOI: 10.21769/BioProtoc.4732.
Category
Developmental Biology > Genome editing > Targeted integration
Molecular Biology > DNA > Mutagenesis
Do you have any questions about this protocol?
Post your question to gather feedback from the community. We will also invite the authors of this article to respond.