- Protocols

- Articles and Issues
- For Authors
- About
- Become a Reviewer

Label-free Chemical Characterization of Polarized Immune Cells in vitro and Host Response to Implanted Bio-instructive Polymers in vivo Using 3D OrbiSIMS
Published: Vol 13, Iss 15, Aug 5, 2023 DOI: 10.21769/BioProtoc.4727 Views: 2078
Reviewed by: Aswad KhadilkarNihal Engin VranaVishal Nehru
Original research article
The authors used this protocol in:
Jul 2022

Protocol Collections
Comprehensive collections of detailed, peer-reviewed protocols focusing on specific topics


Related protocols

Abstract
The Three-dimensional OrbiTrap Secondary Ion Mass Spectrometry (3D OrbiSIMS) is a secondary ion mass spectrometry instrument, a combination of a Time of Flight (ToF) instrument with an Orbitrap analyzer. The 3D OrbiSIMS technique is a powerful tool for metabolic profiling in biological samples. This can be achieved at subcellular spatial resolution, high sensitivity, and high mass-resolving power coupled with MS/MS analysis. Characterizing the metabolic signature of macrophage subsets within tissue sections offers great potential to understand the response of the human immune system to implanted biomaterials. Here, we describe a protocol for direct analysis of individual cells after in vitro differentiation of naïve monocytes into M1 and M2 phenotypes using cytokines. As a first step in vivo, we investigate explanted silicon catheter sections as a medical device in a rodent model of foreign body response. Protocols are presented to allow the host response to different immune instructive materials to be compared. The first demonstration of this capability illustrates the great potential of direct cell and tissue section analysis for in situ metabolite profiling to probe functional phenotypes using molecular signatures. Details of the in vitro cell approach, materials, sample preparation, and explant handling are presented, in addition to the data acquisition approaches and the data analysis pipelines required to achieve useful interpretation of these complex spectra. This method is useful for in situ characterization of both in vitro single cells and ex vivo tissue sections. This will aid the understanding of the immune response to medical implants by informing the design of immune-instructive biomaterials with positive interactions. It can also be used to investigate a broad range of other clinically relevant therapeutics and immune dysregulations.
Graphical overview

Background
Mass spectrometry (MS) analysis methods, including liquid chromatography-mass spectrometry (LC–MS) (A. Abuawad et al., 2020), liquid extraction surface analysis mass spectrometry (LESA–MS) (Eikel et al., 2011), matrix-assisted laser desorption/ionization, desorption electrospray ionization, and secondary ion mass spectrometry (SIMS), have been used to detect chemical and biological compounds, such as lipids, amino acids, peptides, and proteins from cells and tissue samples (Rauh, 2012; Cajka and Fiehn, 2014; Passarelli et al., 2017; Kotowska et al., 2020; Meurs et al., 2021). Classes of biomolecules, including proteins, lipids, and metabolites, are vital cellular components that have been characterized and designated to perform specific functions essential to life.
LC–MS-based metabolite analyses typically start with extraction of the metabolites from the biological samples. Analysis of metabolites using LC-MS has been limited because it requires initial liquid extraction procedures and a significant number of cells (1–6 million) to obtain a sufficient signal (Abuawad et al., 2020), leading to a lack of molecular spatial information (Tuli and Ressom, 2009).
The LESA–MS technique is a powerful tool for global, highly sensitive, and multi-analyte analysis ranging from small molecule metabolites to lipids and proteins. This technique has the limitation of involving a solvent-based approach, which allows lipid and small molecule metabolite injection into the analytical instrumentation, as well as poor spatial resolution (~1 mm), rendering single-cell level analysis impossible. For solvent extraction, sample preparation of cells or tissue for metabolomics has a unique protocol for each molecular class. Thus, solvent-extracted metabolites from cells or tissue samples are specific to that extraction protocol (Basu et al., 2018).
SIMS is a direct surface analysis technique that uses a primary ion beam that bombards the surface and generates neutral species and secondary ions (Sigmund, 1969), providing high lateral resolutions of < 100 nm and high surface sensitivity. An electrical field can be used to extract the charge species to obtain mass spectra, using the ion flight times, ion images, and depth profiles in both 2D and 3D (Walker, 2017). SIMS surface analysis has also been established for the quantification of small molecules in biological samples, such as cells and tissue samples.
Time-of-flight secondary ion MS (ToF–SIMS) is a surface analysis technique (Denbigh and Lockyer, 2015; Yoon and Lee, 2018) that provides information-rich mass, depth, and spatial resolution, along with chemical sensitivity. However, ToF–SIMS has insufficient mass accuracy and low mass resolving power for metabolite identification (Green et al., 2011; Shon et al., 2016). To overcome the pitfalls of low mass resolving power and accuracy, the 3D OrbiSIMS technique was developed, which utilizes the SIMS principle with a high mass resolving power (> 240,000 at m/z 200) and accuracy (< 2 ppm), along with the MS/MS capabilities of the OrbiTrapTM mass analyzer (Passarelli et al., 2017).
Recently, the capabilities of the 3D OrbiSIMS instrument as a new means to assess the metabolomic profiles of biological samples have been investigated. For example, Kotowska et al. (2020) used 3D OrbiSIMS imaging and depth profiling to observe a protein monolayer biochip and the depth distribution of proteins in human skin. The platform has also proved its ability to identify metabolite profiling in macrophages treated with different concentrations of the drug amiodarone (Passarelli et al., 2017). Similarly, Suvannapruk et al. (2022) used the novel technique for metabolite identification in individual cells of macrophage subsets. This method of analysis is vital for gaining new insight into metabolomic processes for identifying the metabolites of biological samples.
The development of materials with cell-instructive properties could provide an effective biomaterial-based strategy for modulating cell behavior, to minimize adverse immune responses. Rostam et al. reported that changing the surface topography and chemistry of materials can impact macrophage adhesion and polarization (H. M. Rostam et al., 2015; Hassan M. Rostam et al., 2020). In this paper, we describe for the first time the development of a 3D OrbiSIMS methodology to investigate metabolic changes derived from single anti- and pro-inflammatory macrophages in vitro. We also compare this to metabolic profiles from in vivo anti- and pro-inflammatory macrophages generated at the site of a foreign body response in a mouse model, following exposure to a catheter section coated in known macrophage-instructive surface chemistries. This method aims to directly analyse the metabolic profiles of macrophage phenotypes from in vitro and in vivo studies, with minimal sample preparation steps.
Materials and reagents
Cell culture
T75 flask (Corning 43064, catalog number: 10492371)
50 mL Falcon tube (Sigma-Aldrich, catalog number: T2318)
Pipette tips of various volumes (Fisher Scientific, catalog number: 02-707-401)
Nylon syringe filter 0.22 μm, 25 mm (Minisart®, catalog number: 17845)
Bijou tubes (Thermo Fisher Scientific, catalog number: 129B)
LS columns (Miltenyi Biotech, catalog number: 130-042-401)
Round glass slides (VWR, catalog number: 631-0149)
Glass slides (VWR, catalog number: 631-1553)
24-well plates, uncoated (CytoOne, catalog number: cc77672-7524)
Tissue-Tek Cryomold Moulds (Agar Scientific, catalog number: AGG4580)
Buffy coats from healthy volunteers provided by National Blood Services, Sheffield United Kingdom, after obtaining informed consent and following institutional ethics approval (Research Ethics Committee, Faculty of Medicine and Health Sciences, University of Nottingham; FMHS 425-1221)
Histopaque (Sigma-Aldrich, catalog number: 11191)
Phosphate buffered saline (PBS) (Sigma-Aldrich, catalog number: D8537)
MidiMACSTM separator (Miltenyi Biotech, catalog number: 130-042-302)
MACS® multiStand (Miltenyi Biotech, catalog number: 130-042-303)
CD14 microbeads (Miltenyi Biotech, catalog number: 130-050-201)
Ficoll (Cytiva, catalog number: 1754402)
RPMI 1640 medium (Sigma-Aldrich, catalog number: R0883)
Fetal bovine serum (FBS) (Sigma-Aldrich, catalog number: F9665)
L-glutamine (Sigma-Aldrich, catalog number: G7513)
Penicillin-streptomycin (Sigma-Aldrich, catalog number: P0781)
Interferon gamma, IFN-γ (Bio Techne, catalog number: 285-IF-100)
Granulocyte-macrophage colony-stimulating factor (GM-CSF) (Miltenyi Biotech, catalog number: 130-093-868)
Interleukin 4 (IL-4) (Miltenyi Biotech, catalog number: 130-093-919)
Macrophage colony-stimulating factor (M-CSF) (Miltenyi Biotech, catalog number: 130-096-493)
70% alcohol (any vendor)
Optimal cutting temperature compound (OCT) (Agar Scientific, catalog number: AGR1180)
Copolymer synthesis
Poly(cyclohexyl methacrylate-co-dimethylamino-ethyl methacrylate) (CHMA-DMAEMA), pro-inflammatory macrophage (M1-like)
Poly(cyclohexyl methacrylate-co-isodecyl methacrylate) (CHMA-iDMA), anti-inflammatory macrophage (M2-like)
Liquid nitrogen
Ammonium formate (Sigma-Aldrich, catalog number: 70221)
150 mM Ammonium formate (see Recipes)
MACS buffer (see Recipes)
Animal study
Clinical-grade silicon catheter 13 mm diameter (Teleflex Medical, catalog number: RUSCH170003)
Polymer synthesis
Dichloromethane (any vendor)
MED1-161 SILICONE PRIMER (Nusil)
Female BALB/c strain 19–22 g mice (Charles River)
Equipment
Stripette (Greiner Bio-One, catalog number: 760160)
Stripette gun (any vendor)
Micropipette (any vendor)
Forceps (any vendor)
Cell culture hood, class II (any vendor)
Scissors (any vendor)
Water bath (any vendor)
Centrifuge (any vender)
Automated cell counter (any vendor)
Cell culture incubator (SANYO, model: MC0-18A1C)
UV Clave (any vendor)
Refrigerator (4 °C) (any vendor)
Freezer (-80 °C) (SANYO, model: MDF-C8V1)
Cryostat CM3050 (Leica Microsystems)
Freeze dryer (any vendor)
Dip coating unit (Holmarc, model: HO-TH-01)
Vacuum oven (Thermo Fisher Scientific)
3D OrbiSIMS (IONTOF GmbH, Germany and Thermo Fisher Scientific, Germany)
Software
SurfaceLab software version 7.1 (ION-TOF, Germany), which utilizes the Thermo Fisher provided application programming interface
LIPID MAPS software (https://www.lipidmaps.org)
Procedure
Considerations before starting
Peripheral blood monocytic cells (PBMCs) isolation
PBMCs are isolated from healthy blood donor buffy coats. Here, we isolated the monocytes that were used to generate macrophages.
Macrophage polarization
Macrophages play a critical role in the modulation of the immune response. Macrophages have a spectrum of functional phenotypes that is determined by the nature of stimuli they encounter. At either ends of this spectrum there are pro-inflammatory (M1) and anti-inflammatory (M2) macrophages. In vitro, monocytes can be polarized towards M1 and M2 phenotypes using different cytokine cocktails. Here, we investigated and compared the relationship between M1 and M2 macrophage activation methods in human primary monocyte–derived macrophages, using cytokines.
Implant sample preparation for in vivo studies
In a previous work, Rostam et al. (2020) identified polymers with immune-modulatory properties, in particular their ability to induce M1- and M2-like phenotypes in macrophages in vitro and in vivo. In this study, we coated silicon catheter segments (dimensions 2.7 mm, 5 cm length) with immune-instructive copolymers discovered in the Rostam et al. (2020) article to assess their ability to modulate macrophage phenotypes in a mouse model of foreign body response.
Ex vivo tissue sample preparation for 3D OrbiSIMS
We prepared fresh tissue sections for 3D OrbiSIMS analysis to characterize metabolomic profiling of phospholipids in tissue section samples. After 28 days of implantation, the catheter and surrounding skin segment were embedded in OCT and sectioned by cryostat.
Preparation of PBMC isolation
Arrange equipment (Figure 1A).
Place a bottle of PBS in a 37 °C water bath.
Spray the blood bag (50 mL) with 70% ethanol and place it inside the hood.
Cut the blood bag and place it into a T75 flask (Figure 1B).
Top up prewarmed PBS into a T75 flask to a final volume of 150 mL.
Gently shake the flask to mix the blood and PBS.
Add 15 mL of Ficoll into each of the four Falcon tubes (50 mL Falcon tube).
Transfer 25 mL of the blood–PBS mixture into the Falcon tubes containing Ficoll using a stripette. Angle the Falcon tube to ~45–60° and ensure the blood does not mix with the Ficoll (distinct layers are required).
Centrifuge at 1 (acceleration/deceleration) and 800× g for 30 min at room temperature (Figure 1C).
Use a stripette to remove the plasma and platelet layer (top layer).
Use a Pasteur pipette to collect the white PBMC layer from the four Falcon tubes into two new Falcon tubes.
Wash the aspirated PBMCs by adding PBS to a final volume of 50 mL.
Centrifuge at 3 (acceleration/deceleration) and 300× g for 10 min at room temperature.
After centrifugation, use a stripette to aspirate off the supernatant, leaving behind two loose pellets.
Resuspend one of the pellets in a small volume of PBS and then combine with the second pellet.
Gently pipette up and down to reduce clumping.
Wash the aspirated PBMCs again by adding PBS up to a final volume of 50 mL.
Centrifuge at 3 (acceleration/deceleration) and 200× g for 10 min at room temperature.
Aspirate off the supernatant.
Resuspend the cell pellet in PBS.
Centrifuge at 3 (acceleration/deceleration) and 350× g for 5 min at room temperature; then, aspirate the supernatant.
Prepare the MACS buffer (see Recipes).
The cells need to be resuspended and incubated with CD14+ beads. The volume of beads required depends on the required number of cells. For example, use 250 μL of beads if less than 1 × 10⁸ cells are required, and up to 500 μL of beads if more are required.
Resuspend the cell pellet in MACS buffer (375 μL, when 3 mL of MACS buffer is used).
Add the corresponding volume of CD14+ beads (375 μL, when 3 mL of MACS buffer is used).
Mix well and incubate the cells covered with foil at 4 °C for 20 min.
Add MACS buffer into the cell suspension to a final volume of 20 mL.
Centrifuge at 3 (acceleration/deceleration) and 350× g for 5 min at room temperature.
Aspirate off the supernatant and resuspend the resulting pellet in 4 mL of MACS buffer.
Prepare the MACS columns in the hood, including a black magnet holder, purple magnets, yellow filters, MS columns, and bijou tubes (Figure 1D).
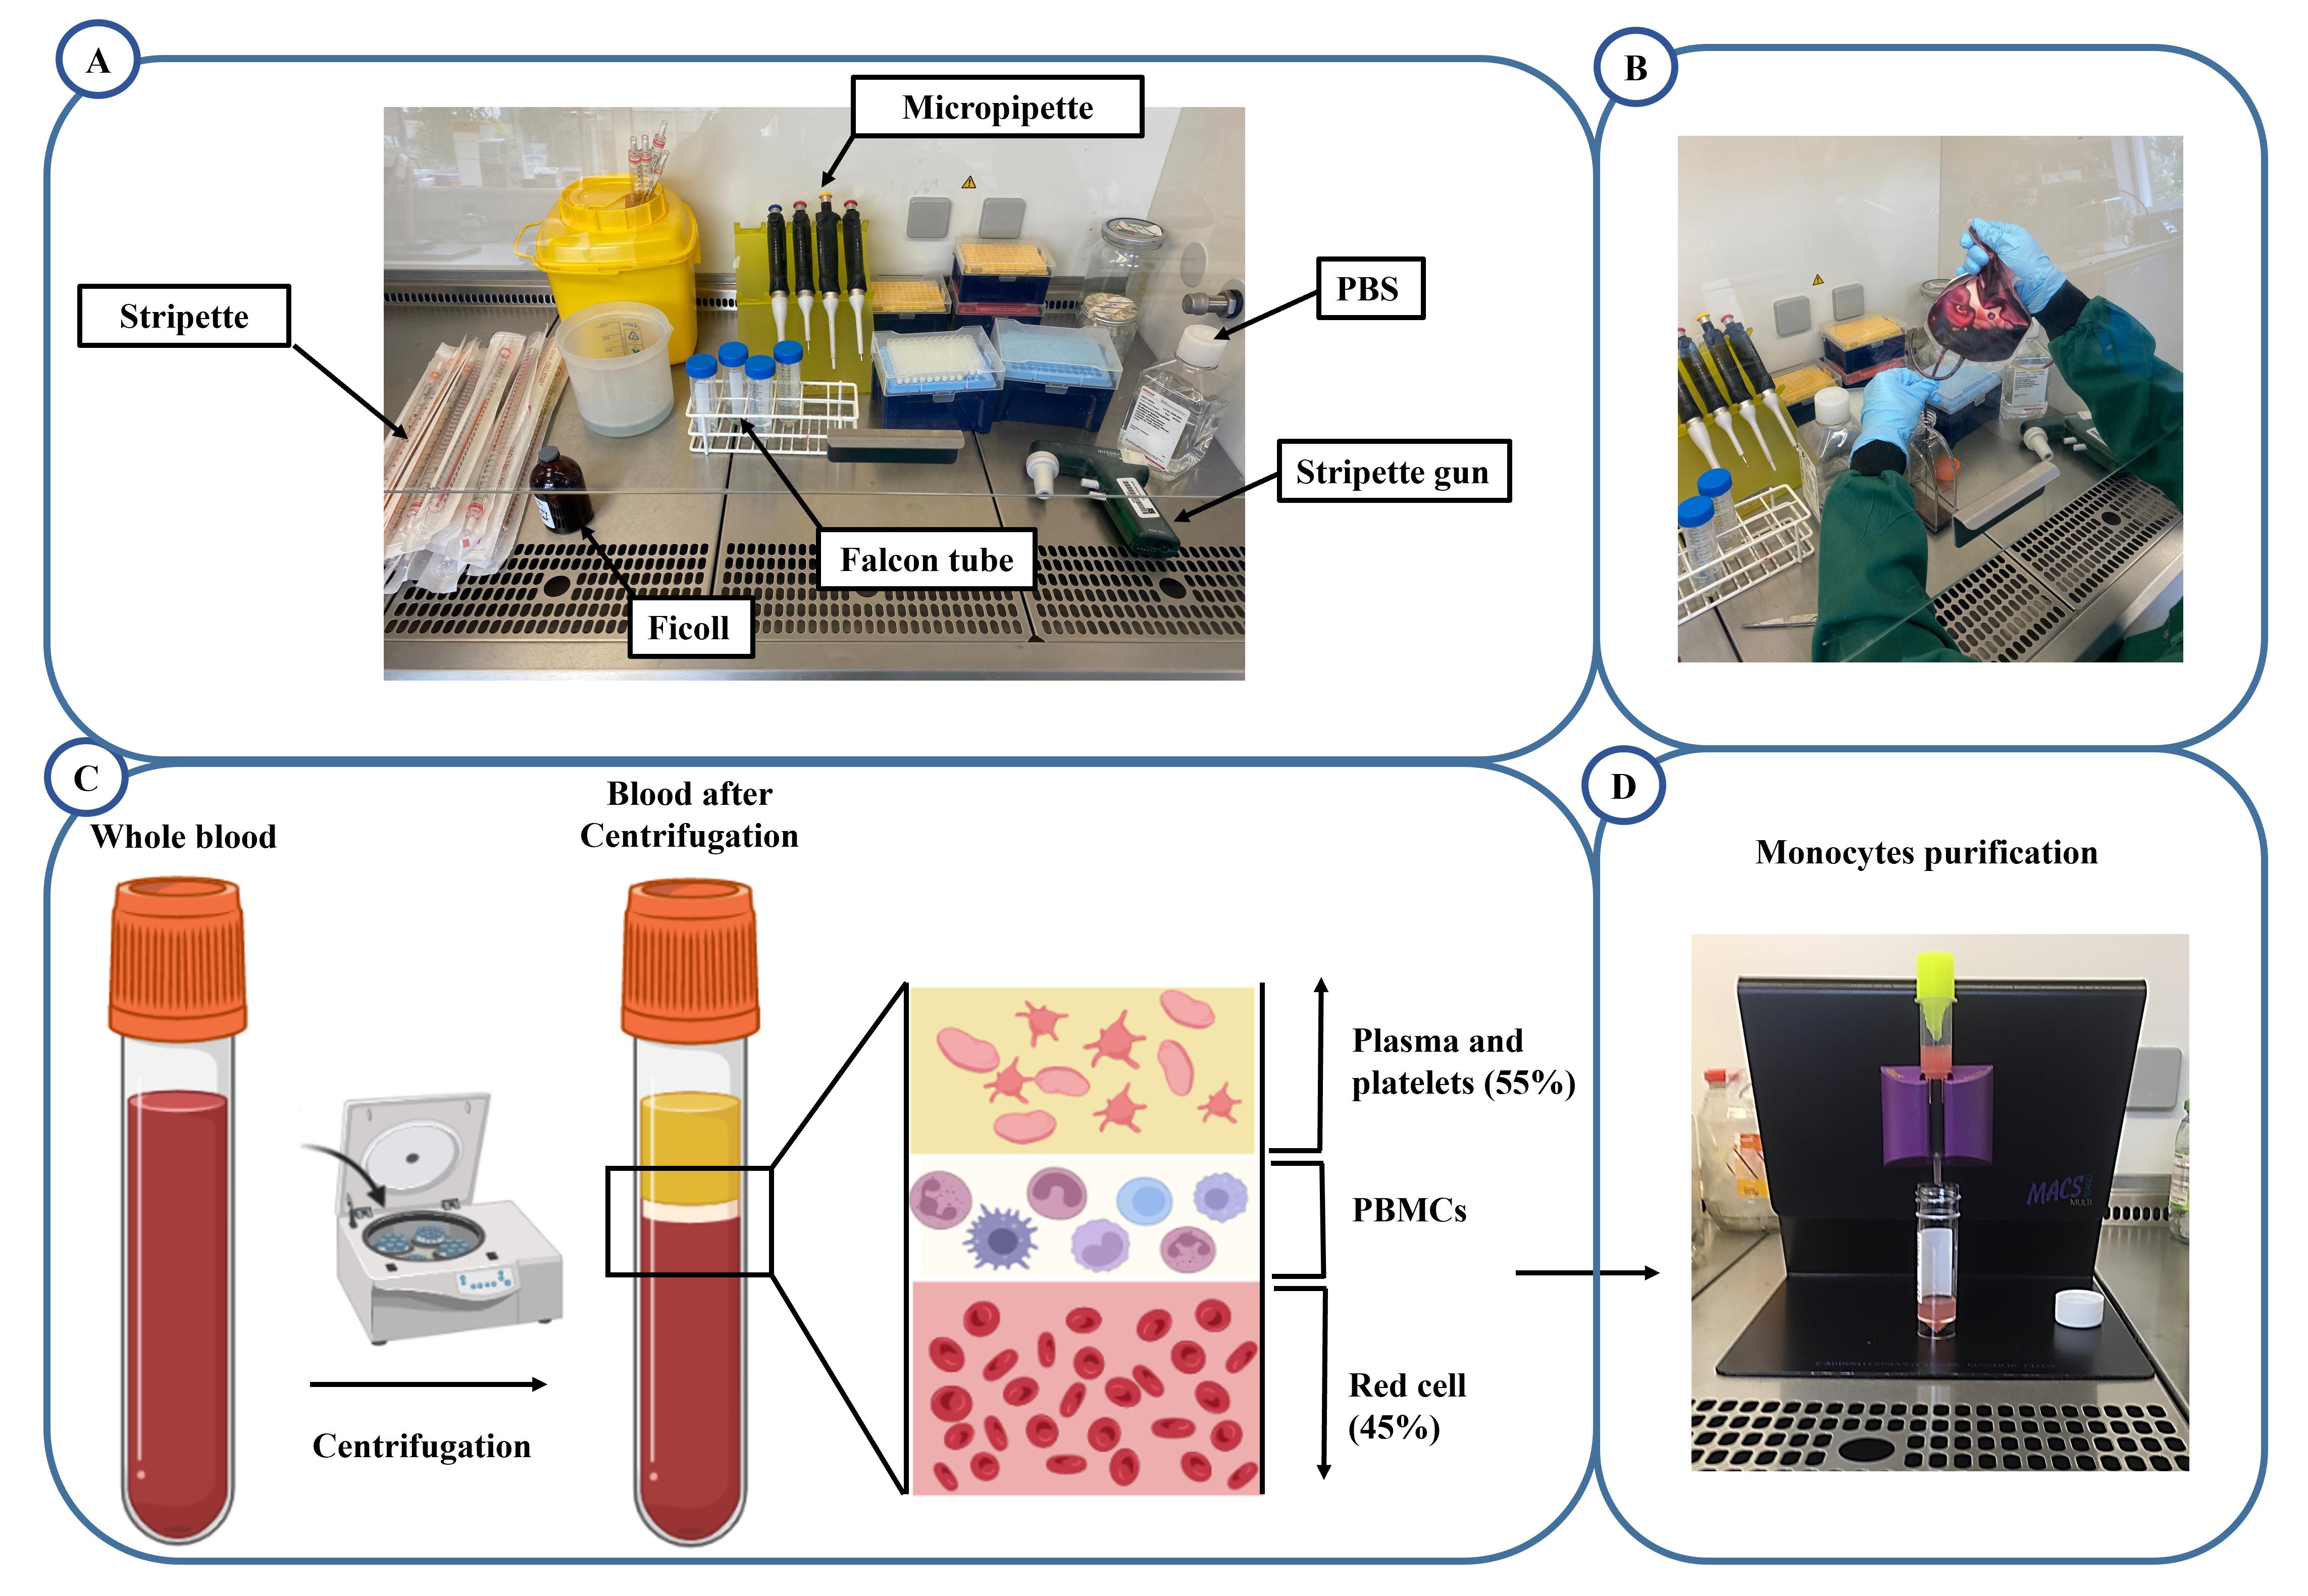
Figure 1. Processing of peripheral blood mononuclear cells (PBMC) isolation. A. Materials and reagents for PBMC isolation. B. Transfer of buffy coat into T75 flask. C. Separation of whole blood components after centrifugation into discrete layers; plasma and platelets (top yellow layer), PBMCs (middle white layer), and erythrocytes (bottom red layer). D. MACS columns for magnetic cell isolation.Wash the columns through with 3 mL of MACS buffer each, before adding the cell suspension.
Slowly pipette the cell suspension through the columns.
Once the cells have been added, complete three wash steps using 3 mL of MACS buffer each.
To remove the cells bound to the column, detach the column from the magnet.
Add 2 mL of MACS buffer and then use the syringe component to push the cells out into a Falcon tube.
Count the cells using trypan blue, by diluting a small volume of the cell suspension 1:20 before counting.
Note: Work in a sterile environment; all materials should be sterile. Do not pour off the supernatant; always use a stripette to remove the plasma layer (top layer), to not dislodge the PBMCs layer.
Macrophage polarization using polymers
Coat a round coverslip with 200 μL of poly-lysine to promote cell attachment.
Place the coated coverslips into 24-well plates.
Make up the complete RPMI 1640 medium (see Recipes) and seed 1 × 10⁵ isolated monocytes. Place monocytes onto the coated coverslips.
Add the different cytokines to the monocytes to generate different macrophage phenotypes:
Naïve macrophages: add complete RPMI supplemented with 10 ng of M-CSF.
M1 macrophage: add complete RPMI supplemented with 50 ng of GM-CSF and 20 ng of IFN-γ.
M2 macrophage: add complete RPMI supplemented with 50 ng of M-CSF and 20 ng of IL-4.
Incubate the cells in a humidified atmosphere of 5% CO2 at 37 °C.
On day 3 of incubation, remove 500 μL of media from each well and replace with fresh medium containing the same concentration and mix of cytokines as on day 0.
On day 6 of incubation, remove all supernatants.
Wash the cells on the coverslips with 1 mL of 150 mM ammonium formate solution three times for 30 s each to remove salts that cause unwanted signal suppression in the SIMS instrument.
Plunge the cell samples into liquid nitrogen.
Freeze-dry the samples:
Switch on power at the rear to cool the chamber (-50 °C). This step should take approximately 1 h.
When the chamber is at the required temperature, place the samples onto the shelves and close the lid.
Turn the vacuum pump on (the vacuum should be below 26.6 Pa).
Freeze-dry samples over a period of 12 h to remove water.
Collect the samples and store them in a sealed container at -80 °C until 3D OrbiSIMS analysis.
Note: We use uncoated tissue culture 24-well plates to promote cell attachment on the glass coverslip. Personal protective equipment must be worn, including protective gloves specifically designed for cryogenic handling, a closed lab coat, a face shield, and shoes when working with liquid nitrogen. Cytokines are purchased in powder form, reconstituted in stock solution, and stored at -80 °C.
Implant sample preparation for in vivo studies
Clinical-grade silicon catheters with a 2.7 mm diameter are cut to a length of 5 mm (Figure 2A and 2B).
Pierce the catheter wall with microlance needles and clamp it in a dip coating unit (Figure 2C).
Dip the catheter into Nusil MED1-161 silicone primer, using the dip coater at a dipping and withdrawing rate of 1 mm/s and a dwell time of 30 s.
Keep the catheter dry at room temperature for 2 min.
Make up the copolymer synthesis solution (see Recipes).
Coat the MED1-161 coated catheter dip into the copolymer solution using the dip coater, with a dipping and withdrawing rate of 1 mm/s and dwell time of 30 s twice. (Figure 2C).
Dry the catheter at room temperature overnight, then dry it in a vacuum at 50 °C for seven days to remove the solvent. The coated catheter segments are shown in Figure 2D.
Note: It is necessary to dry the catheter well after coating with the copolymer. The coated catheter sample should be kept at room temperature overnight, because placing it directly in the vacuum may cause popping bubbles or otherwise damage the smooth catheter surface.
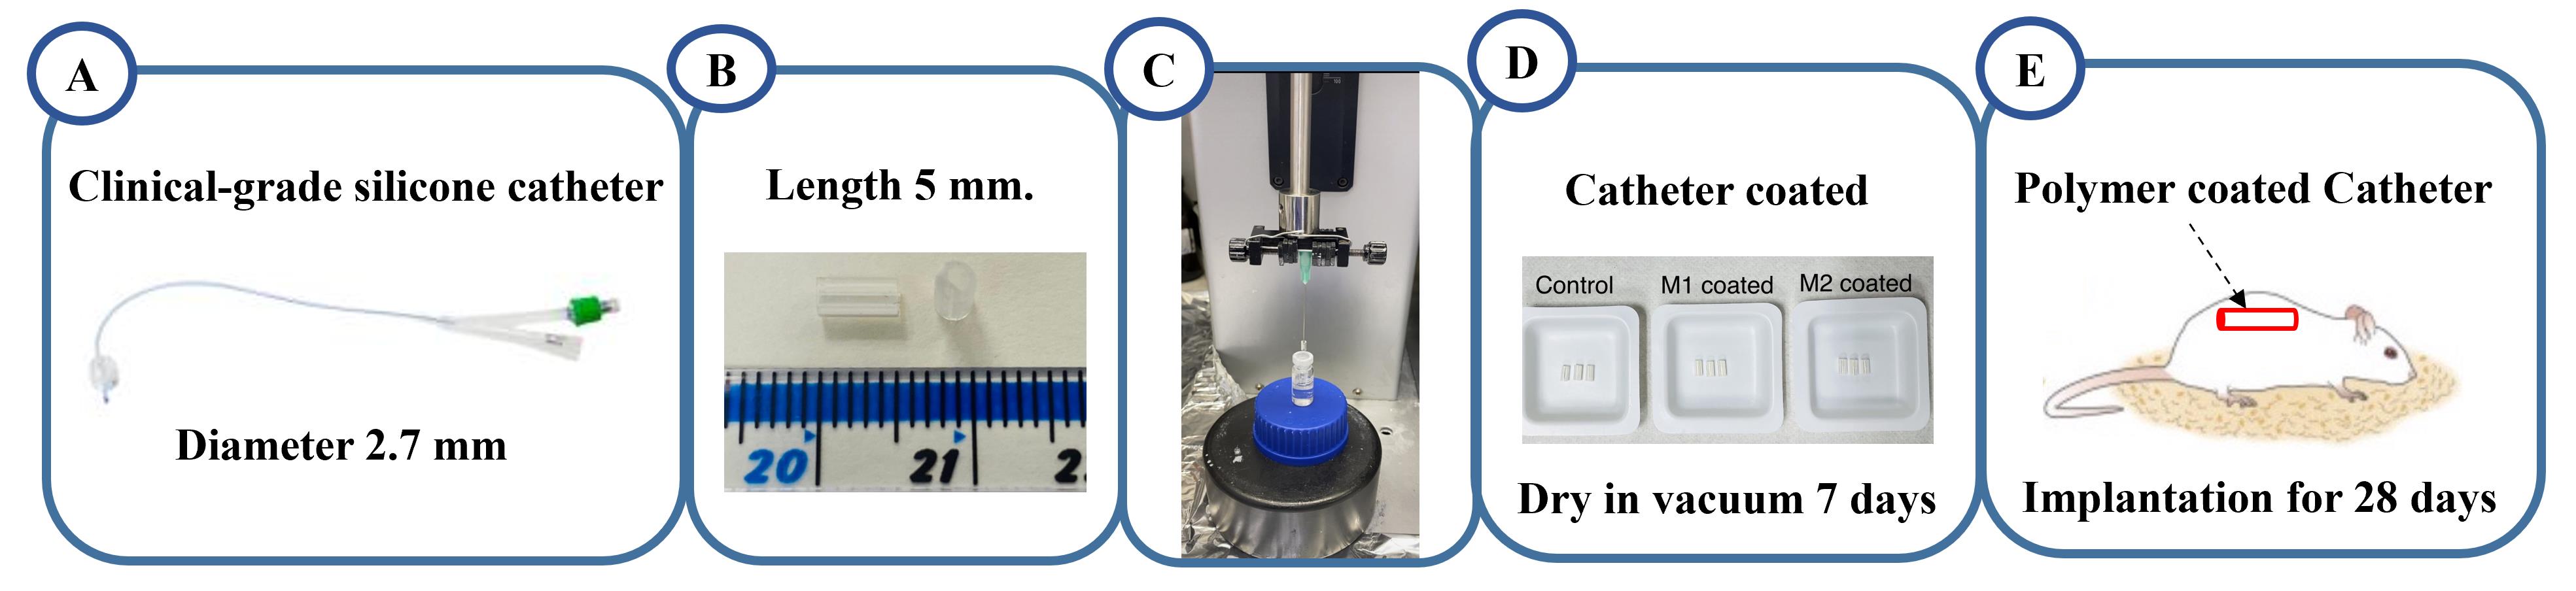
Figure 2. Schematic workflow of a catheter coated with copolymer for in-vivo study. A. Clinical-grade silicone catheter. B. The catheters were cut to a length of 5 mm. C. Coating of catheter segments in immune instructive chemistries using dip coating. D. Catheter coated sample. E. Coated catheter segments are implanted in mice for 28 days.In vivo study
In vivo studies are approved by the University of Nottingham Animal Welfare and Ethical Review Board and carried out in accordance with Home Office authorization under project license number PP5768261. Female BALB/c 19–22 g mice were used in these studies. Mice are housed in individually ventilated cages (IVCs) under a 12 h light cycle, with ad libitum access to food and water. The weight and clinical condition of the mice are monitored daily. Silicone catheter segments coated with synthesized polymers are sterilized by UV light for a period of 20 min.
Implant the catheters subcutaneously into mice for 28 days. Catheters without a coating are used as a control (Figure 2E).
Administer Carprofen 5 mg/kg subcutaneously in a single dose 1 h prior to surgery.
Anesthetize mice using 2% isoflurane. Shave an area on their flank and clean it using hydrex skin cleaner.
Insert the catheter subcutaneously using a trocar needle and displace it 1 cm from the insertion site.
Use gluture skin adhesive to seal the insertion site and allow the animal to recover.
At the end of study (day 28), mice are humanely sacrificed by CO2 euthanasia.
Dissect the tissue and catheter implantation site, extending 2 cm from the catheter center into the surrounding tissue.
Ex vivo tissue sample preparation for 3D OrbiSIMS
Prepare the catheter segment and surrounding skin for 3D OrbiSIMS analysis.
Cut the 5.5 cm × 5.5 cm fresh tissue samples into three vertical cross sections and lay them into a mould containing OCT to ensure that cross-sectional layers are facing upwards (Figure 3A).
Push the sample all the way through the OCT to avoid excessive slicing during cross-sectioning before reaching the tissue. While pushing the tissue, be careful to avoid bubbles until none of the tissue remains exposed (Figure 3B).
Place the mould into liquid nitrogen slowly and carefully to minimize splashing and rapid freezing.
After freezing, the frozen tissue samples are placed in a cryostat chamber at -20 °C.
The samples are mounted on a metal chuck with OCT and kept frozen at a cutting temperature of -20 °C (Figure 3C).
The sample on the chuck is mounted on the microtome and sectioned using a CM1850 cryostat (Leica microsystems) (Figure 3D).
The tissue sections are cut at a thickness of 10 μm and mounted on a slide (Figure 3E).
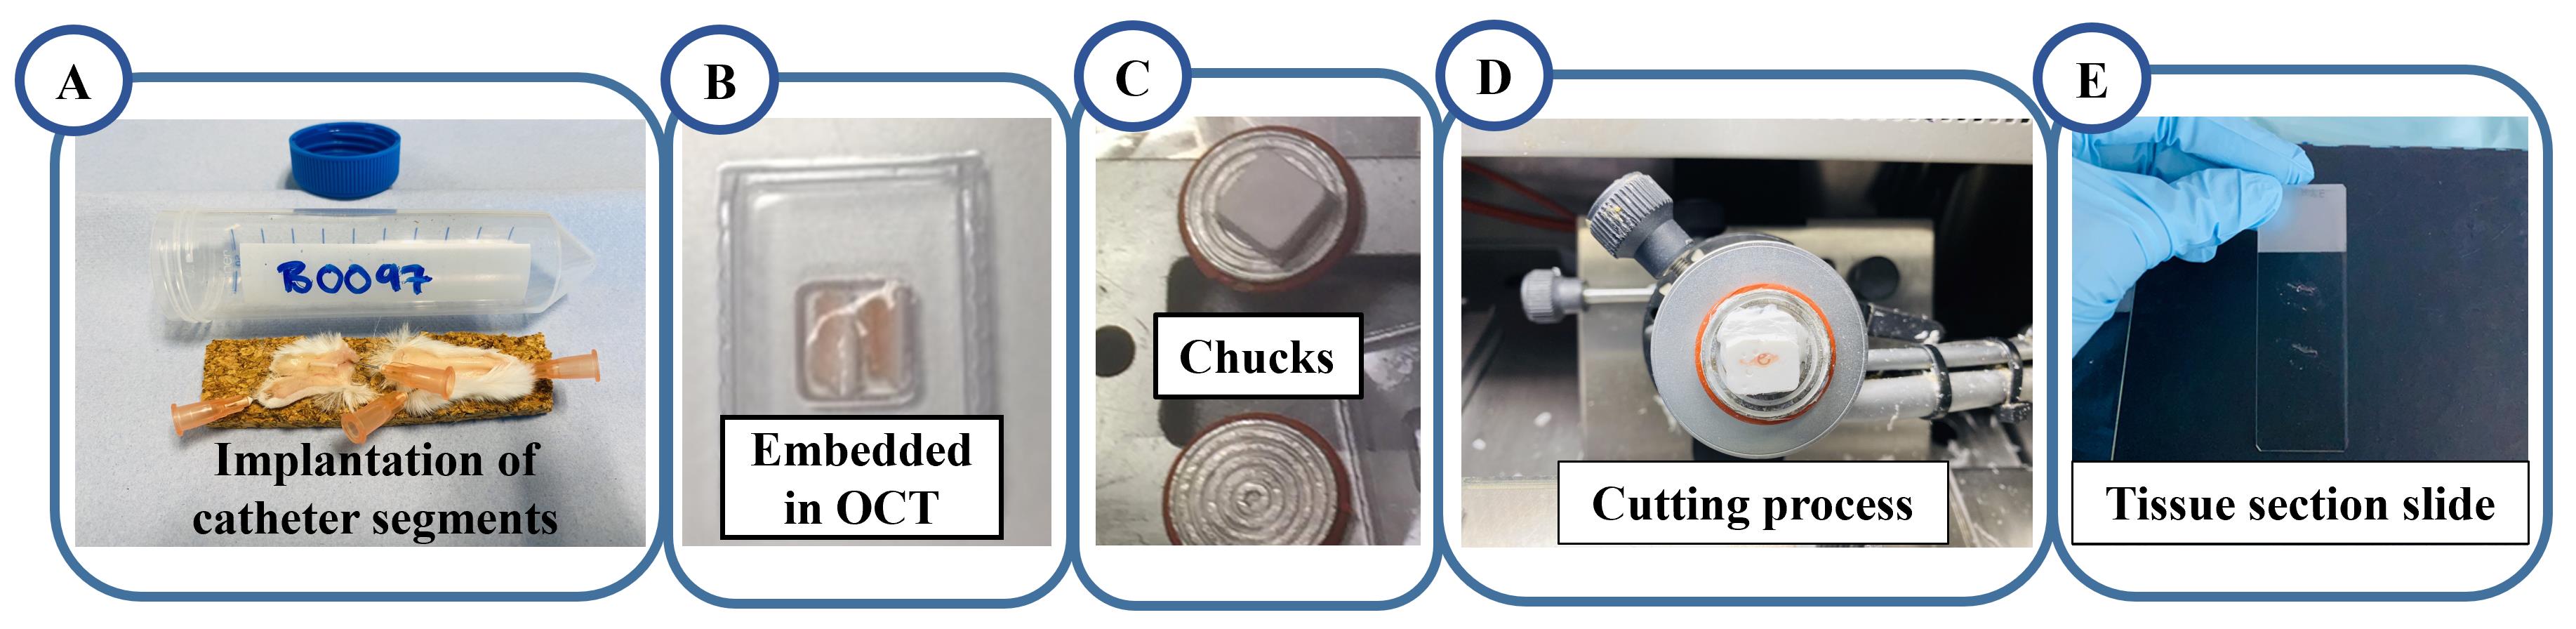
Figure 3. Schematic workflow of fresh tissue section preparation for 3D OrbiSIMS. A. The catheter segments explanted after 28 days B. Tissue embedded in OCT. C. Spread a generous amount of OCT on the metal chuck and quickly lay tissue embedded samples on it. D. Cutting the tissue section using a CM1850 cryostat. E. Mounting tissue section on the glass slide.Tissue section slides are washed with cold DI water three times for 30 s each and cold 70% ethanol for 30 s to remove fat and lipids, which can increase the sensitivity of detection for some unwanted molecules.
Frozen tissue sections are plunged into liquid nitrogen.
The frozen samples are freeze-dried as above in Section B, step 10.
Place the slide directly in a microscope slide box cooled on dry ice.
Store the microscope slide box at -80 °C until analysis.
Note: Please wear proper personal protective equipment (PPE) when handling liquid nitrogen to prevent contact. When sectioning tissue/catheter samples, mount the sections quickly using electrostatic effects from the slide.
3D OrbiSIMS analysis
Take the cell sample slides and tissue section samples on the slides from the -80 °C freezer and warm them to room temperature without opening.
Mount the sample on the backmount holders or topmount holder and lock with a screw. Ensure the screws are tightened and samples cannot move (Figure 4A and 4B).
Using the photo box, take a photo of the sample holder before loading it into the instrument to mark the sample location.
Load the sample holder onto the transfer arm via the bayonet socket and into the 3D OrbiSIMS instrument airlock for analysis (Figure 4C).
The Orbitrap analyzer should be calibrated using silver cluster ion patterns from a silver foil.
Conduct 3D OrbiSIMS analysis using a Hybrid SIMS instrument (IONTOF, GmbH), depth profile (single beam 20 keV Ar3000+, OrbitrapTM analyzer).
Collect secondary ions using the Q Exactive HF at the 240,000 m/z and 200 mass resolution setting, in both positive and negative ion mode.
The electron flood gun operates with an energy of 21 eV and an extraction bias of 20 V for charge compensation, with an injection time of 500 ms.
For all Orbitrap data, collect mass spectral information from a mass range of 75–1125 m/z.
For in vitro analysis, select the primary ion dose for analysis to maximize the secondary ion signal. For a total ion dose per measurement of 3.95 × 10¹¹ ions/cm2 and a duty cycle of 4.4%, maintain the pressure in the main chamber at 1.6 × 10⁻⁶ mbar using argon gas flooding and a continuous GCIB current of 230 pA over an area of 150 μm × 150 μm, with crater size of 233.1 μm × 233.1 μm.
For an ex vivo study, the total ion dose per measurement is 5.21 × 10¹⁰ ions/cm2 and a duty cycle of 4.4%. Maintain the pressure in the main chamber at 8.9 × 10⁻⁷ mbar using argon gas flooding and a continuous GCIB current of 230 pA over an area of 100 μm × 100 μm, with crater size of 180.0 μm × 180.0 μm.
Move the stage to a sample area of interest (Figure 4D and 4E).
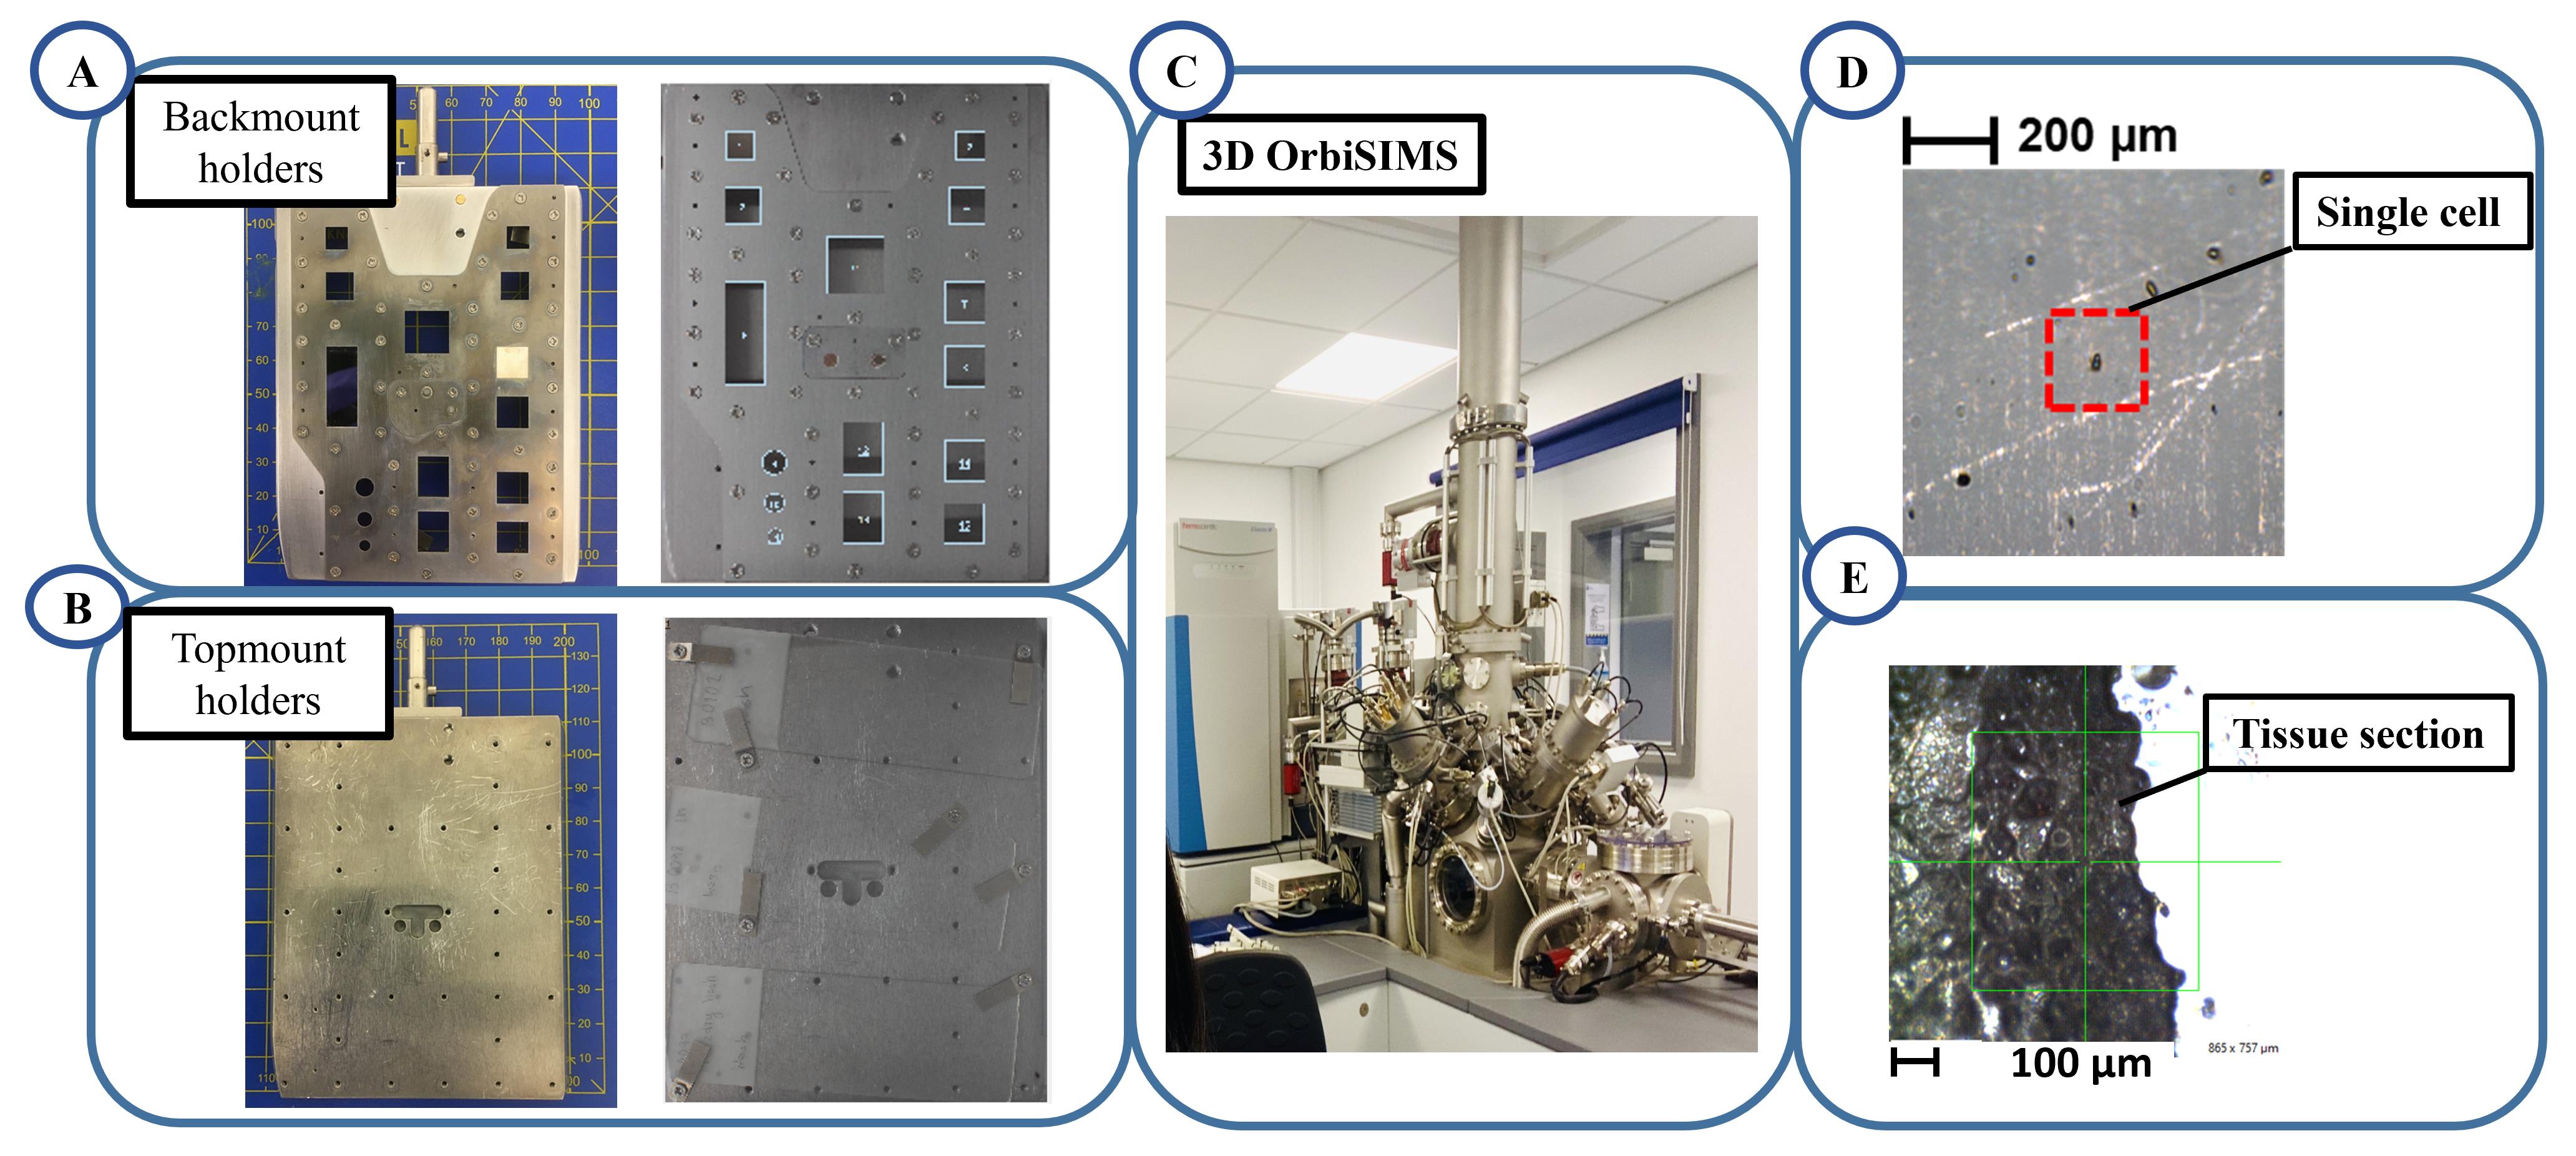
Figure 4. Transfer sample to the stage. A. Backmount holder to fix the sample (left), cell on coverslip samples mount on the backmount holder (right). B. Topmount holder to fix the sample (left), tissue section slides mount on the topmount (right) C. 3D OrbiSIMS instrument at the University of Nottingham. D and E. The optical images of single cells and tissue section acquire within the instrument before analysis by the gas cluster ion beam.For cell sample analysis, choose three cells with positive and negative polarity per sample.
For tissue sample analysis, choose four areas surrounding the foreign body site with both positive and negative polarity per tissue section slide.
Data analysis
Analyze the data using SurfaceLab software version 7.1.
Open data for each sample on SurfaceLab software, select the data in the .itax file, and click open.
The peak lists are created by SurfaceLab.
Search peaks: Set the minimum peak area as 1,000 to distinguish a real from a noise peak.
Discount all peaks below this number as being noise and disregard them in further data analysis.
Export peak list as secondary mass ion and secondary intensity from the software.
Import the peak lists from the OrbiTrap analysis of the single macrophage cells and tissue section sample into the LIPIDMAPS database (perform the step to generate raw data in LIPIDMAPS, as shown in Figure 5) to identify the lipids species (Figure 6A–6C).
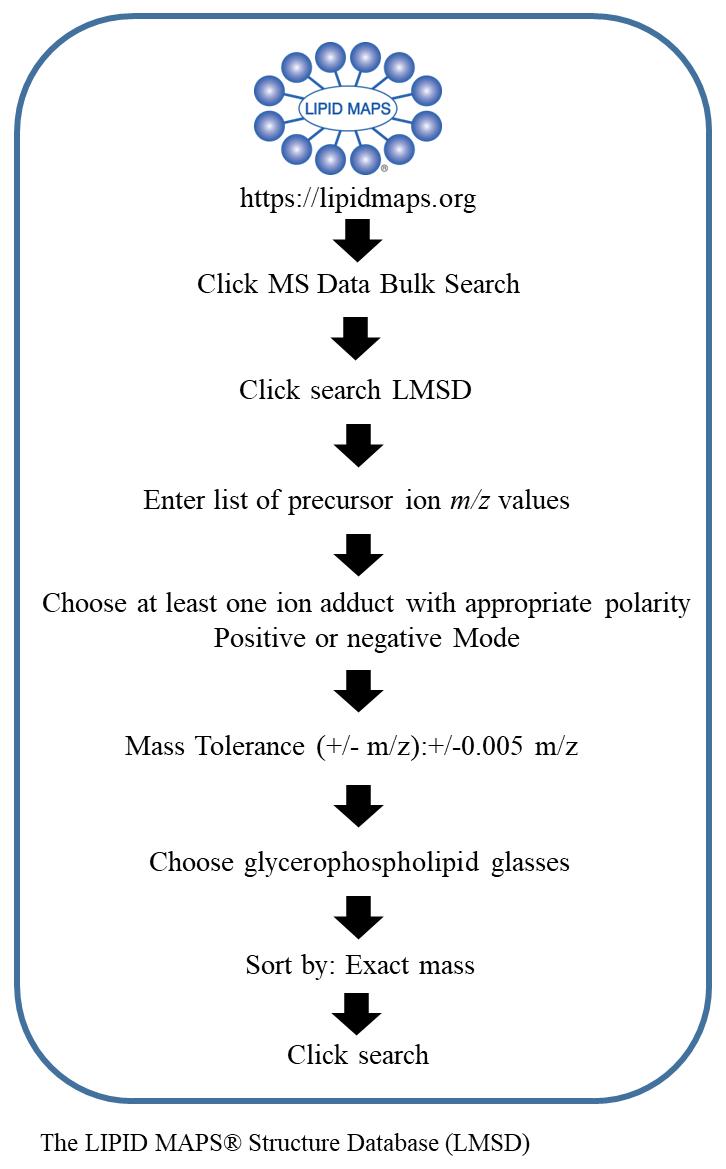
Figure 5. Schematic workflow of steps to generate raw data to identify lipid class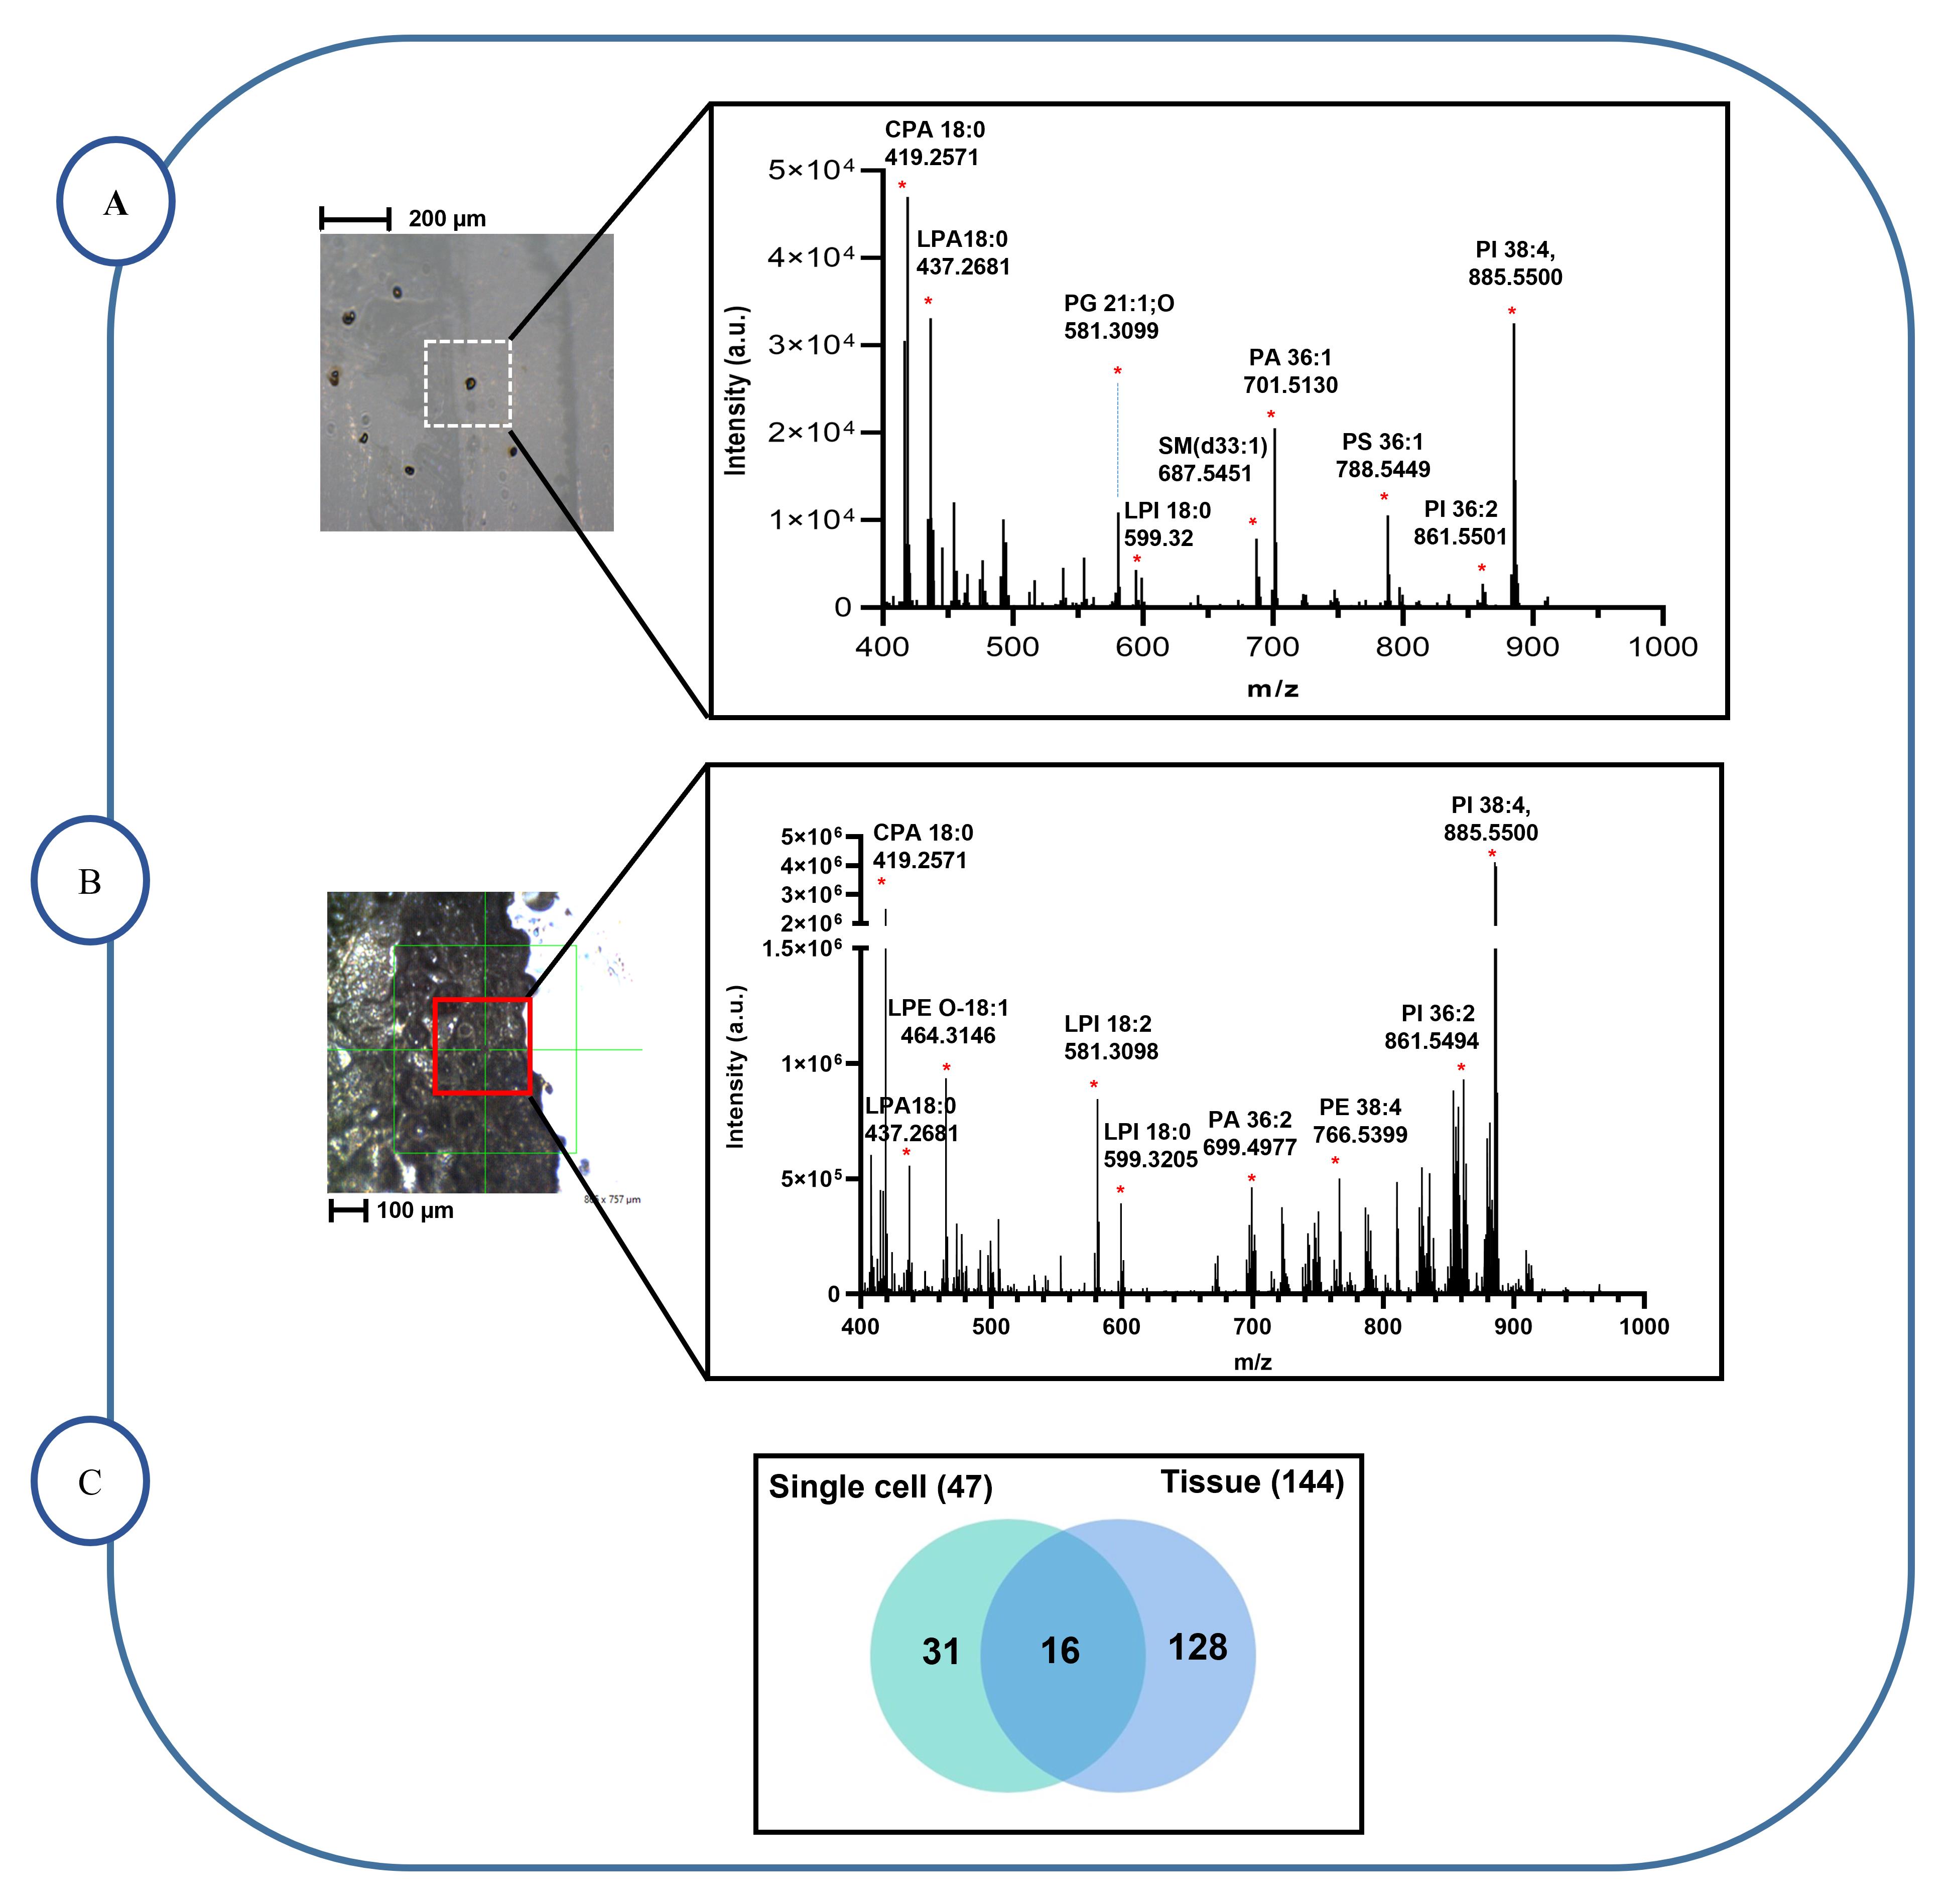
Figure 6. Identification of phospholipid in single macrophages and tissue section samples. A. Negative ion mass spectrum 3D OrbiSIMS of the lipid fragments from a single cell macrophage, where 47 lipids were identified. B. In the negative ion mass spectrum 3D OrbiSIMS of the lipid fragments from a tissue section sample, 144 lipids were identified C. Venn diagram comparing the number of lipid compounds in single macrophages cells and ex vivo tissue sections by 3D OrbiSIMS measurement, illustrating that 16 lipid compounds were common to both samples, while 31 and 128 lipids were unique to single macrophage cells and tissue section samples, respectively.
Validation of protocol
For cell culture: choose three cells per macrophage phenotype and three replicate runs with positive and negative polarity by 3D OrbiSIMS. A total of eighteen cells will be consumed.
For animal studies: assign three mice for each polymer group.
For tissue sample analysis, one tissue section and four replicate areas surrounding the foreign body site are analyzed with both positive and negative polarity by 3D OrbiSIMS. In total, sixteen areas will be consumed.
Conclusion
Overall, our protocol has illustrated that the direct 3D OrbiSIMS technique can provide detailed molecular characterization both in vitro and in vivo samples, with minimal sample preparation compared to optical microscopy of stained and labelled histological samples. This molecular histology approach will help understand the immune response to medical implants and has huge potential in other fields of therapeutics and immune dysregulation.
Recipes
Complete RPMI 1640 medium
Supplement with 10% heat inactivated FBS, 2 mM L-glutamine, and 100 U/mL penicillin-streptomycin
150 mM Ammonium formate
Dissolve 18.9 mg of ammonium formate to a final volume of 20 mL in deionized water.
MACS buffer
50 mL of PBS, 200 μL of EDTA and 250 μL of FBS
Copolymer synthesis solution in dichloromethane (5% w/v)
CHMA-DMAEMA, pro-inflammatory macrophage (M1-like)
CHMA-iDMA, anti-inflammatory macrophage (M2-like)
Acknowledgments
We acknowledge the financing of this work by the Royal Thai Government Scholarship provided by the National Metal and Materials Technology Centre (MTEC), and the National Science and Technology Development Agency (NSTDA), Thailand. This work was also supported by the Engineering and Physical Sciences Research Council (EPSRC) [grant number: EP/P029868/1] with a Strategic Equipment grant.
Competing interests
There are no conflicts of interest or competing interests.
Ethics considerations
Buffy coats from healthy volunteers provided by National Blood Services, Sheffield United Kingdom, ethical committee approval (2009/D055, Research Ethics Committee, Faculty of Medicine and Health Sciences, University of Nottingham).
Animal studies approval by the University of Nottingham Animal Welfare and Ethical Review Board, and carried out in accordance with Home Office authorization under project license number PP5768261.
References
- Abuawad, A., Mbadugha, C., Ghaemmaghami, A. M. and Kim, D. H. (2020). Metabolic characterisation of THP-1 macrophage polarisation using LC–MS-based metabolite profiling. Metabolomics 16(3): 33.
- Basu, S. S., Randall, E. C., Regan, M. S., Lopez, B. G. C., Clark, A. R., Schmitt, N. D., Agar, J. N., Dillon, D. A. and Agar, N. Y. R. (2018). In Vitro Liquid Extraction Surface Analysis Mass Spectrometry (ivLESA-MS) for Direct Metabolic Analysis of Adherent Cells in Culture. Anal Chem 90(8): 4987-4991.
- Cajka, T. and Fiehn, O. (2014). Comprehensive analysis of lipids in biological systems by liquid chromatography-mass spectrometry. Trends Analyt Chem 61: 192-206.
- Denbigh, J. L. and Lockyer, N. P. (2015). ToF-SIMS as a tool for profiling lipids in cancer and other diseases. Mater Sci Technol 31(2): 137-147.
- Eikel, D., Vavrek, M., Smith, S., Bason, C., Yeh, S., Korfmacher, W. A. and Henion, J. D. (2011). Liquid extraction surface analysis mass spectrometry (LESA-MS) as a novel profiling tool for drug distribution and metabolism analysis: the terfenadine example. Rapid Commun Mass Spectrom 25(23): 3587-3596.
- Green, F. M., Gilmore, I. S. and Seah, M. P. (2011). Mass Spectrometry and Informatics: Distribution of Molecules in the PubChem Database and General Requirements for Mass Accuracy in Surface Analysis. Anal Chem 83(9): 3239-3243.
- Kotowska, A. M., Trindade, G. F., Mendes, P. M., Williams, P. M., Aylott, J. W., Shard, A. G., Alexander, M. R. and Scurr, D. J. (2020). Protein identification by 3D OrbiSIMS to facilitate in situ imaging and depth profiling. Nat Commun 11(1): 5832.
- Meurs, J., Scurr, D. J., Lourdusamy, A., Storer, L. C. D., Grundy, R. G., Alexander, M. R., Rahman, R. and Kim, D. H. (2021). Sequential Orbitrap Secondary Ion Mass Spectrometry and Liquid Extraction Surface Analysis-Tandem Mass Spectrometry-Based Metabolomics for Prediction of Brain Tumor Relapse from Sample-Limited Primary Tissue Archives. Anal Chem 93(18): 6947-6954.
- Passarelli, M. K., Pirkl, A., Moellers, R., Grinfeld, D., Kollmer, F., Havelund, R., Newman, C. F., Marshall, P. S., Arlinghaus, H., Alexander, M. R., et al. (2017). The 3D OrbiSIMS—label-free metabolic imaging with subcellular lateral resolution and high mass-resolving power. Nat Methods 14(12): 1175-1183.
- Rauh, M. (2012). LC–MS/MS for protein and peptide quantification in clinical chemistry. J Chromatogr B 883-884: 59-67.
- Rostam, H. M., Fisher, L. E., Hook, A. L., Burroughs, L., Luckett, J. C., Figueredo, G. P., Mbadugha, C., Teo, A. C. K., Latif, A., Kämmerling, L., et al. (2020). Immune-Instructive Polymers Control Macrophage Phenotype and Modulate the Foreign Body Response In Vivo. Matter 2(6): 1564-1581.
- Rostam, H. M., Singh, S., Vrana, N. E., Alexander, M. R. and Ghaemmaghami, A. M. (2015). Impact of surface chemistry and topography on the function of antigen presenting cells. Biomater Sci 3(3): 424-441.
- Shon, H. K., Yoon, S., Moon, J. H. and Lee, T. G. (2016). Improved mass resolution and mass accuracy in TOF-SIMS spectra and images using argon gas cluster ion beams. Biointerphases 11(2): 02A321.
- Sigmund, P. (1969). Theory of Sputtering. I. Sputtering Yield of Amorphous and Polycrystalline Targets. Phys Rev 184: 383.
- Suvannapruk, W., Edney, M. K., Kim, D. H., Scurr, D. J., Ghaemmaghami, A. M. and Alexander, M. R. (2022). Single-Cell Metabolic Profiling of Macrophages Using 3D OrbiSIMS: Correlations with Phenotype. Anal Chem 94(26): 9389-9398.
- Tuli, L. and Ressom, H. W. (2009). LC-MS Based Detection of Differential Protein Expression. J Proteomics Bioinform 2: 416-438.
- Walker, A. V. (2017). Secondary Ion Mass Spectrometry. Lindon, J. C., Tranter, G. E. and Koppenaal, D. W. (Eds.) In: Encyclopedia of Spectroscopy and Spectrometry (3rd Edition). Academic Press, 44-49.
- Yoon, S. and Lee, T. G. (2018). Biological tissue sample preparation for time-of-flight secondary ion mass spectrometry (ToF–SIMS) imaging. Nano Convergence 5(1): 24.
Article Information
Copyright
© 2023 The Author(s); This is an open access article under the CC BY-NC license (https://creativecommons.org/licenses/by-nc/4.0/).
How to cite
Suvannapruk, W., Edney, M. K., Fisher, L. E., Luckett, J. C., Kim, D. H., Scurr, D. J., Ghaemmaghami, A. M. and Alexander, M. R. (2023). Label-free Chemical Characterization of Polarized Immune Cells in vitro and Host Response to Implanted Bio-instructive Polymers in vivo Using 3D OrbiSIMS. Bio-protocol 13(15): e4727. DOI: 10.21769/BioProtoc.4727.
Category
Immunology > Immune cell function > Macrophage
Biological Sciences > Biological techniques > Mass spectrometry
Do you have any questions about this protocol?
Post your question to gather feedback from the community. We will also invite the authors of this article to respond.