- Protocols

- Articles and Issues
- For Authors
- About
- Become a Reviewer

Qualitative and Quantitative Methods to Measure Antibacterial Activity Resulting from Bacterial Competition
Published: Vol 13, Iss 13, Jul 5, 2023 DOI: 10.21769/BioProtoc.4706 Views: 3518
Reviewed by: Cristina Alvarez MartinezAksiniya AsenovaAnonymous reviewer(s)
Advertisement


Protocol Collections
Comprehensive collections of detailed, peer-reviewed protocols focusing on specific topics


Abstract
In the environment, bacteria compete for niche occupancy and resources; they have, therefore, evolved a broad variety of antibacterial weapons to destroy competitors. Current laboratory techniques to evaluate antibacterial activity are usually labor intensive, low throughput, costly, and time consuming. Typical assays rely on the outgrowth of colonies of prey cells on selective solid media after competition. Here, we present fast, inexpensive, and complementary optimized protocols to qualitatively and quantitively measure antibacterial activity. The first method is based on the degradation of a cell-impermeable chromogenic substrate of the β-galactosidase, a cytoplasmic enzyme released during lysis of the attacked reporter strain. The second method relies on the lag time required for the attacked cells to reach a defined optical density after the competition, which is directly dependent on the initial number of surviving cells.
Key features
• First method utilizes the release of β-galactosidase as a proxy for bacterial lysis.
• Second method is based on the growth timing of surviving cells.
• Combination of two methods discriminates between cell death and lysis, cell death without lysis, or survival to quasi-lysis.
• Methods optimized to various bacterial species such as Escherichia coli, Pseudomonas aeruginosa, and Myxococcus xanthus.
Graphical overview
Background
In the environment, bacteria do not live alone but rather build complex microbial communities in which several species coexist (Luo et al., 2022). These microbial communities, while dynamic, represent ecosystems that are usually stable and resilient by resisting changing conditions and disturbances. To ensure this stability, bacteria establish relationships with other bacterial species and microbes for mutual benefits. The most studied cooperation mechanisms are quorum sensing (i.e., a communication mechanism based on release and sensing of signaling molecules allowing the synchronized expression of specific genes), exchange of metabolic molecules, and division of labor (subpopulations that perform different tasks simultaneously) (West et al., 2006). Conversely, antagonist interactions, collectively known as competition, correspond to mechanisms evolved by microorganisms to destroy rivals—or prevent their growth—in order to ensure a privileged access to the niche or to limited resources. Competition can lead to the increase of one species at the expense of one or several others, and usually promotes formation of spatial segregation patterns inside the community. Competition comprises indirect (exploitative) or direct (interference) mechanisms, in which one species consumes the resources or eliminate rivals, respectively (Ghoul and Mitri, 2016). An attacker cell competing for nutrients or space is referred as a competitor. By opposition, an attacker using competition to directly eliminate and feed from a target cell is referred as a predator. At the molecular level, many mechanisms involved in direct competition have been revealed and described in detail (Ghoul and Mitri, 2016; Stubbendieck and Straight, 2016; Granato et al., 2019). All these mechanisms rely on common themes but need distinct specific machineries. They all require the delivery of a potent toxin that is usually co-produced with a cognate immunity protein conferring protection to the attacker cell (Chassaing and Cascales, 2018). Toxin-mediated competition mechanisms are categorized as contact-independent or contact-dependent. The best-known example of contact-independent mechanisms is represented by bacteriocins, such as colicins. These are peptide or protein antibiotics that are released by a quasi-lysis mechanism and bind to and penetrate into target cells by hijacking essential components of the cell envelope (Cascales et al., 2007; Kleanthous, 2010). By contrast, contact-dependent mechanisms rely on specific secretion machineries required for cell surface exposure or the delivery of toxic effectors. These are either directly injected inside the target cell or use a penetration mechanism similar to that of bacteriocins. Several dedicated secretion systems, such as Type IV, Type V, Type VI, and Type VII secretion systems and Type IV and Tad pili, have been demonstrated to play key roles in bacterial competition (Ruhe et al., 2013; Willett et al., 2015; Cao et al., 2016; Chassaing and Cascales, 2018; Granato et al., 2019; Sgro et al., 2019; Seef et al., 2021; Tassinari et al., 2022; Thiery et al., 2022).
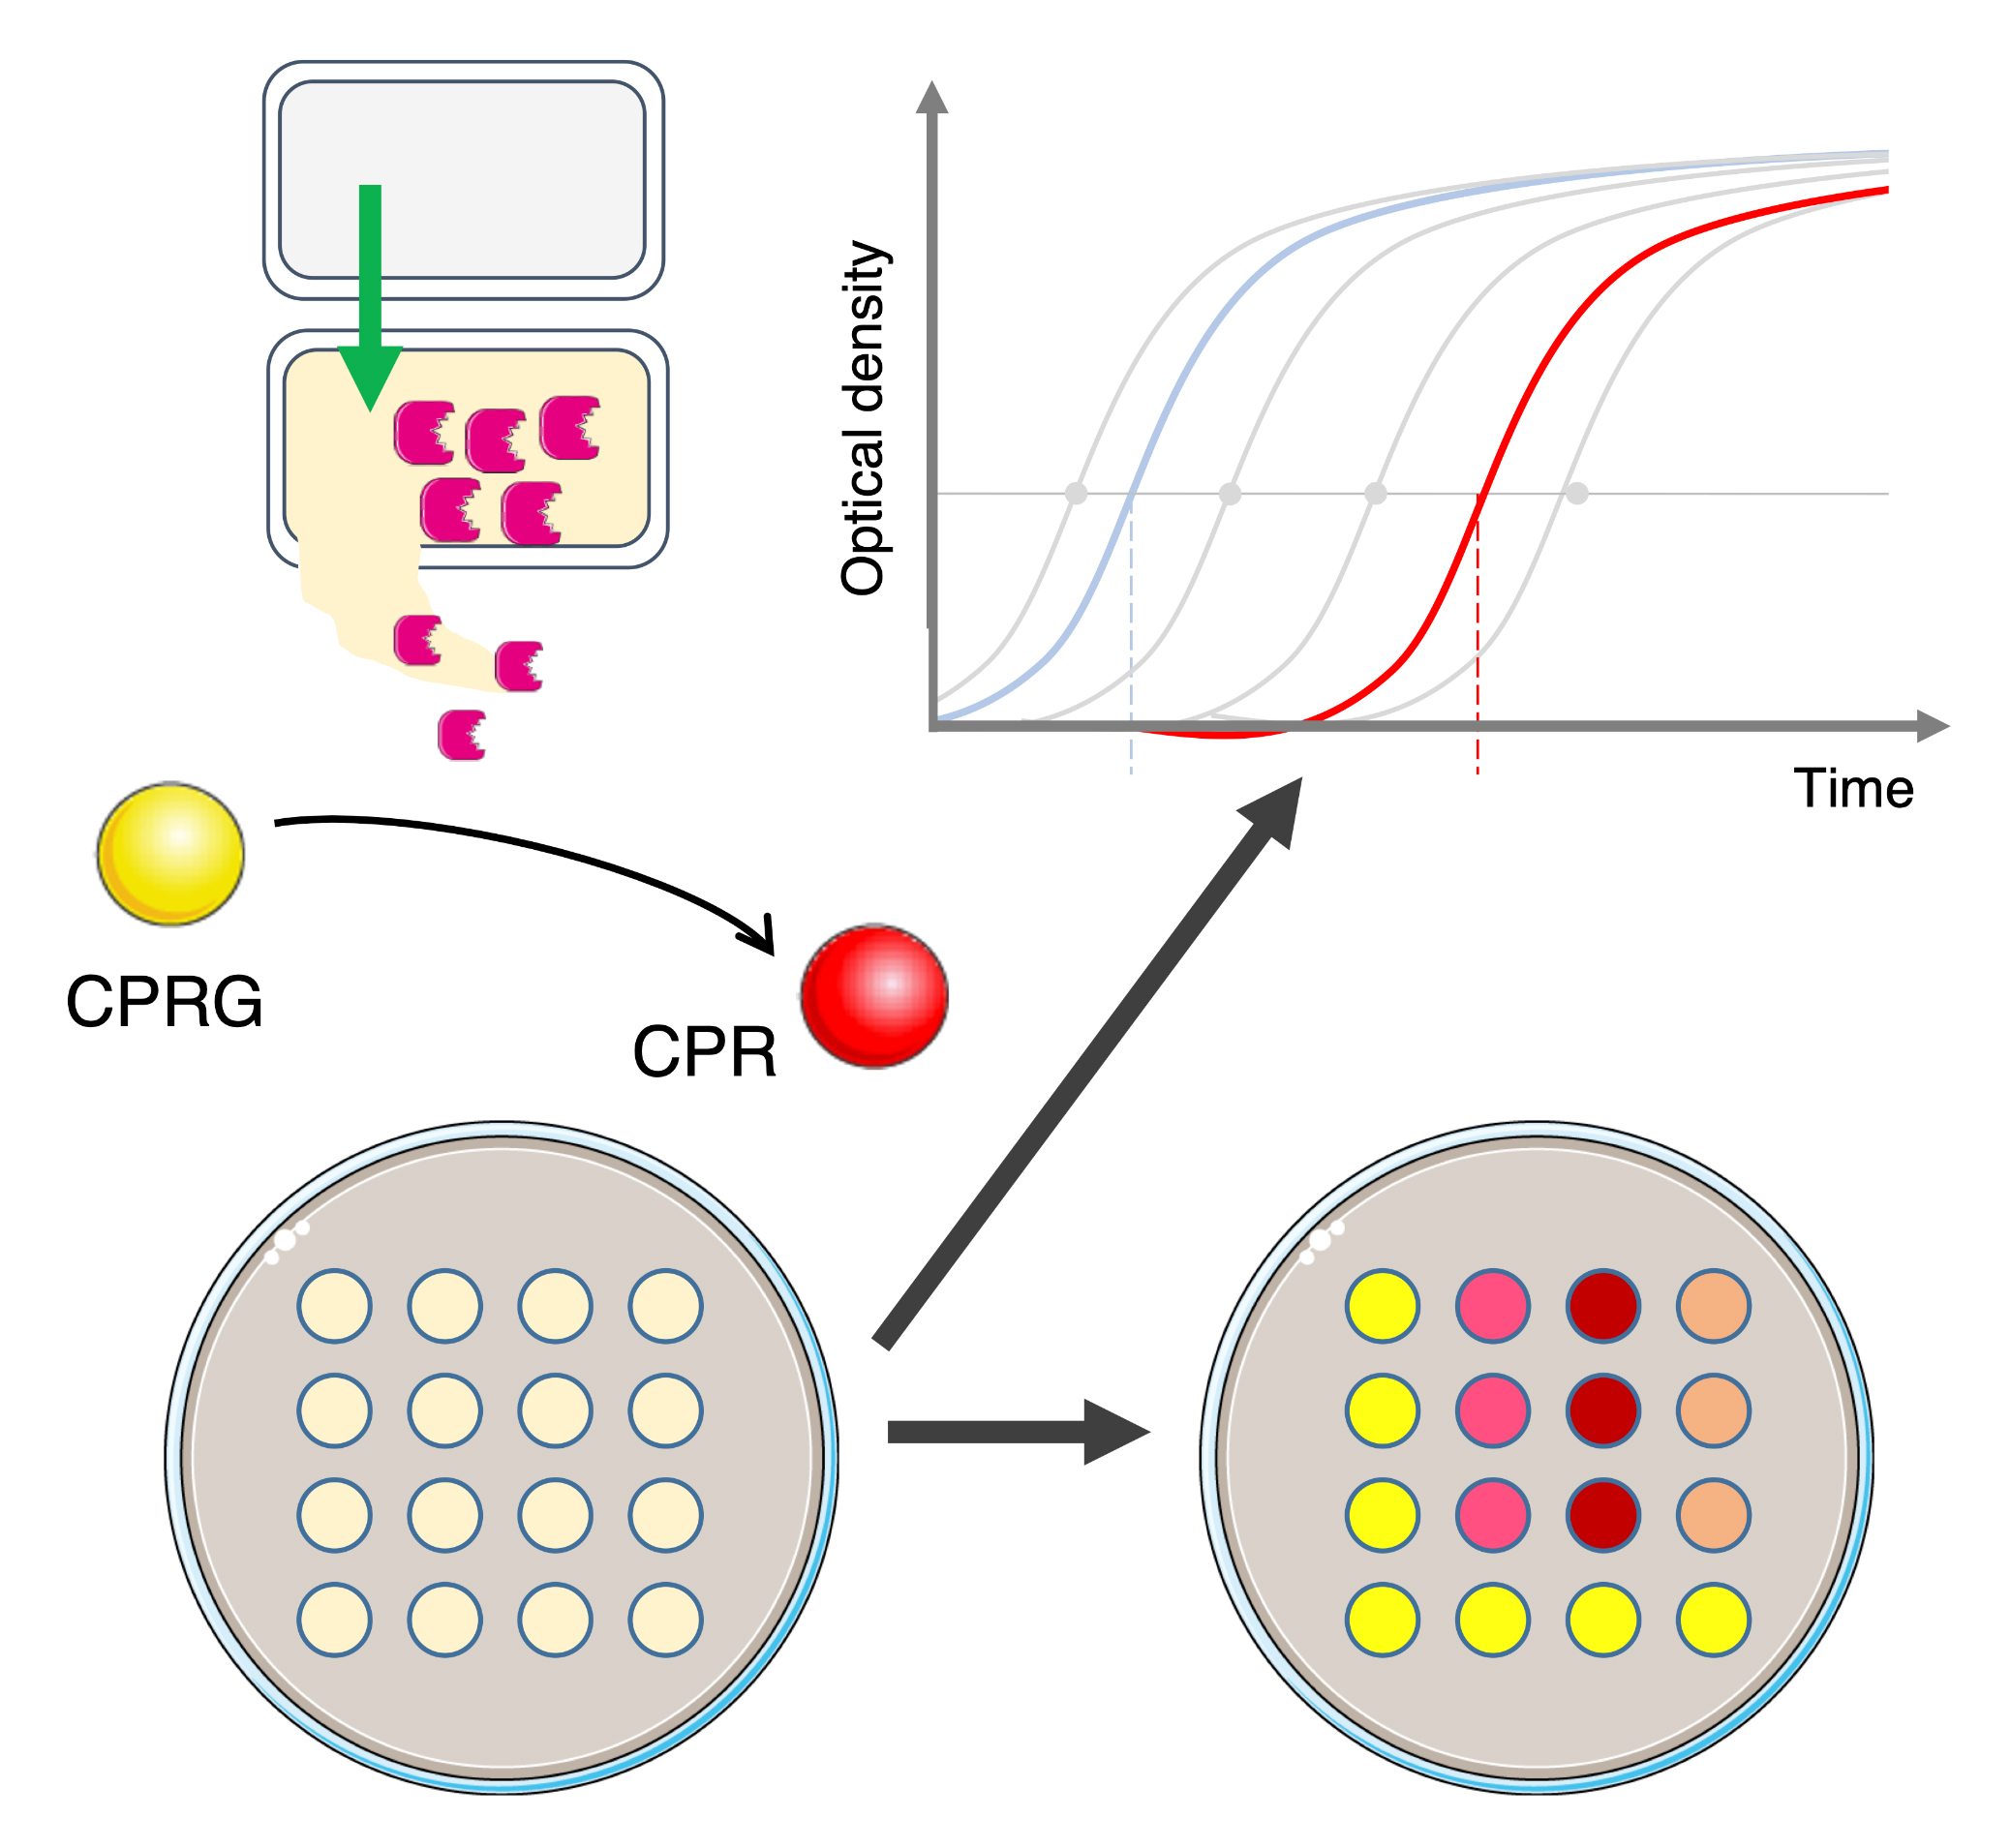
Evaluating bacterial competition in laboratory conditions often requires mixing attacker and recipient cells and, after co-incubation, counting attacker and surviving recipient cell colony-forming units on selective solid growth medium (MacIntyre et al., 2010; Flaugnatti et al., 2016; Alcoforado Diniz et al., 2017). However, this method is labor intensive, low throughput, costly, and time consuming. There is, therefore, a need to overcome these limitations, particularly when a large number of strains needs to be tested or in the case of a natural antibiotic resistant model that does not allow recovering prey cells in selective medium (Hazan et al., 2012; Lin and Lai, 2020). Recently, a new procedure based on the cell-impermeable β-galactosidase chromogenic substrate chlorophenol-red β-D-galactopyranoside (CPRG) was proposed (Vettiger and Basler, 2016). Because of its inability to cross the cell envelope, the CPRG (yellow) is only hydrolyzed in chlorophenol red (CPR, red) when the cytoplasmic β-galactosidase is released from a lacZ+ reporter cell after lysis. In addition to the visual evaluation of the antibacterial activity, the colorimetric properties of CPR can be measured by absorbance at λ = 572 nm (A572) or fluorescence (excitation at λ = 580 nm and emission at λ = 620 nm, F620nm) for a semi-quantitative value (Sicard et al., 2014; Vettiger and Basler, 2016; Figure 1A).
Here, this colorimetric method, called LAGA for Lysis-associated β-galactosidase Assay, was optimized to evaluate the activity of various antibacterial mechanisms. In addition, we developed a quantitative and complementary method based on growth recovery of surviving cells, called SGK for Survivors Growth Kinetics, to measure the number of surviving reporter cells after a competition assay, which is directly linked to the antibacterial activity of the attacker cell (Figure 1B). This method measures the time necessary for a subculture of recipient cells in selective medium to reach a defined optical density at λ = 600 nm (A600) after a competition assay, which is dependent on the initial number of surviving cells. By using standard curves from different known reporter inoculums, the initial number of surviving recipients can be estimated. Here, we describe the application of these methods in different bacterial models using various antibacterial strategies.
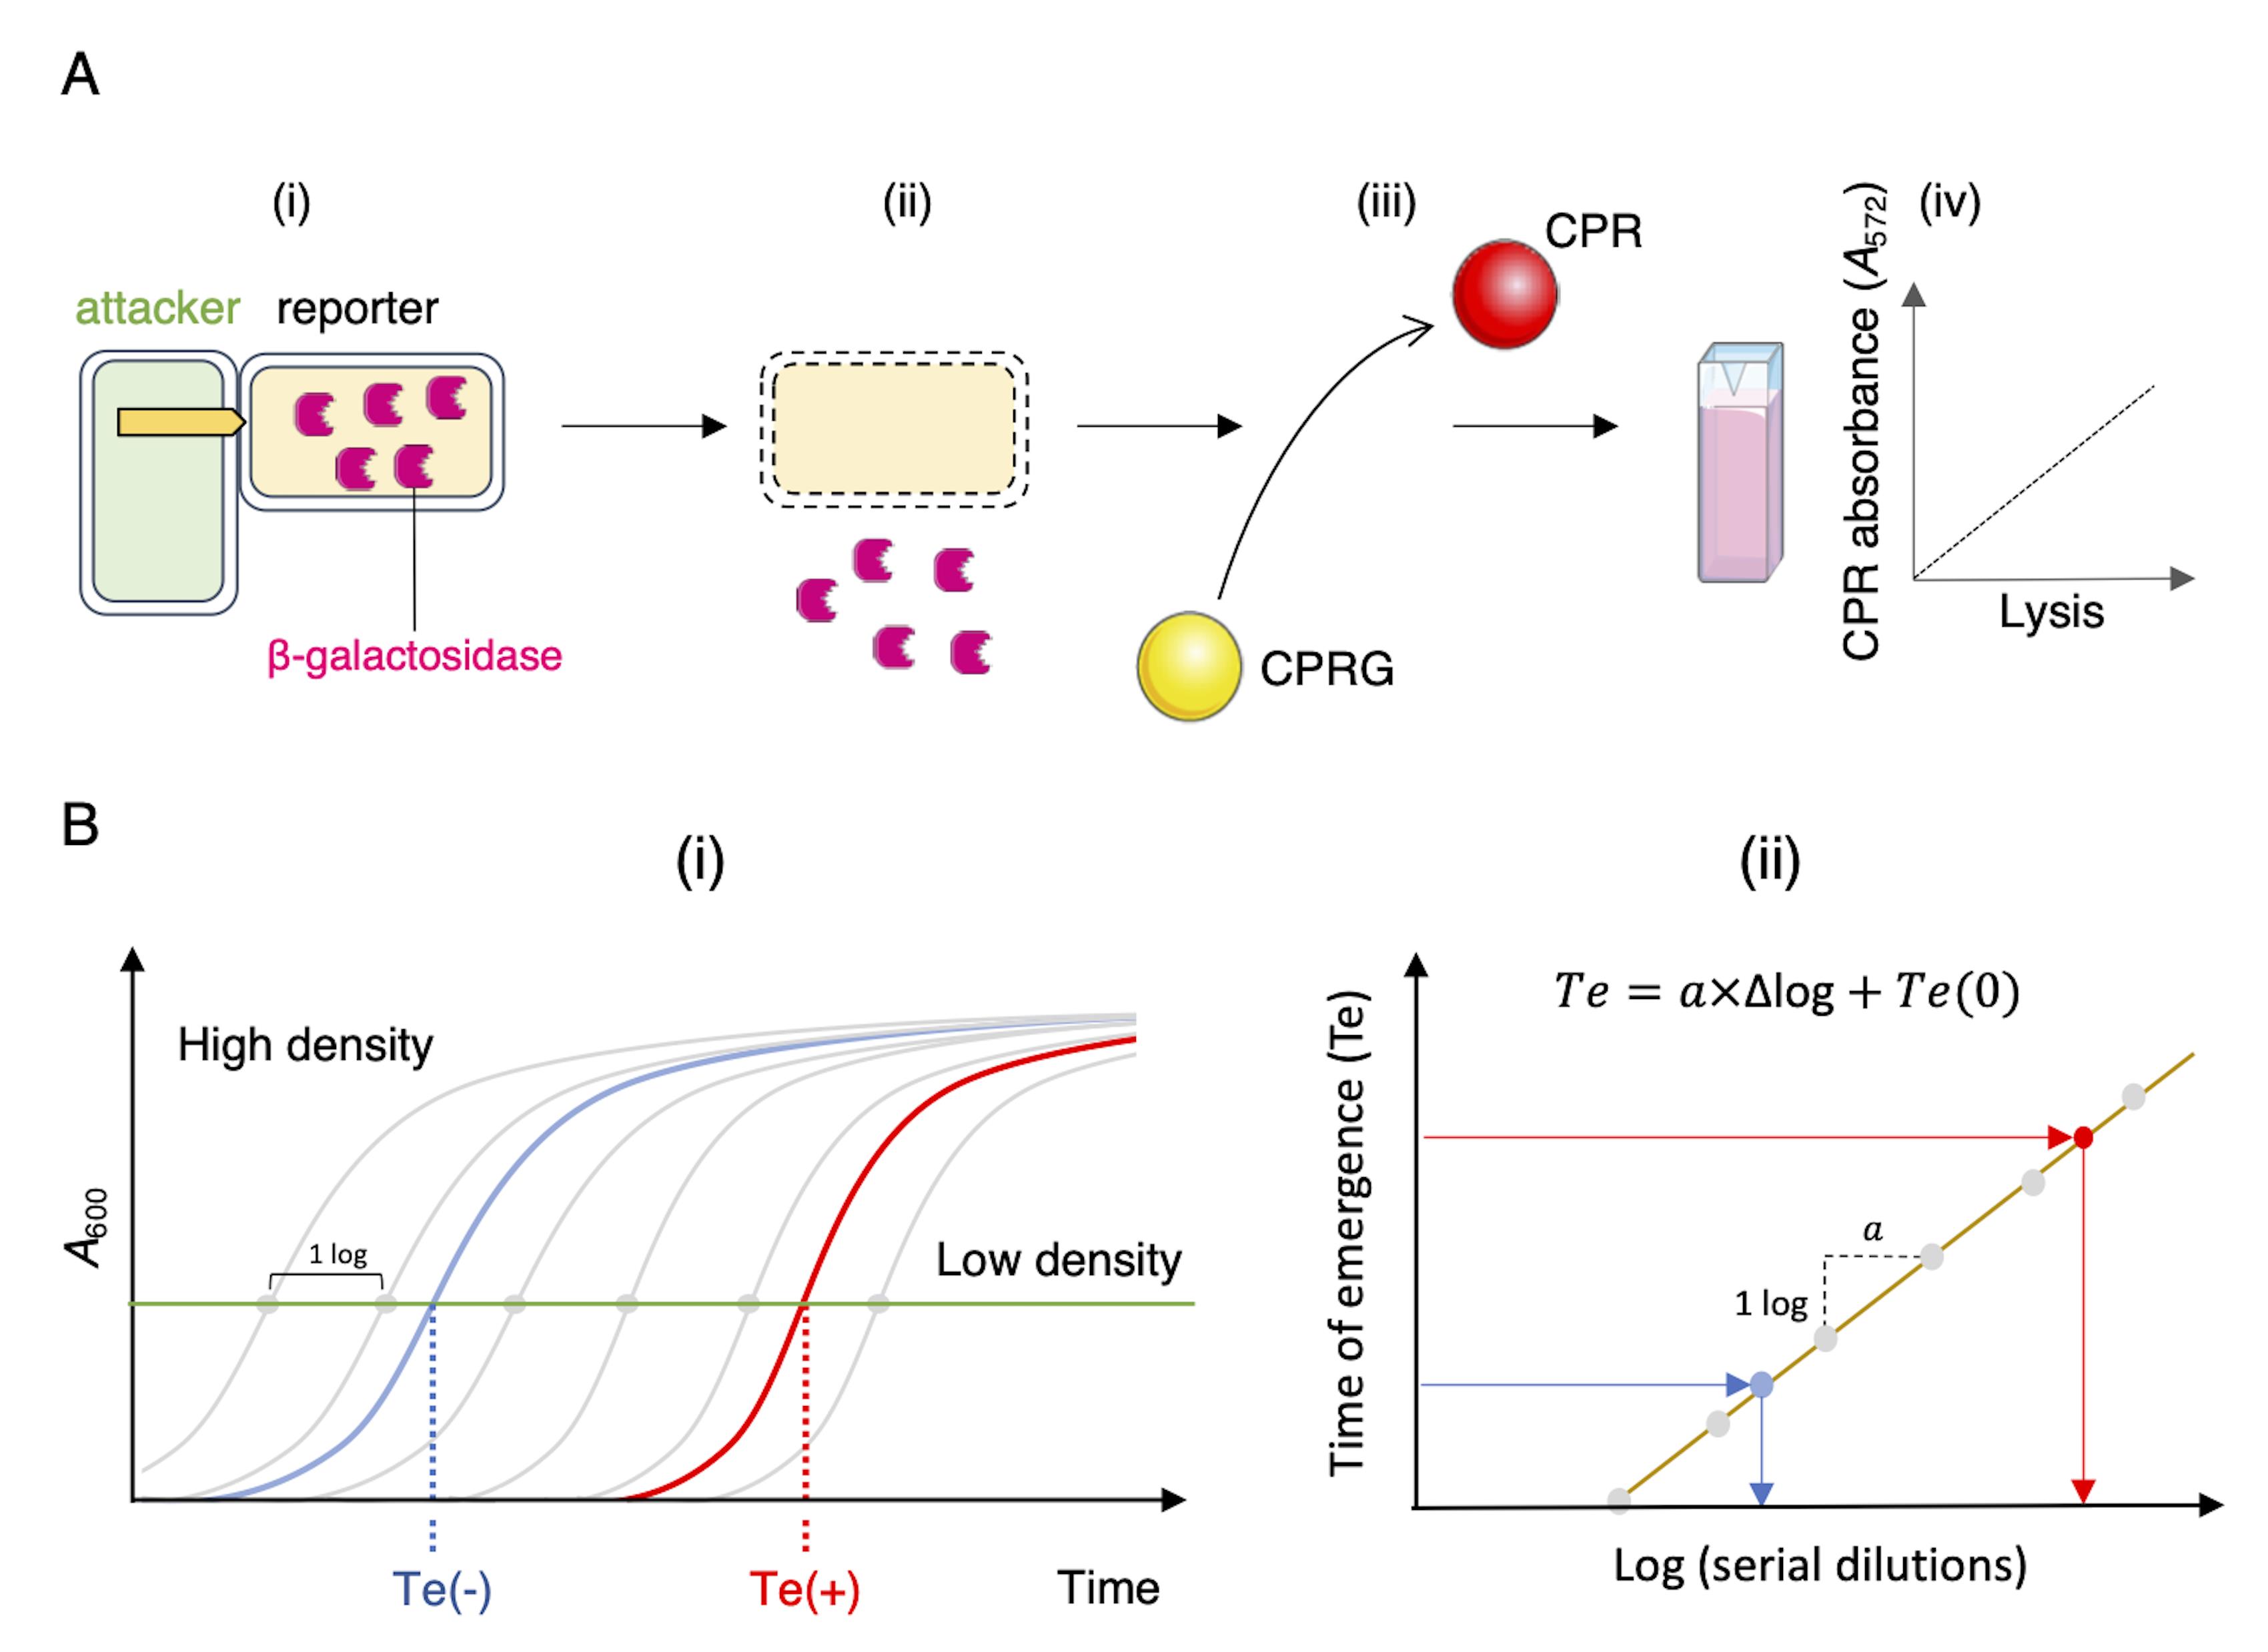
Figure 1. Schematic representations of the LAGA and SGK assays. (A) Lysis-associated β-galactosidase assay (LAGA). (i) Attacker and lacZ+ reporter cells are mixed. (ii) The antibacterial activity of the attacker results in reporter cell lysis and release of β-galactosidase to the medium. (iii) The hydrolysis of the yellow-colored chlorophenol-red β-D-galactopyranoside (CPRG) into the purple product chlorophenol red (CPR) by the released β-galactosidase can be measured spectrophotometrically (iv). The intensity of the coloration is correlated with CPR concentration and thus directly proportional to the number of lysed reporter cells and to the attacker antibacterial activity. (B) Survivors growth kinetics (SGK). (i) After mixing attacker and reporter cells and incubation, antibiotic-resistant reporter cells are selected on liquid medium containing the antibiotic. The growth curve is compared to standard growth curves of a serially diluted reporter culture (grey lines and dots). A high-density sample (no competition, blue line) will thus reach a defined A600 (horizontal green line) faster than the low-density sample (active competition, red line). The time of emergence [Te, time necessary to reach the defined A600; Te(-), no competition; Te(+), active competition] can be plotted to the linear regression curve of slope α, obtained with the serially-diluted standards (ii), allowing the evaluation of the initial number of surviving cells in the sample.
Materials and reagents
Chlorophenol red β-D-galactopyranoside (CPRG), sodium salt (Roche, catalog number: 10884308001; Sigma-Aldrich, catalog number: 220588; or equivalent). Store powder and soluble preparation (1.2 mg/mL in water) at -20 °C for up to one year or at 4 °C for up to one week
Non-treated, clear, flat-bottom 96-well microtiter plates (Greiner Cellstar®, catalog number: M0812; Nunc, catalog number: 266120; or equivalent)
Equipment
Spectrophotometer for reading absorbance at λ = 572 and 600 nm
Microplate reader (Tecan, Infinite 200; or comparable microplate reader)
Incubators to grow bacterial cultures and to incubate plates.
1.5- and 2-mL plastic tubes
Procedure
A schematic diagram depicting the whole experimental procedure is shown in Figure 2.
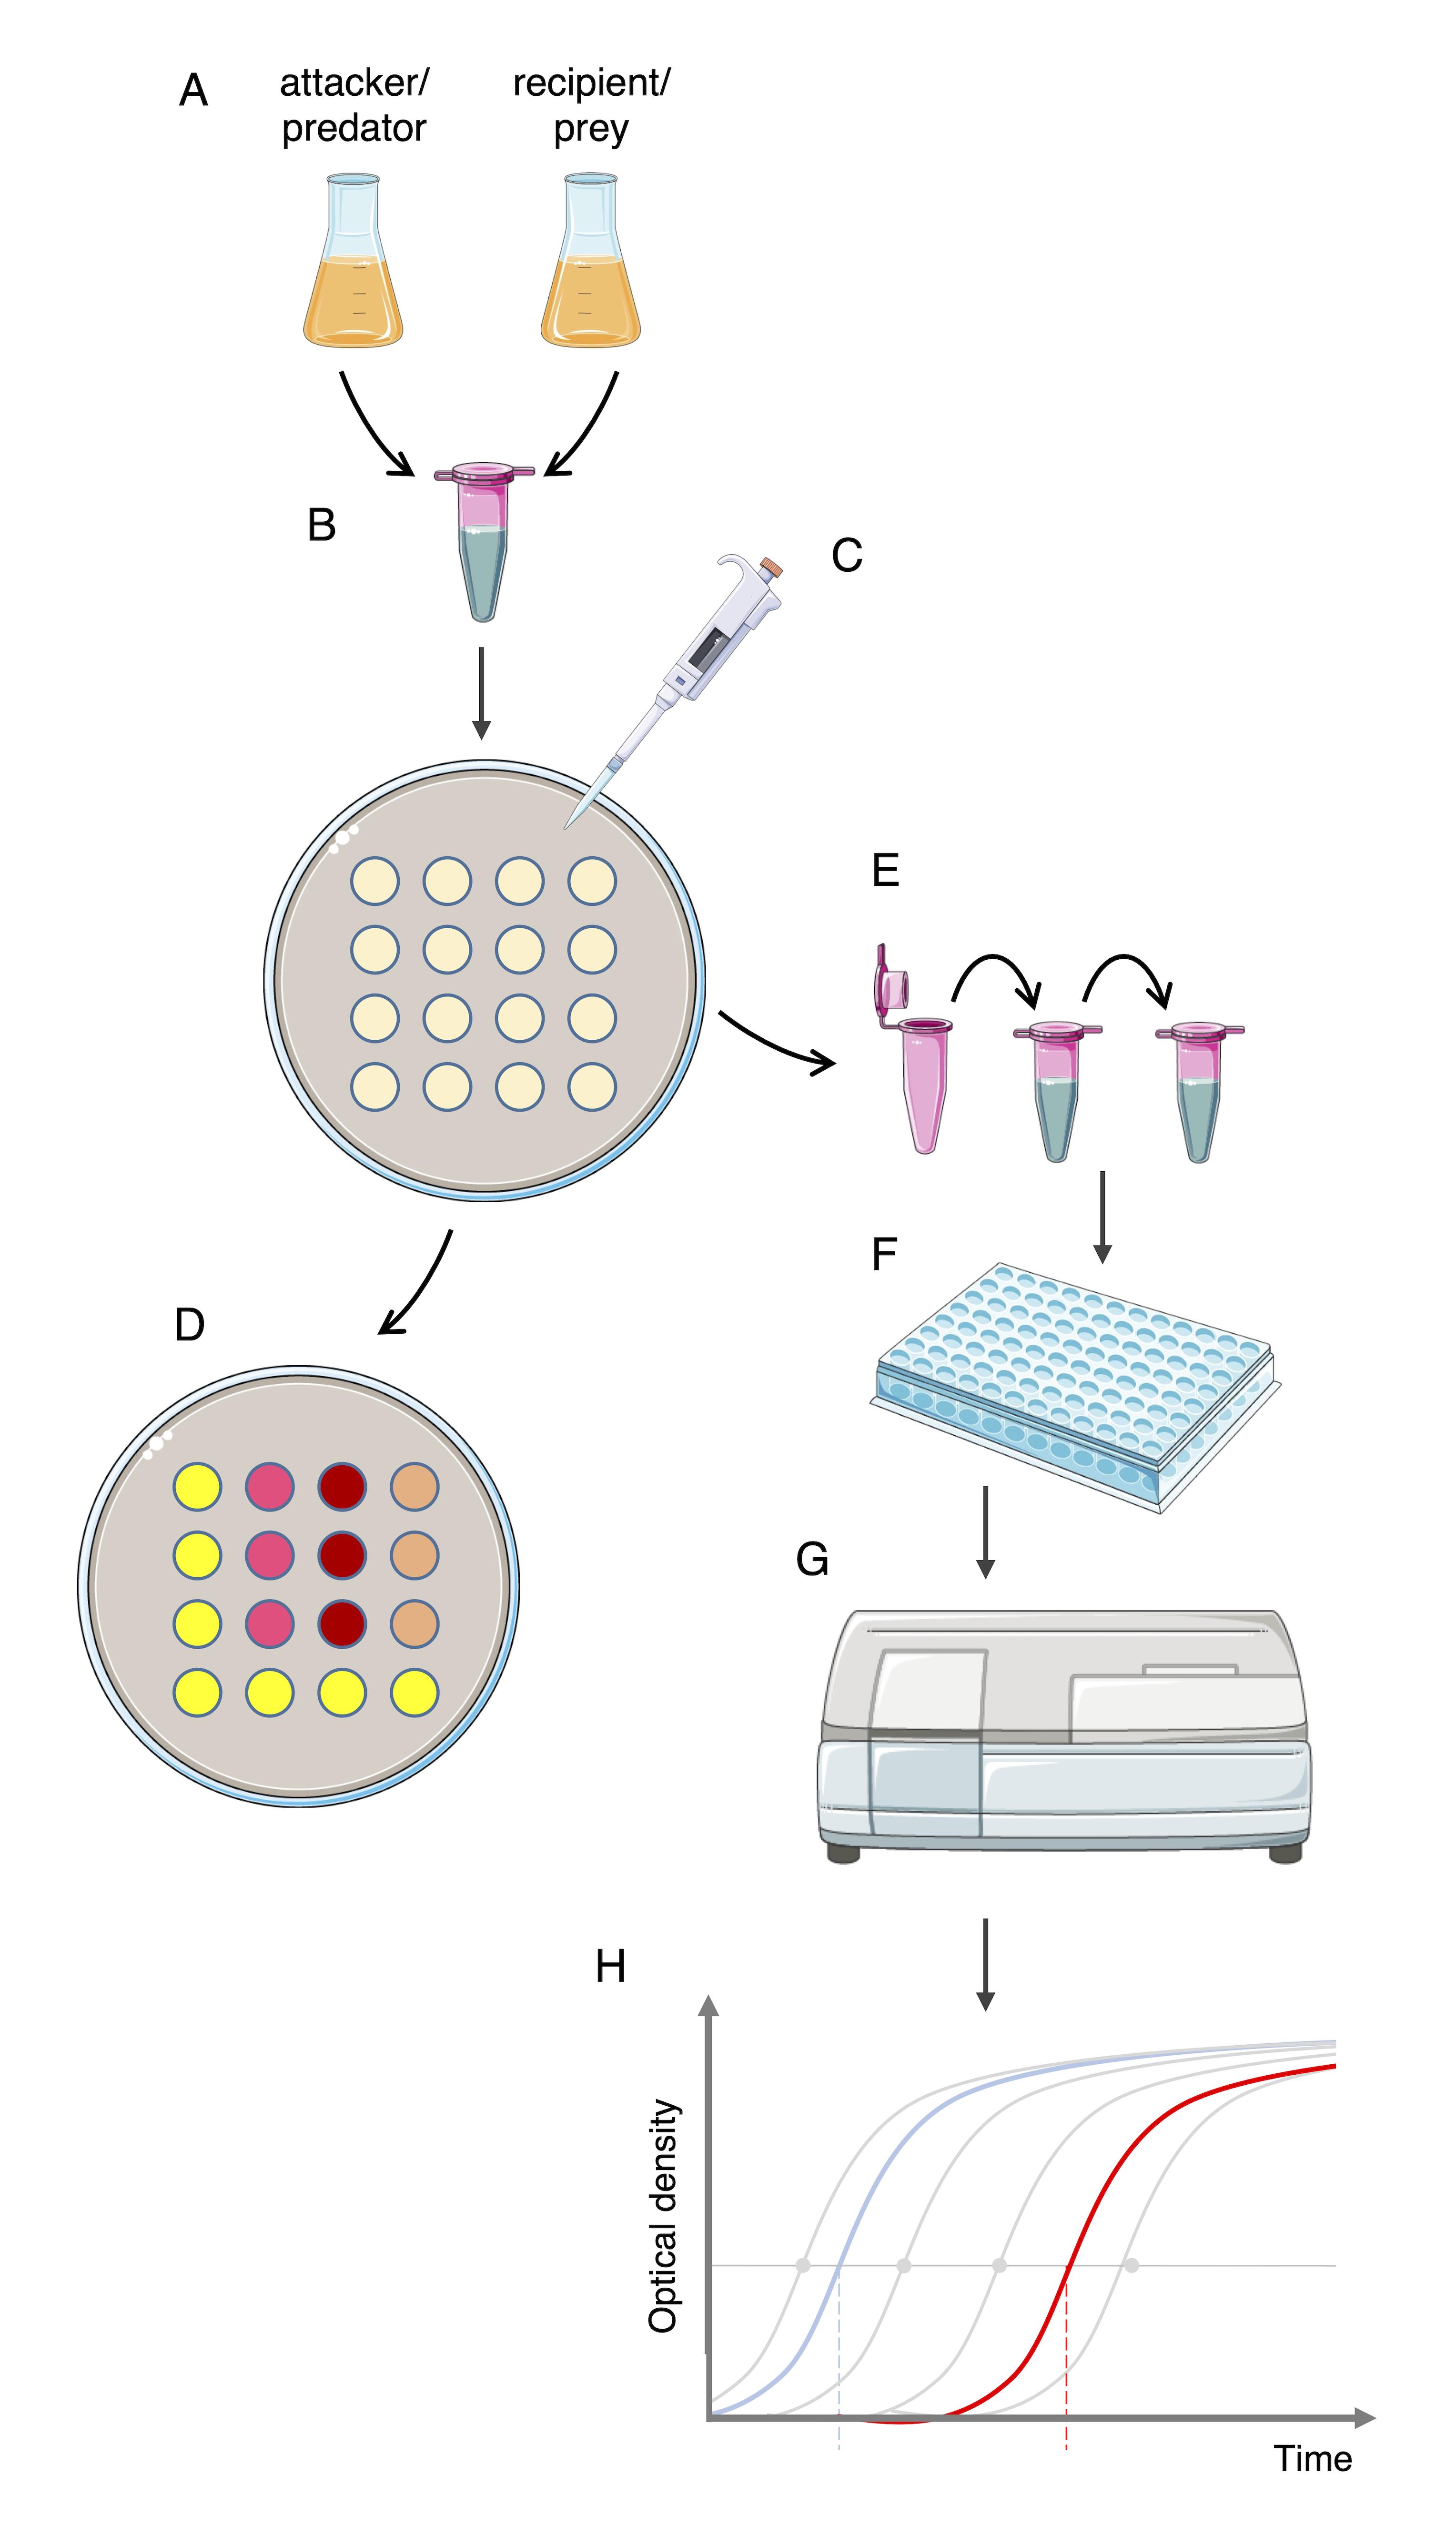
Figure 2. Lysis-associated β-galactosidase assay (LAGA) and survivors growth kinetics (SGK) protocols at a glance. Attacker/predator and recipient/reporter/prey are cultured (A). Cell culture ODs are adjusted, and attacker and recipient mixed at the appropriate ratio (B). Cell mixtures are spotted on agar plates (C). Cell spots are either treated with chlorophenol-red β-D-galactopyranoside (CPRG) (D, LAGA assay) or resuspended and serially diluted into selective medium (E, SGK assay). After aliquoting into a 96-well plate (F), cell growth is spectrophotometrically monitored (G) and growth curves are plotted and compared to standard curves to measure the time of emergence (H).
LAGA protocol
Preparation of attacker (predator) and recipient (prey) cultures
Isolate the attacker(s) and the recipient(s) on specific medium agar plates, with any appropriate antibiotics if necessary.
Grow the strains in the adequate medium until the stationary phase.
Note: It is recommended to grow three independent colonies, for triplicate experiments.
Dilute the precultures in fresh medium to an optical density (A600) of 0.05–0.1 and incubate with shaking to the desired A600 (Figure 7A).
Notes:
To increase the expression of the lacZ gene, the recipient cell culture can be supplemented with 0.1 mM of IPTG.
lacZ expression could be significantly different depending on the recipient strain, growth medium, and growth conditions. We recommend using the same recipient culture with the different attackers for comparison.
Preparation of the attacker:recipient suspension and cell–cell contact
Prepare attacker and recipient cell suspensions at equal OD and mix them to the appropriate ratio (Figure 2B).
Note: For each attacker/recipient combination, the OD of the cell suspension and the attacker:recipient ratio should be optimized. Resuspension at 1–10 OD and 1:1–1:20 attacker:recipient ratio are typically used.
Spot 10 μL of the attacker:recipient cell suspension onto appropriate solid growth medium (medium allowing the growth of both attacker and recipient strains) and let dry (Figure 2C).
Notes:
It is recommended to spot each suspension three or four times for technical replicates (if three independent cultures and attacker:recipient have been made, this represents 9–12 spots for each attacker:recipient combination).
Control experiments should be performed by spotting the attacker only and the recipient only.
In some cases of predation that require flagellar motility (e.g., Bdellovibrio), the attacker:recipient cell mixture should be incubated in liquid medium.
For easy recovery of cells or in the case of sticky cells, the mixtures can be spotted on 0.45 μm membrane filters.
Incubate at the desired temperature for the optimized time.
Note: The optimal temperature depends on the attacker:recipient combination. The incubation time (usually between 1 and 24 h of contact) should be optimized.
CPRG hydrolysis and antibacterial activity evaluation
Add 10 μL of 1 mM of CPRG on top of the bacterial spot. Spot staining usually occurs in 10 min to 2 h (Figure 2D).
Note: CPRG hydrolysis could be measured with the supernatant. In this case, scrape the cells and resuspend the bacterial spot into 1 mL of PBS, centrifuge at 2,400× g for 5 min at 20 °C to pellet cells, and add 10 μL of 1 mM of CPRG into the supernatant. Measure the absorbance at λ = 572 and/or fluorescence (excitation at λ = 580 nm and emission at λ = 620 nm) after 10 min to 2 h. β-galactosidase activity could also be calculated by the slope obtained by measuring absorbance at λ = 572 every minute during 10 min, and expressed in μM/min using ϵM(CPR) = 45,000 M-1cm-1.
SGK protocol
Attacker and recipient cultures, preparation of attacker:recipient suspensions, and cell–cell contact
Follow sections A and B of LAGA protocol.
Serial dilutions and growth measures
Aliquot 100 μL of selective medium in the adequate number of wells of a 96-well microplate. Fill in extra wells with 200 μL of medium for blank measurements.
After incubation, scrape and resuspend the bacterial competition spots in 1 mL of selective medium in a 2 mL tube and vortex vigorously (Figure 2E).
Prepare serial dilutions of the suspensions (usually 1/2, 1/5, or 1/10 serial dilutions) (Figure 2E). At the same time, prepare 10-1 to 10-6 serial dilutions for the recipient alone to obtain standard curves.
Note: Serial dilutions to be done depend on the level of antibacterial activity and need to be optimized.
Add 100 μL of each serial dilution to the 96-well plates (Figure 2F).
Run a Tecan microplate reader program for measuring bacterial cell growth (A600) for 15 h with 5 min intervals at the optimal temperature with shaking (Figure 2G).
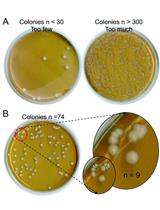
Note: To calculate a correlation between the initial number of surviving cells and the Te, plate 100 μL of recipient standard dilutions on selective agar plates. After incubation, count the number of colonies.
Plot the growth of the recipient standards and attacker:recipient suspensions over time and calculate the Te (Figure 2H). The Te could be represented on a graph alone (see Figures 6C and 7B) or with the standard curve (see Figure 5C).
Validation of protocol
CPR intensity is proportional to the number of lysed cells
To define whether the intensity of CPR correlates with the amount of released β-galactosidase, we first performed spectrophotometry analyses with lysed cells. LacZ+ W3110 E. coli K-12 cells were cultured at 37 °C to a A600nm of 1 in the presence of 0.1 mM IPTG and then lysed by sonication. The cleared supernatant was serially diluted and mixed with CPRG for 30 min; after quenching with 300 mM sodium carbonate, CPR concentration was spectrophotometrically measured using a microplate reader. Figure 3 shows that the CPR absorbance and fluorescence are function of the number of lysed cells, with a linear correlation ranging from 0.01 to 0.5 OD (R2 = 0.90 for absorbance and R2 = 0.95 for fluorescence).
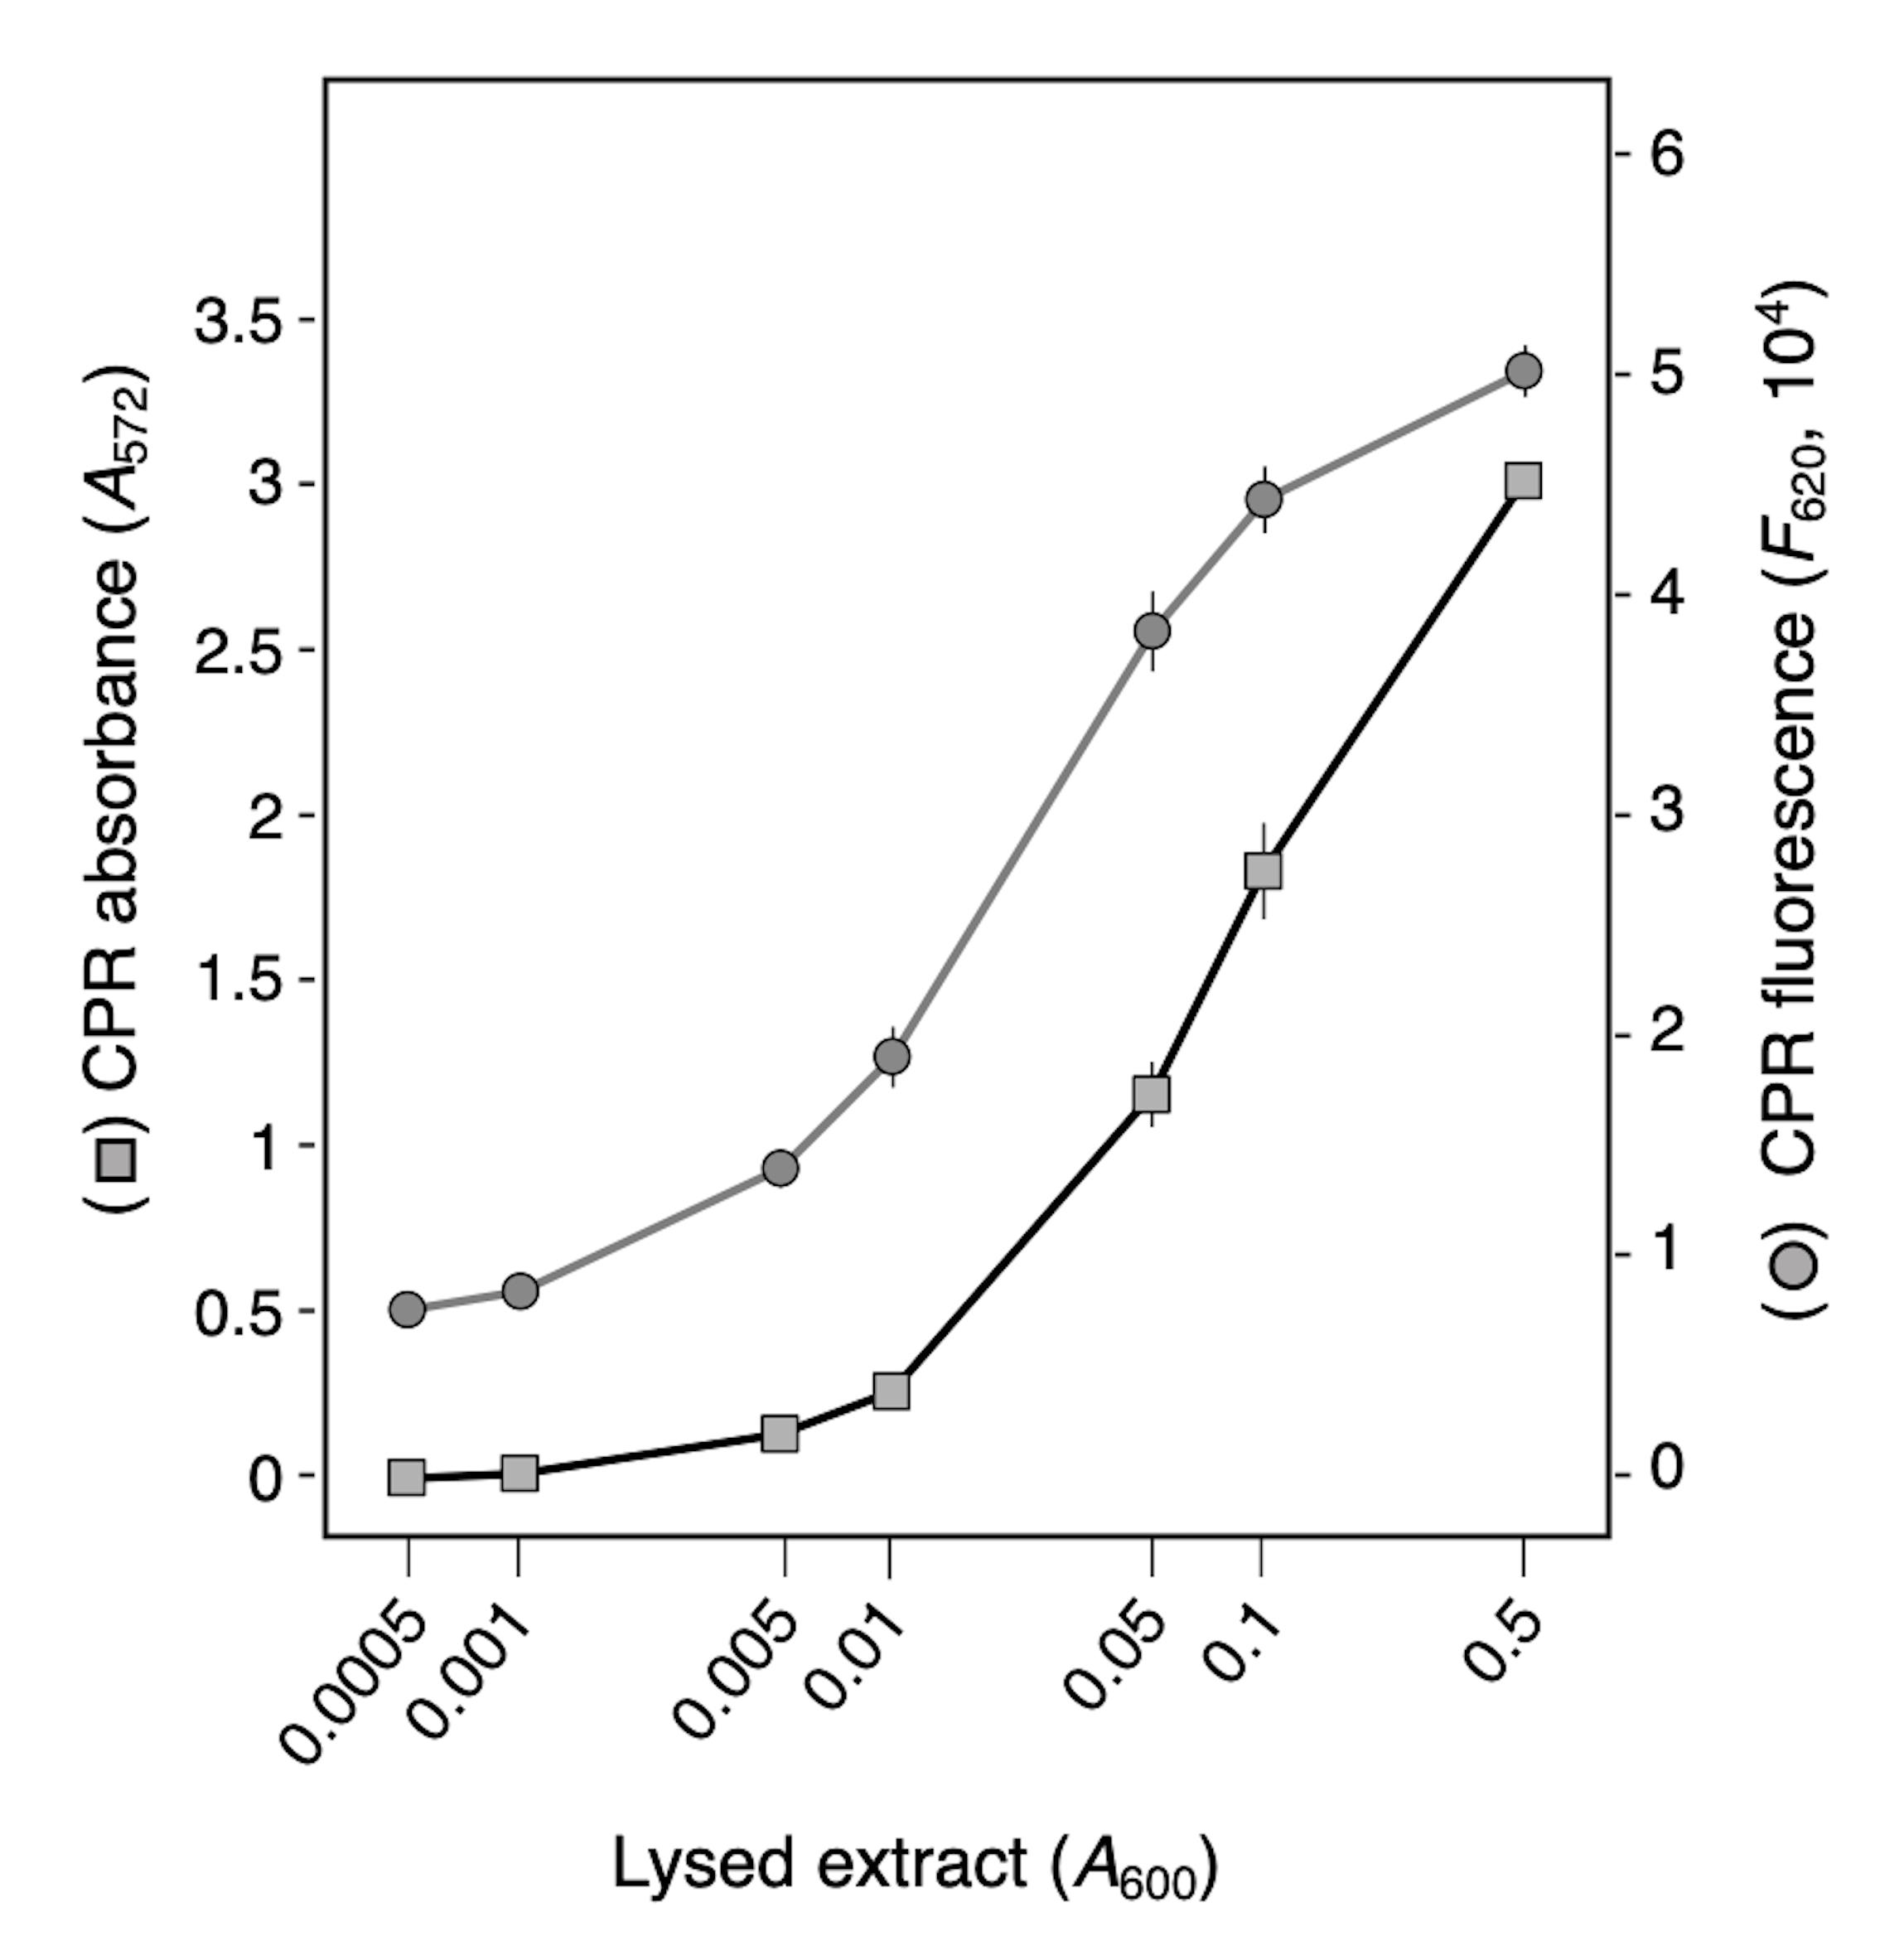
Figure 3. β-galactosidase activity in serially diluted cell lysed extracts. Absorbance (A572) and fluorescence (F620) of chlorophenol red (CPR) after 30 min of incubation of serial dilutions of E. coli W3110 cell lysate in the presence of chlorophenol-red β-D-galactopyranoside (CPRG). Values are the means of three biological replicates with standard deviations.Application of LAGA to estimate colicin activity
We first tested the applicability of the LAGA method to study colicin activity. Colicins are protein antibiotics released by E. coli and related species that penetrate and kill target cells through binding onto specific outer membrane receptors and translocation by exploiting transenvelope complexes such as the Tol (group A colicins) or TonB system (group B colicins) (Lazdunski et al., 1998; Cao and Klebba, 2002; Cascales et al., 2007; Housden and Kleanthous, 2012; Duché and Houot, 2019). 8 × 10⁸ wild-type (WT) susceptible (W3110) or group B–resistant (W3110 ∆tonB; KP1344) E. coli cells were mixed with purified group B colicin D with a multiplicity of infection of ~100 and CPRG. The amount of CPR was then measured spectrophotometrically over time using a microplate reader. Figure 4 shows that no lysis of wild-type or ∆tonB cells is observed in the absence of colicin D. In contrast, wild-type cells treated with colicin D released β-galactosidase, whereas ∆tonB cells did not. Similar results were obtained with group A colicins, but in agreement with the role of the Tol-Pal system in maintaining outer membrane integrity (Lazzaroni et al., 1999; Lloubès et al., 2001; Szczepaniak et al., 2020), tol mutants released a significant amount of β-galactosidase even in the absence of colicin, and hence cannot be employed as controls. However, the LAGA approach can be used to measure Tol-dependent phenotypes in addition to SDS sensitivity, blebbing, and RNase I leakage (Fognini-Lefebvre et al., 1987; Bernadac et al., 1998; Cascales et al., 2002). Taken together, these results demonstrate that the LAGA method could be used to monitor the antibacterial activity of colicins. The SGK method is not suitable for studying sensitivity to colicins or other contact-independent antibacterial toxins, as they will remain in the supernatant during the growth recovery, unless cells are washed before measuring cell growth.
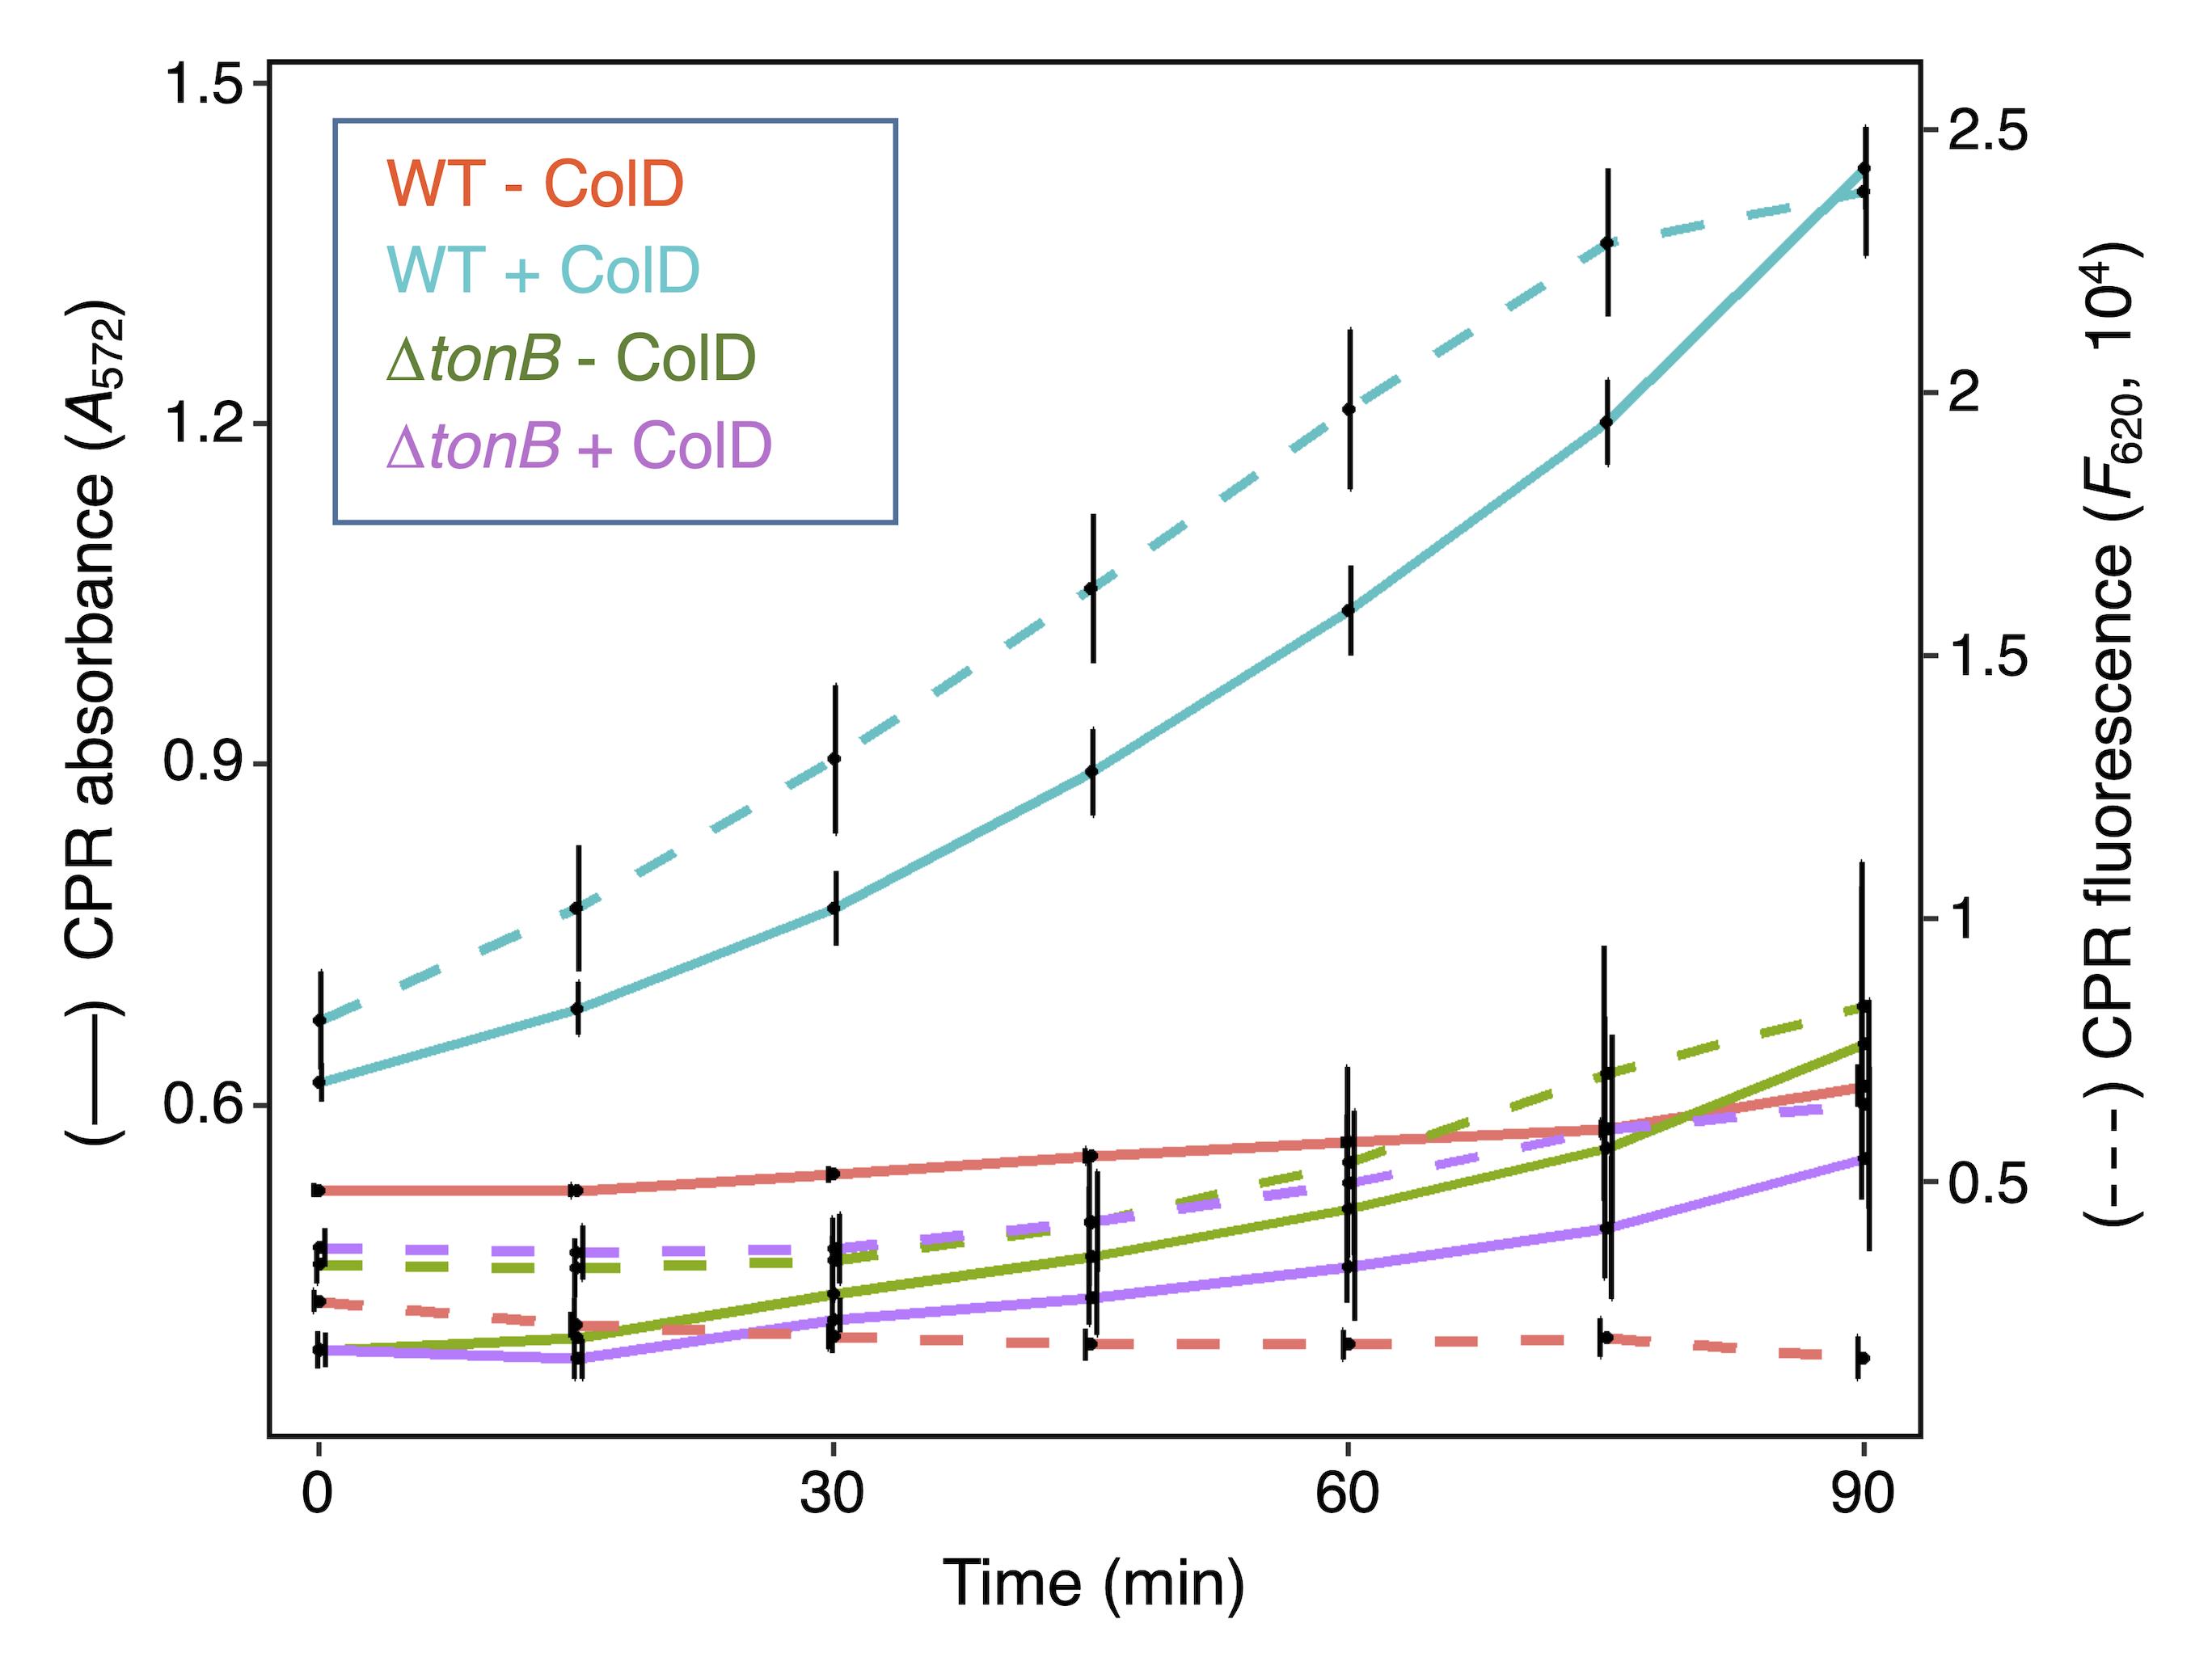
Figure 4. Colicin activity. Chlorophenol red (CPR) absorbance (A572, solid line) and fluorescence (F620, dashed line) of E. coli W3110 and ∆tonB cells treated (blue and purple) or not (red and green) with colicin D. Measurements were made every 15 min for 90 min after the addition of colicin and of chlorophenol-red β-D-galactopyranoside (CPRG). The mean of three biological replicates is indicated. The vertical bars represent standard deviations.Application of LAGA and SGK methods to estimate type VI secretion-mediated activity
The type VI secretion system (T6SS) is a multiprotein machine widespread in Gram-negative bacteria, that uses a contractile mechanism to inject effectors into target cells, including bacteria (Cianfanelli et al., 2016; Brackmann et al., 2017; Cherrak et al., 2019; Coulthurst, 2019; Wang et al., 2020). T6SSs secrete a broad range of toxin effectors that usually target essential macromolecules such as nucleic acids, proteins, lipids, or peptidoglycan (Hernandez et al., 2020; Jurėnas and Journet, 2021). T6SSs can be distinguished based on their behavior: offensive T6SSs, such as in enteroaggregative E. coli and Serratia marcescens, assemble independently of target cell and fire any cell upon contact (Brunet et al., 2013; Gerc et al., 2015). By contrast, defensive T6SSs, such as the Pseudomonas aeruginosa H1 or Acinetobacter baumannii T6SSs, respond to cell–cell contacts or to cell envelope defects including those induced by a T6SS attack (Mougous et al., 2007; LeRoux et al., 2012; Basler et al., 2013; LeRoux et al., 2015; Lin et al., 2022). We thus tested whether the LAGA and SGK methods can be applied to the study of offensive and defensive T6SSs.
Enteroaggregative E. coli T6SS
The enteroaggregative E. coli (EAEC) strain 17-2 has been previously shown to eliminate E. coli K12 cells using its Sci1 T6SS (Flaugnatti et al., 2016). We tested the ability of a series of 17-2 strain isogenic derivatives to eliminate E. coli W3110 cells carrying a plasmid conferring ampicillin resistance and mCherry fluorescence. The 17-2 strain derivatives were chosen to provide antibacterial activities ranging from no activity (∆sci1; deletion of the entire sci1 T6SS gene cluster; Brunet et al., 2014), intermediate activities (∆tagA and ∆clpV retaining ~12% and ~4% of T6SS activity, respectively; Santin et al., 2018; Douzi et al., 2016), to maximal activity (WT strain). Reporter and attacker cell suspensions were adjusted to an A600 of 0.8 and mixed in a 1:4 ratio and 10 μL drops were spotted on synthetic minimal medium (inducing sci1 T6SS gene expression; Brunet et al., 2011) agar plates and incubated for 4 h at 37 °C. As shown in Figure 5A and 5B, the LAGA assay recapitulated previously published data, with a significant decrease of CPRG hydrolysis when ∆sci1 cells are used as attackers compared to wild-type 17-2 cells, and intermediate antibacterial activities of ∆tagA and ∆clpV cells.
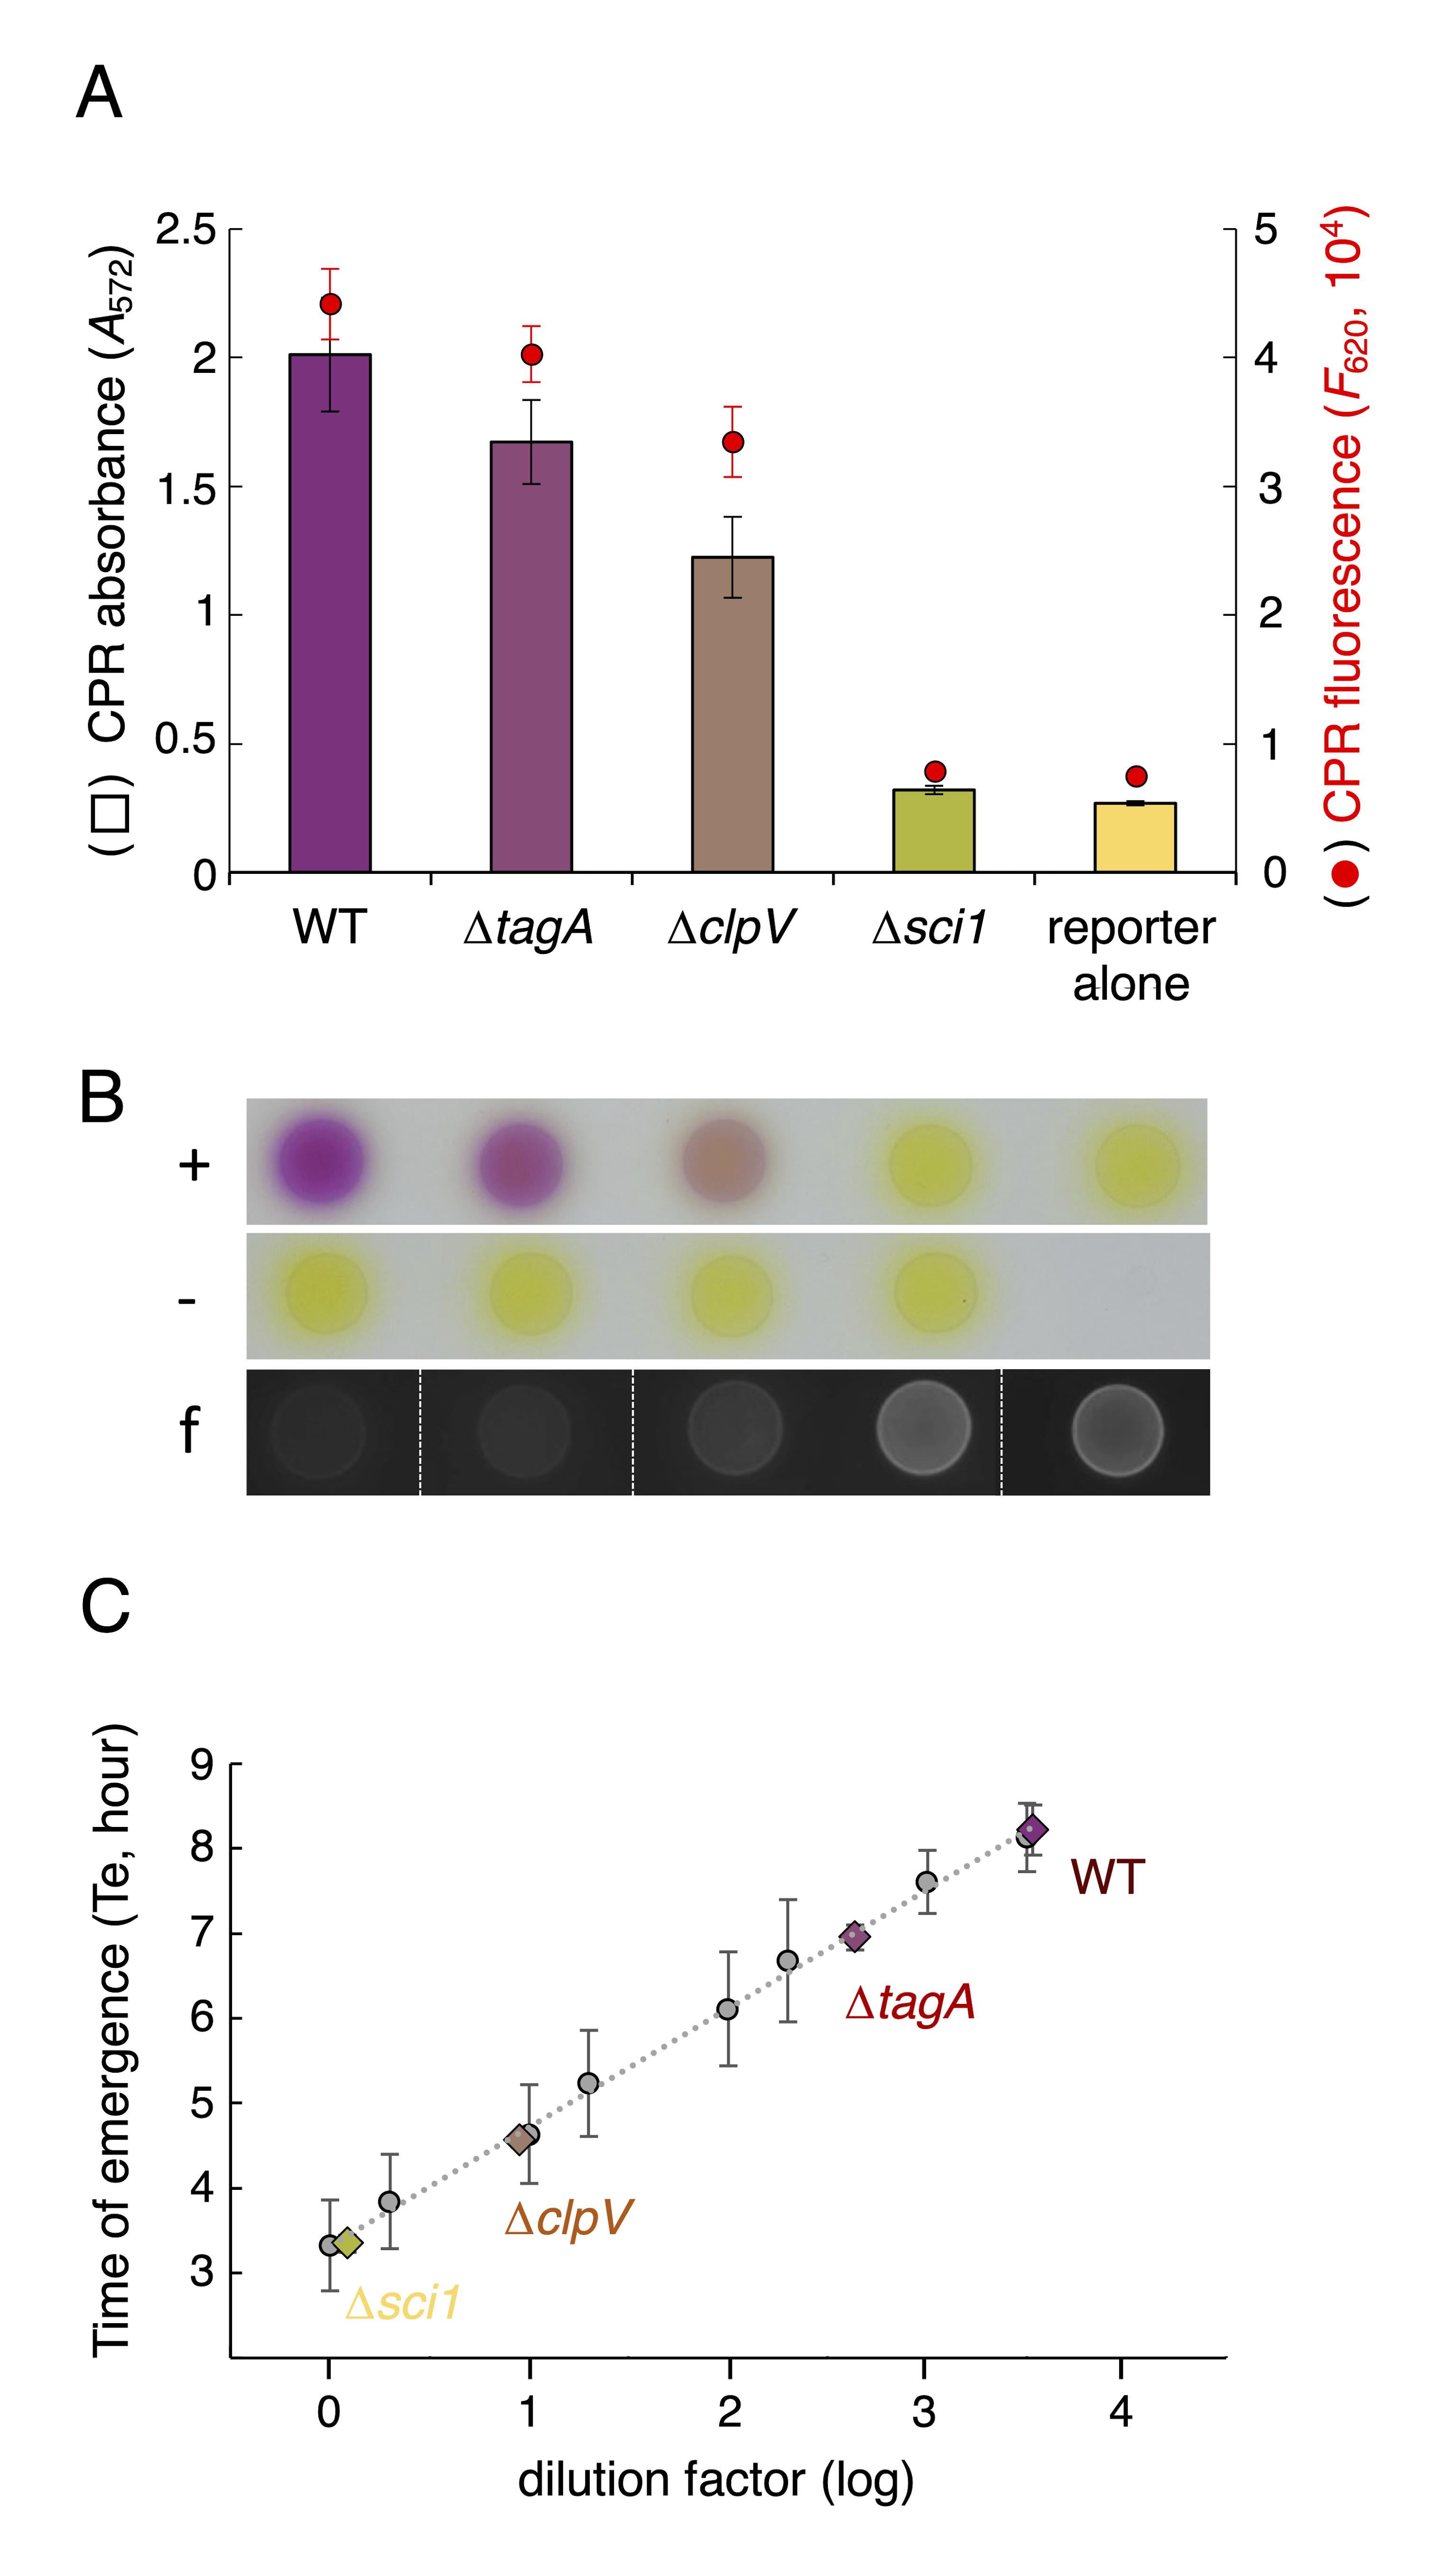
Figure 5. T6SS activity in enteroaggregative E. coli (EAEC) cells. (A) Chlorophenol red (CPR) absorbance (A572, bars) and fluorescence (F620, red dots) of E. coli W3110 reporter cells after 4 h of incubation with the indicated EAEC attacker cells on solid synthetic minimal medium (SIM) agar. The mean of three biological replicates is indicated. The error bars represent standard deviation. (B) Qualitative evaluation of interbacterial activity. E. coli W3110 reporter cells producing mCherry were incubated (+) or not (-) with the indicated EAEC attacker cells on SIM agar for 4 h, before addition of 1 mM of chlorophenol-red β-D-galactopyranoside (CPRG) on spots. Antibacterial activity can be evaluated by the coloration of the spot due to CPRG hydrolysis or by the extinction of reporter cell mCherry fluorescence (f). (C) Time of emergence (Te, in hours) of the reporter strain. After 4 h of incubation with the indicated EAEC attacker cells, the reporter strain is selectively outgrown in lysogeny broth (LB) supplemented with ampicillin (means of three biological replicates, color diamonds). The linear regression of Te values of the standards (dilutions of reporter cells grown alone) is shown in dotted line (grey dots, means of three biological replicates; vertical bars, standard deviations).Surviving recipient cells were then cultured in selective medium to measure the Te. Here, we used antibiotic for selective recovery, but any specific culture conditions excluding the attacker could be applied. To serve as standards, a recipient cell culture was serially diluted, and Te was measured. Figure 5C shows a linear regression of the Te values plotted as a function of the dilution factors (grey data points). Here, again, the data with the various T6SS mutant strains used as attackers were consistent with previous reports showing an absence of antibacterial activity of ∆sci1 cells (i.e., comparable to the recipient incubated in absence of attacker) and intermediate activities of ∆tagA and ∆clpV cells.
Pseudomonas aeruginosa H1-T6SS
P. aeruginosa strains usually carry several copies of T6SS gene clusters (Chen et al., 2015). Expression of the H1-T6SS, which is induced in the retS mutant background (Mougous et al., 2006), confers antibacterial activity (Hood et al., 2010; Russell et al., 2011). The H1-T6SS belongs to the family of the defensive T6SSs, as it has been established that it is activated by signals from lysed kin cells and by cell envelope damages such as those resulting from a T6SS attack by competitor cells (Basler et al., 2013; Ho et al., 2013; LeRoux et al., 2015). In agreement with these observations, the non-aggressive T6SS- strains DH5α pCR2.1, MG1655, and W3110 were lysed by P. aeruginosa PAK ∆retS cells with very low efficiency, while the aggressive T6SS+ EAEC 17-2 strain was efficiently lysed in a H1-T6SS-dependent manner when mixed in 1:1 ratio and incubated for 4 h (Figure 6A). Strains alone, as well as recipient strains mixed with the PAK∆retS∆H1-T6SS strain, remain yellow, indicating the absence of E. coli lysis.
We then tested different attacker strains of P. aeruginosa PAK: PAK∆retS∆tse1-tsi1 lacking the lytic amidase Tse1 and its immunity Tsi1, and PAK∆retS∆pppA lacking the PppA phosphatase that quenches the post-translation activation cascade (Figure 6B, lower panels). The results show that PAK lytic ability was strongly affected by the absence of the Tse1 effector. In contrast, the absence of PppA increased the antibacterial efficiency of the H1-T6SS apparatus, as previously shown (Mougous et al., 2007; Basler et al., 2013). To quantify the antibacterial activity of these strains, we measured the CPR absorbance after the addition of CPRG to the supernatants of the attacker/recipient mixtures (Figure 6B, upper panels). The spectrophotometric values correlated with the differences in coloration observed on agar plates. The LAGA protocol is thus sensitive enough to discriminate different levels of T6SS activity in P. aeruginosa.
We then performed the SGK protocol by monitoring recipient growth recovery. Here, again, the results shown in Figure 6C demonstrate that, with the exception of strain lacking Tse1, the times of emergence correlated well with the results of the LAGA assay. While the SGK assay measures cell survival, the LAGA assay measures β-galactosidase leakage and thus cell lysis. Because cell death is not necessarily associated to cell lysis, the difference for the PAK∆retS∆tse1-tsi1 can be explained by the fact that the Tse1 amidase causes the death of the recipient bacterium but does not lead to its lysis, as previously described (Russell et al., 2011; Chou et al., 2012). These data demonstrate that the two methods described here are relevant and complementary to better understand competition mechanisms.
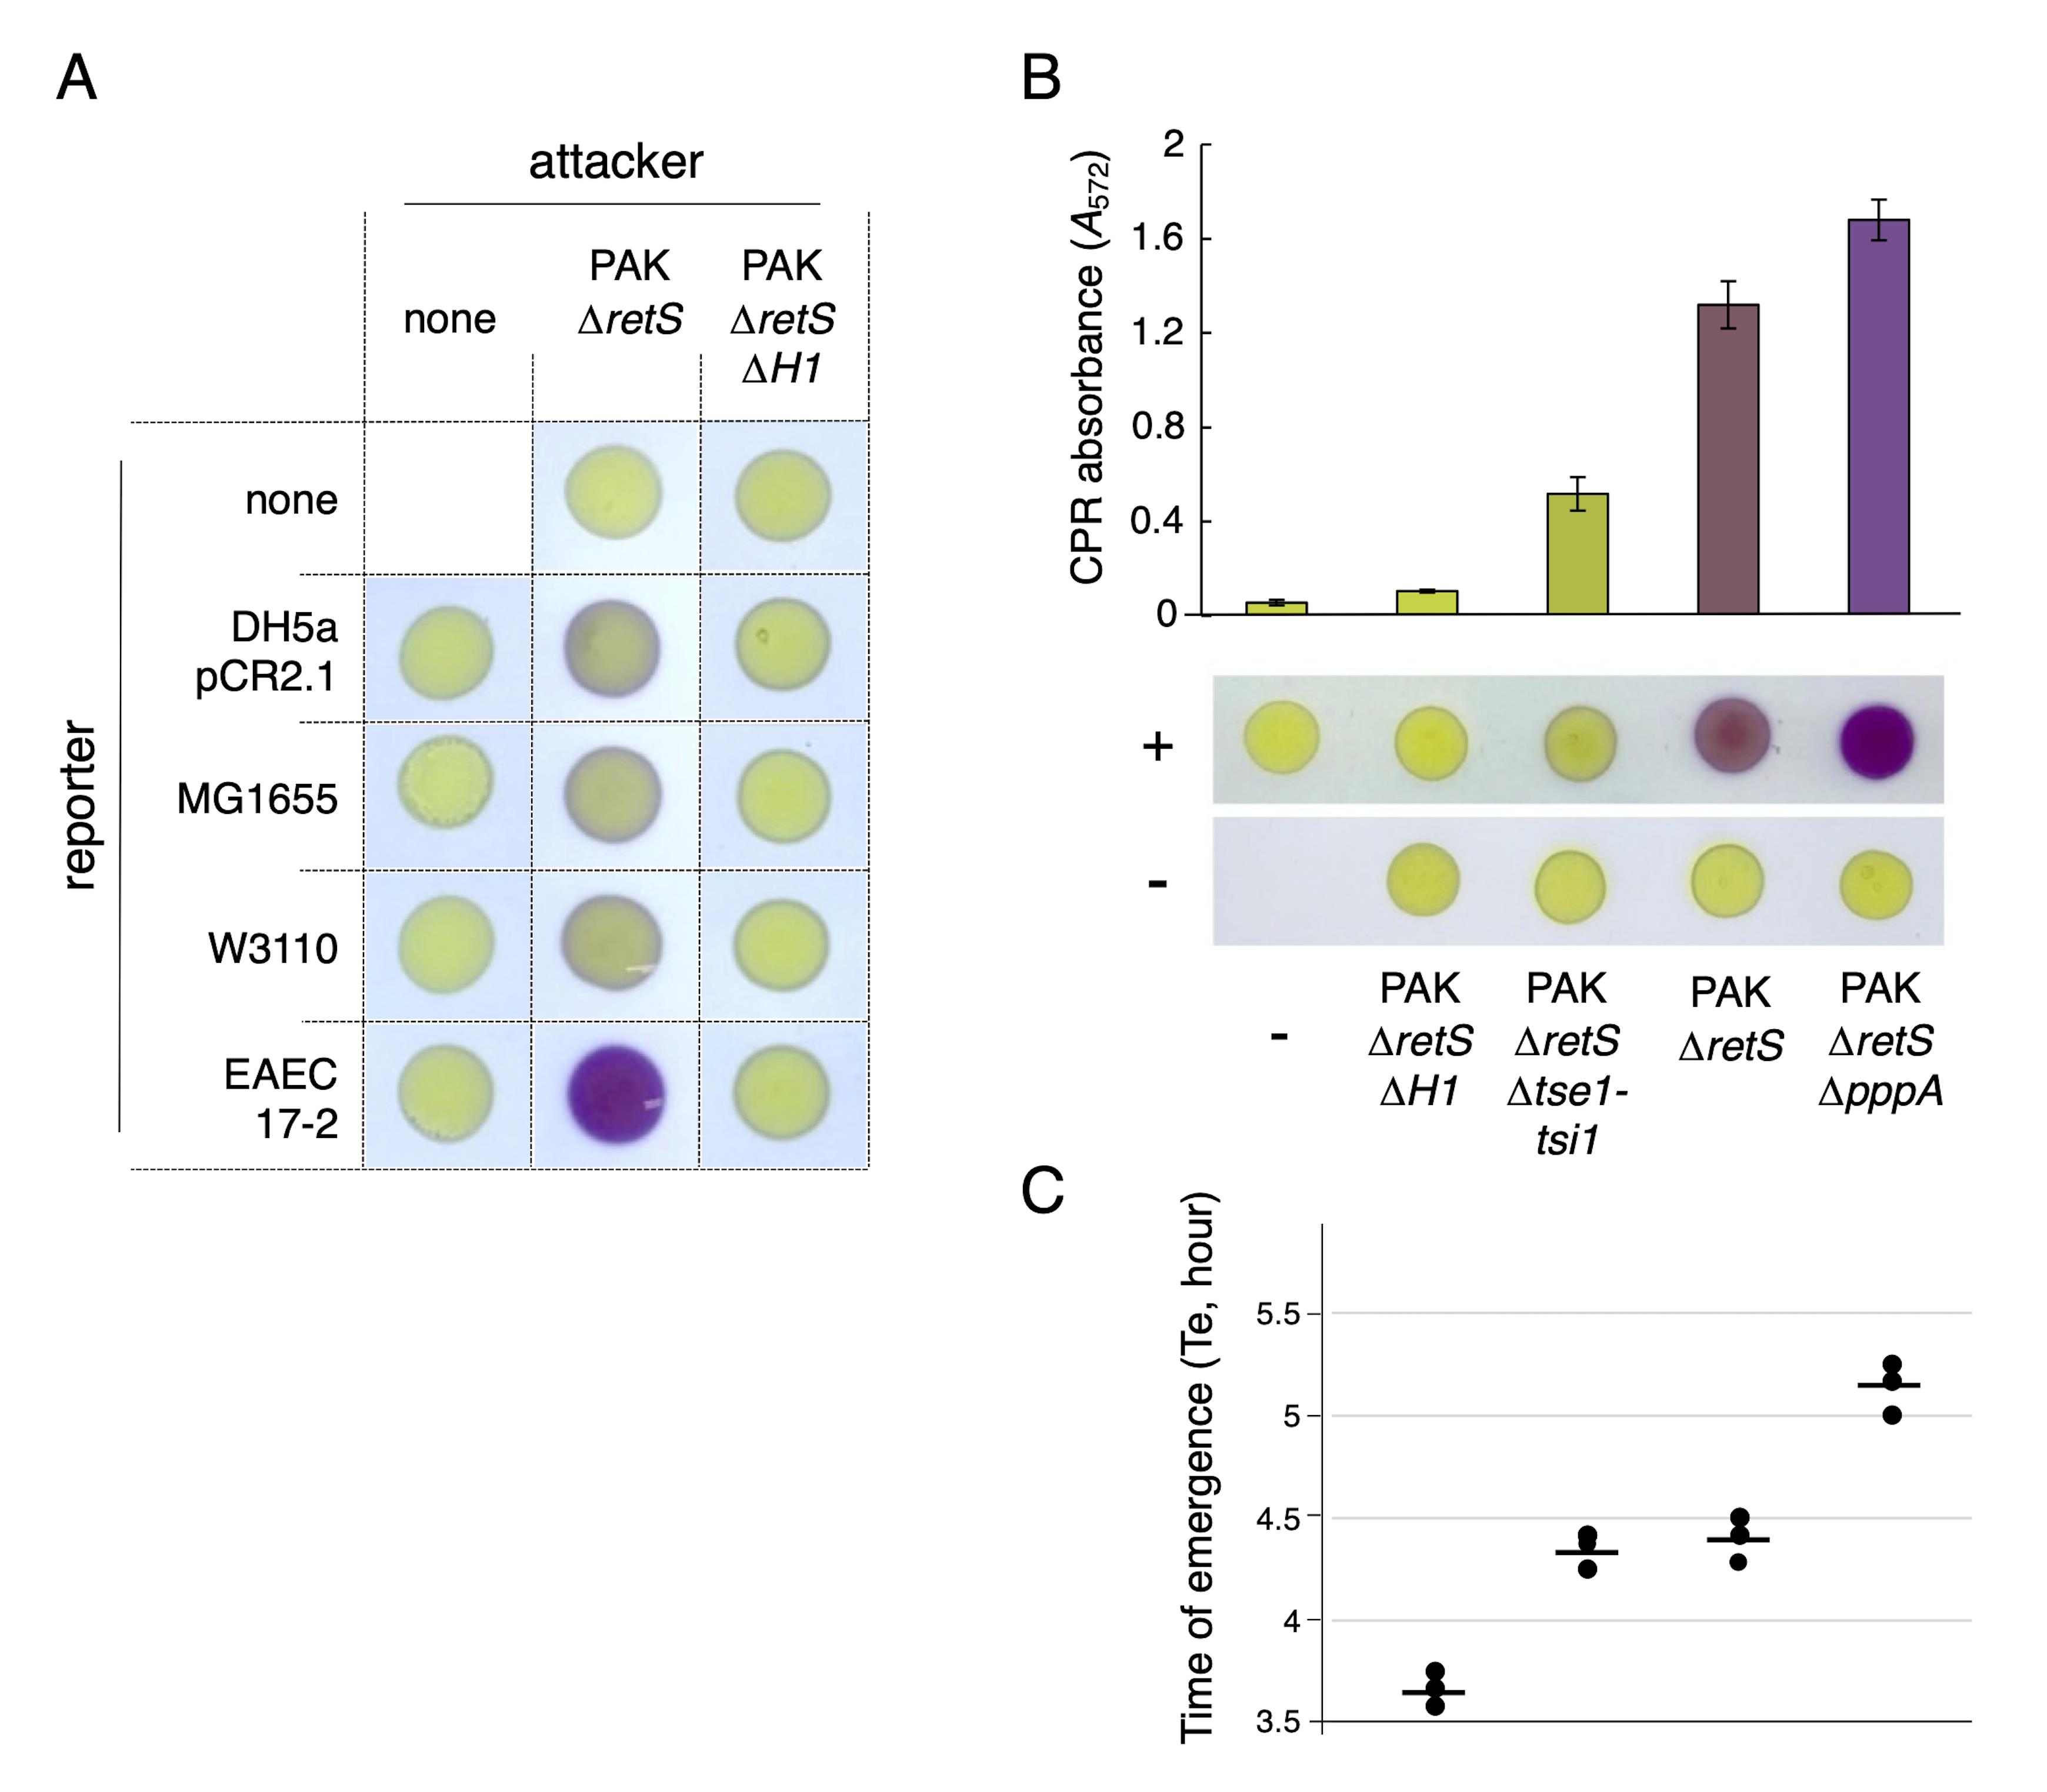
Figure 6. H1-T6SS activity in P. aeruginosa PAK. (A) Selection of the best E. coli prey for antibacterial assay with P. aeruginosa PAK. Qualitative evaluation of P. aeruginosa PAK antibacterial activity using the lysis-associated β-galactosidase assay (LAGA) assay. The indicated attacker and recipient reporter strains were mixed and incubated for 4 h before addition of 1 mM of chlorophenol-red β-D-galactopyranoside (CPRG) on spots. The antibacterial activity can be evaluated by the coloration of the spot due to CPRG hydrolysis. (B and C) Antibacterial activity of P. aeruginosa PAK mutant strains. (B) Competition assays with the indicated P. aeruginosa PAK strains as attackers and enteroaggregative E. coli (EAEC) strain 17-2 pBBR1MCS-5 as recipient. P. aeruginosa and E. coli cells were grown in lysogeny broth (LB) medium to an A600 of 2 and in synthetic minimal medium (SIM) to an A600 of 0.8, respectively. Attackers and recipients were mixed in a 1:1 (v:v) ratio, and 10 μL of each mixture were spotted on dried LB agar plates and incubated for 4 h at 37 °C. Cells alone were spotted as controls. The lower panels show the spot assay with (+) or without (-) the recipient. The upper graph shows chlorophenol red (CPR) absorbance in the supernatants. (C) Time of emergence (Te, in hours) of the reporter EAEC 17-2 pBBR1MCS-5 strain after incubation with the indicated P. aeruginosa PAK attacker strains. The three biological replicate values (dots) and means (horizontal bars) are shown.
Application of LAGA and SGK methods to measure Myxococcus predation
M. xanthus is a predatory bacterium that hunts, attacks, and kills other microorganisms using a cell–cell contact mechanism involving the Kil Tad–like apparatus (Thiery and Kaimer, 2020; Zhang et al., 2020; Seef et al., 2021; Thiery et al., 2022). Mutation of genes encoding Tad subunits results in a partial or total loss of M. xanthus predation efficiency (Seef et al., 2021; Thiery et al., 2022). The LAGA colorimetric assay was optimized to evaluate predation by M. xanthus using kil mutants presenting intermediate (∆kilK and ∆kilKL) or null (∆kilC and ∆kilACF) predation efficiency (Seef et al., 2021).
The predation assay was performed in clone fruiting (CF) liquid medium for 24 h with M. xanthus as predator and lacZ+ E. coli MG1655 as prey, in a 1:20 ratio, by mixing 100 μL of E. coli at A600 of 10 and 100 μL of M. xanthus at A600 of 0.5. Measures of the A572 after addition of CPRG in culture supernatant revealed that predation levels of the ∆kilK and ∆kilKL strains were 1.5–2 times lower than the wild type, while β-galactosidase activities were comparable to the prey in absence of predator for the ∆kilC or ∆kilACF strains (Figure 7A). This result suggests that the LAGA CPRG colorimetric assay is an appropriate method to evaluate M. xanthus predation efficiency and is sensitive and robust enough to reveal subtle differences in its capacity to lyse a prey.
To test the SGK assay, a suspension of kanamycin-resistant E. coli cells was mixed with the different M. xanthus strain suspensions adjusted to an A600 of 5 in a predator:prey ratio of 1:8, and 10 μL were spotted on a CF agar plate. After 7 h of predation, cells were harvested, and the Te was measured to determine the relative number of E. coli cells that survived to predation. Figure 7B shows that all kil mutants presented an increase in E. coli survival in comparison to WT. In terms of predation, no intermediate phenotypes could be observed for ∆kilK and ∆kilKL. This method is therefore suitable to quantify the killing activity of M. xanthus. However, the difference between the LAGA and SGK for the kilKL and kilK mutants suggests that the SGK assay is not sensitive enough to reveal intermediate efficiencies, or that these mutants cause quasi-lysis, as shown for colicinogenic bacteria (Pugsley, 1983), an increase of cell permeability with limited impact on survival.
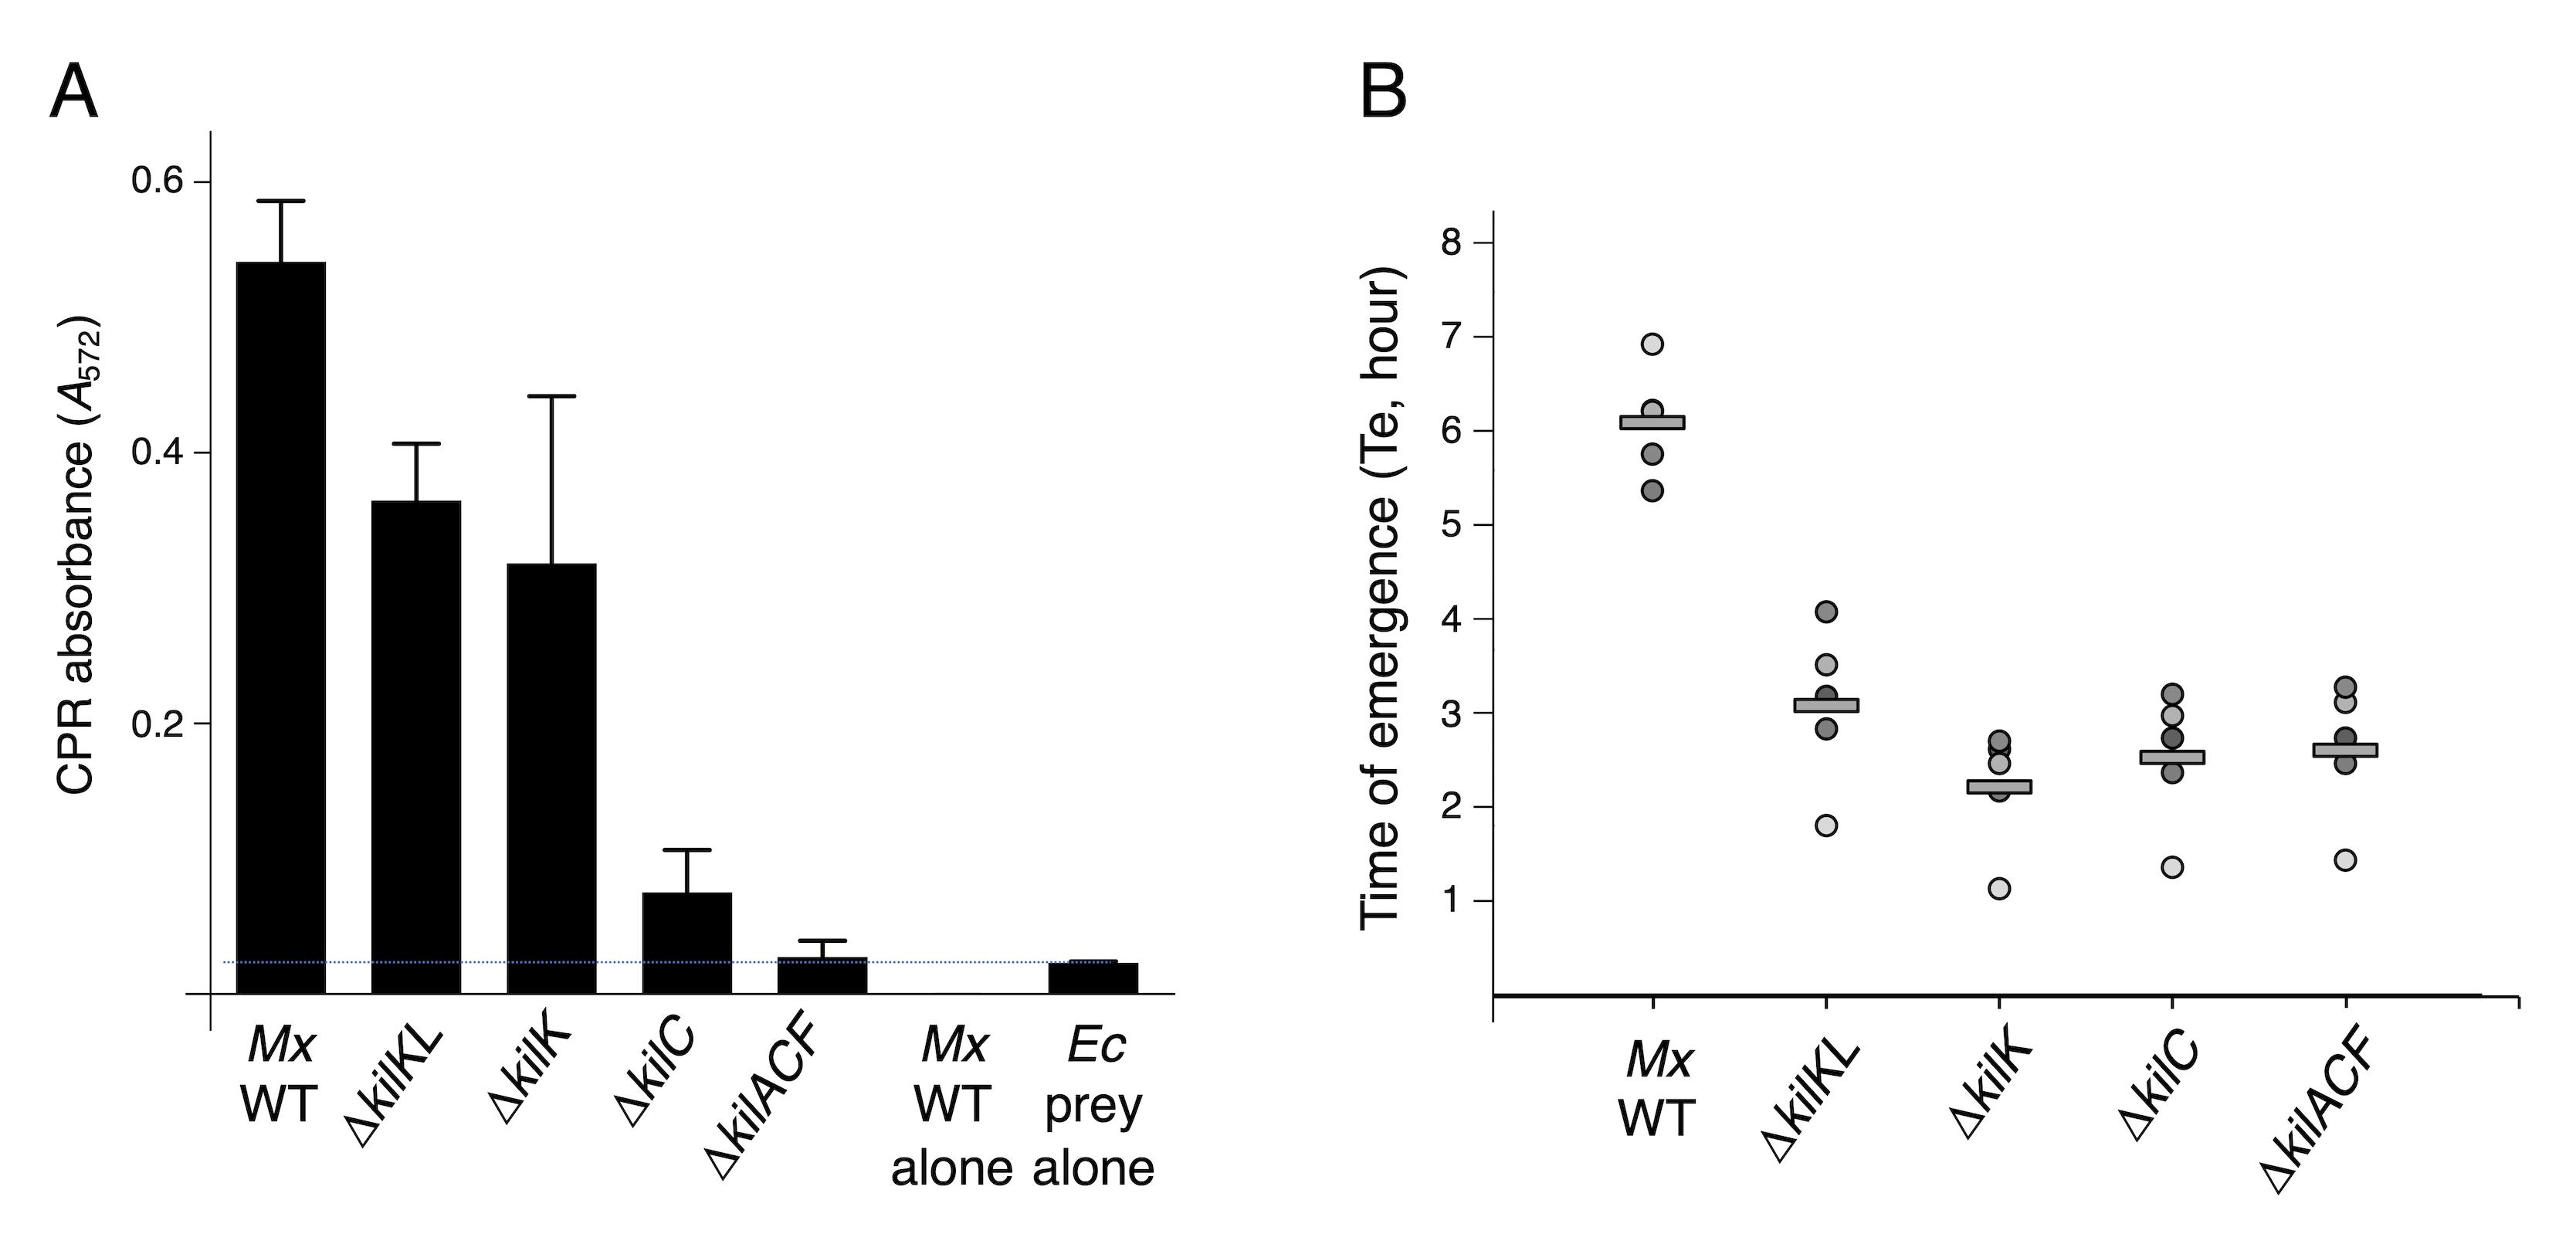
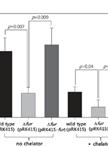
Figure 7. M. xanthus predatory activity. (A) Chlorophenol red (CPR) absorbance (A572) of the supernatants of co-incubation between the indicated Myxococcus strains as predators and E. coli MG1655 as prey for 24 h. The mean and standard deviations of three independent experiments are shown. The blue dotted horizontal bar represents the lysis of the prey alone. (B) Quantitative measure of M. xanthus predation over E. coli after 7 h of co-incubation using the survivors growth kinetics (SGK) method. Time of emergence (Te, in hours) of the MG1655 prey strain after incubation with the indicated M. xanthus predator strains. The five biological replicate values (dots) and means (horizontal black bars) are shown.
Conclusive remarks
We describe here the adaptation of a CPRG-based approach to estimate antibacterial competition, LAGA, and a quantitative and complementary approach, SGK. The first procedure measures the amount of CPR (red) due to the hydrolysis of CPRG (yellow) by the β-galactosidase released by bacterial lysis. The second procedure measures the amount of surviving attacker/recipient cells by following their growth in a selective medium. The two procedures are complementary: LAGA allows to measure lysis while SGK measures survival. The importance of using the two approaches has been exemplified here. As shown for P. aeruginosa Tse1 mutant, cell death is not systematically associated with cell lysis. By contrast, the M. xanthus kilK and kilKL examples showed that, in some conditions, bacteria can survive quasi-lysis. Hence, the systematic use of the two methods may help to better understand the molecular mechanisms underlying interbacterial competition by discriminating processes responsible for cell death and lysis, cell death without lysis, or survival to quasi-lysis.
Although these approaches are based on the use of recipient cells with specificities (producing the β-galactosidase for LAGA, presenting a character permitting selection for SGK), the two methods have significant advantages: they are simple to set up and optimize in any laboratory, fast, inexpensive, and not laborious. In addition, the two approaches can be adapted to different attacker bacterial species.
Acknowledgments
The LAGA protocol was adapted from previous studies (Vettiger and Basler, 2016; Sgro et al., 2018; Bayer-Santos et al., 2019; Schneider et al., 2019; Seef et al., 2021). We thank the members of the Cascales, Mignot, and Bordi laboratories for discussions and support, Kathleen Postle (Penn state University, USA) and Denis Duché (LISM, Marseille) for providing strain KP1344 and purified colicin D, respectively, Moly Ba, Annick Brun, and Audrey Gozzi for technical support, and the four anonymous referees for their very constructive comments and suggestions. This work was supported by the Centre National de la Recherche Scientifique, the Aix-Marseille Université, and by grants from the Agence Nationale de la Recherche (ANR-20-CE11-0017), the Fondation pour la Recherche Médicale (FRM, DEQ20180339165) and the Excellence Initiative of Aix-Marseille University - A*MIDEX, a French “Investissements d’Avenir” program (A-M-AAP-ID-17-33-170301-07.22) to E.C.
Competing interests
The authors declare that they have no competing interests.
Ethical considerations
Ethics approval was not required for this study.
References
- Alcoforado Diniz, J., Hollmann, B. and Coulthurst, S. J. (2017). Quantitative Determination of Anti-bacterial Activity During Bacterial Co-culture. Methods Mol Biol 1615: 517-524.
- Basler, M., Ho, B. T. and Mekalanos, J. J. (2013). Tit-for-tat: type VI secretion system counterattack during bacterial cell-cell interactions. Cell 152(4): 884-894.
- Bayer-Santos, E., Cenens, W., Matsuyama, B. Y., Oka, G. U., Di Sessa, G., Mininel, I. D. V., Alves, T. L. and Farah, C. S. (2019). The opportunistic pathogen Stenotrophomonas maltophilia utilizes a type IV secretion system for interbacterial killing. PLoS Pathog 15(9): e1007651.
- Bernadac, A., Gavioli, M., Lazzaroni, J. C., Raina, S. and Lloubes, R. (1998). Escherichia coli tol-pal mutants form outer membrane vesicles. J Bacteriol 180(18): 4872-4878.
- Brackmann, M., Nazarov, S., Wang, J. and Basler, M. (2017). Using Force to Punch Holes: Mechanics of Contractile Nanomachines.Trends Cell Biol 27(9): 623-632.
- Brunet, Y. R., Bernard, C. S., Gavioli, M., Lloubès, R., and Cascakes, E. (2011). An epigenetic switch involving overlapping Fur and DNA methylation optimizes expression of a type VI secretion gene cluster.PLoS Genet 7: e1002205.
- Brunet, Y. R., Espinosa, L., Harchouni, S., Mignot, T. and Cascales, E. (2013). Imaging type VI secretion-mediated bacterial killing. Cell Rep 3(1): 36-41.
- Brunet, Y. R., Hénin, J., Celia, H. and Cascales, E. (2014). Type VI secretion and bacteriophage tail tubes share a common assembly pathway. EMBO Rep 15(3): 315-321.
- Cao, Z., Casabona, M. G., Kneuper, H., Chalmers, J. D. and Palmer, T. (2016). The type VII secretion system of Staphylococcus aureus secretes a nuclease toxin that targets competitor bacteria. Nat Microbiol 2: 16183.
- Cao, Z. and Klebba, P. E. (2002). Mechanisms of colicin binding and transport through outer membrane porins. Biochimie 84(5-6): 399-412.
- Cascales, E., Bernadac, A., Gavioli, M., Lazzaroni, J. C. and Lloubes, R. (2002). Pal lipoprotein of Escherichia coli plays a major role in outer membrane integrity. J Bacteriol 184(3): 754-759.
- Cascales, E., Buchanan, S. K., Duché, D., Kleanthous, C., Lloubès, R., Postle, K., Riley, M., Slatin, S. and Cavard, D. (2007). Colicin biology. Microbiol Mol Biol Rev 71(1): 158-229.
- Chassaing, B. and Cascales, E. (2018). Antibacterial weapons: targeted destruction in the microbiota. Trends Microbiol 26(4): 329-338.
- Chen, L., Zou, Y., She, P. and Wu, Y. (2015). Composition, function, and regulation of T6SS in Pseudomonas aeruginosa. Microbiol Res 172: 19-25.
- Cherrak, Y., Flaugnatti, N., Durand, E., Journet, L. and Cascales, E. (2019). Structure and Activity of the Type VI Secretion System. Microbiol Spectr 7(4). doi: 10.1128/microbiolspec.PSIB-0031-2019.
- Chou, S., Bui, N. K., Russell, A. B., Lexa, K. W., Gardiner, T. E., LeRoux, M., Vollmer, W. and Mougous, J. D. (2012). Structure of a peptidoglycan amidase effector targeted to Gram-negative bacteria by the type VI secretion system. Cell Rep 1(6): 656-664.
- Cianfanelli, F. R., Monlezun, L. and Coulthurst, S. J. (2016). Aim, Load, Fire: The Type VI Secretion System, a Bacterial Nanoweapon. Trends Microbiol 24(1): 51-62.
- Coulthurst, S. (2019). The type VI secretion system: a versatile bacterial weapon. Microbiology (Reading) 165(5): 503-515.
- Douzi, B., Brunet, Y. R., Spinelli, S., Lensi, V., Legrand, P., Blangy, S., Kumar, A., Journet, L., Cascales, E. and Cambillau, C. (2016). Structure and specificity of the Type VI secretion system ClpV-TssC interaction in enteroaggregative Escherichia coli. Sci Rep 6: 34405.
- Duché, D. and Houot, L. (2019). Similarities and differences between colicin and filamentous phage uptake by bacterial cells. EcoSal Plus. 8(2). doi: https://doi.org/10.1128/ecosalplus.ESP-0030-2018.
- Flaugnatti, N., Le, T. T., Canaan, S., Aschtgen, M. S., Nguyen, V. S., Blangy, S., Kellenberger, C., Roussel, A., Cambillau, C., Cascales, E., et al. (2016). A phospholipase A1 antibacterial Type VI secretion effector interacts directly with the C-terminal domain of the VgrG spike protein for delivery. Mol Microbiol 99(6): 1099-1118.
- Fognini-Lefebvre, N., Lazzaroni, J. C. and Portalier, R. (1987). tolA, tolB and excC, three cistrons involved in the control of pleiotropic release of periplasmic proteins by Escherichia coli K12. Mol Gen Genet 209(2): 391-395.
- Gerc, A. J., Diepold, A., Trunk, K., Porter, M., Rickman, C., Armitage, J. P., Stanley-Wall, N. R. and Coulthurst, S. J. (2015). Visualization of the Serratia Type VI Secretion System Reveals Unprovoked Attacks and Dynamic Assembly. Cell Rep 12(12): 2131-2142.
- Ghoul, M. and Mitri, S. (2016). The ecology and evolution of microbial competition. Trends Microbiol 24(10): 833-845.
- Granato, E. T., Meiller-Legrand, T. A. and Foster, K. R. (2019). The evolution and ecology of bacterial warfare. Curr Biol 29(11): R521-R537.
- Hazan, R., Que, Y. A., Maura, D. and Rahme, L. G. (2012). A method for high throughput determination of viable bacteria cell counts in 96-well plates. BMC Microbiol 12: 259.
- Hernandez, R. E., Gallegos-Monterrosa, R. and Coulthurst, S. J. (2020). Type VI secretion system effector proteins: Effective weapons for bacterial competitiveness. Cell Microbiol 22(9): e13241.
- Ho, B. T., Basler, M. and Mekalanos, J. J. (2013). Type 6 secretion system-mediated immunity to type 4 Secretion system-mediated gene transfer. Science 342(6155): 250-253.
- Hood, R. D., Singh, P., Hsu, F., Guvener, T., Carl, M. A., Trinidad, R. R., Silverman, J. M., Ohlson, B. B., Hicks, K. G., Plemel, R. L., et al. (2010). A type VI secretion system of Pseudomonas aeruginosa targets a toxin to bacteria. Cell Host Microbe 7(1): 25-37.
- Housden, N. G. and Kleanthous, C. (2012). Colicin translocation across the Escherichia coli outer membrane. Biochem Soc Trans 40(6): 1475-1479.
- Jurėnas, D. and Journet, L. (2021). Activity, delivery, and diversity of type VI secretion effectors. Mol Microbiol 115(3): 383-394.
- Kleanthous, C. (2010). Swimming against the tide: progress and challenges in our understanding of colicin translocation. Nat Rev Microbiol 8: 843-848.
- Lazdunski, C. J., Bouveret, E., Rigal, A., Journet, L., Lloubès, R. and Bénédetti, H. (1998). Colicin import into Escherichia coli cells. J Bacteriol 180(19): 4993-5002.
- Lazzaroni, J. C., Germon, P., Ray, M. C. and Vianney, A. (1999). The Tol proteins of Escherichia coli and their involvement in the uptake of biomolecules and outer membrane stability. FEMS Microbiol Lett 177(2): 191-197.
- LeRoux, M., De Leon, J. A., Kuwada, N. J., Russell, A. B., Pinto-Santini, D., Hood, R. D., Agnello, D. M., Robertson, S. M., Wiggins, P. A. and Mougous, J. D. (2012). Quantitative single-cell characterization of bacterial interactions reveals type VI secretion is a double-edged sword. Proc Natl Acad Sci U S A 109(48): 19804-19809.
- LeRoux, M., Kirkpatrick, R. L., Montauti, E. I., Tran, B. Q., Peterson, S. B., Harding, B. N., Whitney, J. C., Russell, A. B., Traxler, B., Goo, Y. A., et al. (2015). Kin cell lysis is a danger signal that activates antibacterial pathways of Pseudomonas aeruginosa. Elife 4: e05701.
- Lin, H. H. and Lai, E. M. (2020). A High-throughput Interbacterial Competition Platform. Bio Protoc 10(17): e3736.
- Lin, L., Capozzoli, R., Ferrand, A., Plum, M., Vettiger, A. and Basler, M. (2022). Subcellular localization of type VI secretion system assembly in response to cell-cell contact. EMBO J 41(13): e108595.
- Lloubès, R., Cascales, E., Walburger, A., Bouveret, E., Lazdunski, C., Bernadac, A. and Journet, L. (2001). The Tol-Pal proteins of the Escherichia coli cell envelope: an energized system required for outer membrane integrity? Res Microbiol 152(6): 523-529.
- Luo, A., Wang, F., Sun, D., Liu, X. and Xin, B. (2022). Formation, Development, and Cross-Species Interactions in Biofilms. Front Microbiol 12: 757327.
- MacIntyre, D. L., Miyata, S. T., Kitaoka, M. and Pukatzki, S. (2010). The Vibrio cholerae type VI secretion system displays antimicrobial properties. Proc Natl Acad Sci USA 107(45):19520-19524.
- Mougous, J. D., Cuff, M. E., Raunser, S., Shen, A., Zhou, M., Gifford, C. A., Goodman, A. L., Joachimiak, G., Ordonez, C. L., Lory, S., et al. (2006). A virulence locus of Pseudomonas aeruginosa encodes a protein secretion apparatus. Science 312(5779): 1526-1530.
- Mougous, J. D., Gifford, C. A., Ramsdell, T. L. and Mekalanos, J. J. (2007). Threonine phosphorylation post-translationally regulates protein secretion in Pseudomonas aeruginosa.Nat Cell Biol 9(7): 797-803.
- Pugsley, A. P. (1983). Obligatory coupling of colicin release and lysis in mitomycin-treated Col+ Escherichia coli.J Gen Microbiol 129(6): 1921-1928.
- Ruhe, Z. C., Low, D. A. and Hayes, C. S. (2013). Bacterial contact-dependent growth inhibition. Trends Microbiol 21(5): 230-237.
- Russell, A. B., Hood, R. D., Bui, N. K., LeRoux, M., Vollmer, W. and Mougous, J. D. (2011). Type VI secretion delivers bacteriolytic effectors to target cells. Nature 475(7356): 343-347.
- Santin, Y. G., Santin, Y. G., Doan, T., Lebrun, R., Journet, L. and Cascales, E. (2018). In vivo TssA proximity labelling during type VI secretion biogenesis reveals TagA as a protein that stops and holds the sheath. Nat Microbiol 3: 1304-1313.
- Schneider, J. P., Nazarov, S., Adaixo, R., Liuzzo, M., Ringel, P. D., Stahlberg, H. and Basler, M. (2019). Diverse roles of TssA-like proteins in the assembly of bacterial type VI secretion systems. EMBO J 38(18): e100825.
- Seef, S., Herrou, J., de Boissier, P., My, L., Brasseur, G., Robert, D., Jain, R., Mercier, R., Cascales, E., Habermann, B. H. et al. (2021). A Tad-like apparatus is required for contact-dependent prey killing in predatory social bacteria. Elife 10: e72409.
- Sgro, G. G., Costa, T. R. D., Cenens, W., Souza, D. P., Cassago, A., Coutinho de Oliveira, L., Salinas, R. K., Portugal, R. V., Farah, C. S. and Waksman, G. (2018). Cryo-EM structure of the bacteria-killing type IV secretion system core complex from Xanthomonas citri. Nat Microbiol 3(12): 1429-1440.
- Sgro, G. G., Oka, G. U., Souza, D. P., Cenens, W., Bayer-Santos, E., Matsuyama, B. Y., Bueno, N. F., Dos Santos, T. R., Alvarez-Martinez, C. E., Salinas, R. K., et al. (2019). Bacteria-Killing Type IV Secretion Systems. Front Microbiol 10: 1078.
- Sicard, C., Shek, N., White, D., Bowers, R. J., Brown, R. S. and Brennan, J. D. (2014). A rapid and sensitive fluorimetric β-galactosidase assay for coliform detection using chlorophenol red-β-d-galactopyranoside. Anal Bioanal Chem 406(22): 5395-5403.
- Stubbendieck, R. M. and Straight, P. D. (2016). Multifaceted interfaces of bacterial competition. J Bacteriol 198(16): 2145-2155.
- Szczepaniak, J., Press, C. and Kleanthous, C. (2020). The multifarious roles of Tol-Pal in Gram-negative bacteria. FEMS Microbiol Rev 44(4): 490-506.
- Tassinari, M., Doan, T., Bellinzoni, M., Chabalier, M., Ben-Assaya, M., Martinez, M., Gaday, Q., Alzari, P. M., Cascales, E., Fronzes, R., et al. (2022). The Antibacterial Type VII Secretion System of Bacillus subtilis: Structure and Interactions of the Pseudokinase YukC/EssB. mBio 13(5): e0013422.
- Thiery, S., Turowski, P., Berleman, J. E. and Kaimer, C. (2022). The predatory soil bacterium Myxococcus xanthus combines a Tad- and an atypical type 3-like protein secretion system to kill bacterial cells. Cell Rep 40(11): 111340.
- Thiery, S. and Kaimer, C. (2020). The predation strategy of Myxococcus xanthus. Front Microbiol 11: 2.
- Vettiger, A. and Basler, M. (2016). Type VI secretion system substrates are transferred and reused among sister cells. Cell 167(1): 99-110.e12.
- Wang, J., Brodmann, M. and Basler, M. (2019). Assembly and subcellular localization of bacterial type VI secretion systems. Ann Rev Microbiol. 73: 621-638.
- West, S. A., Griffin, A. S., Gardner, A. and Diggle, S. P. (2006). Social evolution theory for microorganisms. Nat Rev Microbiol 4(8): 597-607.
- Willett, J. L., Ruhe, Z. C., Goulding, C. W., Low, D. A. and Hayes, C. S. (2015). Contact-Dependent Growth Inhibition (CDI) and CdiB/CdiA Two-Partner Secretion Proteins. J Mol Biol 427(23): 3754-3765.
- Zhang, W., Wang, Y., Lu, H., Liu, Q., Wang, C., Hu, W. and Zhao, K. (2020). Dynamics of solitary predation by Myxococcus xanthus on Escherichia coli observed at the single-cell level. Appl Environ Microbiol 86(3): e02286-19.
Article Information
Copyright
© 2023 The Author(s); This is an open access article under the CC BY-NC license (https://creativecommons.org/licenses/by-nc/4.0/).
How to cite
Taillefer, B., Grandjean, M. M., Herrou, J., Robert, D., Mignot, T., Sebban-Kreuzer, C. and Cascales, E. (2023). Qualitative and Quantitative Methods to Measure Antibacterial Activity Resulting from Bacterial Competition. Bio-protocol 13(13): e4706. DOI: 10.21769/BioProtoc.4706.
Category
Microbiology > Antimicrobial assay > Killing assay
Cell Biology > Cell viability > Cell lysis
Do you have any questions about this protocol?
Post your question to gather feedback from the community. We will also invite the authors of this article to respond.