- Protocols

- Articles and Issues
- For Authors
- About
- Become a Reviewer

Implementation of a Drug Screening Platform to Target Gch1 Expression in Injured Mouse Dorsal Root Ganglion Neurons

Published: Vol 13, Iss 9, May 5, 2023 DOI: 10.21769/BioProtoc.4666 Views: 1862
Reviewed by: Joana Alexandra Costa ReisNader GhasemlouKaustav MukherjeeAnonymous reviewer(s)
Original research article
The authors used this protocol in:
Aug 2022
Advertisement


Protocol Collections
Comprehensive collections of detailed, peer-reviewed protocols focusing on specific topics


Abstract
Management of neuropathic pain is notoriously difficult; current analgesics, including anti-inflammatory- and opioid-based medications, are generally ineffective and can pose serious side effects. There is a need to uncover non-addictive and safe analgesics to combat neuropathic pain. Here, we describe the setup of a phenotypic screen whereby the expression of an algesic gene, Gch1, is targeted. GCH1 is the rate-limiting enzyme in the de novo synthesis of tetrahydrobiopterin (BH4), a metabolite linked to neuropathic pain in both animal models and in human chronic pain sufferers. Gch1 is induced in sensory neurons after nerve injury and its upregulation is responsible for increased BH4 levels. GCH1 protein has proven to be a difficult enzyme to pharmacologically target with small molecule inhibition. Thus, by establishing a platform to monitor and target induced Gch1 expression in individual injured dorsal root ganglion (DRG) neurons in vitro, we can screen for compounds that regulate its expression levels. This approach also allows us to gain valuable biological insights into the pathways and signals regulating GCH1 and BH4 levels upon nerve injury. This protocol is compatible with any transgenic reporter system in which the expression of an algesic gene (or multiple genes) can be monitored fluorescently. Such an approach can be scaled up for high-throughput compound screening and is amenable to transgenic mice as well as human stem cell–derived sensory neurons.
Graphical overview

Background
Tetrahydrobiopterin (BH4) is a co-factor metabolite used by the aromatic amino acid hydroxylases and nitric oxide synthases in the production of dopamine, serotonin, noradrenaline, and nitric oxide (Werner et al., 2011). BH4 synthesis is increased in dorsal root ganglion (DRG) sensory neurons after nerve injury, where its levels correlate with pain hypersensitivity in rodent neuropathic pain models, as well as in patients with chronic pain (Tegeder et al., 2006; Campbell et al., 2009; Kim et al., 2010; Lötsch et al., 2010; Heddini et al., 2012; Nasser and Møller, 2014; Belfer et al., 2015; Sadhu et al., 2018; Zheng et al., 2019). Targeting BH4 synthesis peripherally in injured sensory neurons represents a novel and potentially safe approach to combat certain neuropathic pain conditions (Latremoliere et al., 2015; Fujita et al., 2019). Since the early 1990s, the focus of drug discovery has been driven by target-based screening, using structural modeling and in silico computational analyses to design and screen small molecules using simple target-dependent assays, to find those that enter and block a certain enzymatic domain or binding motif (Sams-Dodd, 2005; Swinney, 2013). However, before this target-based approach, phenotypic screening was prevalent, often with limited information on the underlying mechanisms involved in the disease in question, and in which no targets were known or identified. Indeed, the success of these phenotypic screens over the more precision-targeted screens is revealed by the fact that the majority of first-in-class drugs actually came from phenotypic screens (Swinney and Anthony, 2011). Here, we describe a phenotypic screening platform using primary DRG sensory neurons from transgenic Gch1-GFP reporter mice that allowed us to monitor the effects of chemical libraries on the regulation of Gch1 expression in individual DRG neurons after axonal injury (axotomy). Using this platform, we provided not only novel insights into the biology of GCH1 expression and BH4 synthesis in injured sensory neurons, but also identified FDA-approved compounds with existing safety and pharmacokinetic profiles, which could potentially be repurposed to block the GCH1/BH4 pathway in neuropathic pain (Cronin et al., 2022). This protocol can be adapted to monitor the effects of compounds on the expression of multiple algesic genes in primary DRG cultures from transgenic mice or on human stem cell–derived sensory neurons.
Materials and Reagents
1.5 mL Eppendorf tubes (Eppendorf, catalog number: 0030121872)
Pipette tips (Biozym)
Glass Pasteur pipettes (Thermo Fisher, catalog number: 1367820C)
50 mL conical centrifuge tubes (Falcon, catalog number: 352070)
100 μm cell strainer (Corning, catalog number: 352360)
Gch1-GFP reporter mice [GENsat.org; stock name: Tg(Gch1-EGFP)GU68Gsat/Mmucd; stock number: 012014-UCD]
Neurobasal media (Thermo Fisher, catalog number: 21103049)
Black flat-bottomed TC-treated 384-well plate pre-coated with poly-D-lysine (BD Biocoat, Corning, catalog number: 354663)
Laminin (Sigma, catalog number: L2020)
Phosphate-buffered saline (PBS) (Thermo Fisher, 10010023)
Liberase-TH (Roche, catalog number: 5401135001)
Trypsin 0.5% (Gibco, catalog number: 15400-054)
Dulbecco’s modified Eagle medium (DMEM) (Thermo Fisher, catalog number: 12491015)
Fetal bovine serum (FBS) (Gibco, catalog number: 26140079)
L-glutamine (Gibco, catalog number: 25030-024)
Penicillin and streptomycin (Sigma, catalog number: P0781)
DNase-I (Sigma, catalog number: D5025)
30% BSA solution (Sigma, catalog number: A9205)
50× B-27 supplement (Thermo Fisher, catalog number: 17504044)
Trypan blue (Invitrogen, catalog number: T10282)
Propidium iodide (Thermo Fisher, catalog number: P1304MP)
Phorbol 12-myristate 13-acetate (PMA) (Sigma, catalog number: P1585)
Go6976 (Tocris, catalog number: 2253)
Complete media (see Recipes)
DRG media (see Recipes)
Equipment
Pipettes (P20, P200, and P1,000) (Gilson, catalog number: F167360)
Centrifuge (Eppendorf, model: 5810R)
Heidolph Unimax 1010 plate shaker
Bunsen burner (USBECK, W. Germany)
Hemocytometer (Marienfeld, catalog number: 0630010)
PerkinElmer/Evotec Opera QEHS model 2.0 laser spinning-disk confocal fluorescence microscope
Sterile tissue culture cabinet (Szabo Scandic, SafeFAST Premium 212)
Software
PerkinElmer Acapella language (PerkinElmer)
Procedure
DRG culture in 384-wells
Below is an optimized protocol for DRG culture used to coat one 384-well plate; work should be performed under sterile conditions in a tissue culture cabinet.
Coat a poly-D-lysine-coated 384-well plate additionally with 40 μL of laminin (10 μg/mL in PBS) for 3 h at 37 °C.
Isolate DRGs from eight Gch1-GFP reporter mice and collect evenly into two (for balancing purposes during centrifugation) 1.5 mL Eppendorf tubes filled with 1.4 mL of neurobasal media.
When all DRGs are collected, allow them to settle by gravity and remove as much neurobasal media as possible by pipetting with a 1,000 μL tip.
Add 350 μL of liberase-TH solution to the DRGs and incubate at 37 °C for 80 min.
Remove liberase-TH solution by pipetting and wash DRGs slowly in 1 mL of PBS, again allowing the DRGs to settle by gravity.
Remove PBS by pipetting.
Dilute 250 μL of 0.5% trypsin 1:1 in PBS. Add 350 μL of the resulting 0.25% trypsin solution to the tubes and incubate them at 37 °C for 7 min.
Add 1 mL of complete media (see Recipes) to stop trypsin reaction.
Allow DRGs to settle by gravity and remove supernatant by pipetting carefully.
Wash with 1 mL of complete media.
Allow DRGs to settle by gravity and remove supernatant by pipetting carefully.
Add 1 mL of complete media with DNase-I (10 μg/mL).
Flame-polish the tip of three Pasteur pipettes over a Bunsen burner flame, to achieve varying diameters of pipette opening: large, medium, and small (Figure 1).
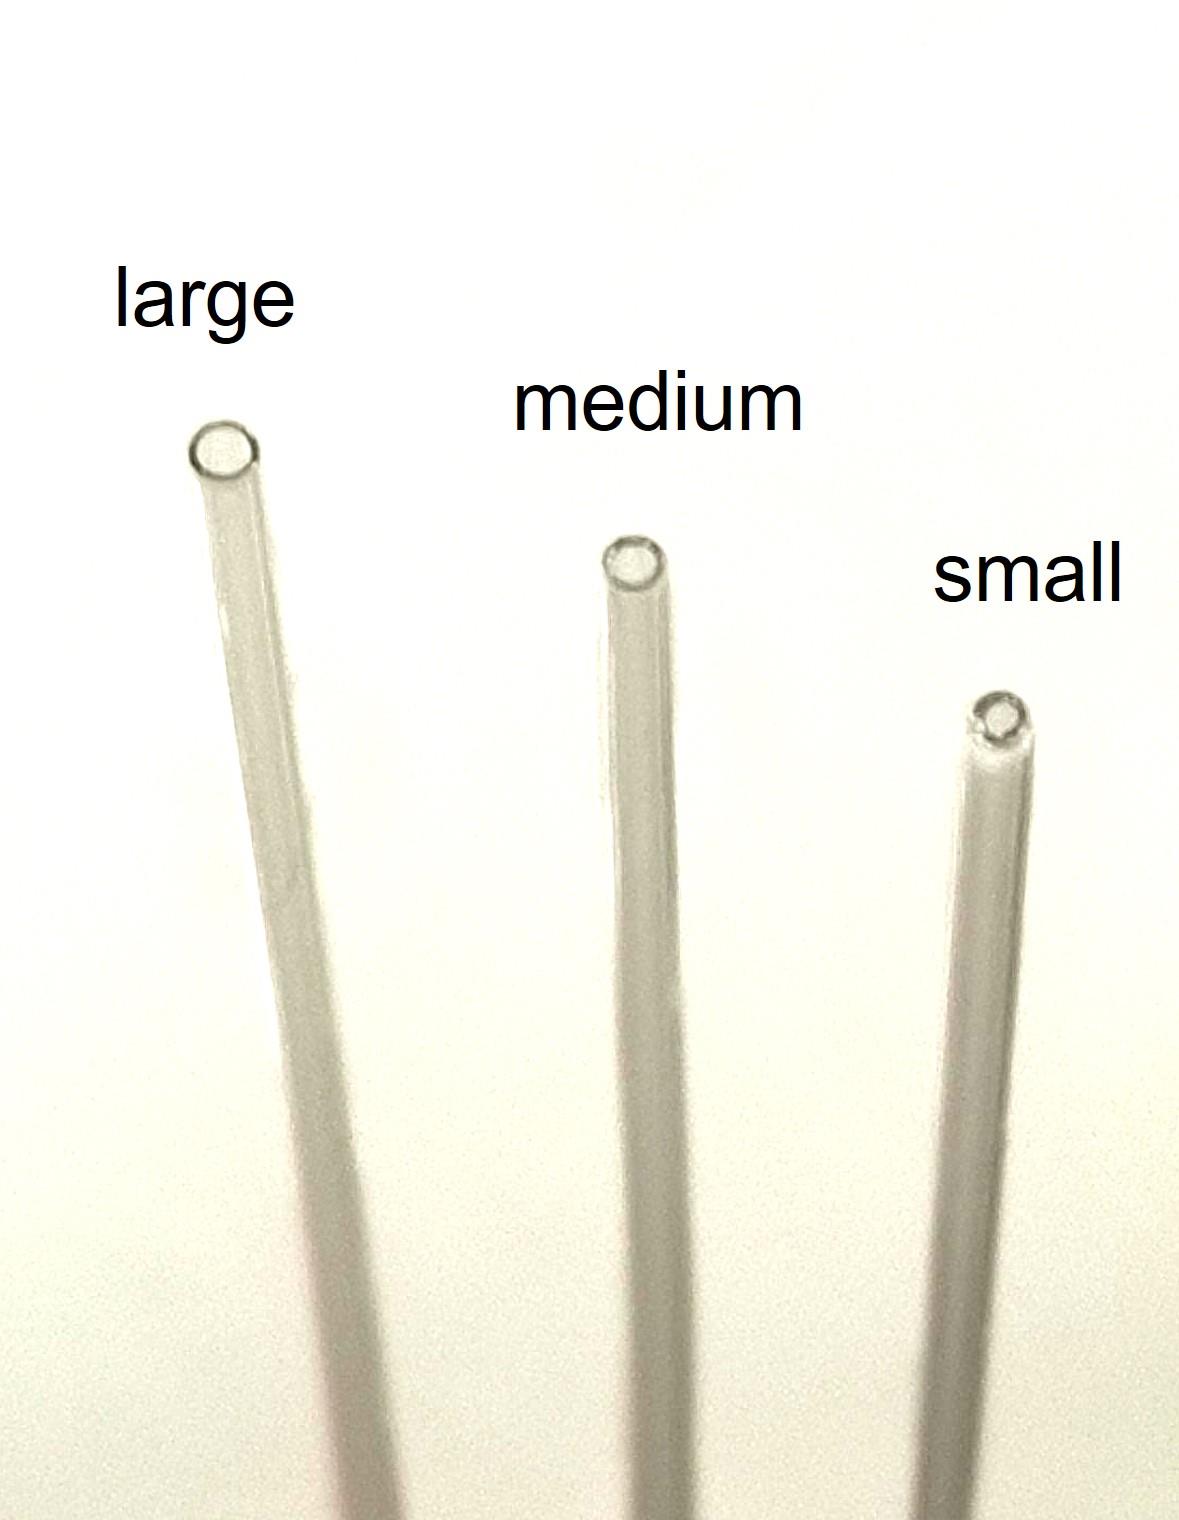
Figure 1. Flame-polished (using a Bunsen burner) pipettes with three comparative sizes of pipette openingMechanically triturate the DRGs, progressing from the normal diameter pipette to the medium and finally to the small, to dissociate the DRGs into single-cell suspension (with each pipette size, triturate 10–15 times).
Prepare 10% BSA solution in a 50 mL tube by mixing 2 mL of 30% BSA solution with 4 mL of PBS.
Layer 1 mL of dissociated DRG suspension over the 10% BSA solution.
Wash tube with 500 μL of complete media and transfer and overlay to the 10% BSA tube.
Centrifuge at 800× g for 15 min at 4 °C.
Carefully remove BSA interface first and then the rest of BSA supernatant (top layer). Then, carefully remove all the BSA lower layer ensuring not to disrupt the cell pellet.
Carefully resuspend the DRG pellet first in 2 mL of complete media and bring up to 20 mL. At this point, combine DRG pellets in a total of 20 mL.
Pass the cell suspension through a 100 μm cell strainer into a fresh 50 mL conical tube.
Centrifuge at 800× g for 15 min at 4 °C.
Carefully remove supernatant.
Resuspend cell pellet in 2 mL of DRG media (see Recipes).
Count DRG neurons using trypan blue staining (in a 1:1 ratio, i.e., 10 μL each) and add 10 μL of resulting mixture to a hemocytometer.
Adjust volume to ensure density of 25,000 neurons/mL.
Remove laminin solution from the wells completely.
Add 40 μL (~1,000 neurons) of the DRGs in DRG media to each well.
Incubate plate at 37 °C with 5% CO2 (timepoint set as Day 0).
Compound and propidium iodide (PI) addition
Twenty-four hours after plating the neurons (i.e., on Day 1), add compounds from chemical library. Compounds should be prepared in such a way that 10 μL of each compound is added to the 40 μL of DRGs to give a desired final working concentration. Add compounds at a rate of approximately 1 mL/min to minimize cell disturbances.
Shake plate for 5 min on a shaker at 120 rpm.
Incubate plate at 37 °C with 5% CO2.
On Day 3, prepare a working solution of PI viability stain (0.5 μg/mL) to identify dead cells.
Add 50 μL of PI solution to the DRGs (i.e., 1:1 mixture).
Shake plate for 1 min on a shaker at 120 rpm and incubate plate at 37 °C with 5% CO2 for 20 min.
Neuronal imaging
After PI staining, transfer the plate immediately to PerkinElmer/Evotec Opera QEHS model 2.0 laser spinning-disk confocal fluorescence microscope.
Visualize and image Gch1-GFP cells with a 488 nM laser and PI with a 561 nM laser. Divide each well into 15 sections and acquire each section (Figure 2).
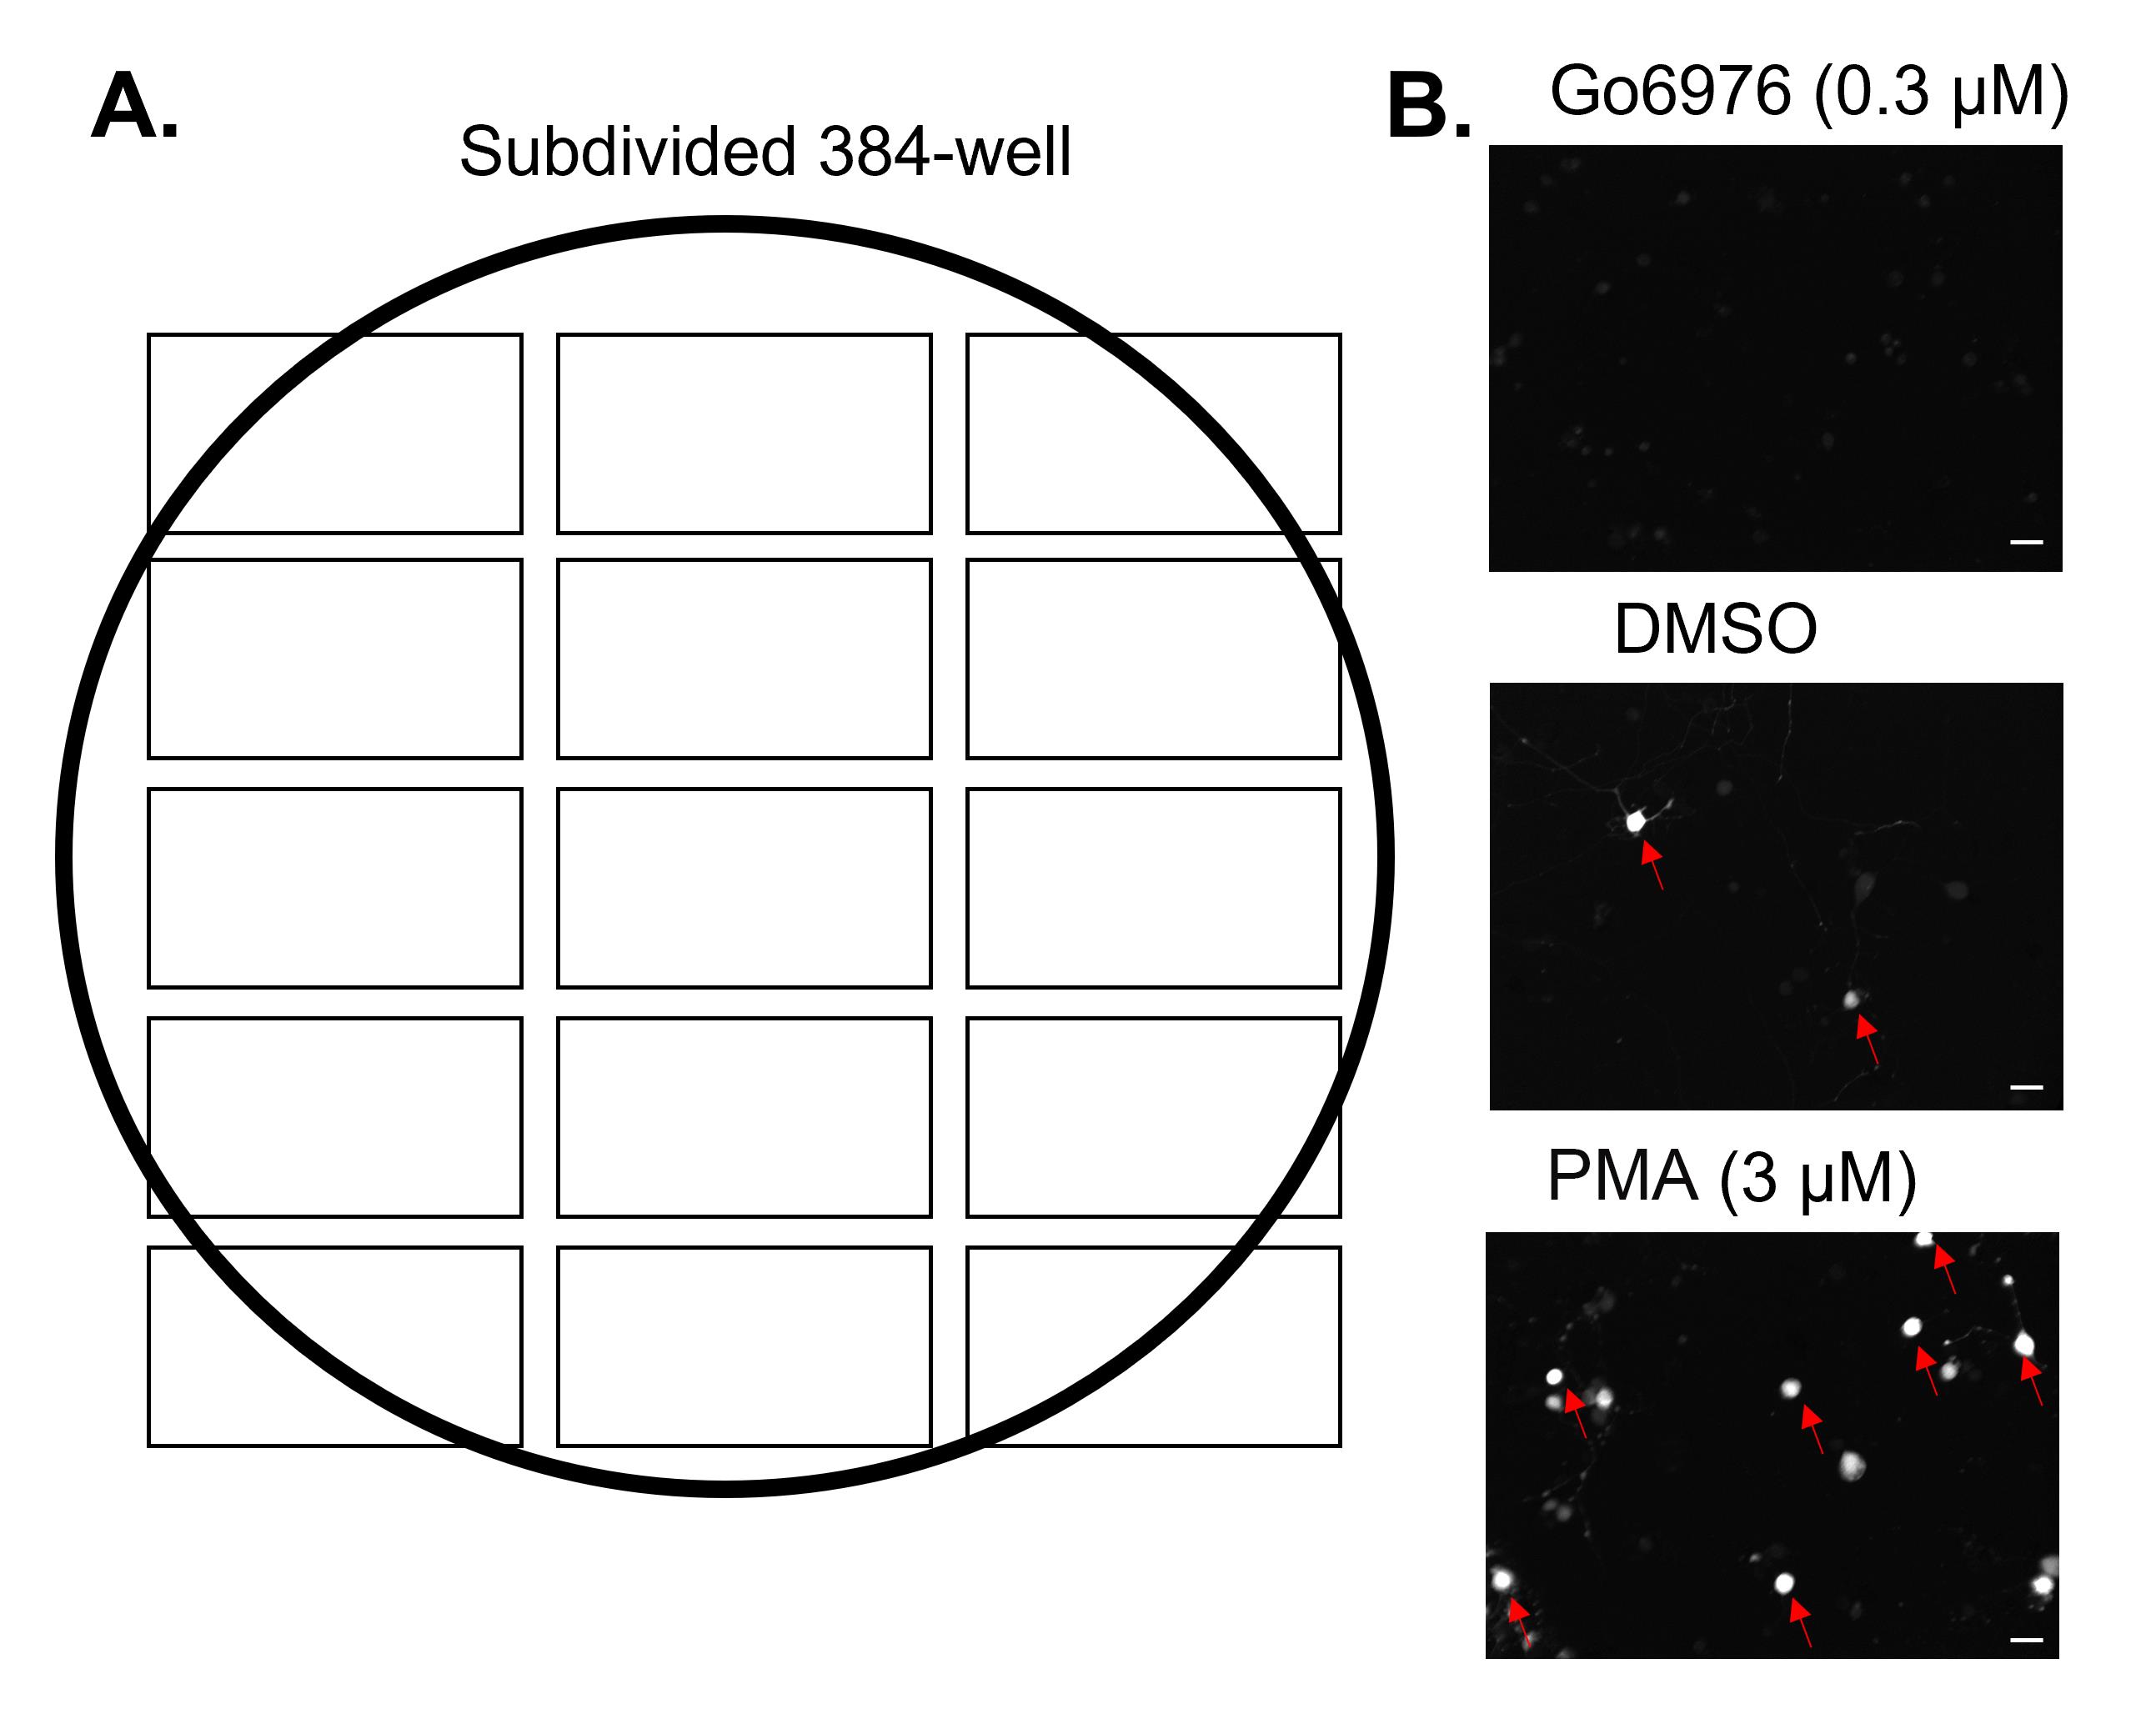
Figure 2. Confocal imaging of individual Gch1-GFP-expressing dorsal root ganglion (DRG) neurons. A. Each 384-well was divided into 15 regions; confocal fluorescent images of GFP and propidium iodide (PI) were taken of each section. All 15 sections were combined, and the various parameters extracted for each well. B. Representative GFP fluorescent images of a single-well subsection depicting high-expressing GFP DRG neurons (red arrows) induced by vehicle (DMSO), PMA, and Go6976. Scale bar, 30 µm.Proceed to image analysis.
Data analysis
Image analysis
Analyze the resulting images with scripts written in the PerkinElmer Acapella language that is packaged with the automated microscope. Use the GFP channel images for subroutines for nuclei detection. The first-round candidate nuclei that were too small, large, wide, or narrow were filtered out using the follow scripts [please refer to Supplemental Figure 3 in original paper (Cronin et al., 2022)]:
// User script STARTS
input(IN_Green_lo_pos_thresh, 300,"Green Low Positive Threshold","i","Minimum Green intensity to qualify as Low Positive")
input(IN_Green_hi_pos_thresh, 1000,"Green High Positive Threshold","i","Minimum Green intensity to qualify as High Positive")
input(IN_max_nuc_area, 2000)
input(IN_min_nuc_area, 300)
input( IN_LowerWidthToLengthThresh, 0.3, "Lower WidthToLength Threshold")
input(IN_Green_channel, 1,"Green Channel","i","Channel with Green Nuclear Marker")
input(IN_viability_channel, 2,"viability_channel","i","Channel with viability Nuclear Marker")
input(IN_Green_neg_thresh, 60,"Green False Nuclei Threshold","i","Minimum Green intensity to qualify as a Real Nucleus")
input(IN_Viability_thresh, 75,"Viability Threshold","i","Minimum Viability intensity to qualify as Dead")
set(Green_channel= _["IM_CH" & IN_Green_channel])
//set(viability_channel= _["IM_CH" & IN_viability_channel])
set(viability_channel= IM_CH2)
Nuclei_Detection_Select(green_channel)
//Make all the measurements before starting the object filters
set(objects=nuclei)
CalcIntensity(image=Green_channel, objects=objects)
RenameAttr(Green_intensity=intensity, objects=objects)
CalcIntensity(image=viability_channel, objects=objects)
RenameAttr(viability_intensity=intensity, objects=objects)
set(nuclei=objects)
CalcAttr( "Roundness" )
CalcWidthLength()
DefineAttr( WidthToLength, "half_width / full_length" )set(nuclei=objects)
// Collects results for Nuclei
if (defined("all_Nuclei")) // Not the first evaluated field
AddObjects(Nuclei, objects=all_Nuclei, CheckOverlap=no)
set(all_Nuclei=objects) // Renames output from AddObjects()
else()
set(all_Nuclei=Nuclei) // The first evaluated field
end()
end() // end of the analysis of valid image fields
end() // end of the foreach loop over image fields
//Start Filtering now that we have all the nuclei collected. do imageviews of each individual classification
objectfilter(area>=IN_max_nuc_area, objects=all_Nuclei)
set(too_big=objects)
objectfilter(area<IN_max_nuc_area, objects=all_Nuclei)
set(all_Nuclei=objects)
objectfilter(area<=IN_min_nuc_area, objects=all_Nuclei)
set(too_small=objects)
objectfilter(area>IN_min_nuc_area, objects=all_Nuclei)
set(all_Nuclei=objects)
objectfilter(WidthToLength<IN_LowerWidthToLengthThresh, objects=all_Nuclei)
set(too_skinny=objects)
objectfilter(WidthToLength>=IN_LowerWidthToLengthThresh, objects=all_Nuclei)
set(all_Nuclei=objects)
objectfilter( (Green_intensity <=IN_Green_neg_thresh) , objects=all_Nuclei)
set(GreenFalseNuc=objects)
objectfilter( (Green_intensity >IN_Green_neg_thresh) , objects=all_Nuclei)
set(all_Nuclei=objects)
//find all 12 phenotypic classes for each of the 3 markers (lo_pos and hi_pos for ubiq)
//GreenNeg
objectfilter( (Green_intensity <=IN_Green_lo_pos_thresh) , objects=all_Nuclei)
set(GreenNeg=objects)
objectfilter( (Green_intensity <=IN_Green_lo_pos_thresh) AND (Viability_intensity > IN_viability_thresh) , objects=all_Nuclei)
set(GreenNeg_Dead=objects)
objectfilter ((Green_intensity <=IN_Green_lo_pos_thresh) AND (Viability_intensity <= IN_viability_thresh) , objects=all_Nuclei)
set(GreenNeg_Alive=objects)
//GreenLoPos
objectfilter((Green_intensity >IN_Green_lo_pos_thresh) AND (Green_intensity <=IN_Green_hi_pos_thresh) , objects=all_Nuclei)
set(GreenLoPos=objects)
objectfilter((Green_intensity >IN_Green_lo_pos_thresh) AND (Green_intensity <=IN_Green_hi_pos_thresh) AND (Viability_intensity > IN_viability_thresh), objects=all_Nuclei)
set(GreenLoPos_Dead=objects)
objectfilter((Green_intensity >IN_Green_lo_pos_thresh) AND (Green_intensity <=IN_Green_hi_pos_thresh) AND (Viability_intensity <= IN_viability_thresh), objects=all_Nuclei)
set(GreenLoPos_Alive=objects)
//GreenHiPosobjectfilter((Green_intensity > IN_Green_hi_pos_thresh), objects=all_Nuclei)
set(GreenHiPos=objects)Divide the remaining accepted nuclei into high-intensity, low-intensity, or GFP-negative based on the average intensities in the GFP channel (and also use non-transgenic mice to set baseline GFP levels).
Subgroup the cells further into alive or dead based on their PI fluorescence intensity. Only living, PI-negative cells are included in further analysis.
The following parameters will depend on the specific target gene(s) being analyzed; for Gch1-GFP, these were individually optimized. See Notes.
Calculate three different parameters for each compound well: the number of high-expressing GFP neurons (#GFPHi), the mean GFP intensity per well (mean GFP intensity), and the percentage of high-expressing GFP neurons of total neurons identified per well (%GFPHi/total nuclei).
For each parameter, three standard deviations above and below (± 3 SD) that of the vehicle (DMSO) control samples were scored.
For each threshold passed, assign the following scoring: #GFPHi = 1; mean GFP intensity = 3; %GFPHi/total nuclei = 5. The total rank sum was assigned to each compound. For decreasers, compounds that acquired a total score > 1 were considered a hit; for increasers, a stricter total score >5 was used.
Notes
Positive [PMA; phorbol 12-myristate 13-acetate; protein kinase C (PKC) activator], negative (Go6976; PKC inhibitor), and appropriately diluted vehicle (DMSO) control chemicals were included as controls on each plate to validate the algorithm thresholds and data consistency on each plate.
In our screen, Gch1-GFP expression could be classified into high and low GFP expression, as described in the paper. We focused on the effect of compounds on the GFP-high-expressing neurons.
The section of the acapella script we added to the PerkinElmer supplied Multifield Analysis script is shown above. Presumably, any image analysis scripting language that finds nuclei, measures sizes, and measures intensity at different wavelengths could be used. Moreover, the calculations and thresholds we used to select cells for analysis inclusion could vary with different biological experimental systems.
Recipes
Complete media (suggested volume to prepare: 100 mL)
DMEM + 10% FBS + L-glutamine (5 mM) + Penicillin and streptomycin (5 mM)
DRG media (suggested volume to prepare: 50 mL)
Neurobasal media + 50× B-27 supplement + L-glutamine (5 mM) + Penicillin and streptomycin (5 mM)
Acknowledgments
We acknowledge the Harvard Stem Cell Institute (HSCI) for their expertise and infrastructure and chemical libraries in running the screen. We also would like to acknowledge all the members of the Woolf, Penninger, and Rubin labs for all their advice and help in generating the original publication from which this protocol was derived (Cronin et al. 2022). CJW is supported by NIH R35NS105076 and an HMS Blavatnik Award. JMP is supported by the Austrian Federal Ministry of Education, Science and Research, the Austrian Academy of Sciences, and the City of Vienna and grants from the Austrian Science Fund (FWF), Wittgenstein award (Z 271-B19), and the T. von Zastrow foundation. LR and HSCI is supported by the HSCI Therapeutic Screening Center (TSC) grant (# CF-0009-17-03).
Competing interests
The authors have no competing financial interests.
Ethics
All experiments were performed with approval from the Boston Children’s Hospital Institutional Animal Care and Use Committee.
References
Belfer, I., Dai, F., Kehlet, H., Finelli, P., Qin, L., Bittner, R. and Aasvang, E. K. (2015). Association of functional variations in COMT and GCH1 genes with postherniotomy pain and related impairment. Pain 156(2): 273-279.
- Campbell, C. M., Edwards, R. R., Carmona, C., Uhart, M., Wand, G., Carteret, A., Kim, Y. K., Frost, J., and Campbell, J. N. (2009). Polymorphisms in the GTP cyclohydrolase gene (GCH1) are associated with ratings of capsaicin pain.Pain 141(1-2):114-8.
- Cronin, S. J. F., Rao, S., Tejada, M. A., Turnes, B. L., Licht-Mayer, S., Omura, T., Brenneis, C., Jacobs, E., Barrett, L., Latremoliere, A., et al. (2022). Phenotypic drug screen uncovers the metabolic GCH1/BH4 pathway as key regulator of EGFR/KRAS-mediated neuropathic pain and lung cancer.Sci Transl Med 14(660): eabj1531.
- Fujita, M., da Luz Scheffer, D., Lenfers Turnes, B., Cronin, S. J. F., Latrémolière, A., Costigan, M., Woolf, C. J., Latini, A. and Andrews, N. A. (2019). Sepiapterin reductase inhibition selectively reduces inflammatory joint pain and increases urinary sepiapterin. Arthritis Rheumatol 72(1): 57-66.
- Heddini, U., Bohm-Starke, N., Grönbladh, A., Nyberg, F., Nilsson, K.W., and Johannesson, U. (2012). GCH1-polymorphism and pain sensitivity among women with provoked vestibulodynia.Mol Pain 8: 68.
- Kim, D. H., Dai, F., Belfer, I., Banco, R. J., Martha, J. F., Tighiouart, H., Tromanhauser, S. G., Jenis, L. G., Hunter, D. J., and Schwartz, C. E. (2010). Polymorphic variation of the guanosine triphosphate cyclohydrolase 1 gene predicts outcome in patients undergoing surgical treatment for lumbar degenerative disc disease.Spine (Phila Pa 1976) 35(21):1909-14.
- Latremoliere, A., Latini, A., Andrews, N., Cronin, S. J., Fujita, M., Gorska, K., Hovius, R., Romero, C., Chuaiphichai, S., Painter, M., et al. (2015). Reduction of Neuropathic and Inflammatory Pain through Inhibition of the Tetrahydrobiopterin Pathway. Neuron 86: 1393-1406.
- Lötsch, J., Klepstad, P., Doehring, A., and Dale, O. (2010). A GTP cyclohydrolase 1 genetic variant delays cancer pain. Pain 148(1):103-106.
- Nasser, A., and Møller, L.B. (2014). GCH1 variants, tetrahydrobiopterin and their effects on pain sensitivity.Scand J Pain 5(2): 121-128.
- Sadhu, N., Jhun, E. H., Yao, Y., He, Y., Molokie, R. E., Wilkie, D. J. and Wang, Z. J. (2018). Genetic variants of GCH1 associate with chronic and acute crisis pain in African Americans with sickle cell disease. Exp Hematol 66:42-49.
- Sams-Dodd, F. (2005). Target-based drug discovery: Is something wrong?Drug Discov Today 10(2): 139-47.
- Swinney, D.C. (2013). Phenotypic vs. Target-based drug discovery for first-in-class medicines.Clin Pharmacol Ther 93(4): 299-301.
- Swinney, D.C., and Anthony, J. (2011). How were new medicines discovered?Nat Rev Drug Discov 10(7):507-19.
- Tegeder, I., Costigan, M., Griffin, R.S., Abele, A., Belfer, I., Schmidt, H., Ehnert, C., Nejim, J., Marian, C., Scholz, J., et al. (2006). GTP cyclohydrolase and tetrahydrobiopterin regulate pain sensitivity and persistence. Nat Med 12(11):1269-77.
- Werner, E.R., Blau, N., and Thöny, B. (2011). Tetrahydrobiopterin: biochemistry and pathophysiology. Biochem J 438(3): 397-414.
- Zheng, N.N., Zhang, R.C., Yang, X.X., and Zhong, L.S. (2019). Association of rs3783641 single-nucleotide polymorphism in GTP cyclohydrolase 1 gene with post-herpetic neuralgia. J Dermatol 46(11): 993-997.
Article Information
Copyright
© 2023 The Author(s); This is an open access article under the CC BY-NC license (https://creativecommons.org/licenses/by-nc/4.0/).
How to cite
Readers should cite both the Bio-protocol article and the original research article where this protocol was used:
- Cronin, S. J. F., Davidow, L. S., Arvanites, A. C., Rubin, L. L., Penninger, J. M. and Woolf, C. J. (2023). Implementation of a Drug Screening Platform to Target Gch1 Expression in Injured Mouse Dorsal Root Ganglion Neurons. Bio-protocol 13(9): e4666. DOI: 10.21769/BioProtoc.4666.
- Cronin, S. J. F., Rao, S., Tejada, M. A., Turnes, B. L., Licht-Mayer, S., Omura, T., Brenneis, C., Jacobs, E., Barrett, L., Latremoliere, A., et al. (2022). Phenotypic drug screen uncovers the metabolic GCH1/BH4 pathway as key regulator of EGFR/KRAS-mediated neuropathic pain and lung cancer.Sci Transl Med 14(660): eabj1531.
Category
Drug Discovery > Drug Screening
Neuroscience > Nervous system disorders
Cell Biology > Cell isolation and culture
Do you have any questions about this protocol?
Post your question to gather feedback from the community. We will also invite the authors of this article to respond.