- Protocols

- Articles and Issues
- For Authors
- About
- Become a Reviewer

Visualizing the Cisternal Organization of Golgi Ministacks in HeLa Cells by Side-averaging
Published: Vol 13, Iss 8, Apr 20, 2023 DOI: 10.21769/BioProtoc.4658 Views: 1202
Reviewed by: Ralph Thomas BoettcherSusanne ReinhardtTakashi Nishina
Original research article
The authors used this protocol in:

Apr 2022

Protocol Collections
Comprehensive collections of detailed, peer-reviewed protocols focusing on specific topics


Related protocols
Abstract
The mammalian Golgi complex consists of laterally connected Golgi stacks, each comprising close-packed and flattened membrane sacks called cisternae. However, the convoluted spatial organization of Golgi stacks and limited resolution of light microscopy prevent us from resolving the cisternal organization of the Golgi. Here, we describe our recently developed side-averaging approach coupled with Airyscan microscopy to visualize the cisternal organization of nocodazole-induced Golgi ministacks. First, the nocodazole treatment greatly simplifies the organization of Golgi stacks by spatially separating the crowded and amorphous Golgi complex into individual disk-shaped ministacks. The treatment also makes it possible to identify en face and side-views of Golgi ministacks. Next, after manually selecting the side-view Golgi ministack images, they are transformed and aligned. Finally, the resulting images are averaged to enhance the common structural features and suppress the morphological variations among individual Golgi ministacks. This protocol describes how to image and analyze the intra-Golgi localization of giantin, GalT-mCherry, GM130, and GFP-OSBP in HeLa cells by side-averaging.
Graphical overview
Background
The Golgi complex (Golgi) plays a central role in sorting and modifying secretory proteins and lipids (cargos) (Glick and Luini, 2011; Klumperman, 2011; Lu and Hong, 2014). In mammalian cells, the Golgi consists of a laterally linked network of Golgi stacks. As the structural unit of the Golgi, a Golgi stack comprises 4–7 flattened and densely packed membrane sacks called cisternae. The stacked cisternae of the Golgi can be further divided into three zones, namely the cis, medial, and trans-Golgi zones. At the trans-side of the Golgi stack, the trans-Golgi network localizes immediately outside the trans-Golgi zone and comprises tubular and vesicular membrane profiles. The secretory cargos synthesized in the ER reach the cis-Golgi and transit the medial before eventually exiting at the trans-side of the Golgi.
The structural unit of the Golgi, the Golgi stack, has an extremely diverse and complex morphology. It has an amorphous and twisted shape and many attached tubular and vesicular membrane profiles. The spatial resolution of the conventional light microscope is ~250 nm, which is insufficient to resolve the 200–400 nm thick Golgi stack. Therefore, under a fluorescence microscope, the mammalian Golgi appears as a perinuclear lump with almost unresolvable structural features. The difficulty in imaging the Golgi is also due to the dense and random orientation of the Golgi stacks. Hence, it is critical to perform multicolor imaging to identify different zones of the same Golgi stack. Although possessing a spatial resolution of 40–100 nm, super-resolution microscopic techniques such as stimulated emission depletion microscopy and single-molecule localization microscopy have difficulty resolving the Golgi's cisternal organizations, since it is very challenging for them to perform multicolor imaging (Schermelleh et al., 2019). In the past, conventional and super-resolution light microscopy have had only limited success in imaging the Golgi cisternae with primarily qualitative data, mostly revealing the relative distributions of no more than three Golgi proteins (Dejgaard et al., 2007; Bottanelli et al., 2016; Tie et al., 2016; Zhang et al., 2020; Hao et al., 2021).
Nocodazole treatment scatters the densely aggregated Golgi as disk-shaped individual structural units with relatively uniform morphological appearances. Extensive data have demonstrated that nocodazole-induced Golgi ministacks (hereafter Golgi ministacks) reliably represent the native Golgi stack (Rogalski et al., 1984; Van De Moortele et al., 1993; Cole et al., 1996; Trucco et al., 2004; Tie et al., 2018). Therefore, Golgi ministacks are a valid Golgi model. We developed a quantitative method called GLIM (Golgi localization by imaging the center of fluorescence mass) (Tie et al., 2016 and 2017). GLIM can achieve ~30 nm spatial resolution along the cis-trans Golgi axis. However, it only provides a numerical value denoting the axial localization but does not generate a pictorial representation of the cisternal distribution of Golgi proteins. By averaging en face views of Golgi ministacks, we later developed an en face averaging method to study the lateral organization of Golgi proteins (Tie et al., 2018). Recently, we have further advanced the averaging approach and introduced the side-averaging method to visualize the cisternal organization of Golgi ministacks directly (Tie et al., 2022). Averaging the Golgi ministack images can effectively enhance the common structural features and suppress the morphological variations or noises among individual Golgi ministacks. Side-averaging provides a systematic and quantitative imaging approach to reveal the axial and lateral cisternal distributions of Golgi proteins. Here, we present a detailed side-averaging protocol to image the intra-Golgi distribution of four Golgi proteins: giantin, GalT-mCherry, GM130, and GFP-OSBP.
Materials and Reagents
Cell culture materials and reagents
Φ 12 mm glass coverslip (no. 1.5) (Menzel, catalog number: CB00120RAC)
24-well cell culture plates (TC-treated and F-bottom) (Corning® Costar®, catalog number: 3524)
T25 cell culture flask (Nunc®, catalog number: 156367)
15 mL centrifuge tube (Greiner, catalog number: 188271)
0.45 µm syringe filter with Supor® membrane (25 mm, sterile) (Pall, catalog number: 4614)
Glass slide (3 × 1 inch) (Biomedia, catalog number: BMH.880103)
Kimwipe® (Kimtech, catalog number: 34155)
Dulbecco's modified Eagle's medium (DMEM) (Capricon, catalog number: DMEM-HPA-P50)
0.25% Trypsin-EDTA (Gibco, catalog number: 25200072)
Fetal bovine serum (FBS) (GE, Hyclone, catalog number: SV30160.03HI)
Opti-MEM (Invitrogen, catalog number: 31985070)
Lipofectamine 2000 (Invitrogen, catalog number: 116688-019)
Chemicals
Nocodazole (Merck, catalog number: 487928)
Dimethyl sulfoxide (DMSO) (Merck, catalog number: D8418-50ML)
Paraformaldehyde (Merck, catalog number: 1.04005.1000)
Bovine serum albumin (BSA) (Sigma-Aldrich, catalog number: A9418)
Saponin (Sigma-Aldrich, catalog number: 47036)
Glycerol (Sigma-Aldrich, catalog number: G5516-1L)
Mowiol 4-88 (MW ~31,000) (Merck, catalog number: 81381-50G)
1,4-Diazabicyclo [2.2.2] octane (DABCO) (Merck, catalog number: D27802-25G)
Tris base (Promega, catalog number: H5135)
Sodium chloride (NaCl) (Merck, catalog number: 1.06404.5000)
Potassium chloride (KCl) (Merck, catalog number: 1.04936.1000)
Sodium phosphate dibasic (Na2HPO4) (Merck, catalog number: S9763)
Potassium phosphate monobasic (KH2PO4) (Merck, catalog number: P0662)
Hydrochloric acid (HCl) (Merck, catalog number: 1.00317.2500)
NH4Cl (Merck, catalog number: 254134)
Colorless nail polish
GalT-mCherry mammalian expression plasmid DNA (Tie et al., 2016)
GFP-OSBP mammalian expression plasmid DNA (Addgene: pLJM1-FLAG-GFP-OSBP #134659)
Primary antibodies
GM130 mouse monoclonal antibody (BD Biosciences, catalog number: 610823; dilution 1:500)
Giantin rabbit polyclonal antibody (BioLegend, catalog number: 924302; dilution 1:1,000)
Secondary antibodies
Goat anti-mouse IgG conjugated with Alexa Fluor (AF) 647 (Invitrogen, catalog number: A21235; dilution 1:500)
Goat anti-rabbit IgG conjugated with AF488 (Invitrogen, catalog number: A11008; dilution 1:500)
Goat anti-rabbit IgG conjugated with AF647 (Invitrogen, catalog number: A32733; dilution 1:500)
Solutions
33 mM nocodazole stock solution (see Recipes)
Phosphate buffered saline (PBS) (see Recipes)
1 M Tris pH 8.0 (see Recipes)
4% paraformaldehyde fixative (see Recipes)
100 mM NH4Cl (see Recipes)
10% saponin (see Recipes)
Antibody dilution buffer (see Recipes)
Mowiol mounting medium (see Recipes)
Equipment
A pair of sharp forceps
Water bath
Airyscan microscope: Zeiss LSM980 system equipped with a motorized stage, a temperature-controlled environment chamber, 63×/1.46 Oil Plan-Apochromat objective, and Zeiss Airyscan 2 detector module. GFP or AF488, mCherry, and AF647 are excited by 488, 561, and 639 nm diode laser lights, respectively. The emission lights from GFP or AF488, mCherry, and AF647 are collected by BP495-560, BP570-630, and LP655 filters.
37 °C cell culture incubator with 5% CO2 (Nuaire, catalog number: NU5510E)
Benchtop centrifuge (Eppendorf, catalog number: EPPE5401000.064)
Software
Fiji (NIH, https://fiji.sc/)
Macros (Supplementary Files 1–6): P1-Rotate_Resize_Normalize, P2-Resize_Add_Line, P3-Reflection_Average, ROI_to_image, Side average_Axial line intensity profile, and Side average_Lateral line intensity profile.
Zeiss Zen software
Microsoft Excel
Microsoft Word
Procedure
In this protocol, HeLa cells grown on two coverslips are prepared to study the intra-Golgi localization of giantin, GalT-mCherry, GM130, and GFP-OSBP by side-averaging. For coverslip #1, cells transiently expressing GalT-mCherry are immunostained for giantin and GM130 with fluorophores AF488 and AF647, respectively. For coverslip #2, cells transiently co-expressing GFP-OSBP and GalT-mCherry are immunostained for giantin with fluorophore AF647. Cells are imaged under a Zeiss Airyscan microscope.
Prepare glass coverslip for cell culture
Add 200 µL of DMEM to two wells in a 24-well plate: well #1 and #2.
Wash two pieces of coverslip in 70% ethanol. Then, wipe them with Kimwipe® tissue and place them into the two DMEM-containing wells. Hence, the two pieces of coverslip are referred to as coverslip #1 and #2.
Keep the 24-well plate in the 37 °C cell culture incubator until use.
Seed HeLa cells onto the glass coverslip
Maintain HeLa cells in a T25 flask with DMEM supplemented with 10% FBS (complete medium) in the 37 °C cell culture incubator. Cells are sub-cultured at ~80% confluency.
Aspirate the culture medium from the T25 flask and add 1 mL of 0.25% Trypsin-EDTA. Return the flask to the 37 °C cell culture incubator for 2 min.
Add 3 mL of complete medium to the T25 flask, pipette several times to detach the cells, and collect the cells in a 15 mL centrifuge tube.
Pellet cells by centrifugation at 500 × g for 2 min in a benchtop centrifuge.
Aspirate the supernatant and resuspend the cells in 5 mL of complete medium by pipetting.
Aspirate the DMEM medium in wells #1 and #2. Add 0.4 mL of cell suspension (~1 × 10⁵ cells) to the two wells and incubate in the 37 °C cell incubator.
Cells are ready for transfection when they are ~80% confluent and well spread on the glass coverslip.
Transfection to express GalT-mCherry and GFP-OSBP
Change well #1 and #2 to 500 µL of fresh complete medium.
Add 500 ng GalT-mCherry plasmid DNA to 50 µL of Opti-MEM. Add 1 µL of lipofectamine 2000 to 50 µL of Opti-MEM in a separate tube. After 5 min incubation at room temperature, mix the content of the two tubes and incubate the resulting mixture at room temperature for 20 min. Add the final mix to well #1.
Note: Other transfection reagents should also be suitable to transfect HeLa cells.
Add GalT-mCherry and GFP-OSBP plasmid DNA, 250 ng each, to 50 µL of Opti-MEM. Add 1 µL of lipofectamine 2000 to 50 µL of Opti-MEM in a separate tube. After 5 min incubation at room temperature, mix the content of the two tubes and incubate the resulting mixture at room temperature for 20 min. Add the final mix to well #2.
Change well #1 and #2 to the fresh complete medium after 6 h incubation in the 37 °C cell culture incubator.
Nocodazole treatment to induce Golgi ministacks
Dilute the nocodazole stock solution 1,000-fold by pipetting 1 µL of stock solution into 1 mL of complete medium. The working concentration of nocodazole is 33 µM. Prewarm the nocodazole-containing complete medium to 37 °C.
Aspirate the medium from wells #1 and #2 and add 500 µL of prewarmed nocodazole-containing complete medium.
Incubate the 24-well plate for 3 h in the 37 °C cell culture incubator.
Immunofluorescence labeling
Note: Avoid intense ambient light to prevent fluorophores from photobleaching.
Fixation
Aspirate the nocodazole-containing complete medium from wells #1 and #2. Next, rinse cells with 0.5 mL of PBS twice and add 0.5 mL of 4% paraformaldehyde fixative solution. After 20 min incubation at room temperature, wash the wells twice with 0.5 mL of PBS, with 100 mM NH4Cl, and again with 0.5 mL of PBS.
Immunofluorescence labeling
Dilute primary antibodies in the antibody dilution buffer according to their recommended dilution factors. Prepare two types of primary antibody mixtures. Mixture #1 contains giantin and GM130 primary antibodies, while mixture #2 has giantin primary antibody only.
Invert the lid of the 24-well plate. Add 10 µL of mixture #1 and #2 onto the inverse side of the lid, corresponding to wells #1 and #2, respectively. Using a pair of sharp forceps, lift the coverslips #1 and #2, cell-side down, and place them onto the corresponding drops of mixture #1 and #2 on the lid. Put the lid into a Ziplock bag with a piece of wet Kimwipe® tissue inside. Seal the Ziplock bag and allow the cells to incubate with the primary antibody at room temperature for 1 h. Transfer the two pieces of glass coverslip, cell-side up, and place them onto the corresponding wells. Wash the glass coverslip with 0.5 mL of PBS three times.
Wash the inverse side of the 24-well plate lid extensively with water. Next, wipe dry the inverse side of the lid with Kimwipe® tissue. Re-use the inverse side of the lid for secondary antibody incubation.
Repeat the above steps described in step E2b) for the fluorescence-conjugated secondary antibodies. Use goat anti-rabbit AF488 and goat anti-mouse AF647 for coverslip #1 and goat anti-rabbit AF647 for coverslip #2.
Mounting
Add two drops of Mowiol mounting medium, 10 µL each, onto a piece of glass slide. Transfer coverslip #1 and #2 from the 24-well plate onto the two drops of Mowiol mounting medium, cell-side down. Dry glass coverslip at room temperature for 1 h. Seal the edge of the glass coverslip with colorless nail polish. The glass slide is then sealed in a Ziplock bag and stored at -20 °C until imaging.
Note: Other mounting media should work too. However, we prefer Mowiol mounting medium as it solidifies, which makes it easier to handle the coverslips.
Imaging
Acquire cell images (16-bit) under the 63× objective using the SR mode in the Zeiss Airyscan microscope. Select cells with good signals and well-spread morphologies. Collect multiple three-channel image stacks with a z-step of 170 nm and pixel size of 45 nm. Image seven cells with one cell per image. Process raw Airyscan images using Zeiss Zen software.
Data analysis
Side-averaging analysis
Side-averaging requires three-channel images, among which two channels are reserved for giantin and GalT-mCherry. Giantin is a cisternal rim-localized marker to identify a Golgi ministack's spatial orientation. It appears as a ring and double-punctum in the en face and side-view of a Golgi ministack, respectively (Tie et al., 2018). On the other hand, the trans-Golgi marker GalT-mCherry denotes the trans-side of side-views. The testing Golgi protein, GM130 or GFP-OSBP, in this case, is imaged in the third channel.
Install Macros. There are six Microsoft Word docx files, Supplementary Files 1-6, each containing code for one macro. Open Supplementary File 1 in Microsoft Word. Copy and paste the text content (the macro code) to Fiji's macro editor (Plugins > New > Macro). Next, save the macro using the provided macro name in the second line of the text as an .ijm file. Install the macro (Plugins > Macros > Install) and select the saved .ijm file. Finally, repeat the above steps for Supplementary Files 2-6 to install the rest of the macros. The following six macros, corresponding to Supplementary Files 1-6, respectively, should be found under Plugins > Macros: P1-Rotate_Resize_Normalize, P2-Resize_Add_Line, P3-Reflection_Average, ROI_to_image, Side average_Axial line intensity profile, and Side average_Lateral line intensity profile.
Open the processed Airyscan image in Fiji and select the giantin channel. Average three consecutive z-sections around the best focus plane (Image > Stacks > Z project). Next, split the three-channel image into three single images (Image > Color > Split Channels). Finally, merge them again as a new three-channel image so that GalT-mCherry is Channel 1 (C1) or red, giantin is Channel 2 (C2) or artificially green, and GM130 or GFP-OSBP is Channel 3 (C3) or artificially blue. Save the new three-channel image.
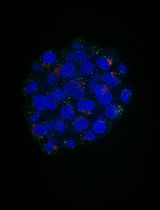
Open the ROI Manager (Analyze > Tools > ROI Manager). Manually draw three regions in the background using the Freehand selections drawing tool while pressing the Shift key. The background regions should be within the cytoplasm and free of Golgi ministacks (Figure 1A). Combine the three background regions as one region of interest (ROI) and add it to the ROI Manager by pressing t or clicking Add of the ROI Manager. Save the background ROI to a sub-folder (RoiSet-background) for later revision. Set measurement parameters: Standard deviation and mean (Analyze > Set Measurements > check “Standard deviation” and “Mean gray value”).
NOTE: Combining three background ROIs would sample more regions of the background.
Select giantin or C2 as the active channel. Next, measure the standard deviation and mean of the background ROI (Analyze > Measure). The values are displayed in the Results windows.
Copy the standard deviation and mean gray values to Excel and calculate the threshold value as mean + 3SD. Subtract the threshold value from C2 (Process > Math > Subtract). When a dialog window pops up with the message Process all 2 images?, click No to subtract the background from the current channel only.
Repeat steps 4 and 5 by selecting C1 and C3 as active channels.
Save the background-subtracted three-channel image with the suffix “BGST” (background subtracted) for later revision. Then, remove all ROIs in the ROI Manager by clicking Clear in the ROI Manager.
Visually inspect giantin image and identify Golgi ministack side-views, characterized by giantin double-punctum (Figure 1B). Select the Rectangle icon (rectangle drawing tool) from the Fiji toolbar. Manually draw a small square in any part of the image while monitoring the status bar to ensure w = 40 pixel and h = 40 pixel. Move the resulting 40 × 40 pixel square to box a double-punctum. Then, add the ROI to the ROI Manager by pressing t (Figure 1C). Move the 40 × 40 pixel square to box other double-punctum and repeat the above steps. Exhaust the image to select all double-punctum (Figure 1B). Save all ROIs to a sub-folder (RoiSet-side-view) for later revision.
Convert ROIs to individual three-channel images (hereafter referred to as cropped images) (Figure 1C). The names of cropped images have a sequential number (1, 2, 3, etc.) as their suffixes. The conversion can be performed either manually (Ctrl + Shift + D or Image > Duplicate) or automatically by launching the macro “ROI_to_image” (Plugins > Macros > ROI_to_image).

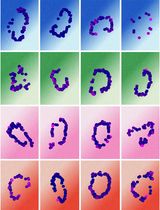
Figure 1. Selection of side-views of Golgi ministacks. (A) Drawing and selecting the background ROI. In Step (1), three ROIs are manually drawn while holding the Shift key. In Step (2), three ROIs are added to the ROI Manager as one background ROI by pressing t. (B) Golgi ministacks are labeled by GalT-mCherry (red), giantin (green), and GM130 (blue). Side-views are boxed with square ROIs with 40 × 40 pixels (yellow boxes). Note that the lines of yellow boxes are thickened to increase their visibility. Below are images showing a typical en face and side-view Golgi ministacks. (C) ROIs are added to the ROI Manager. (D) Side-view ROIs are converted to individual three-channel images (cropped images) (40 × 40 pixel). (E) Manually flip or rotate the cropped images so that the GalT-mCherry signal is above the giantin double-punctum.Manually flip or rotate all cropped images (Image > Transform: flip or rotate) so that GalT-mCherry signal, which usually appears as a lump, is above the giantin double-punctum. Hence, the trans-side of the Golgi ministack is positioned up.
Ensure the background pixels of all cropped images are 0 in all three channels (Figure 2). To that end, first rescale intensities of the three-channel image to 0 and 1 (Image > Adjust > Brightness&Contrast > Set Minimum displayed value to 0, Maximum displayed value to 1, and check Propagate to the other 2 channels of this image) to display all non-zero pixels as the maximum brightness (Figure 2A). Next, manually draw a ROI around non-zero pixels in the background region (Figure 2B) and remove them or make them zero (Edit > Clear or Delete) (Figure 2C). Alternatively, estimate the background intensity value and subtract it from each channel. This step requires significant effort and is critical for high-quality side-averaging.
NOTE: “Clear” affects all channels, while “Delete” affects only the active channel.

Figure 2. Manually delete or clear background objects in a cropped image. (A) Rescale the intensity of the cropped image to 0 and 1 to reveal the background object. (B) Manually draw an ROI around the background object. (C) Remove the background object.Clear all ROIs in the ROI Manager by clicking Clear.
In a cropped image, select giantin or C2 as the active channel. Then, rescale intensities of the three-channel image to 0 and 1 as described in step 11.
Manually draw two ROIs to mark the two giantin puncta (left and right) and add the ROIs to the ROI Manager (Figure 3).

Figure 3. Manually mark the two giantin puncta in a cropped image. (A) In the giantin or C2 channel, rescale the intensity of the cropped image to 0 and 1. (B) Manually draw two ROIs corresponding to the two giantin puncta. (C) Add the two ROIs to the ROI Manager.Click Deselect in the ROI Manager and launch the macro P1-Rotate_Resize_Normalize (Plugins > Macros > P1-Rotate_Resize_Normalize). Upon prompt, choose a directory to export the processed channel images. The macro splits and processes the three-channel cropped image into three single-channel images. Then, it saves them in the specified directory with prefixes “C1,” “C2,” or “C3,” indicating the respective channel or Golgi markers.
Repeat steps 12–15 for all cropped images.
Import processed single-channel images from step 15 as C1, C2, and C3 image stacks (File > Import > Image Sequence > in "Filename contains", key in “C1,” “C2,” or “C3”).
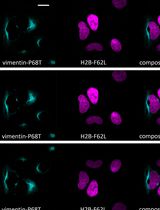
Acquire the side-averaged image by averaging C1, C2, or C3 image stacks (Image > Stacks > Z-Projection). Then, save the three side-averaged images (Figure 4, left column).
Resize the side-averaged image by launching the macro P2-Resize_Add_Line (Plugins > Macros > P2-Resize_Add_Line) (Figure 4, middle two columns). The macro tool resizes the side-averaged image isotropic with a pixel size of 5.6 nm so that the resulting image represents the ministack of the mean population size (Tie et al., 2022). Two images are saved with the following prefixes: “resized1” and “resized2.” “resized2” image differs from “resized1” image in that the former has a horizontal white line to indicate the y position of the center of fluorescence mass (ym). File names and folder paths are displayed in the Log window.

Figure 4. Cropped images are processed by the macro P1-Rotate_Resize_Normalize and subsequently averaged. The resulting averaged images of GFP-OSBP, giantin, GalT-mCherry, and GM130 (left column) are further processed by macros P2-Resize_Add_Line (middle two columns) and then by P3-Refelection_Average (right two columns).Process the “resized1” or “resized2” image using the macro P3-Refelection_Average to generate a reflection-averaged image (Plugins > Macros > P3-Refelection_Average) (Figure 4, right two columns). The operation assumes that the side-averaged Golgi ministack image should be symmetrical about the y-axis. Images are saved with "mirror" appended at the beginning of their file names. File names and folder paths are displayed in the Log window. The reflection averaged “resized1” and “resized2” images are suitable for constructing merged composite images showing the cisternal organization of multiple Golgi markers.
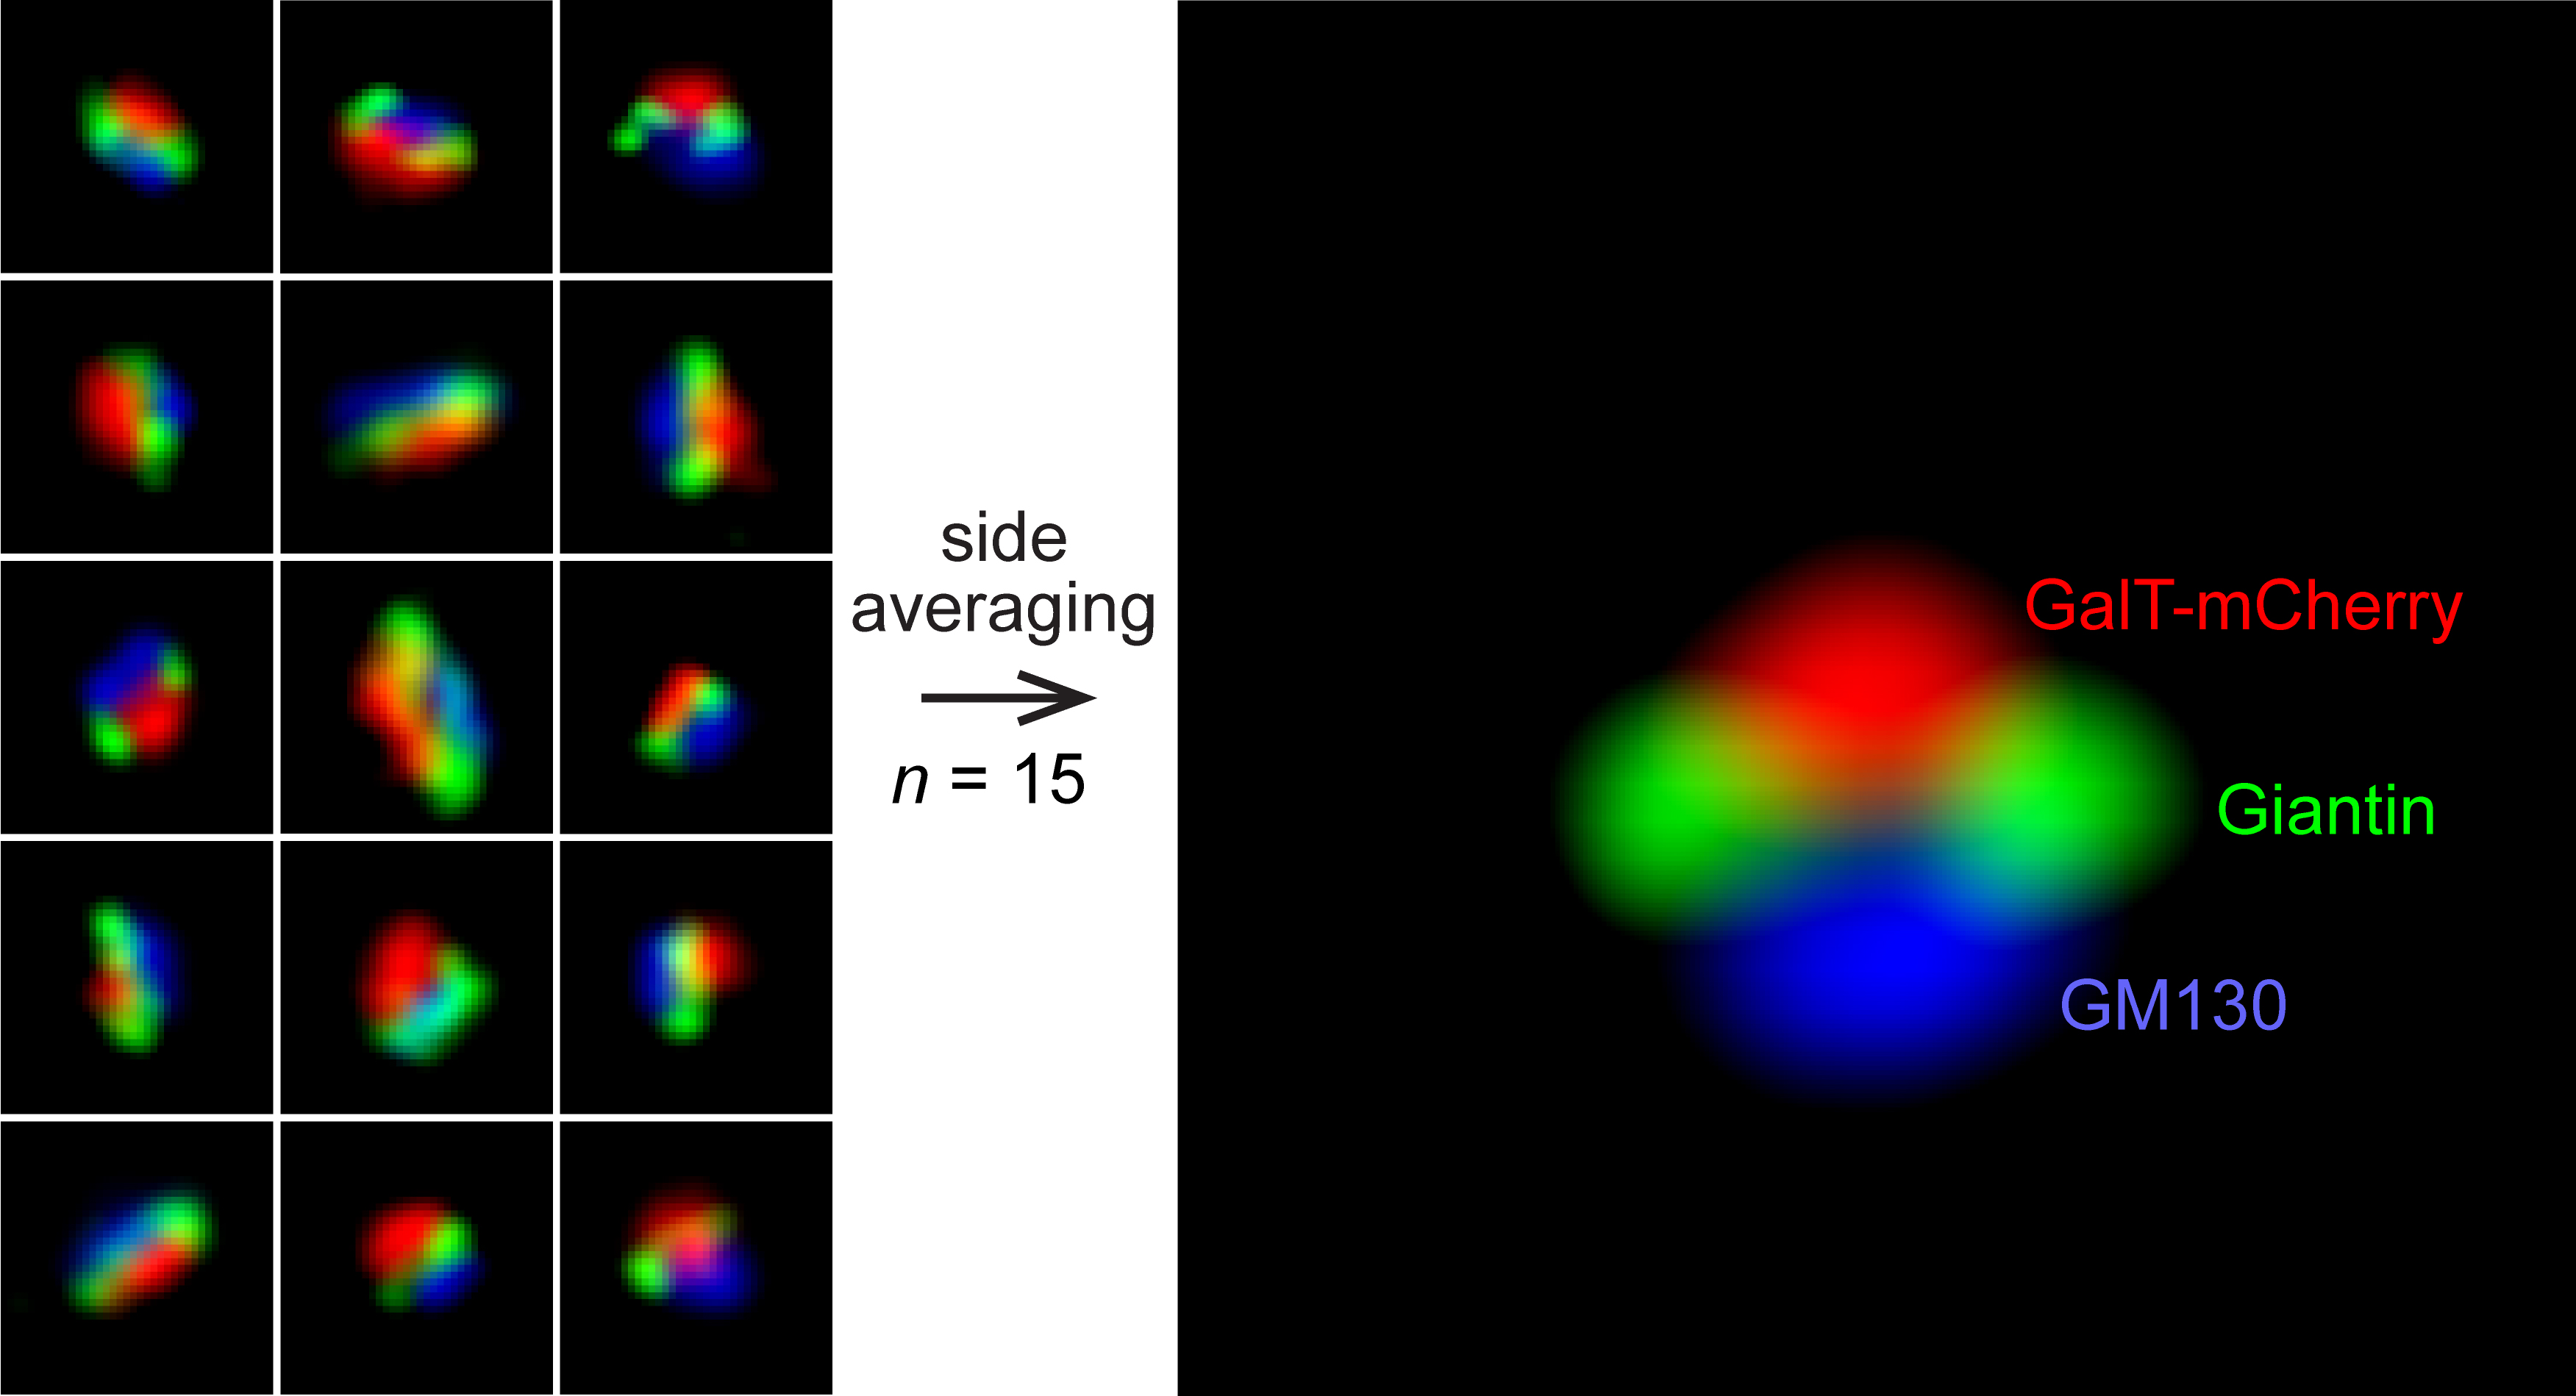
Generate a composite image with side-averaged Golgi proteins, including giantin, GalT-mCherry, GM130, and GFP-OSBP. Open “resized2” images and merge them by artificially assigning GM130 as blue, giantin as green, GalT-mCherry as red, and OSBP-EGFP as cyan (Image > Color > Merge Channels) (Figure 5). The composite image displays the cisternal organization of a Golgi ministack.

Figure 5. A composite side-view image showing the relative cisternal distribution of, from the cis- to trans-side of the Golgi, GM130, giantin, GalT-mCherry, and GFP-OSBP. Reflection-averaged “resized2” images of GM130, giantin, GalT-mCherry, and GFP-OSBP are used to construct the composite image.
Data plotting
Process “resized1” image using the macro, Side average_Axial line intensity profile, to generate the axial line intensity profile (Plugins > Macros > Side average_Axial line intensity profile) (Figure 6). Two windows are displayed. The Plot of results window shows the axial line intensity profile. x = 0 corresponds to the position of the center of the fluorescence mass, ym. The Results window shows the numerical values of x (pixels) and normalized intensity.
By side-averaging, we can calculate the localization quotient (LQ) of GFP-OSBP,
 , using the below equation:
where yGFP–OSBP is the ym of GFP-OSBP, yGM130 is the ym of GM130, and yGalT–mCherry is the ym of GalT-mCherry. Similarly, we can also calculate LQside of giantin. The LQside values of OSBP-EGFP and giantin are measured to be 1.72 (n = 15) and 0.54 (n = 16), consistent with our GLIM data, 1.74 ± 0.1 (n = 59) and 0.57 ± 0.05 (n = 103), respectively. The axial size of the Golgi ministack, defined as yGalT–mCherry – yGM130, is measured to be 293 ± 15 nm (n = 16), which agrees with the mean axial size of a population, 274 ± 5 nm (n = 204) (Tie et al., 2022).
Process “resized1” image using the macro, Side average_Lateral line intensity profile, to generate the lateral line intensity profile (Plugins > Macros > Side average_Lateral line intensity profile) (Figure 6). Lateral line intensity profiles of rim-localized Golgi proteins, such as giantin, show two peaks. On the other hand, those of interior-localized Golgi proteins, such as Golgi enzymes including GalT-mCherry, show a single broad peak. The lateral size of the Golgi ministack, defined as the distance between the two half-maximum points of the outer slopes in the lateral line intensity profile of giantin, is 723 ± 17 nm (n = 16), which agrees with the mean lateral size of a population, 700 ± 10 nm (n = 204) (Tie et al., 2022).

Figure 6. The axial and lateral line intensity profiles of “resized1” images of GM130, giantin, GalT-mCherry, and GFP-OSBP. The “resized1” images are processed by macros Side average_Axial line intensity profile and Side average_Lateral line intensity profile.
Recipes
33 mM nocodazole stock solution
Add 1 mL of DMSO to a vial containing 10 mg of nocodazole powder and vortex. Aliquot and store the stock solution at -20 °C. Centrifuge the nocodazole stock solution to remove insoluble residues before use.
PBS
Dissolve 0.2 g of KCl, 8.0 g of NaCl, 0.245 g of KH2PO4, and 1.44 g of Na2HPO4 in 800 mL of water. Adjust the pH to 7.4 and top up the volume to 1 L with water. Store at room temperature until use.
1 M Tris pH 8.0
Dissolve 121.1 g of Tris base in 800 mL of water. Adjust the pH to 8.0 using 1 M HCl and top up the volume to 1 L with water. Store at room temperature until use.
4% paraformaldehyde fixative
Dissolve 4.0 g of paraformaldehyde powder in 100 mL of hot PBS. Filter the solution through a 0.45 µm syringe filter with Supor® membrane. Aliquot and store the solution at -20 °C.
CAUTION: Use proper personal protective equipment while working with paraformaldehyde powder, as it is carcinogenic and causes skin irritation.
100 mM NH4Cl
Dissolve 14.86 g of NH4Cl powder in 1 L of water. Store at room temperature until use.
10% saponin
Dissolve 1.0 g of saponin powder in 10 mL of water, aliquot, and store at -20 °C until use.
Antibody dilution buffer
Dissolve 2.0 g of BSA in 94 mL of PBS and add 5 mL of FBS and 1 mL of 10% saponin. The solution is filtered through a 0.45 µm syringe filter with Supor® membrane, aliquoted, and stored at -20 °C.
Mowiol mounting medium
Dissolve 1.2 g of Mowiol 4-88, 0.36 g of DABCO, 3.0 g of glycerol, and 1.2 mL of 1 M Tris pH 8.0 in 7.8 mL of water. Dissolve the mixture by vortexing with incubation in a 60 °C water bath. Aliquot and store the solution at -20 °C until use.
Acknowledgments
This project is supported by the Ministry of Education, Singapore, under its Tier 2 MOE-T2EP30221-0001 and Tier 1 RG 25/22. This protocol's original research has been published (Tie et al., 2022). We thank R. Zoncu for sharing the plasmid DNA, pLJM1-FLAG-GFP-OSBP.
Competing interests
The authors declare no conflicts of interest or competing interests.
References
Bottanelli, F., Kromann, E. B., Allgeyer, E. S., Erdmann, R. S., Wood Baguley, S., Sirinakis, G., Schepartz, A., Baddeley, D., Toomre, D. K., Rothman, J. E. et al. (2016). Two-colour live-cell nanoscale imaging of intracellular targets. Nat Commun 7: 10778.
- Cole, N. B., Sciaky, N., Marotta, A., Song, J. and Lippincott-Schwartz, J. (1996). Golgi dispersal during microtubule disruption: regeneration of Golgi stacks at peripheral endoplasmic reticulum exit sites. Mol Biol Cell 7(4): 631-50.
- Dejgaard, S. Y., Murshid, A., Dee, K. M. and Presley, J. F. (2007). Confocal microscopy-based linescan methodologies for intra-Golgi localization of proteins. J Histochem Cytochem 55(7): 709-719.
- Glick, B. S. and Luini, A. (2011). Models for Golgi traffic: a critical assessment. Cold Spring Harb Perspect Biol 3(11): a005215.
- Hao, X., Allgeyer, E. S., Lee, D. R., Antonello, J., Watters, K., Gerdes, J. A., Schroeder, L. K., Bottanelli, F., Zhao, J., Kidd, P., et al. (2021). Three-dimensional adaptive optical nanoscopy for thick specimen imaging at sub-50-nm resolution. Nat Methods 18(6): 688-693.
- Klumperman, J. (2011). Architecture of the mammalian Golgi. Cold Spring Harb Perspect Biol 3:a005181.
- Lu, L. and Hong, W. (2014). From endosomes to the trans-Golgi network. Semin Cell Dev Biol 31: 30-39.
- Rogalski, A. A., Bergmann, J. E. and Singer, S. J. (1984). Effect of microtubule assembly status on the intracellular processing and surface expression of an integral protein of the plasma membrane. J Cell Biol 99(3): 1101-1109.
- Schermelleh, L., A. Ferrand, T. Huser, C. Eggeling, M. Sauer, O. Biehlmaier, and G.P.C. Drummen. (2019). Super-resolution microscopy demystified. Nat Cell Biol 21:72-84.
- Tie, H. C., Chen, B., Sun, X., Cheng, L. and Lu, L. (2017). Quantitative Localization of a Golgi Protein by Imaging Its Center of Fluorescence Mass. J Vis Exp(126): 55996.
- Tie, H. C., Ludwig, A., Sandin, S. and Lu, L. (2018). The spatial separation of processing and transport functions to the interior and periphery of the Golgi stack. Elife 7: e41301.
- Tie, H. C., Mahajan, D., Chen, B., Cheng, L., VanDongen, A. M. and Lu, L. (2016). A novel imaging method for quantitative Golgi localization reveals differential intra-Golgi trafficking of secretory cargoes. Mol Biol Cell 27(5): 848-861.
- Tie, H. C., Mahajan, D. and Lu, L. (2022). Visualizing intra-Golgi localization and transport by side-averaging Golgi ministacks. J Cell Biol 221(6): e202109114.
- Trucco, A., Polishchuk, R. S., Martella, O., Di Pentima, A., Fusella, A., Di Giandomenico, D., San Pietro, E., Beznoussenko, G. V., Polishchuk, E. V., Baldassarre, M., et al. (2004). Secretory traffic triggers the formation of tubular continuities across Golgi sub-compartments. Nat Cell Biol 6(11): 1071-1081.
- Van De Moortele, S., Picart, R., Tixier-Vidal, A. and Tougard, C. (1993). Nocodazole and taxol affect subcellular compartments but not secretory activity of GH3B6 prolactin cells. Eur J Cell Biol 60(2): 217-227.
- Zhang, Y., Schroeder, L. K., Lessard, M. D., Kidd, P., Chung, J., Song, Y., Benedetti, L., Li, Y., Ries, J., Grimm, J. B., et al. (2020). Nanoscale subcellular architecture revealed by multicolor three-dimensional salvaged fluorescence imaging. Nat Methods 17(2): 225-231.
Article Information
Copyright
© 2023 The Author(s); This is an open access article under the CC BY-NC license (https://creativecommons.org/licenses/by-nc/4.0/).
How to cite
Readers should cite both the Bio-protocol article and the original research article where this protocol was used:
- Mahajan, D., Tie, H. C. and Lu, L. (2023). Visualizing the Cisternal Organization of Golgi Ministacks in HeLa Cells by Side-averaging. Bio-protocol 13(8): e4658. DOI: 10.21769/BioProtoc.4658.
- Tie, H. C., Mahajan, D. and Lu, L. (2022). Visualizing intra-Golgi localization and transport by side-averaging Golgi ministacks. J Cell Biol 221(6): e202109114.
Category
Cell Biology > Cell imaging > Fluorescence
Cell Biology > Cell imaging > Super resolution imaging
Do you have any questions about this protocol?
Post your question to gather feedback from the community. We will also invite the authors of this article to respond.