- Protocols

- Articles and Issues
- For Authors
- About
- Become a Reviewer

Amplification and Quantitation of Telomeric Extrachromosomal Circles

Published: Vol 13, Iss 5, Mar 5, 2023 DOI: 10.21769/BioProtoc.4627 Views: 2319
Reviewed by: Gal HaimovichShyam SrivatsAnonymous reviewer(s)
Original research article
The authors used this protocol in:

Jun 2021
Advertisement


Protocol Collections
Comprehensive collections of detailed, peer-reviewed protocols focusing on specific topics


Abstract
Telomeres are structures that cap the ends of linear chromosomes and play critical roles in maintaining genome integrity and establishing the replicative lifespan of cells. In stem and cancer cells, telomeres are actively elongated by either telomerase or the alternative lengthening of telomeres (ALT) pathway. This pathway is characterized by several hallmark features, including extrachromosomal C-rich circular DNAs that can be probed to assess ALT activity. These so-called C-circles are the product of ALT-associated DNA damage repair processes and simultaneously serve as potential templates for iterative telomere extension. This bifunctional nature makes C-circles highly sensitive and specific markers of ALT. Here, we describe a C-circle assay, adapted from previous reports, that enables the quantitation of C-circle abundance in mammalian cells subjected to a wide range of experimental perturbations. This protocol combines the Quick C-circle Preparation (QCP) method for DNA isolation with fluorometry-based DNA quantification, rolling circle amplification (RCA), and detection of C-circles using quantitative PCR. Moreover, the inclusion of internal standards with well-characterized telomere maintenance mechanisms (TMMs) allows for the reliable benchmarking of cells with unknown TMM status. Overall, our work builds upon existing protocols to create a generalizable workflow for in vitro C-circle quantitation and ascertainment of TMM identity.
Keywords: Alternative lengthening of telomeresBackground
To avoid the loss of genetic information and the acquisition of potentially lethal genomic aberrations during DNA replication, linear chromosomes possess nucleoprotein cap structures known as telomeres. Conversely, active telomere extension imparts cells with replicative immortality, which is essential during embryonic development (L. Liu et al., 2007), as well as during malignant transformation and cancer progression (Robinson and Schiemann, 2016; Robinson et al., 2019). In most developmental and tumorigenic contexts, telomere extension is carried out by the reverse transcriptase telomerase. However, telomeres are also extended in a telomerase-independent fashion through a mechanism known as alternative lengthening of telomeres (ALT), which is active in embryonic stem cells and early embryogenesis (L. Liu et al., 2007; Pickett and Reddel, 2015). Moreover, approximately 15% of tumors are reliant upon ALT for telomere synthesis, with some cancer types showing evidence of ALT in more than half of patients (Sung et al., 2020). Given the growing recognition of the prevalence and functional significance of ALT in both development and disease, establishing robust methods for monitoring ALT activity is of critical importance.
Telomere lengthening via ALT is mediated by homologous recombination (HR) between adjacent telomere templates, followed by DNA synthesis through a mechanism similar to break-induced replication (BIR) (Dilley et al., 2016; Roumelioti et al., 2016). Importantly, telomere HR and BIR generate small circular DNAs containing telomeric DNA sequences (T. Zhang et al., 2019).These telomeric extrachromosomal circles, termed C-circles, act as specific markers that can be used to quantitate ALT activity in biological samples (Henson et al., 2009). More broadly, multiple methods exist to assay telomere maintenance mechanism (TMM) identity. For example, HR of contiguous telomeres results in telomere sister chromatid exchange (T-SCE), a hallmark of ALT (Londono-Vallejo et al., 2004) that can be visualized using chromosome orientation fluorescence in situ hybridization (CO-FISH) (Cesare et al., 2015). In addition, ALT-associated HR and DNA synthesis are facilitated by the promyelocytic leukemia protein (PML) within structures known as ALT-associated PML bodies (ABPs) (Yeager et al., 1999; J. M. Zhang et al., 2019). APBs can be detected and quantified using a combined immunofluorescence/FISH approach (Henson et al., 2005). Lastly, mutational loss (Lovejoy et al., 2012) or downregulation (Robinson et al., 2020) of the ATRX/DAXX chromatin remodeling complex is widespread in ALT-driven cell lines and tumors and can be easily ascertained using sequencing or quantitative gene expression methods. Despite the established relationships between these molecular markers and ALT, they suffer from drawbacks that restrict their experimental utility. For instance, T-SCE can occur during telomeric DNA damage repair (Mao et al., 2016; H. Liu et al., 2018). Moreover, loss of ATRX and DAXX is not uniformly distributed in ALT-positive specimens (Lovejoy et al., 2012) and can be found in ALT-negative specimens as well (de Nonneville and Reddel, 2021). The variable nature of these markers necessitates a combinatorial approach to TMM classification that includes a sensitive and reliable method for assessing ALT.
Because of the high degree of specificity of C-circles for ALT (Henson et al., 2009) and their relationship to clinical features of ALT-driven cancers (Grandin et al., 2019), measuring and quantifying C-circle abundance has become the preferred method for assessing ALT activity, motivating the continual development of improved methods for C-circle quantitation. Furthermore, the diversity of biological contexts in which telomeres are actively maintained and the differences in telomere dynamics across organisms (Monaghan et al., 2018; Wright and Shay, 2000) create demand for generalized approaches to the interrogation of TMM identity. Here, we describe a protocol for C-circle quantitation, based upon previous reports (Lau et al., 2013; Henson et al., 2017), consisting of (i) rapid isolation and spectroscopic quantification of genomic and extrachromosomal DNA using the Quick C-circle Preparation (QCP) method, (ii) enrichment of extrachromosomal circular DNAs via rolling circle amplification (RCA), and (iii) determination of C-circle abundance using quantitative polymerase chain reaction (qPCR). We have applied this protocol across an array of biological and experimental contexts (Robinson et al., 2020 and 2021), asserting it as a generalizable platform for C-circle detection and, when paired with additional approaches, the assignment of TMM identity.
Materials and Reagents
1.5 mL Eppendorf tube
96-well microplate, flat bottom, clear (Greiner Bio-One, catalog number: 655101)
MultiplateTM 96-well PCR plates, low profile, clear (Bio-Rad, catalog number: MLL9601)
Cell line(s) of interest and appropriate media/culture reagents
ALT-positive cell line for source of C-circle positive control/standard curve DNA [e.g., U2OS (ATCC, catalog number: HTB-96), Saos-2 (ATCC, catalog number: HTB-85)]
Telomerase-positive cell line for source of C-circle negative control DNA [e.g., HeLa (ATCC, catalog number: CCL-2), HCT116 (ATCC, catalog number: CCL-247)]
Tris base (Fisher Scientific, catalog number: BP152)
Potassium chloride (KCl) (Fisher Scientific, catalog number: BP366)
Magnesium chloride hexahydrate (MgCl2·6H2O) (Fisher Scientific, catalog number: M35)
NP-40 (also known as IGEPAL® CA-630) (Sigma-Aldrich, catalog number: I3021)
Tween 20 (also known as Polysorbate 20) (Fisher Scientific, catalog number: BP337)
Deionized, nuclease-free H2O [purified using Q-Gard® 2 purification cartridge (Sigma-Aldrich, catalog number: QGARD00D2)]
Protease (7.5 AU) (QIAGEN, catalog number: 19155)
QuantiFluor® ONE dsDNA system (Promega, catalog number: E4871)
Φ29 DNA polymerase [includes 10× Φ29 reaction buffer and 20 mg/mL bovine serum albumin (BSA); New England Biolabs, catalog number: M0269)
dNTP set (100 mM each dNTP) (Thermo Fisher Scientific, catalog number: R0181)
UltraPureTM dithiothreitol (Invitrogen, catalog number: 15508013)
iQTM SYBR® Green Supermix (Bio-Rad, catalog number: 1708880)
C-circle primers (human and mouse)
Forward: 5′-CGGTTTGTTTGGGTTTGGGTTTGGGTTTGGGTTTGGGTT-3′
Reverse: 5′-GGCTTGCCTTACCCTTACCCTTACCCTTACCCTTACCCT-3′
36B4 primers (human)
Forward: 5′-CAGCAAGT GGGAAGGTGTAATCC-3′
Reverse: 5′-CCATTCTATCATCAACGGGTACAA-3′
36B4 primers (mouse)
Forward: 5′-ACTAATCCCGCCAAAGCAACC-3′
Reverse: 5′-GTAGCGGTTTTGCTTTTTCATCCT-3′
Quick C-Circle Preparation (QCP) lysis buffer (1×) (see Recipes)
1 M Tris-HCl, pH 8.5 (see Recipes)
Φ29 DNA polymerase master mix (2.16×) (see Recipes)
Equipment
Plate reader (Promega GloMax® Explorer Multimode Microplate Reader; catalog number: GM3500)
Thermal cycler for RCA (MJ MiniTM Personal Thermal Cycle; Bio-Rad, catalog number: PTC1148)
Thermal cycler for qPCR [Bio-Rad C1000 TouchTM Thermal Cycler Chassis (Bio-Rad, catalog number: 1841100) equipped with CFX96 Optical Reaction Module for Real-Time PCR (Bio-Rad, catalog number: 1845097)]
Software
CFX Maestro Software for CFX Real-Time PCR Instruments (Bio-Rad; https://www.bio-rad.com/en-us/product/cfx-maestro-software-for-cfx-real-time-pcr-instruments?ID=OKZP7E15)
Microsoft Excel 2019 (v16.0)
Procedure
The following protocol is optimized for 2 × 10⁵ cells; however, we have successfully used this protocol to isolate and quantify C-circles with up to 5 × 10⁵ cells. If adjusting cell numbers, all volumes should be scaled appropriately. We have successfully quantified C-circle abundance in ALT-positive human (Robinson et al., 2021) and mouse (Robinson et al., 2020) cells isolated from distinct 2D and 3D culture conditions, and from cells subjected to an array of genetic and pharmacologic manipulations. Thus, in our hands, this represents a generalizable protocol for C-circle quantitation across diverse in vitro conditions. Therefore, specific details regarding cell lines and culture conditions are not included here, except where noted as experimental controls.
Note: Established ALT- and telomerase-positive cell lines (see Materials and Reagents) should be cultured in parallel with cell line(s) of interest. These serve as a source of DNA for standard curve generation (ALT) as well as positive (ALT) and negative (telomerase) controls for RCA and C-circle quantification. In our experience, results are best when all DNA (including controls) is isolated simultaneously. Doing so prevents degradation of DNA during storage or repeated freeze-thaw cycling of samples that are shared between experiments (e.g., positive and negative controls).
DNA isolation from cultured cells using Quick C-circle Preparation (QCP)
Pre-warm 1× QCP lysis buffer (see Recipe 1) in a 1.5 mL Eppendorf tube in a heat block or water bath set to 56 °C. Best results are achieved when QCP lysis buffer is made fresh for each experiment. Volume of QCP lysis buffer needed = 50 μL × (number of samples + 2) (included excess to account for pipetting error or evaporative loss).
If lyophilized, resuspend protease (7.5 AU) in 7 mL of deionized, nuclease-free H2O. Mix thoroughly and place on ice until use. If previously resuspended, remove from -20 °C storage and thaw slowly on ice.
Note: QIAGEN protease is preferred to other proteases because it can be heat-inactivated at 65 °C.
Liberate cells from culture plates (e.g., trypsinization, nonenzymatic digestion from 3D culture) or remove cells from frozen storage and place on ice. At this stage, samples should be cell pellets rather than suspensions.
Add protease to pre-warmed QCP lysis buffer at a ratio of 1:20 (i.e., 2.5 μL of protease to 50 μL of QCP lysis buffer). Mix thoroughly by vortexing and collect by microcentrifugation. This should be done immediately prior to cell resuspension.
Resuspend each cell pellet in 50 μL of QCP lysis buffer supplemented with protease. Mix by vortexing at 2,000 rpm for 15 s. Suspensions are viscous and may require additional mixing by pipetting up and down. Be careful not to introduce bubbles during resuspension.
Note: C-circles mixed with genomic DNA (i.e., in whole-cell lysates) are somewhat protected from shear forces compared to pure circular DNAs. While mixing samples by vortexing is acceptable and used throughout this protocol, repeated vortexing results in small but appreciable C-circle loss (<1% per 15 s vortex). If yield appears to be low during quantitation, vortex speed or frequency may be adjusted to minimize C-circle loss.
Incubate cell suspensions at 56 °C for 1 h on a heat block. Samples should be mixed by vortexing for 15 s every 15–20 min.
Increase temperature of heat block to 70 °C and incubate for 20 min to inactivate protease. Samples do not need to be mixed during this step.
Allow samples to cool slowly to room temperature on a benchtop. Once cooled, mix by vortexing at 2,000 rpm for 15 s and collect any evaporated liquid by microcentrifugation.
Samples may be used immediately for DNA quantitation and RCA. Otherwise, flash-freeze on dry ice and store at -80 °C.
Quantitation of total cellular DNA
Perform serial dilutions of QuantiFluor® ONE Lambda DNA (400 ng/μL) (from QuantiFluor® ONE dsDNA system) to generate dsDNA standards according to the manufacturer’s instructions. Final DNA concentrations are: 400, 200, 50, 12.5, 3.1, 0.8, and 0.2 ng/μL.
In a 96-well microplate, transfer 200 μL of QuantiFluor® ONE dsDNA dye to each well that will contain standards, experimental samples, or blanks (i.e., background fluorescence). Each standard, sample, and blank should be analyzed in duplicate.
Using a P2 pipettor, transfer 1 μL of each experimental sample or dsDNA standard prepared in Step B1 to the corresponding wells. For blank wells, add 1 μL of 1× TE buffer.
Mix the plate thoroughly using a plate shaker or by pipetting the contents of each well using a multichannel pipette. If using a pipette, do not pipette up the entire volume of each well, and eject slowly to avoid introducing air bubbles, which can interfere with fluorescence detection.
Incubate plate for 5 min at room temperature, protected from light.
Measure fluorescence using a plate reader. If using the GloMax® system, select the preloaded protocol “QuantiFluor ONE dsDNA System.” Otherwise, use the following excitation and emission parameters: 504 and 531 nm, respectively.
To calculate the DNA concentration of each experimental sample, first subtract the blank fluorescence from that of each standard and sample. Use these corrected values for the dsDNA standards to generate a standard curve of fluorescence intensity vs. DNA concentration (i.e., DNA concentration on x-axis and fluorescence on y-axis). Determine the DNA concentration of each sample using the standard curve equation (Figure 1).
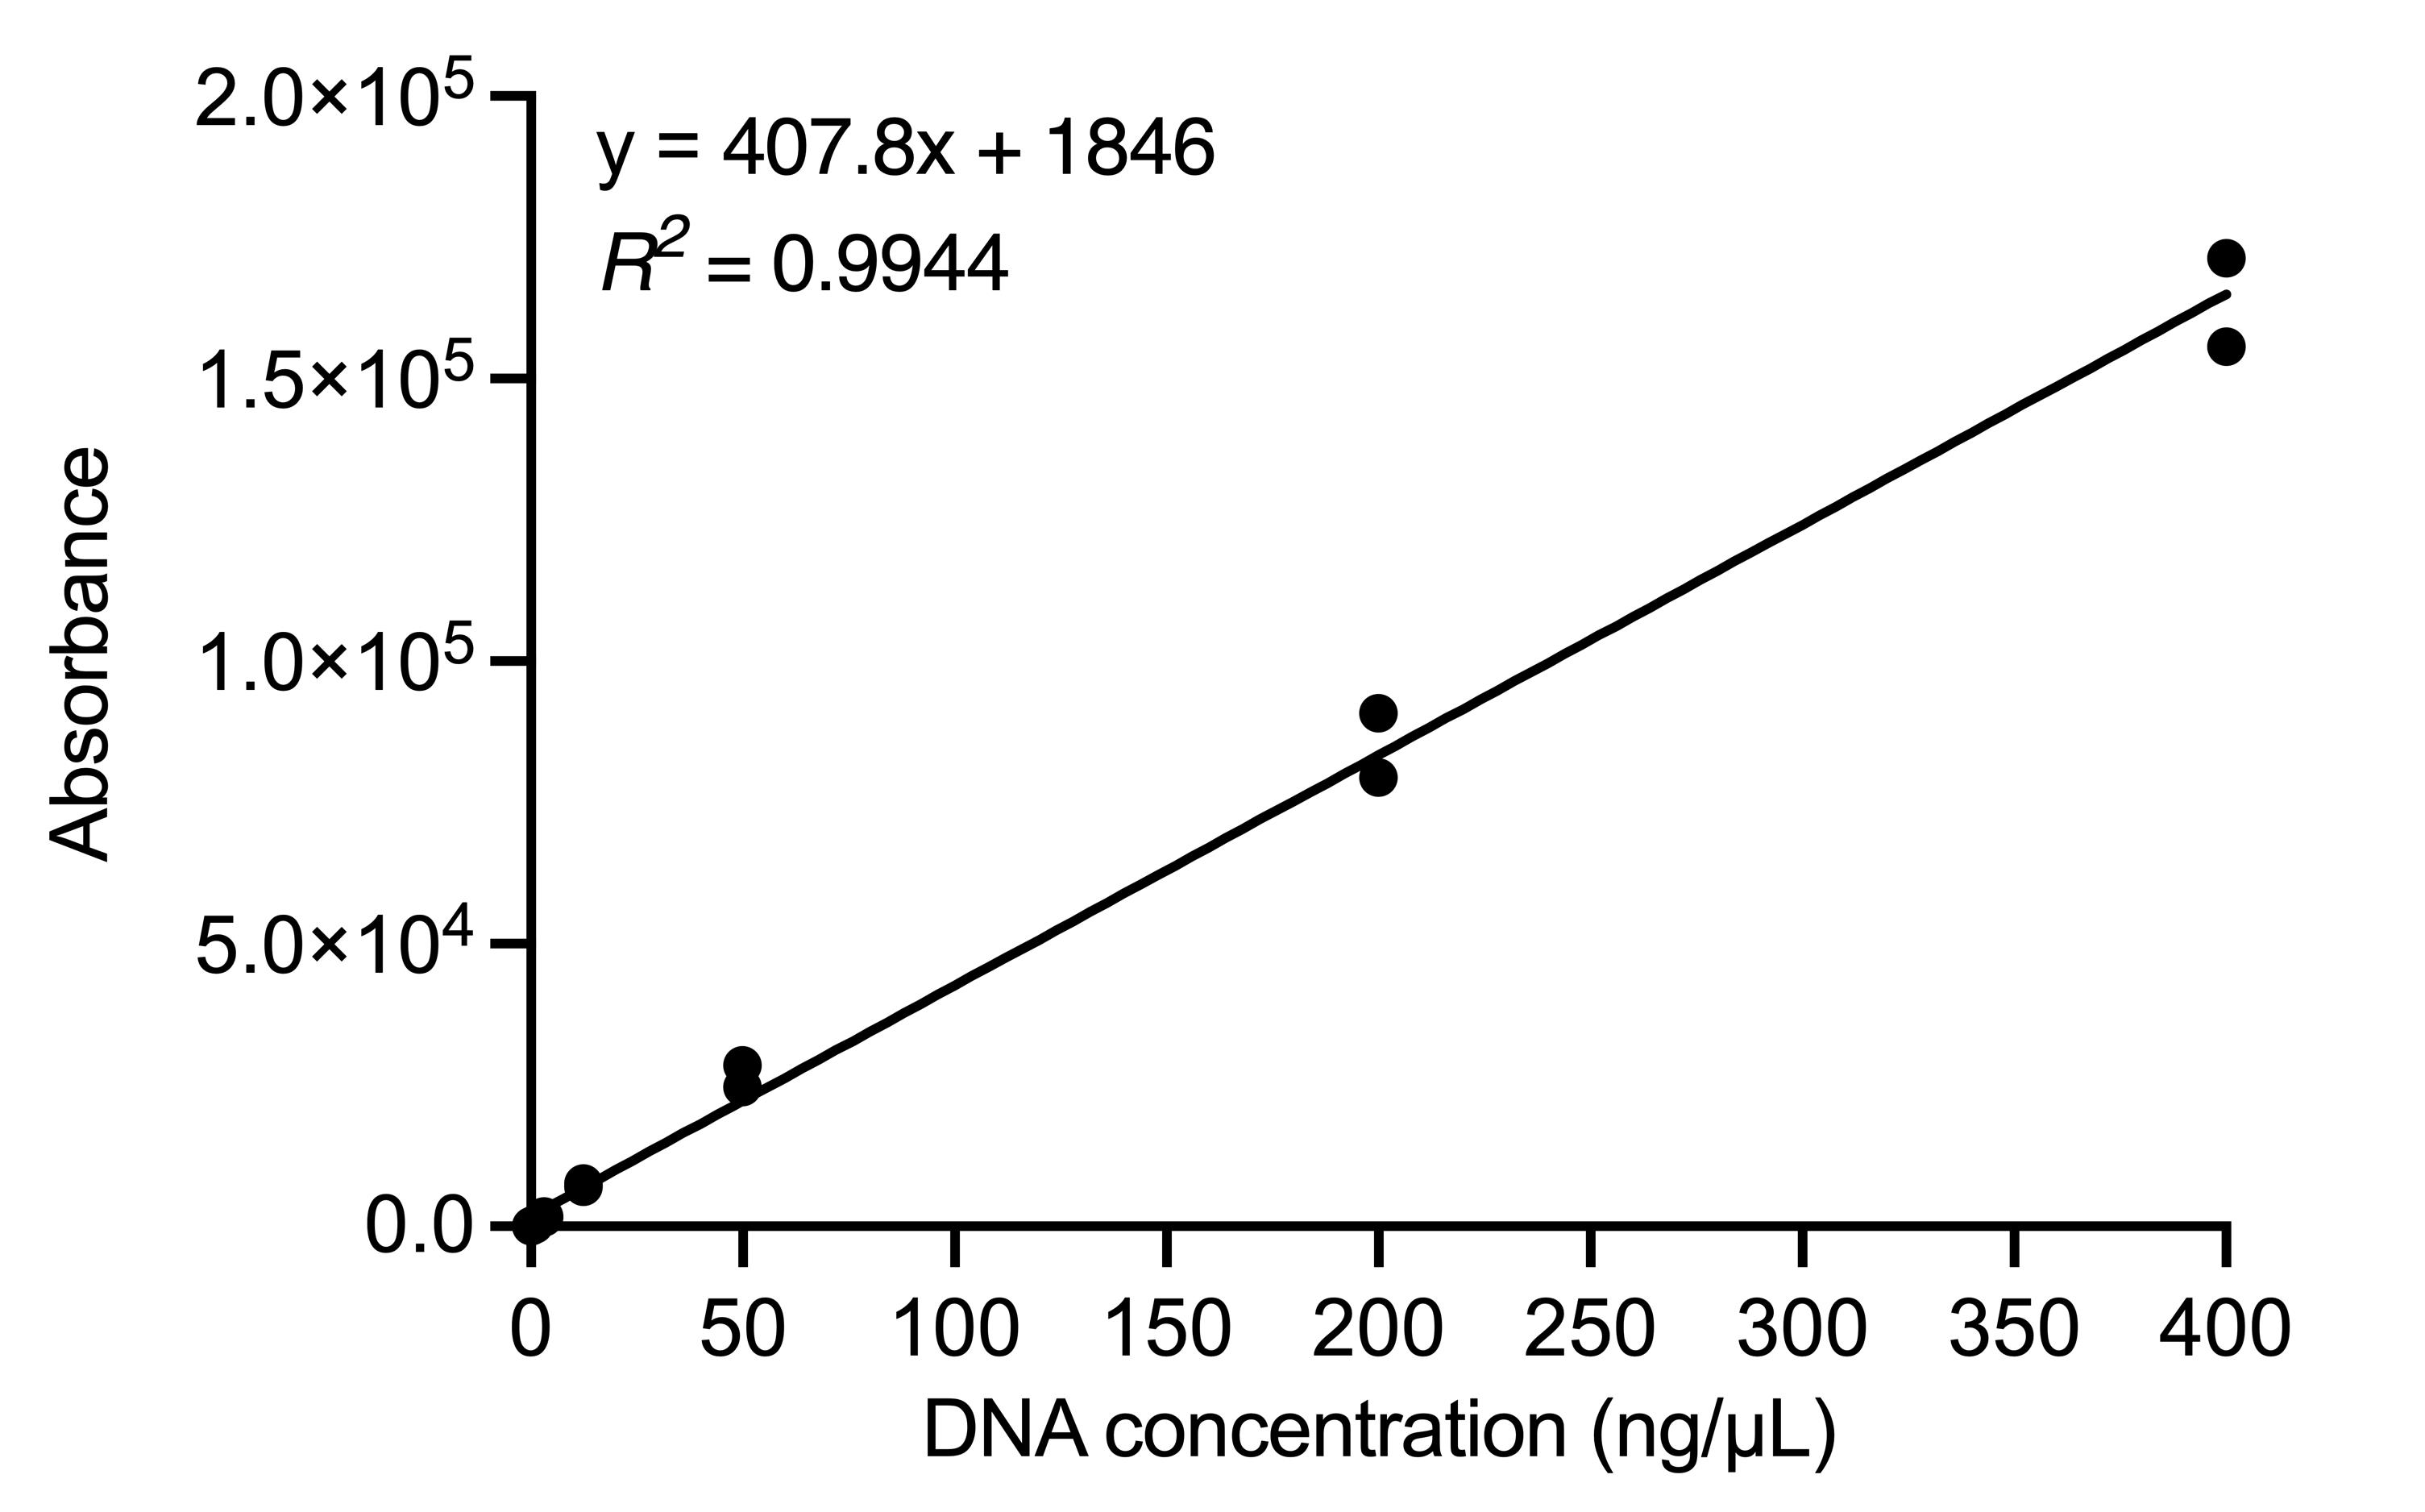
Figure 1. Representative standard curve of QuantiFluor® ONE Lambda DNA. Standard curve equation (top left) is used to calculate DNA abundance in experimental samples using measured absorbance. Each DNA concentration was analyzed and graphed in duplicate.
Rolling circle amplification (RCA) of extrachromosomal DNA
Make up Φ29 DNA polymerase master mix (see Recipe 3) and store aliquots at -20 °C if not used immediately. We have used frozen master mix up to one month after initial freezing with no appreciable impact on RCA efficiency.
If thawing QCP samples, place on ice to thaw slowly. Once thawed, mix by vortexing at 2,000 rpm for 15 s and collect by microcentrifugation. Keep samples and master mix on ice while setting up RCA reactions.
For samples isolated using QCP (including ALT-positive and ALT-negative controls), add 1 μL to 9 μL of 10 mM Tris, pH 7.6 in two 0.2 mL PCR tubes. Depending on the concentration of each sample, they may be diluted in 10 mM Tris, pH 7.6 to avoid pipetting small volumes. However, the total quantity of QCP buffer in each reaction must be the same and should not exceed 1 μL.
Aliquot 9.25 μL of Φ29 master mix for each reaction (plus excess, i.e., enough for two extra reactions) into an Eppendorf tube.
Remove Φ29 DNA polymerase from -20 °C storage and keep on ice or in a portable cooling block. Add 0.75 μL of polymerase per reaction (plus excess) to tube containing master mix to generate the final reaction mix. Mix by gently flicking the tubes and place on ice.
Note: Excess polymerase is used relative to template to ensure linear amplification of circular DNAs (rather than logarithmic, which could confound comparative analysis). Other polymerases (e.g., Klenow fragment of DNA polymerase I) may be used if they possess processivity and strand displacement capability as Φ29 polymerase.
Repeat step C4, aliquoting into a new Eppendorf tube. Add 0.75 μL of Milli-Q H2O per reaction to this tube. This serves as the final reaction mix for Φ29-deficient reactions, which are performed for each sample.
Note: Sample-specific background can be corrected by running a Φ29-deficient RCA reaction in parallel for each sample. This is important for C-circle quantitation by qPCR because denaturation during PCR enables the detection of linear telomeric DNA. In addition, the inclusion of Φ29-deficient controls is particularly useful for samples with low or unknown ALT activity, as these may exhibit relatively high background signal.
Add 10 μL of final reaction mix (Φ29-containing and Φ29-deficient) to one tube containing each QCP sample. Mix by gently vortexing (<1,500 rpm) for 5 s.
Incubate tubes in a thermal cycler according to the following thermal profile:
30 °C for 4–8 h (RCA).
Note: Increasing amplification time increases sensitivity at the expense of reduced linearity. If absolute C-circle abundance is known or expected to be high, 4 h is sufficient for amplification. If C-circle abundance is low or unknown, incubation should be increased to 8 h to maximize sensitivity. Reactions should not be extended beyond 8 h, as amplification becomes nonlinear at that time.
70 °C for 20 min (Φ29 inactivation).
4 °C for ∞.
Typically, we perform RCA for 8 h and allow to run overnight. Samples are stable at 4 °C until convenient to collect the following morning.
Generally, we use RCA reactions immediately for C-circle quantitation. However, reactions may also be stored at -20 °C for up to two weeks or at -80 °C for up to one month without appreciable DNA loss.
Determination of C-circle abundance using qPCR
Thaw SYBR® Green Supermix and primers from -20 °C storage on ice. Protect SYBR® Green Supermix from light.
Each sample will be used to quantify C-circle abundance as well as the abundance of the single-copy gene ribosomal protein lateral stalk subunit P0 (also known as 36B4; see Materials and Reagents). Single-copy gene abundance provides a measure of total DNA content, which can be used to normalize C-circle abundance and enable comparative analysis (see Data Analysis). Thus, all subsequent steps should account for the fact that both targets will be measured (e.g., making sufficient master mix).
Dilute DNA isolated from an ALT-positive cell line (e.g., U2OS, Saos-2) by QCP to obtain samples for generating a standard curve. For example, for a starting DNA concentration of 3.2 ng/μL, perform five two-fold serial dilutions for a final dilution series containing 3.2, 1.6, 0.8, 0.4, 0.2, and 0.1 ng/μL DNA. To account for differences in PCR efficiency between telomeric DNA and 36B4, each sample will be analyzed in duplicate for each target. Keep diluted samples on ice until ready to load PCR plate.
Note: RCA is not required prior to dilution and standard curve generation.
Assemble qPCR master mixes according to the recipe outlined in Table 1. In addition to Φ29-containing and Φ29-deficient RCA reactions, include a no-template control (using H2O in place of template DNA) to account for DNA contamination of PCR reagents. The Ct values for this no-template control should be at least four cycles greater than the Ct value of the lowest concentration on the standard curve.
Table 1. Recipe for qPCR master mix.
Reagent Final concentration Volume (μL) 2× SYBR® Green Supermix 1× 12.5 Forward primer (10 mM) 500 nM 1.25 Reverse primer (10 mM) 500 nM 1.25 RNase-free H2O - 6 Dilute each RCA sample to 0.5 ng/μL in 10 mM Tris, pH 7.6, using the concentrations calculated in Section B.
Note: qPCR is inhibited by both Φ29 polymerase and the inorganic pyrophosphate byproduct of RCA. To avoid qPCR inhibition, limit the RCA reaction that is added to each qPCR reaction or pretreat each RCA sample with a pyrophosphatase. Given the sensitivity of qPCR, it is generally best to limit the quantity of undiluted RCA reaction that is added to <5% of the qPCR reaction volume.
Add 4 μL (i.e., 2 ng) of template DNA (Φ29-containing or Φ29-deficient) or RNase-free H2O (for no-template control) to pre-designated wells of a 96-well PCR plate. Each sample should be analyzed in triplicate.
Add 21 μL of qPCR master mix to each well containing DNA or H2O. Mix by gently vortexing the plate for 5 s and collect volume by centrifugation.
Incubate plate in a real-time thermal cycler according to the following thermal profile:
95 °C for 15 min
95 °C for 15 s
54 °C for 2 min
72 °C for 1 min
Repeat steps b–d 34 times
Data analysis
To construct the telomeric DNA and single-copy gene standard curves, plot Ct (y-axis) vs. DNA concentration (x-axis; log scale) for each duplicate of the six standard DNA concentrations in Microsoft Excel. Draw a standard curve by fitting a best-fit line to the data (Figure 2). There should be good linearity of the standard curve (R2 > 0.98, p < 0.05).
In addition, the CFX Maestro software can be used to draw a standard curve to calculate qPCR efficiency, which describes how much of a target amplicon is being produced during each PCR cycle. To construct a standard curve in the CFX Maestro software, change designation of wells containing standard samples (i.e., from ALT-positive cell line; see step D3) to “Standard” on the plate setup (Settings → Plate Setup → View/Edit Plate). In addition, manually enter the DNA concentration in each standard well. The standard curve, along with the calculated efficiency, will now appear under the “Quantification” tab. For C-circle abundance (CCA) quantitation, efficiency should be close to 100% (± 5%).
Note: Examine all Ct values for the single-copy gene to identify any abnormally high or low values, which could indicate unexpected copy number loss or gain, respectively. Discrepancies secondary to copy number alteration may complicate quantitative assessment of CCA and the assignment of ALT status and necessitate repeating the qPCR with another single-copy gene.
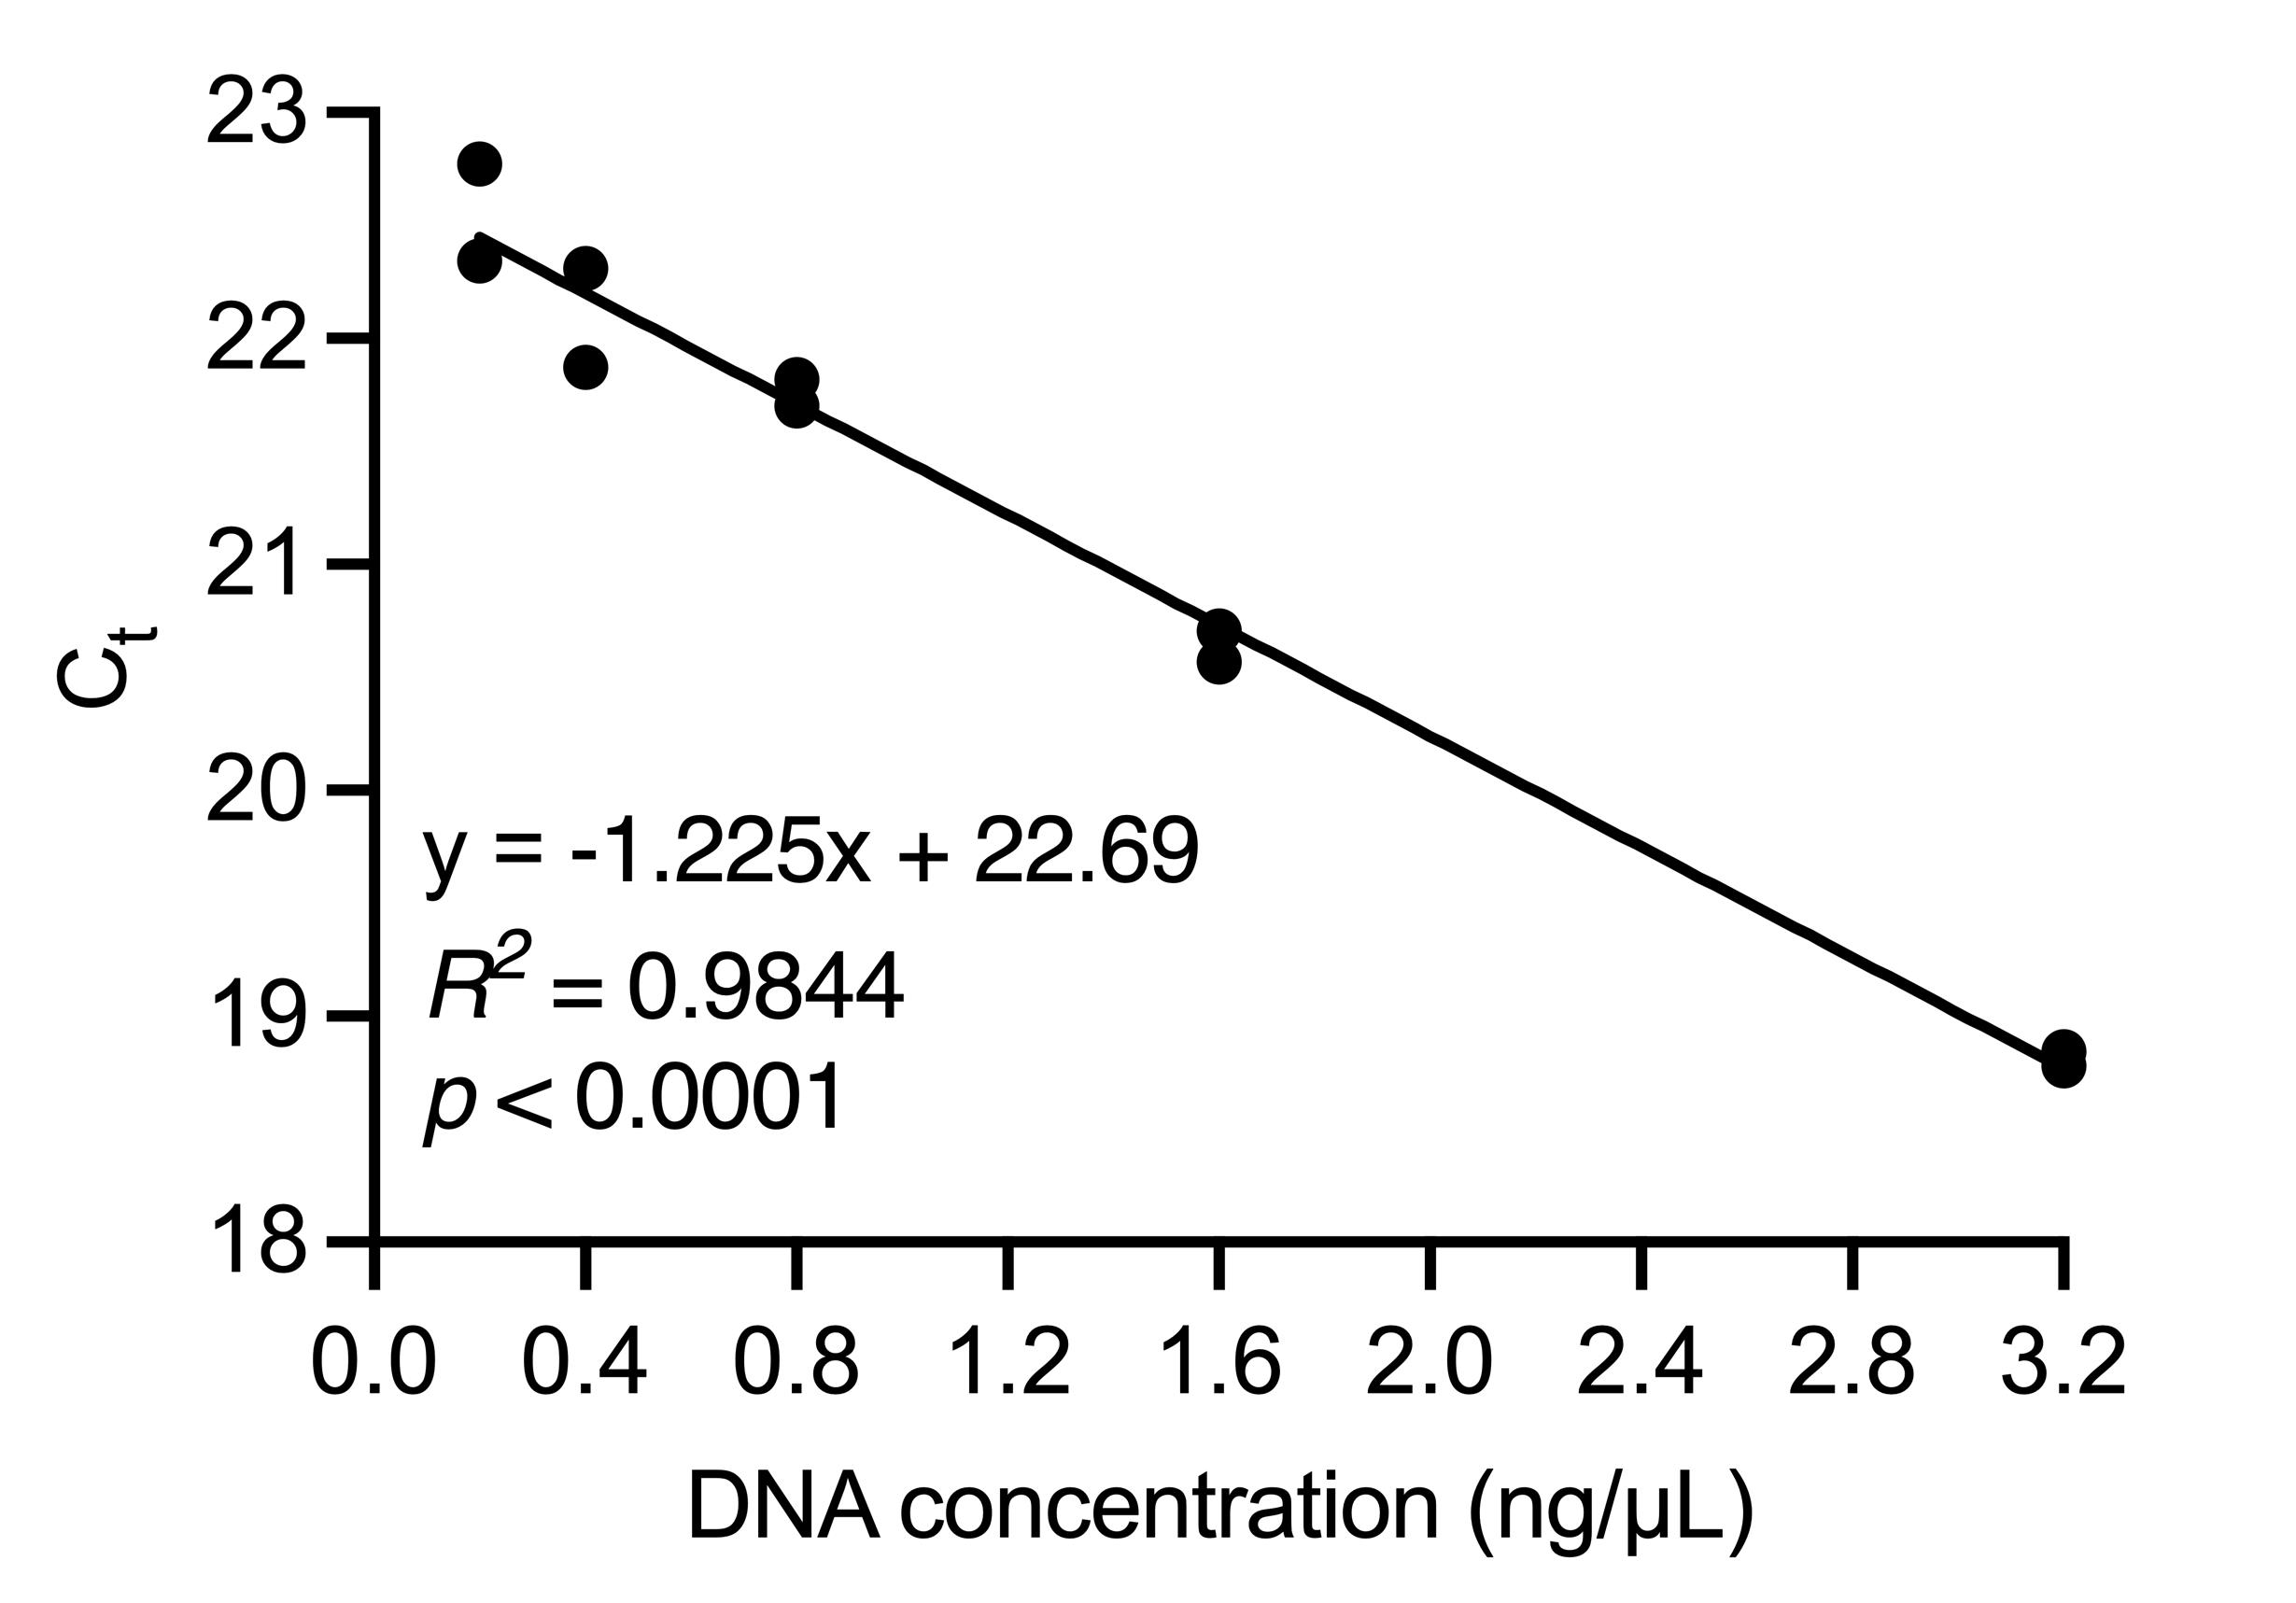
Figure 2. Representative standard curve of Saos-2 DNA. Ct values were obtained using telomere-specific qPCR primers. Standard curve equation (bottom left) was used to calculate DNA abundance in experimental samples using sample-specific Ct values and was repeated for single-copy gene. Each DNA concentration was analyzed and graphed in duplicate.Determine the relative telomeric content (TC) and relative single-copy content (SC) for each replicate using the appropriate standard curve equation, using the Ct values obtained by qPCR. This calculation will provide the total TC (i.e., chromosomal and extrachromosomal) rather than specifically C-circle content.
Calculate the mean (μ) TC and SC and standard deviation (σ) for each sample. Use these values to calculate the coefficient of variation (CV) for each sample according to the following:
CVs for TC (Φ29-containing) should be <15%, while CVs for TC (Φ29-deficient) and SC should be <10%.
Calculate normalized telomere content (NTC) by dividing the average TC by the average SC from the same sample. The CV for NTC is estimated as the sum of the CVs for TC and its matched SC for a given sample.
Calculate CCA in each sample according to the following:
CCA=NTCΦ29-NTCNo Φ29
Calculate the mean NTC for each experimental condition. Construct error bars for CCA using these mean values and the NTC CVs calculated in step 4, as follows:
Upper error=(μΦ29+CVΦ29)-(μNo Φ29-CVNo Φ29)= (μΦ29-μNo Φ29)+(CVΦ29+CVNo Φ29)
Lower error=(μΦ29-CVΦ29)-(μNo Φ29+CVNo Φ29)= (μΦ29-μNo Φ29)-(CVΦ29+CVNo Φ29)Plot CCA mean (step 5) and error (step 6) for each condition on a bar graph. If comparing groups, use the appropriate statistical test for comparison of means (i.e., Student’s t-test for two means, ANOVA for more than two means, or nonparametric equivalents).
Assign TMM identity to each experimental group. A group is considered ALT-positive if (i) its CCA mean is >1% of the ALT-positive control; and (ii) its CCA lower error is nonnegative.
Recipes
Quick C-Circle Preparation (QCP) lysis buffer (1×)
Stock reagent Final concentration Volume (per 100 mL) 1 M Tris-HCl, pH 8.5 10 mM 1 mL 5 M KCl 50 mM 1 mL 1 M MgCl2 2 mM 200 μL NP-40 0.5% (v/v) 500 μL Tween 20 0.5% (v/v) 500 μL Milli-Q H2O - 96.8 mL 1 M Tris-HCl, pH 8.5
For 100 mL, dissolve 12.11 g of Tris base in 80 mL of Milli-Q H2O.
Adjust pH to 8.5 by adding concentrated HCl dropwise with continuous stirring.
Bring volume to 100 mL with Milli-Q H2O.
Φ29 DNA polymerase master mix (2.16×)
Stock reagent Final concentration Volume (per 925 μL) 10× Φ29 reaction buffer 2.16× 200 μL 20 mg/mL BSA 432 μg/mL 20 μL Tween 20 (10% v/v in H2O) 0.216% (v/v) 20 μL 100 mM dATP 2.16 mM 20 μL 100 mM dGTP 2.16 mM 20 μL 100 mM dTTP 2.16 mM 20 μL 100 mM dCTP 2.16 mM 20 μL 1 M dithiothreitol 8.65 mM 8 μL Milli-Q H2O - 597 μL
Acknowledgments
We are grateful to all authors (M. Miyagi, J.A. Scarborough, J.G. Scott, and D.J. Taylor) of the original research paper from which this protocol is derived (Robinson et al., 2021) for their contributions to that work, including the design and implementation of this protocol. We also thank members of the Schiemann laboratory for their assistance in crafting and critically appraising this manuscript. Funding support was provided by the National Institutes of Health to W.P.S. (CA236273) and N.J.R. (F30 CA213892). Additional support was graciously provided to W.P.S. by the Case Comprehensive Cancer Center’s Research Innovation Fund, which is supported by the Case Council and Friends of the Case Comprehensive Cancer Center.
Competing interests
The authors declare that they have no compe ting interests.
References
- Cesare, A. J., Heaphy, C. M. and O'Sullivan, R. J. (2015). Visualization of Telomere Integrity and Function In Vitro and In Vivo Using Immunofluorescence Techniques. Curr Protoc Cytom 73: 12 40 11-12 40 31.
- de Nonneville, A. and Reddel, R. R. (2021). Alternative lengthening of telomeres is not synonymous with mutations in ATRX/DAXX.Nat Commun 12(1): 1552.
- Dilley, R. L., Verma, P., Cho, N. W., Winters, H. D., Wondisford, A. R. and Greenberg, R. A. (2016). Break-induced telomere synthesis underlies alternative telomere maintenance.Nature 539(7627): 54-58.
- Grandin, N., Pereira, B., Cohen, C., Billard, P., Dehais, C., Carpentier, C., Idbaih, A., Bielle, F., Ducray, F., Figarella-Branger, D., et al. (2019). The level of activity of the alternative lengthening of telomeres correlates with patient age in IDH-mutant ATRX-loss-of-expression anaplastic astrocytomas.Acta Neuropathol Commun 7(1): 175.
- Henson, J. D., Cao, Y., Huschtscha, L. I., Chang, A. C., Au, A. Y., Pickett, H. A. and Reddel, R. R. (2009). DNA C-circles are specific and quantifiable markers of alternative-lengthening-of-telomeres activity. Nat Biotechnol 27(12): 1181-1185.
- Henson, J. D., Hannay, J. A., McCarthy, S. W., Royds, J. A., Yeager, T. R., Robinson, R. A., Wharton, S. B., Jellinek, D. A., Arbuckle, S. M., Yoo, J., et al. (2005). A robust assay for alternative lengthening of telomeres in tumors shows the significance of alternative lengthening of telomeres in sarcomas and astrocytomas. Clin Cancer Res 11(1): 217-225.
- Henson, J. D., Lau, L. M., Koch, S., Martin La Rotta, N., Dagg, R. A. and Reddel, R. R. (2017). The C-Circle Assay for alternative-lengthening-of-telomeres activity.Methods 114: 74-84.
- Lau, L. M., Dagg, R. A., Henson, J. D., Au, A. Y., Royds, J. A. and Reddel, R. R. (2013). Detection of alternative lengthening of telomeres by telomere quantitative PCR.Nucleic Acids Res 41(2): e34.
- Liu, H., Xie, Y., Zhang, Z., Mao, P., Liu, J., Ma, W. and Zhao, Y. (2018). Telomeric Recombination Induced by DNA Damage Results in Telomere Extension and Length Heterogeneity. Neoplasia 20(9): 905-916.
- Liu, L., Bailey, S. M., Okuka, M., Munoz, P., Li, C., Zhou, L., Wu, C., Czerwiec, E., Sandler, L., Seyfang, A., Blasco, M. A. and Keefe, D. L. (2007). Telomere lengthening early in development. Nat. Cell Biol 9(12): 1436-1441.
- Londono-Vallejo, J. A., Der-Sarkissian, H., Cazes, L., Bacchetti, S. and Reddel, R. R. (2004). Alternative lengthening of telomeres is characterized by high rates of telomeric exchange.Cancer Res 64(7): 2324-2327.
- Lovejoy, C. A., Li, W., Reisenweber, S., Thongthip, S., Bruno, J., de Lange, T., De, S., Petrini, J. H., Sung, P. A., Jasin, M., et al. (2012). Loss of ATRX, genome instability, and an altered DNA damage response are hallmarks of the alternative lengthening of telomeres pathway.PLoS Genet 8(7): e1002772.
- Mao, P., Liu, J., Zhang, Z., Zhang, H., Liu, H., Gao, S., Rong, Y. S. and Zhao, Y. (2016). Homologous recombination-dependent repair of telomeric DSBs in proliferating human cells.Nat Commun 7: 12154.
- Monaghan, P., Eisenberg, D. T. A., Harrington, L. and Nussey, D. (2018). Understanding diversity in telomere dynamics. Philos Trans R Soc Lond B Biol Sci 373(1741): 20160435.
- Pickett, H. A. and Reddel, R. R. (2015). Molecular mechanisms of activity and derepression of alternative lengthening of telomeres. Nat Struct Mol Biol 22(11): 875-880.
- Robinson, N. J., Miyagi, M., Scarborough, J. A., Scott, J. G., Taylor, D. J. and Schiemann, W. P. (2021). SLX4IP promotes RAP1 SUMOylation by PIAS1 to coordinate telomere maintenance through NF-kappaB and Notch signaling. Sci Signal 14(689): eabe9613.
- Robinson, N. J., Morrison-Smith, C. D., Gooding, A. J., Schiemann, B. J., Jackson, M. W., Taylor, D. J. and Schiemann, W. P. (2020). SLX4IP and telomere dynamics dictate breast cancer metastasis and therapeutic responsiveness.Life Sci Alliance 3(4): e201900427.
- Robinson, N. J. and Schiemann, W. P. (2016). Means to the ends: The role of telomeres and telomere processing machinery in metastasis.Biochim Biophys Acta 1866(2): 320-329.
- Robinson, N. J., Taylor, D. J. and Schiemann, W. P. (2019). Stem cells, immortality, and the evolution of metastatic properties in breast cancer: telomere maintenance mechanisms and metastatic evolution.J Cancer Metastasis Treat 5.
- Roumelioti, F. M., Sotiriou, S. K., Katsini, V., Chiourea, M., Halazonetis, T. D. and Gagos, S. (2016). Alternative lengthening of human telomeres is a conservative DNA replication process with features of break-induced replication. EMBO Rep 17(12): 1731-1737.
- Sung, J. Y., Lim, H. W., Joung, J. G. and Park, W. Y. (2020). Pan-Cancer Analysis of Alternative Lengthening of Telomere Activity.Cancers (Basel) 12(8): 2207.
- Wright, W. E. and Shay, J. W. (2000). Telomere dynamics in cancer progression and prevention: fundamental differences in human and mouse telomere biology. Nat Med 6(8): 849-851.
- Yeager, T. R., Neumann, A. A., Englezou, A., Huschtscha, L. I., Noble, J. R. and Reddel, R. R. (1999). Telomerase-negative immortalized human cells contain a novel type of promyelocytic leukemia (PML) body. Cancer Res 59(17): 4175-4179.
- Zhang, J. M., Yadav, T., Ouyang, J., Lan, L. and Zou, L. (2019). Alternative Lengthening of Telomeres through Two Distinct Break-Induced Replication Pathways. Cell Rep 26(4): 955-968 e953.
- Zhang, T., Zhang, Z., Shengzhao, G., Li, X., Liu, H. and Zhao, Y. (2019). Strand break-induced replication fork collapse leads to C-circles, C-overhangs and telomeric recombination. PLoS Genet 15(2): e1007925.
Article Information
Copyright
© 2023 The Author(s); This is an open access article under the CC BY-NC license (https://creativecommons.org/licenses/by-nc/4.0/).
How to cite
Readers should cite both the Bio-protocol article and the original research article where this protocol was used:
- Robinson, N. J. and Schiemann, W. P. (2023). Amplification and Quantitation of Telomeric Extrachromosomal Circles. Bio-protocol 13(5): e4627. DOI: 10.21769/BioProtoc.4627.
- Robinson, N. J., Miyagi, M., Scarborough, J. A., Scott, J. G., Taylor, D. J. and Schiemann, W. P. (2021). SLX4IP promotes RAP1 SUMOylation by PIAS1 to coordinate telomere maintenance through NF-kappaB and Notch signaling. Sci Signal 14(689): eabe9613.
Category
Cancer Biology > Replicative immortality > Cell biology assays
Molecular Biology > DNA > DNA quantification
Do you have any questions about this protocol?
Post your question to gather feedback from the community. We will also invite the authors of this article to respond.