- Protocols

- Articles and Issues
- For Authors
- About
- Become a Reviewer

Isolation of Nuclei from Human Snap-frozen Liver Tissue for Single-nucleus RNA Sequencing
Published: Vol 13, Iss 3, Feb 5, 2023 DOI: 10.21769/BioProtoc.4601 Views: 2604
Reviewed by: Laxmi Narayan MishraNitin AmdareAmit Kumar
Original research article
The authors used this protocol in:

Dec 2021
Advertisement


Protocol Collections
Comprehensive collections of detailed, peer-reviewed protocols focusing on specific topics


Abstract
Single-nucleus RNA sequencing (snRNA-seq) provides a powerful tool for studying cell type composition in heterogenous tissues. The liver is a vital organ composed of a diverse set of cell types; thus, single-cell technologies could greatly facilitate the deconvolution of liver tissue composition and various downstream omics analyses at the cell-type level. Applying single-cell technologies to fresh liver biopsies can, however, be very challenging, and snRNA-seq of snap-frozen liver biopsies requires some optimization given the high nucleic acid content of the solid liver tissue. Therefore, an optimized protocol for snRNA-seq specifically targeted for the use of frozen liver samples is needed to improve our understanding of human liver gene expression at the cell-type resolution. We present a protocol for performing nuclei isolation from snap-frozen liver tissues, as well as guidance on the application of snRNA-seq. We also provide guidance on optimizing the protocol to different tissue and sample types.
Keywords: Nuclei isolationBackground
The human liver performs critical functions ranging from lipid metabolism, amino acid synthesis, and drug processing to protection from portal venous bacteria and viruses (Trefts et al., 2017). Consistent with this diverse range of functions, its spatial organization is specifically tailored (Ben-Moshe and Itzkovitz, 2019). For example, lobule zonation between a central vein and portal triad divides hepatocyte and endothelial functions (Halpern et al., 2017). Diverse and specialized cell types populate the liver (Aizarani et al., 2019), and thus studies involving the liver would benefit greatly from single-cell resolution.
The field of single-cell genomics has accelerated cellular composition studies of tissues and samples. Single-cell RNA sequencing (RNA-seq) has been used to discover subtypes within blood monocytes and dendritic cells (Villani et al., 2017), as well as to discover myeloid differentiation pathways (Drissen et al., 2016). In solid tissues, single-cell RNA-seq has provided insight into fibrosis mechanisms in lung (Xu et al., 2016) and kidney (Kuppe et al., 2021). Single-cell RNA-seq has also been used in liver to transcriptionally characterize the landscape of cell types (MacParland et al., 2018), as well as the immune landscape in hepatocellular carcinoma (HCC) (Zhang et al., 2019).
One adaptation of single-cell RNA-seq is the use of nuclei instead of whole cells. Single-nucleus RNA-seq (snRNA-seq) has been shown to produce similar results as scRNA-seq (Habib et al., 2017). Furthermore, it can identify a greater expression diversity within cell types than scRNA-seq (Andrews et al., 2022). A main advantage of snRNA-seq is its applicability to frozen tissues. Archived tissues remove the need to coordinate tissue processing immediately after biopsy collection, which is challenging for human tissues. Archived tissues may also have additional phenotype and molecular data readily available, allowing for more thorough analyses and controlling of confounders.
However, the isolation of nuclei from frozen tissues for snRNA-seq presents distinct challenges. Snap freezing can result in the formation of ice crystals, disrupting the tissue and possibly decreasing the yield of intact nuclei (Larson and Chin, 2021). This can also result in higher amounts of tissue debris and contaminating ambient RNA in the lysate and nucleus suspension. We present a specifically tailored protocol for snRNA-seq of human frozen liver tissue (Rao et al., 2021), balancing requirements for yield and debris removal. For an overview of the protocol, see Figure 1. The advantage of our protocol is the rapid isolation of nuclei with minimum equipment, which prevents RNA degradation and increases throughput. Our protocol avoids labor-intensive flow cytometry sorting, which may require high yields and decrease throughput. We also avoid density-based centrifugation, which increases run times and susceptibility to RNA degradation. In addition, we provide details on how to isolate nuclei suitable for droplet-based microfluidics applications, as well as data analysis guidelines. While optimized for snap-frozen liver tissue, this protocol can be adapted to other frozen tissue samples, such as adipose tissue (Alvarez et al., 2020).
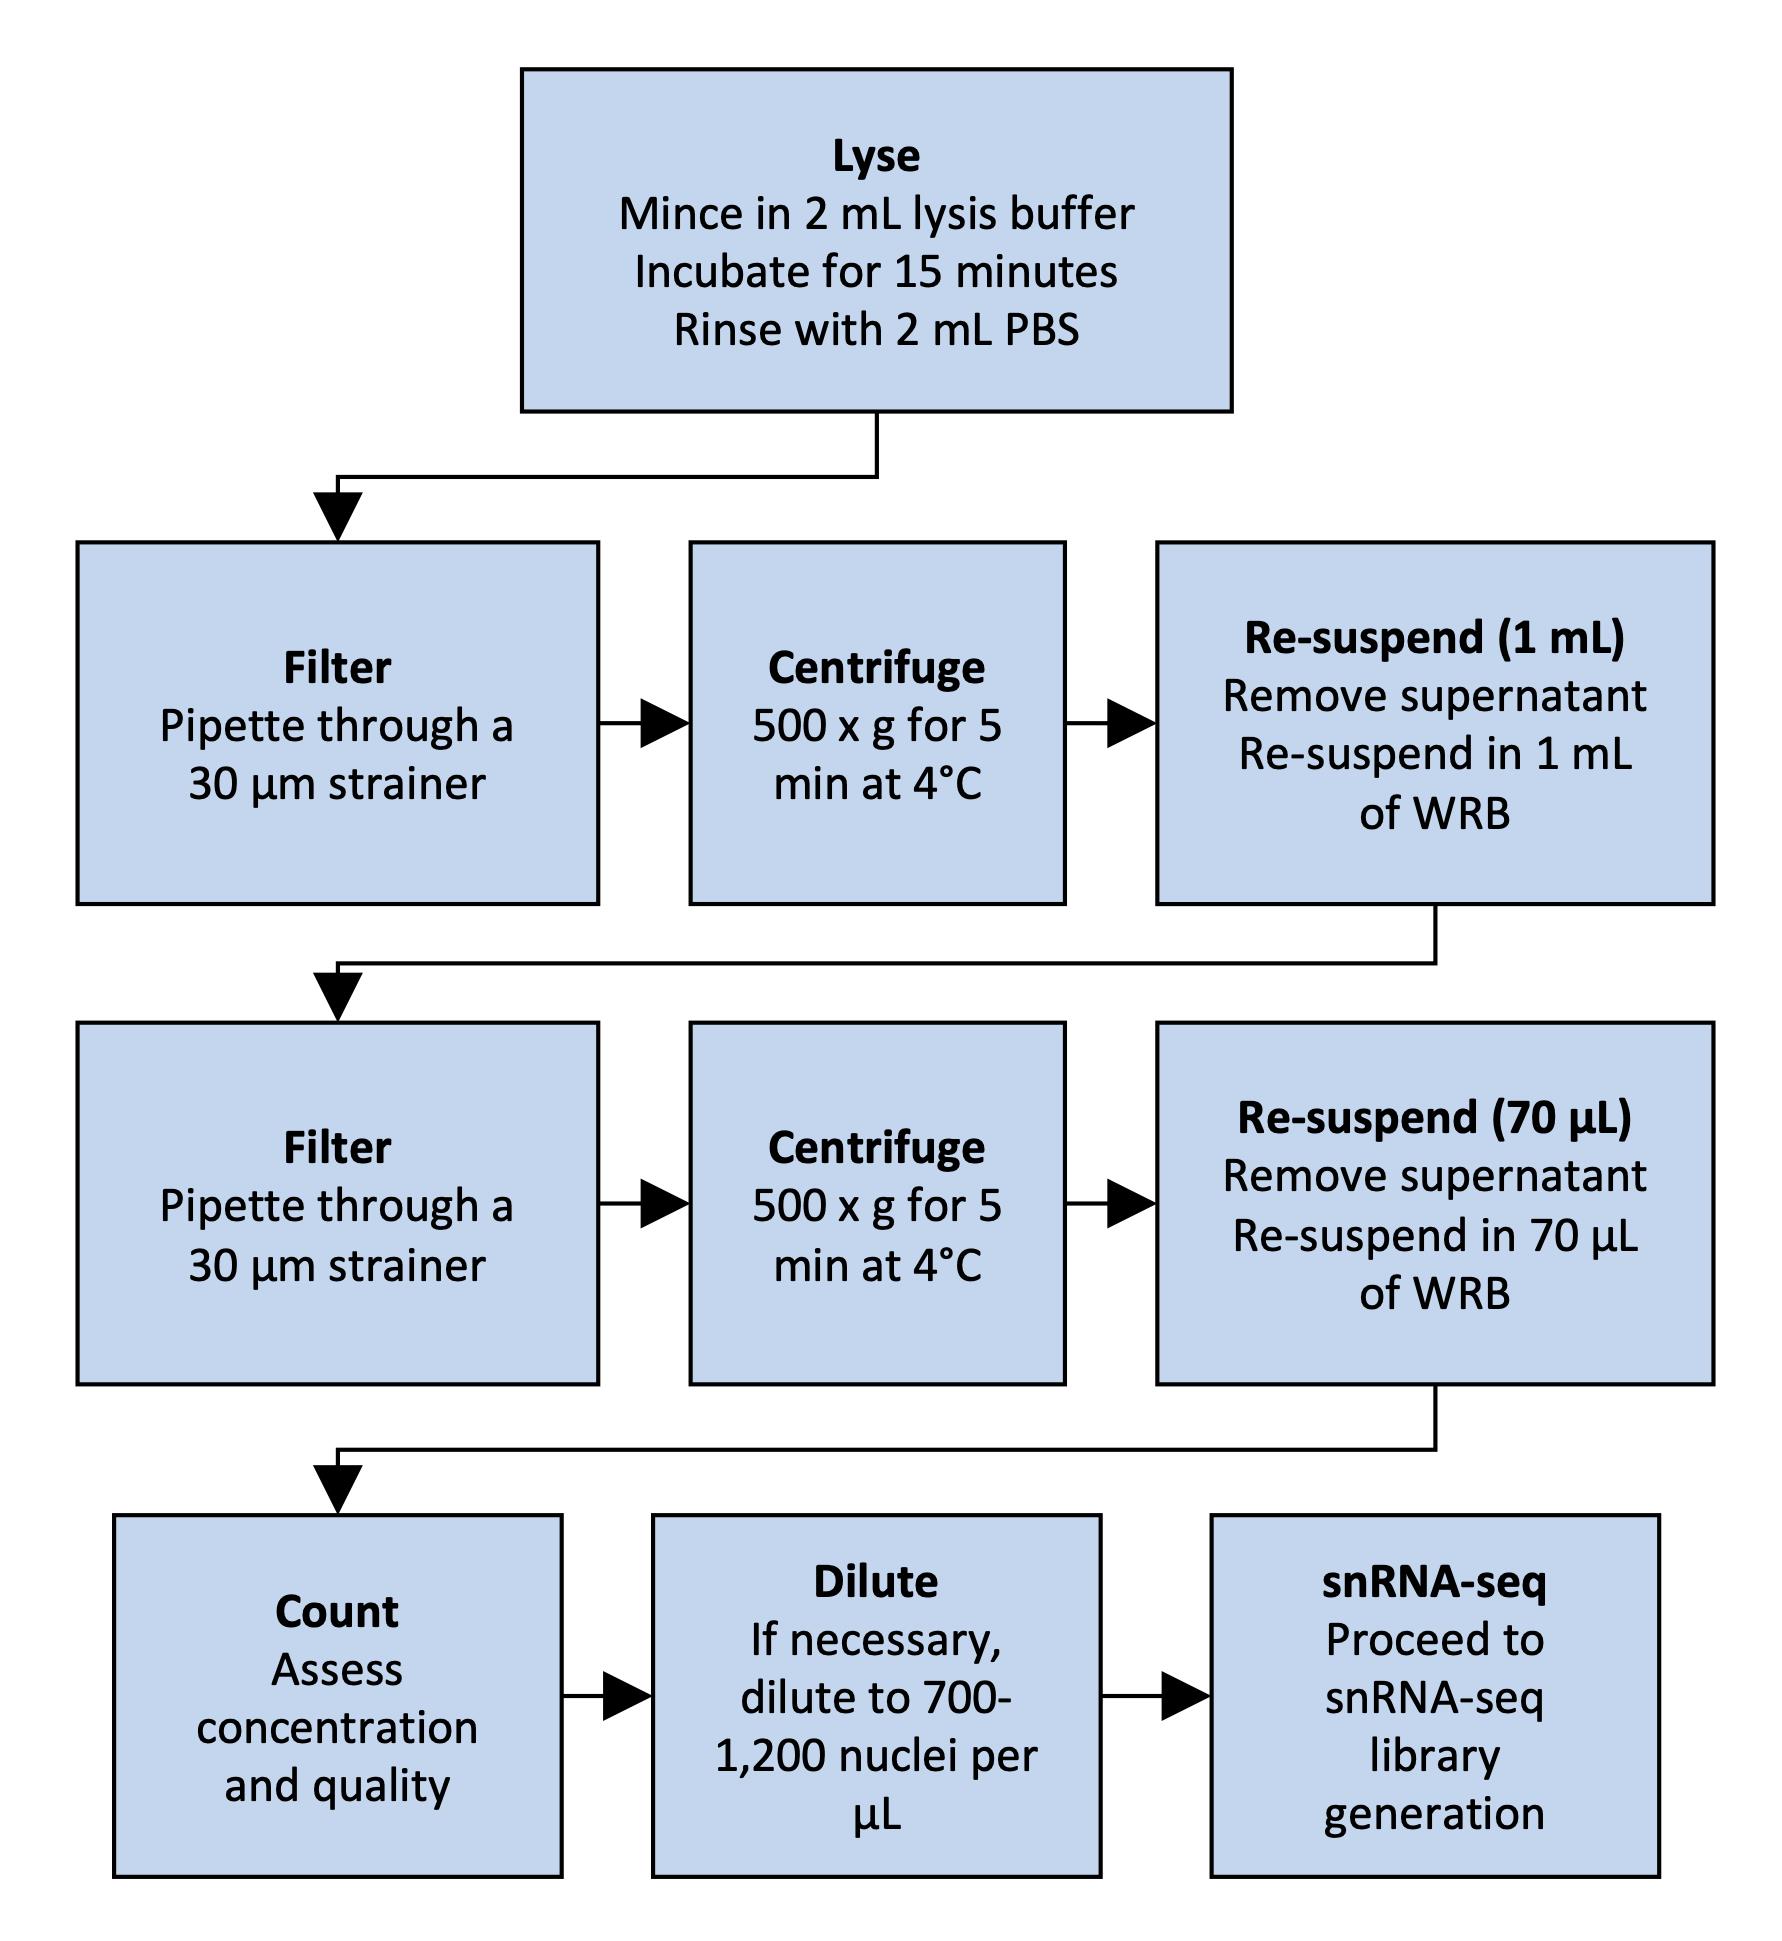
Figure 1. Overview of nucleus isolation from frozen liver. The flowchart outlines the steps from tissue lysis to nuclear suspension.
Materials and Reagents
100 × 15 mm Petri dish (Corning®, Falcon®, catalog number: 351029)
Single-use scalpels No. 10 (Fisher Scientific, FeatherTM, catalog number: 08-927-5A)
MACS® SmartStrainers 30 μm (Miltenyi Biotec, catalog number: 130-110-915)
FlowMiTM 40 μm pipette tip strainers (Bel-Art, catalog number: H13680-0040)
15 mL FalconTM conical centrifuge tubes (Corning®, catalog number: 352096)
50 mL FalconTM conical centrifuge tubes (Corning®, catalog number: 352070)
DNA LoBind® 1.5 mL microcentrifuge tubes (Eppendorf, catalog number: 022431021)
FisherbrandTM tweezers/forceps (Fisher Scientific, catalog number: 12-000-128)
Countess cell counting chamber slides (Thermo Fisher Scientific, catalog number: C10228)
Phosphate-buffered saline (PBS), 1× without calcium and magnesium, pH 7.4 (Corning®, catalog number: 21-040-CM)
Nuclease-free water (not DEPC-treated) (Fisher Scientific, InvitrogenTM, catalog number: AM9932)
IGEPAL® CA-630 (Millipore Sigma, catalog number: 18896-50ML)
Sodium chloride (NaCl) (Millipore Sigma, catalog number: S5886-500G)
Magnesium chloride (MgCl2) (Millipore Sigma, catalog number: M2393-100G)
Bovine serum albumin (BSA) (Millipore Sigma, catalog number: A8806-5G)
Hoechst 33342 10 mg/mL solution (Thermo Fisher Scientific, catalog number: H3570)
Protector RNase inhibitor (Millipore Sigma, catalog number: 3335402001)
Trizma® hydrochloride solution (Tris-HCl) 1 M pH 7.4 (Millipore Sigma, catalog number: T2194)
5 M NaCl stock (see Recipes)
1 M MgCl2 stock (see Recipes)
10% IGEPAL (see Recipes)
0.1% lysis buffer (see Recipes)
Wash and resuspension buffer (WRB) (see Recipes)
Hoechst stain buffer (see Recipes)
Equipment
Refrigerated benchtop centrifuge
Note: Using a swinging bucket rotor for centrifugation helps to improve nuclei yields when compared with a fixed-angle rotor centrifuge.
Countess II FL automated cell counter, or equivalent cell counting method
Agilent Bioanalyzer
Procedure
Prepare materials and reagents
Fill a rectangular ice pan and ice bucket with ice.
Prepare the lysis buffer, wash and resuspension buffer (WRB), Hoechst stain buffer, and PBS. Place these reagents on ice.
Set the benchtop centrifuge to 4°C and allow it to cool before use.
Label the 15 mL Falcon tubes for samples and supernatant waste.
Keep the forceps and scalpels chilled.
Keep the tissue frozen on dry ice until lysis to avoid thawing, as this will lead to RNA degradation.
Note: Ideally, liver biospecimens should be snap frozen and cryopreserved immediately after resection to prevent degradation. Tissue can be stored at -80°C or in liquid nitrogen until use.
Lysis
Perform all lysis steps in a biosafety cabinet.
Add 2 mL of ice-cold lysis buffer per 100 mg of tissue onto a Petri dish over ice in an ice pan.
Using a clean set of forceps, transfer the snap-frozen biopsy into the lysis buffer on the dish. Do not allow the biopsy to thaw before placing it into the lysis buffer (Figure 2A).
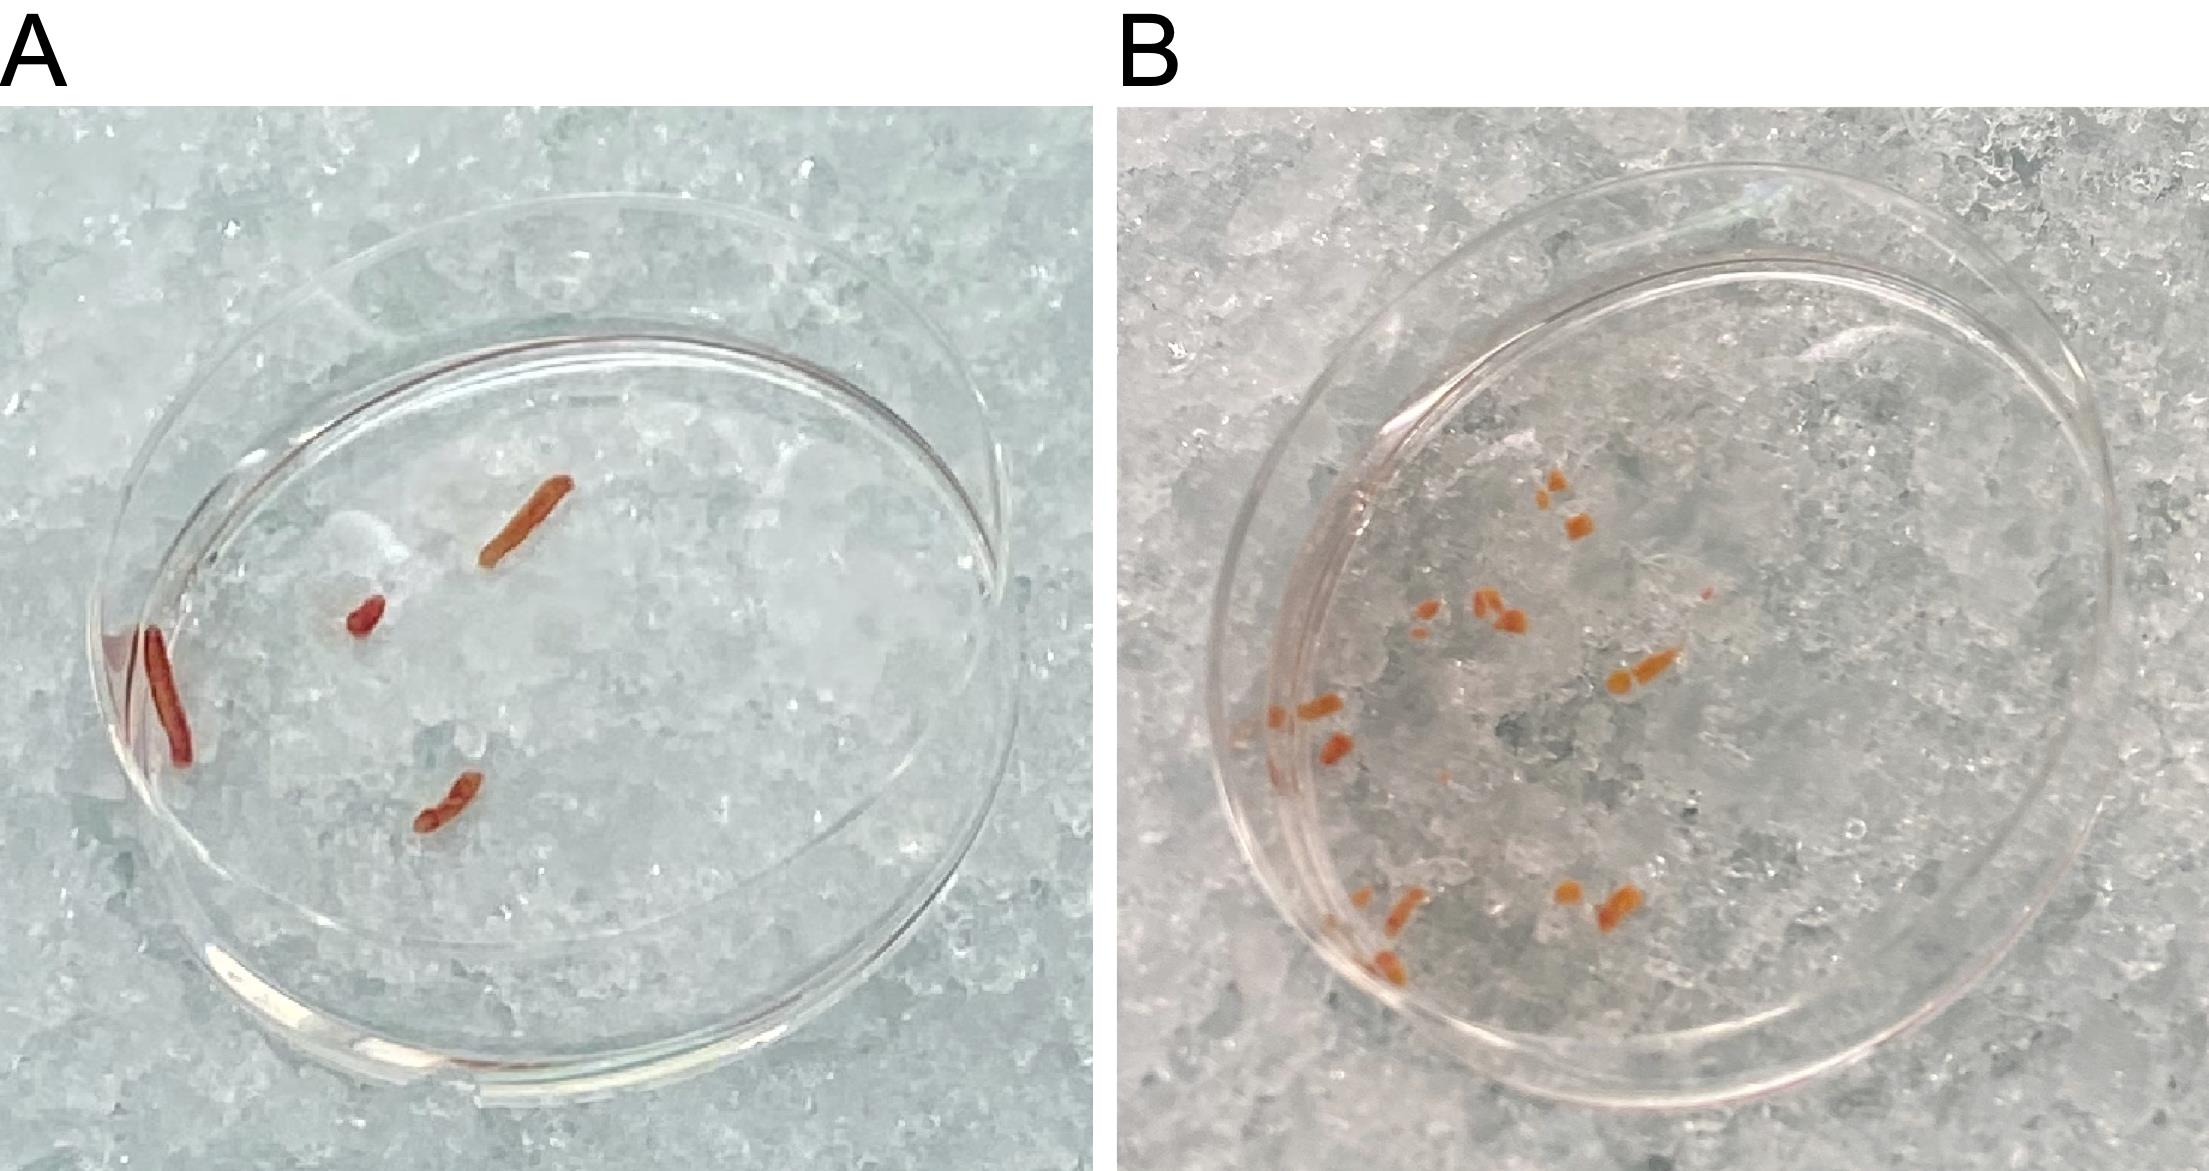
Figure 2. Scalpel homogenization of liver tissue biopsies. (A) Incubation of liver biopsies in lysis buffer. (B) Liver biopsies after a 5 min incubation and manual dissociation with a scalpel.Allow the tissue to thaw in the lysis buffer for 5 min.
Note: If significant clumping of nuclei is observed, the lysis time may be reduced to prevent damage to the nuclear membrane.
Mince the tissue in the lysis buffer using a pair of forceps and a scalpel. The tissue should be minced into 2–4 mm pieces (Figure 2B).
Using a 5 mL serological pipette, add 2 mL of ice-cold PBS to the tissue lysate on the dish. Mix by gently pipetting up and down 10 times.
Aspirate the lysate and filter through a 30 μm smart strainer into a 15 mL conical centrifuge tube.
Wash
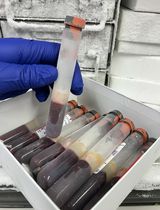
Centrifuge the tissue lysate at 500 × g for 5 min at 4°C. Remove the supernatant without disturbing the pellet.
Note: The pellet may not be visible during this and subsequent wash steps (Figure 3). Care must be taken not to disturb and aspirate the pellet. A 5 mL serological pipette can be used to remove most of the supernatant, followed by a 1,000 μL pipette to carefully remove the remaining lysate.
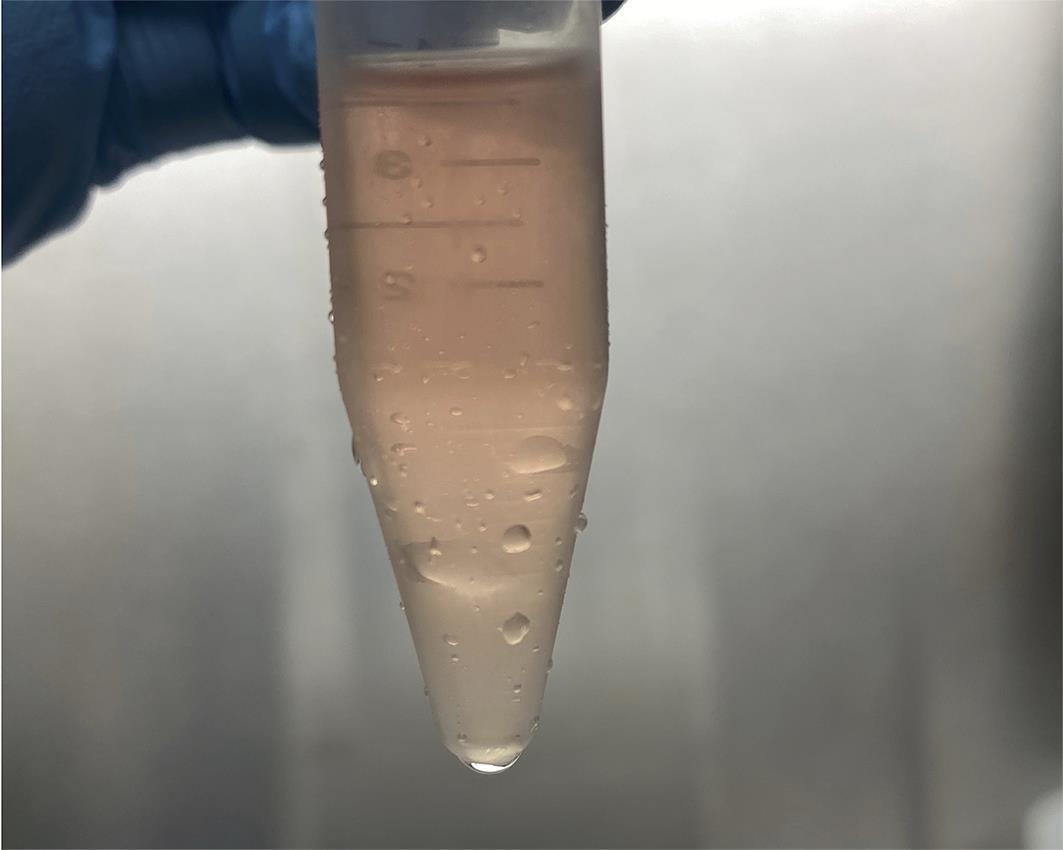
Figure 3. A small pellet of nuclei is present after lysis. The image shows a small pellet of nuclei after lysis, filtering, and centrifugation. The pellet may not be visible after centrifugation.Add 1 mL of ice-cold WRB and re-suspend the pellet by gently pipetting up and down 10–20 times.
Filter the suspension through a 30 μm smart strainer into a new 15 mL conical centrifuge tube.
Note: Tilt the strainer at a slight angle and pipette at the corner to allow for airflow and to reduce volume loss. If the suspension does not pass through, gently tap the strainer.
Centrifuge at 500 × g for 5 min at 4°C. Using a 1,000 μL pipette, carefully remove the supernatant without disturbing the pellet.
Add 70 μL of ice-cold WRB. Re-suspend the pellet by gently pipetting up and down 10–20 times. Transfer the nucleus suspension to a 1.5 mL LoBind microcentrifuge tube.
Note: Compared to the 10× nuclei isolation protocol, our protocol includes only one wash step to accommodate samples with low yields of nuclei and to decrease run time. Additional wash steps can be included if the sample is contaminated and has a high enough yield (see below).
Nucleus counting
Mix 10 μL of the nucleus suspension with 10 μL of Hoechst stain buffer in a PCR tube.
Transfer 10 μL of the stained nucleus suspension to a Countess cell counting chamber slide.
Assess the concentration and quality of the suspension (Figure 4) using a Countess II FL automated cell counter.
Note: Cell counting and quality assessment of nuclei can be done with an automated cell counter or manually. We recommend using a fluorescent DNA stain, such as Hoechst 33342 or DAPI, to discern nuclei from tissue debris. Alternatively, trypan blue staining and visualization under brightfield can be used. However, this makes reliable estimation of nucleus concentration challenging, especially if the nuclei are not intact.
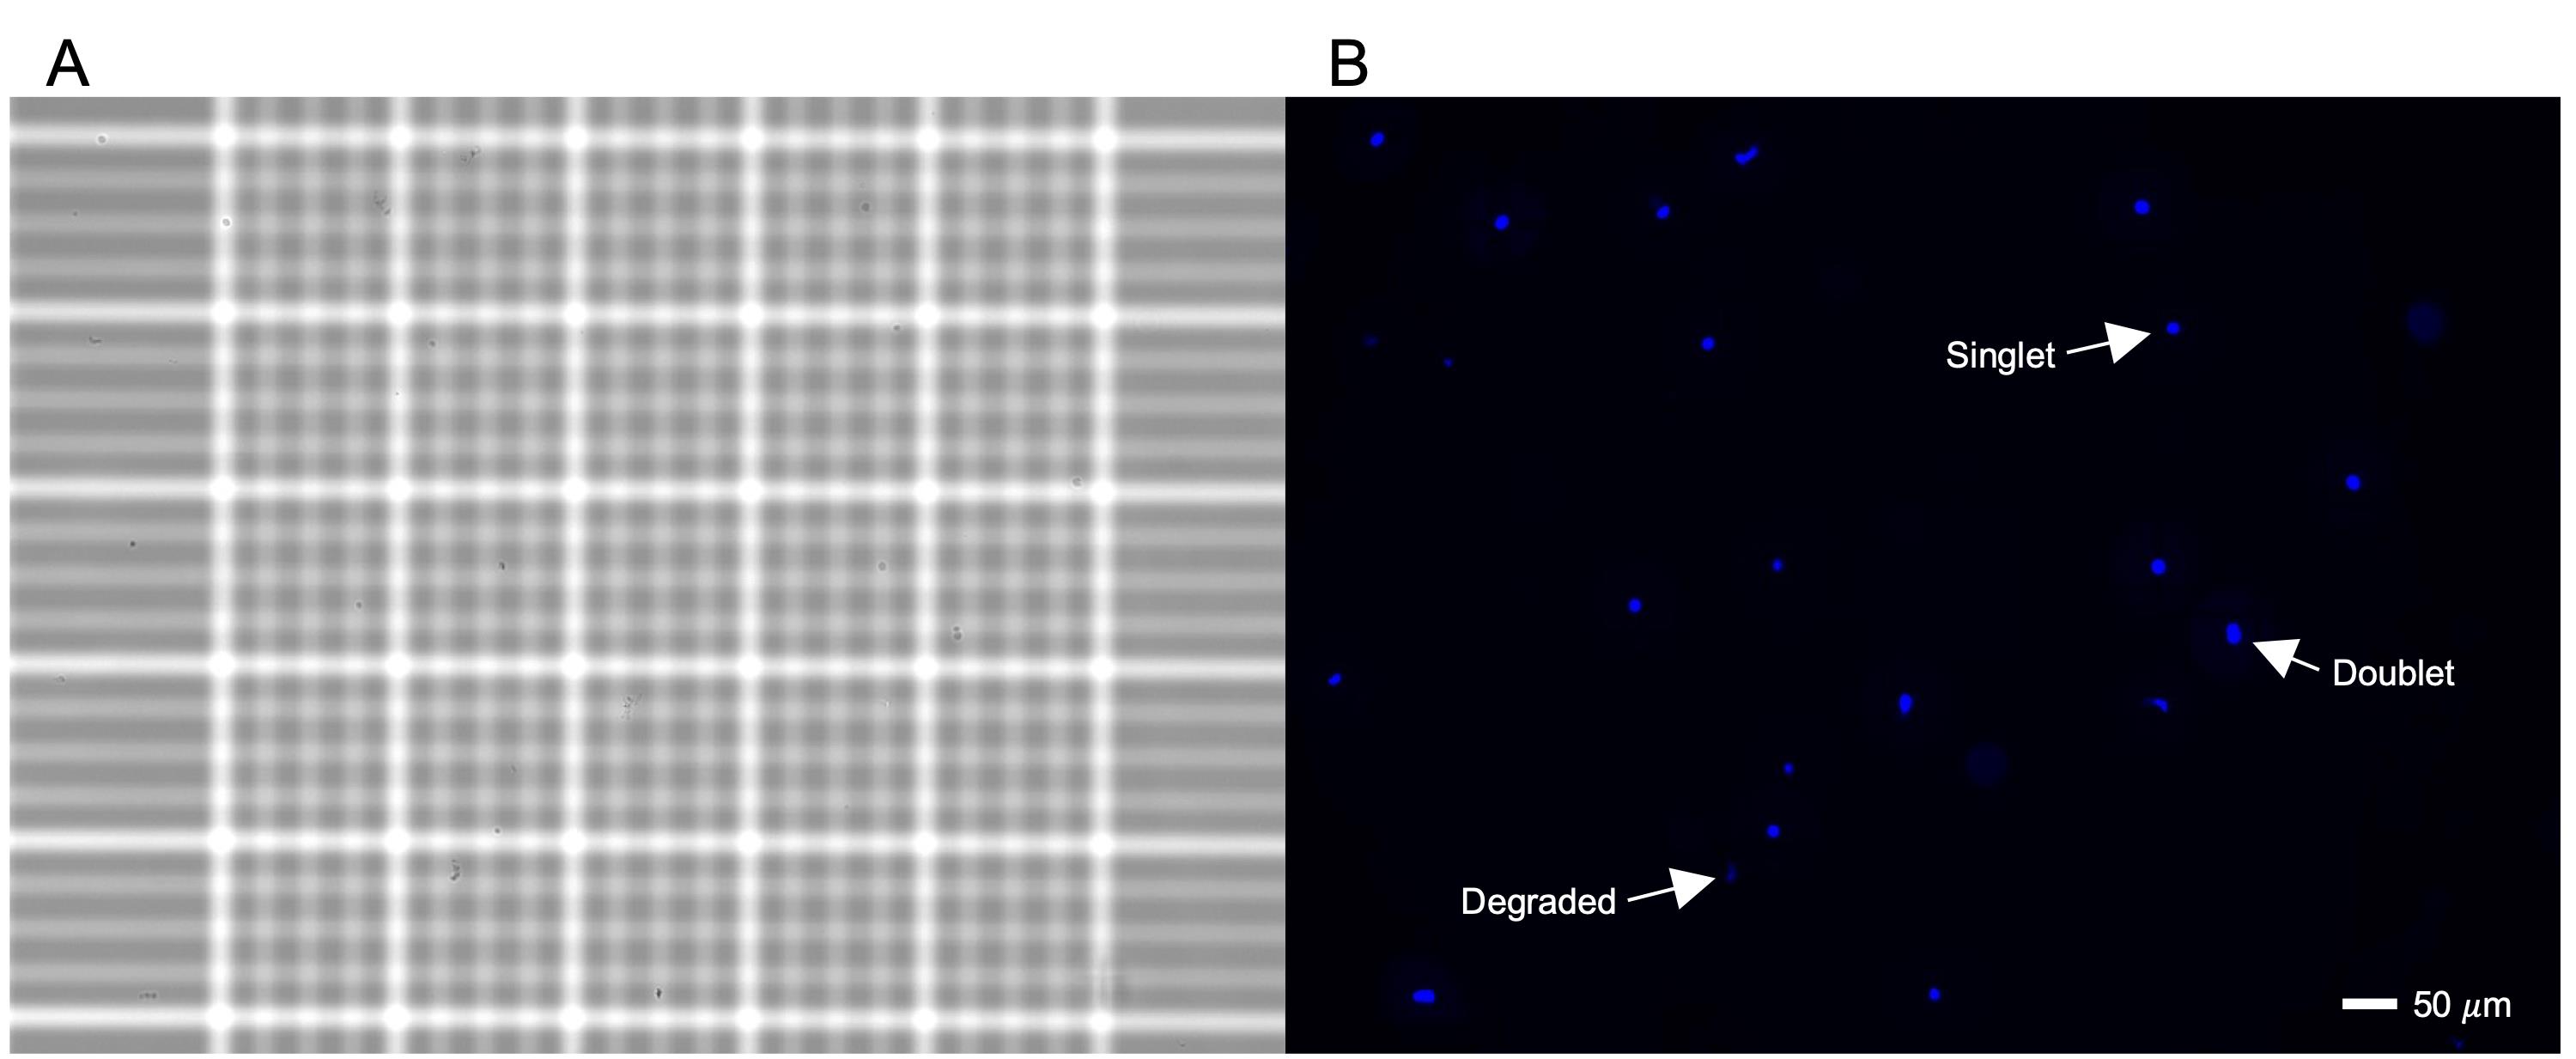
Figure 4. Hoechst staining and imaging of isolated nuclei. Microscope images of nuclei in the middle square of a hemocytometer under (A) brightfield and (B) fluorescent Hoechst staining are shown to provide a higher resolution and scale compared to a Countess. In (B), examples of singlet, doublet, and degraded nuclei are labeled.If the concentration of nuclei is too high, dilute with WRB to achieve a target concentration of 1,000 nuclei per microliter. For loading nuclei into the 10× Chromium Controller, the concentration range limit is 100–2,000 nuclei per microliter, and the recommended target concentration is 700–1,200 nuclei per microliter. Dilute with WRB to reduce the concentration if necessary.
If the nucleus suspension contains high amounts of debris or doublets and aggregates, perform an additional wash step by repeating steps C2–C5.
Note: Higher levels of debris and nuclei aggregates, especially those larger than 50 µm in diameter, lead to a higher chance of clogging the microfluidic channel, resulting in a wetting failure. However, note that wash steps can result in a significant loss in yield of approximately 50%. Using a 40 µm pipette tip strainer in place of a 30 µm smart strainer can help prevent volume loss, although clogging may occur. The centrifugation speed and spin time can also be reduced, for example to 400 × g at 4 min, to help prevent the formation of nuclei aggregates.
Single-nucleus RNA-seq
Prepare the suspension to load a predetermined number of nuclei. Suspensions can be diluted in nuclease-free water to achieve the target number of nuclei to load. For 10× solutions, consult the appropriate 10× user guide for nuclei recovery numbers given suspension concentrations.
Note: Loading higher numbers of nuclei will result in a higher doublet rate. Doublet rates approximately follow a Poisson process (McGinnis et al., 2019) and the rate can be predicted from the number of nuclei loaded.
For 10× solutions, perform the single-cell protocol detailed in the appropriate 10× user guide. The protocol should be adjusted accordingly if another platform, such as drop-seq (Macosko et al., 2015), is used. Briefly, these steps include 1) droplet/bead formation, 2) reverse transcription, 3) cDNA amplification, and 4) library construction. The details of each depend on the specific method and technology.
Note: Begin the single-cell protocol as soon as possible. Droplet emulsification and reverse transcription should begin no more than a few hours after isolation.
The number of PCR cycles to amplify cDNA is experiment- and sample-specific, but we recommend higher numbers to accommodate the lower RNA yields from nuclei compared to cells. Consult the single-cell protocol for appropriate ranges. For 10×, either 12 or 13 cycles are recommended.
Assess the quality of the cDNA and sequencing libraries using an Agilent Bioanalyzer.
Note: Ideally, there should be a smooth peak centered between 1,000 and 1,500 base pairs. However, RNA from human liver tissue is susceptible to degradation, thus cDNA traces can show significant peaks below 1,000 base pairs (Figure 5).
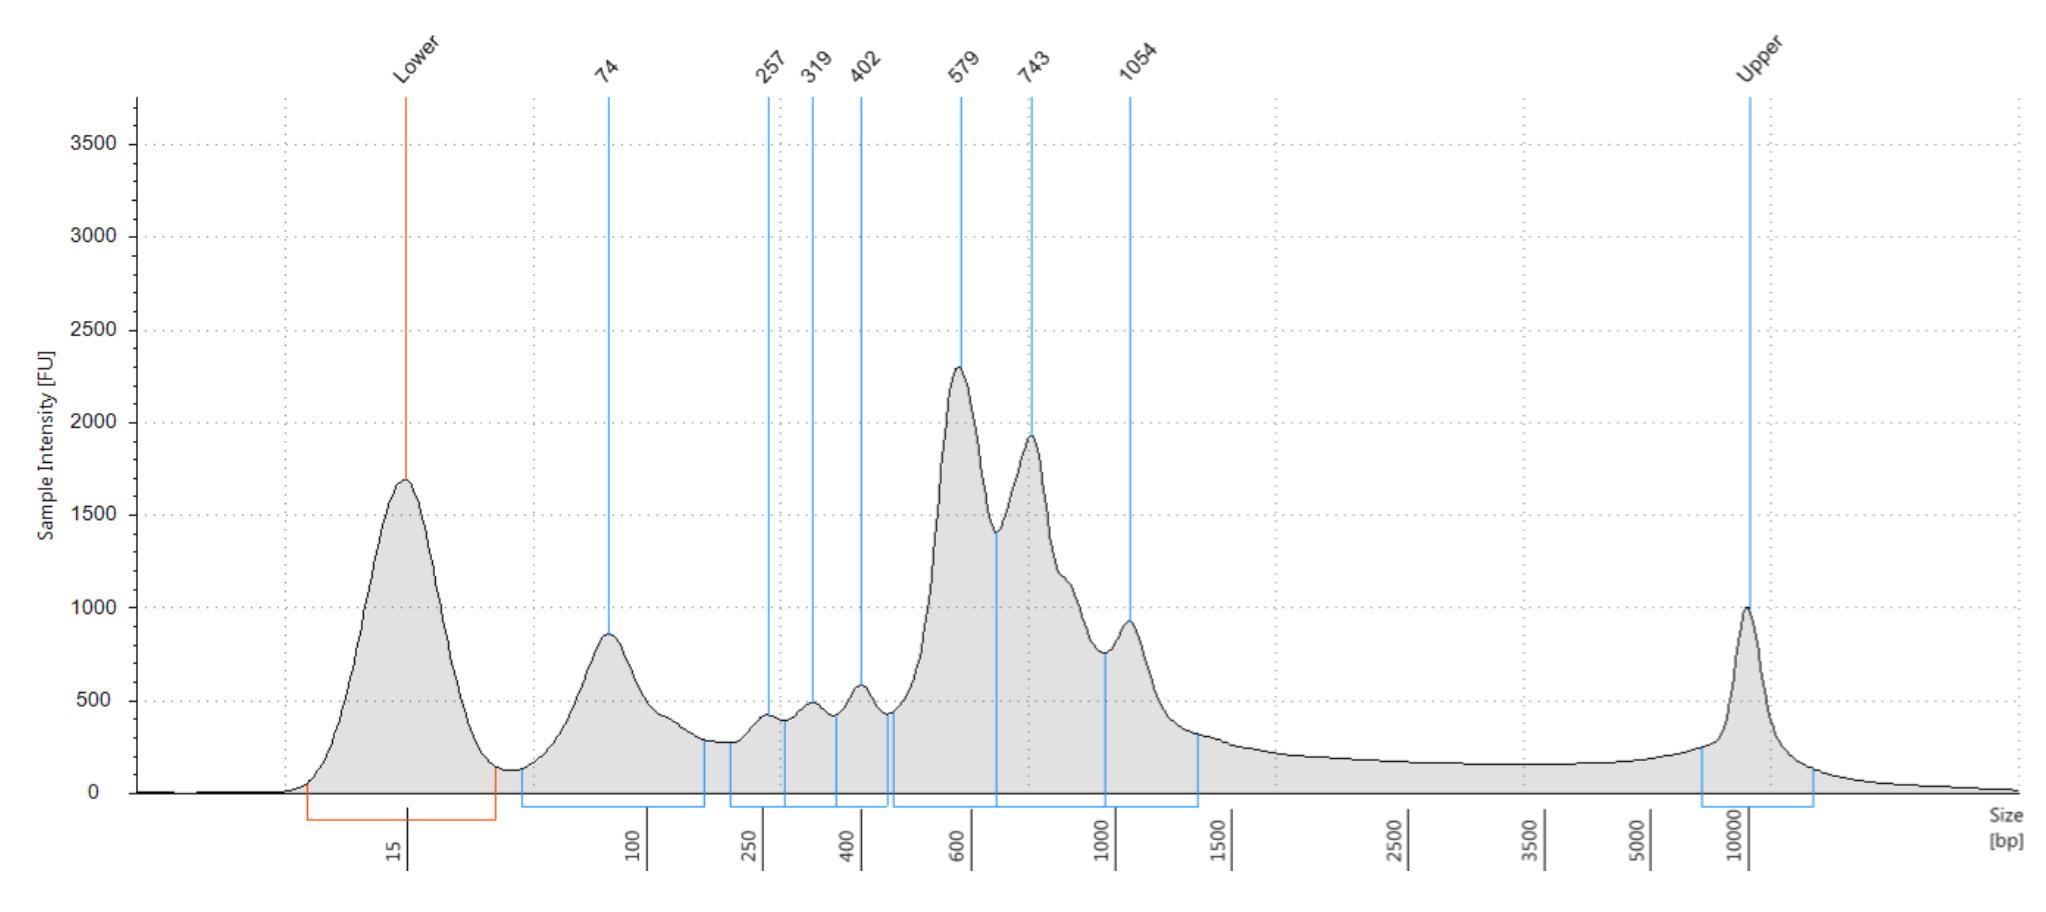
Figure 5. Representative bioanalyzer trace of snRNA-seq library from frozen liver tissue. Figure shows a representative cDNA trace from an Agilent Bioanalyzer tape station. This frozen liver tissue sample shows RNA degradation with most cDNA fragments below a length of 1,000 base pairs.Sequencing
Sequence the libraries using the appropriate platform. For Illumina sequencing, select the number of lanes to achieve a read depth of 20,000–50,000 reads per nucleus.
Note: The target read depth per nucleus will depend on the desired coverage and the amount of RNA in a sample. Generally, higher sequencing depths will have a higher sensitivity for more lowly expressed genes. Samples with high amounts of RNA will require higher sequencing depths to profile lowly expressed genes. In contrast, samples with low amounts of RNA will reach saturation at lower sequencing depths.
Data analysis
For alignment and gene quantification, we recommend using STARsolo (Dobin et al., 2013; Kaminow et al., 2021). If there is significant RNA degradation, then adapters, polyA tails, and template switch oligos can be trimmed. Raw snRNA-seq data from frozen tissues typically require quality control filtering and processing. A barcode-rank plot can help assess the quality and extent of nucleus and RNA degradation. If an elbow point and count threshold are not easily discerned, droplets can be filtered based on their gene count distributions using DIEM (Alvarez et al., 2020) or EmptyDrops (Lun et al., 2019). Our publications on snRNA-seq of liver (Alvarez et al., 2022; Rao et al., 2021) provide details on filtering droplets using DIEM (Alvarez et al., 2020). After droplet filtering, nuclei can be clustered using Seurat (Stuart et al., 2019) or another approach (Yu et al., 2022).
Adapting to different tissue samples
The steps in this protocol were optimized for snap-frozen liver tissue samples. However, our protocol can be optimized for other sample types as well. Two key areas for optimization are homogenization and washing. Mincing with a scalpel helps to preserve the integrity of the nuclei and reduce ambient RNA contamination. However, other homogenization methods, such as a dounce grinder, can be tested to help increase yields. The second area of optimization includes the number and volume of wash steps. We include only one wash step with 1 mL of buffer to minimize a loss in concentration. If a higher number of nuclei is present (>1,000 nuclei per microliter) from a sample type, an additional wash step can be included to reduce tissue debris. Further optimizations to this approach will involve balancing yield and quality, where greater homogenization and less washing improves yields and decreases the quality.
Cryopreservation and snap freezing of liver tissue
Proper cryopreservation and snap freezing of liver tissue is critical to ensure high quality RNA and intact nuclei. For snRNA-seq, it is critical to avoid RNA degradation. Therefore, ischemic time must be minimized, and tissue should be snap frozen as soon as possible. It is also necessary to reduce ice crystal formation, as this can potentially damage nuclei and reduce the yield. Suspensions of intact, single nuclei will generate the highest quality snRNA-seq data. Therefore, snap-freezing methods that rapidly and evenly freeze the tissue to preserve morphology are preferred. Once frozen, tissues can be stored in -80 °C, or, for long-term storage, in the vapor phase of liquid nitrogen. The tissue should then be thawed in lysis buffer only once the protocol begins.
Recipes
5 M NaCl stock
Add 2.922 g of NaCl to 10 mL of water.
1 M MgCl2 stock
Add 2.0331 g of MgCl2·6H2O to 10 mL of water.
10% IGEPAL
Add 100 μL of IGEPAL to 900 μL of PBS.
0.1% lysis buffer
To 9.77 mL of nuclease-free water, add
100 μL of 1 M Tris-HCl
20 μL of 5 M NaCl stock
10 μL of 1 M MgCl2 stock per 10 mL
100 μL of 10% IGEPAL
75 μL of 40 U/μL RNase inhibitor.
Note: RNase inhibitor in the lysis buffer helps to prevent RNA degradation during the lysis step.
Wash and resuspension buffer (WRB)
Add 200 mg of BSA to a 15 mL conical centrifuge tube.
Add up to 10 mL of 1× PBS.
Add 50 μL of 40 U/μL RNase inhibitor.
Hoechst stain buffer
Add 10 μL of 10 mg/mL Hoechst stain to 990 μL to create stock A.
Add 2 μL of stock A to 98 μL of PBS to get a working solution.
Acknowledgements
We thank the individuals who participated in the liver HCC cohort (Alvarez et al., 2022). The work was supported by NIH grants R01HG010505 and R01DK132775. M.A. was supported by an HHMI Gilliam Fellowship.
References
- Aizarani, N., Saviano, A., Sagar, Mailly, L., Durand, S., Herman, J. S., Pessaux, P., Baumert, T. F. and Grun, D. (2019). A human liver cell atlas reveals heterogeneity and epithelial progenitors. Nature 572(7768): 199-204.
- Alvarez, M., Rahmani, E., Jew, B., Garske, K. M., Miao, Z., Benhammou, J. N., Ye, C. J., Pisegna, J. R., Pietiläinen, K. H., Halperin, E., et al. (2020). Enhancing droplet-based single-nucleus RNA-seq resolution using the semi-supervised machine learning classifier DIEM. Sci Rep 10(1): 11019.
- Alvarez, M., Benhammou, J. N., Darci-Maher, N., French, S. W., Han, S. B., Sinsheimer, J. S., Agopian, V. G., Pisegna, J. R. and Pajukanta, P. (2022). Human liver single nucleus and single cell RNA sequencing identify a hepatocellular carcinoma-associated cell-type affecting survival. Genome Med 14(1): 50.
- Andrews, T. S., Atif, J., Liu, J. C., Perciani, C. T., Ma, X. Z., Thoeni, C., Slyper, M., Eraslan, G., Segerstolpe, A., Manuel, J., et al. (2022). Single-Cell, Single-Nucleus, and Spatial RNA Sequencing of the Human Liver Identifies Cholangiocyte and Mesenchymal Heterogeneity. Hepatol Commun 6(4): 821-840.
- Ben-Moshe, S. and Itzkovitz, S. (2019). Spatial heterogeneity in the mammalian liver. Nat Rev Gastroenterol Hepatol 16(7): 395-410.
- Dobin, A., Davis, C. A., Schlesinger, F., Drenkow, J., Zaleski, C., Jha, S., Batut, P., Chaisson, M. and Gingeras, T. R. (2013). STAR: ultrafast universal RNA-seq aligner. Bioinformatics 29(1): 15-21.
- Drissen, R., Buza-Vidas, N., Woll, P., Thongjuea, S., Gambardella, A., Giustacchini, A., Mancini, E., Zriwil, A., Lutteropp, M., Grover, A., et al. (2016). Distinct myeloid progenitor-differentiation pathways identified through single-cell RNA sequencing. Nat Immunol 17(6): 666-676.
- Habib, N., Avraham-Davidi, I., Basu, A., Burks, T., Shekhar, K., Hofree, M., Choudhury, S. R., Aguet, F., Gelfand, E., Ardlie, K., et al. (2017). Massively parallel single-nucleus RNA-seq with DroNc-seq. Nat Methods 14(10): 955-958.
- Halpern, K. B., Shenhav, R., Matcovitch-Natan, O., Toth, B., Lemze, D., Golan, M., Massasa, E. E., Baydatch, S., Landen, S., Moor, A. E., et al. (2017). Single-cell spatial reconstruction reveals global division of labour in the mammalian liver. Nature 542(7641): 352-356.
- Kaminow, B., Yunusov, D. and Dobin, A. (2021). STARsolo: accurate, fast and versatile mapping/quantification of single-cell and single-nucleus RNA-seq data. bioRxiv: 2021.2005.2005.442755.
- Kuppe, C., Ibrahim, M. M., Kranz, J., Zhang, X., Ziegler, S., Perales-Paton, J., Jansen, J., Reimer, K. C., Smith, J. R., Dobie, R., et al. (2021). Decoding myofibroblast origins in human kidney fibrosis. Nature 589(7841): 281-286.
- Larson, A. and Chin, M. T. (2021). A method for cryopreservation and single nucleus RNA-sequencing of normal adult human interventricular septum heart tissue reveals cellular diversity and function. BMC Med Genomics 14(1): 161.
- Lun, A. T. L., Riesenfeld, S., Andrews, T., Dao, T. P., Gomes, T., participants in the 1st Human Cell Atlas, J. and Marioni, J. C. (2019). EmptyDrops: distinguishing cells from empty droplets in droplet-based single-cell RNA sequencing data. Genome Biol 20(1): 63.
- Macosko, E. Z., Basu, A., Satija, R., Nemesh, J., Shekhar, K., Goldman, M., Tirosh, I., Bialas, A. R., Kamitaki, N., Martersteck, E. M., et al. (2015). Highly Parallel Genome-wide Expression Profiling of Individual Cells Using Nanoliter Droplets. Cell 161(5): 1202-1214.
- MacParland, S. A., Liu, J. C., Ma, X. Z., Innes, B. T., Bartczak, A. M., Gage, B. K., Manuel, J., Khuu, N., Echeverri, J., Linares, I., et al. (2018). Single cell RNA sequencing of human liver reveals distinct intrahepatic macrophage populations. Nat Commun 9(1): 4383.
- McGinnis, C. S., Murrow, L. M. and Gartner, Z. J. (2019). DoubletFinder: Doublet Detection in Single-Cell RNA Sequencing Data Using Artificial Nearest Neighbors. Cell Syst 8(4): 329-337 e324.
- Rao, S., Yang, X., Ohshiro, K., Zaidi, S., Wang, Z., Shetty, K., Xiang, X., Hassan, M. I., Mohammad, T., Latham, P. S., et al. (2021). beta2-spectrin (SPTBN1) as a therapeutic target for diet-induced liver disease and preventing cancer development. Sci Transl Med 13(624): eabk2267.
- Stuart, T., Butler, A., Hoffman, P., Hafemeister, C., Papalexi, E., Mauck, W. M., 3rd, Hao, Y., Stoeckius, M., Smibert, P. and Satija, R. (2019). Comprehensive Integration of Single-Cell Data. Cell 177(7): 1888-1902 e1821.
- Trefts, E., Gannon, M. and Wasserman, D. H. (2017). The liver. Curr Biol 27(21): R1147-R1151.
- Villani, A. C., Satija, R., Reynolds, G., Sarkizova, S., Shekhar, K., Fletcher, J., Griesbeck, M., Butler, A., Zheng, S., Lazo, S., et al. (2017). Single-cell RNA-seq reveals new types of human blood dendritic cells, monocytes, and progenitors. Science 356(6335).
- Xu, Y., Mizuno, T., Sridharan, A., Du, Y., Guo, M., Tang, J., Wikenheiser-Brokamp, K. A., Perl, A. T., Funari, V. A., Gokey, J. J., et al. (2016). Single-cell RNA sequencing identifies diverse roles of epithelial cells in idiopathic pulmonary fibrosis. JCI Insight 1(20): e90558.
- Yu, L., Cao, Y., Yang, J. Y. H. and Yang, P. (2022). Benchmarking clustering algorithms on estimating the number of cell types from single-cell RNA-sequencing data. Genome Biol 23(1): 49.
- Zhang, Q., He, Y., Luo, N., Patel, S. J., Han, Y., Gao, R., Modak, M., Carotta, S., Haslinger, C., Kind, D., et al. (2019). Landscape and Dynamics of Single Immune Cells in Hepatocellular Carcinoma. Cell 179(4): 829-845 e820.
Article Information
Copyright
© 2023 The Authors; exclusive licensee Bio-protocol LLC.
How to cite
Readers should cite both the Bio-protocol article and the original research article where this protocol was used:
- Alvarez, M., Benhammou, J. N., Rao, S., Mishra, L., Pisegna, J. R. and Pajukanta, P. (2023). Isolation of Nuclei from Human Snap-frozen Liver Tissue for Single-nucleus RNA Sequencing. Bio-protocol 13(3): e4601. DOI: 10.21769/BioProtoc.4601.
- Rao, S., Yang, X., Ohshiro, K., Zaidi, S., Wang, Z., Shetty, K., Xiang, X., Hassan, M. I., Mohammad, T., Latham, P. S., et al. (2021). beta2-spectrin (SPTBN1) as a therapeutic target for diet-induced liver disease and preventing cancer development. Sci Transl Med 13(624): eabk2267.
Category
Molecular Biology > RNA > RNA sequencing
Cell Biology > Organelle isolation > Nuclei
Do you have any questions about this protocol?
Post your question to gather feedback from the community. We will also invite the authors of this article to respond.