- Protocols

- Articles and Issues
- For Authors
- About
- Become a Reviewer

Staining and Scanning Protocol for Micro-Computed Tomography to Observe the Morphology of Soft Tissues in Ambrosia Beetles
Published: Vol 13, Iss 1, Jan 5, 2023 DOI: 10.21769/BioProtoc.4584 Views: 1348
Reviewed by: Khyati Hitesh ShahSailendra SinghJegan Sekar
Original research article
The authors used this protocol in:

Sep 2020

Protocol Collections
Comprehensive collections of detailed, peer-reviewed protocols focusing on specific topics


Abstract
Advances in imaging technology offer new opportunities in developmental biology. To observe the development of internal structures, microtome cross-sectioning followed by H&E staining on glass slides is a common procedure; however, this technique can be destructive, and artifacts can be introduced during the process. In this protocol, we describe a less invasive procedure with which we can stain insect samples and obtain reconstructed three-dimensional images using micro-computed tomography, or micro-CT (µCT). Specifically, we utilize the fungus-farming ambrosia beetle species Euwallacea validus to observe the morphology of mycangia, a critical internal organ with which beetles transport fungal symbionts. Not only this protocol is ideal to observe mycangia, our staining/scanning procedure can also be applied to observe other delicate tissues and small organs in arthropods.
Graphical abstract

Background
The study of developmental biology often requires visualization across life stages as it concerns the process through which certain organs or tissues form. Microscopy has been the core means to observe the morphology of organs under development. To observe external features, stereo microscopy is adequate to visualize structures across developmental stages; however, internal structures are often difficult to observe and measure without destructive sampling. Employing micro-computed tomography (µCT) visualization protocols allows for the observation of structures throughout their development, in hard- and soft-bodied life stages alike (Spahr et al., 2020). The success of staining and scanning protocols can allow for detailed internal visualization and quantification of structures after genetic functional analyses, where the use of a non-destructive visualization technique is integral. Here, we describe stepwise methods for µCT scanning in the fungus-farming ambrosia Euwallacea validus .
Ambrosia beetle symbiosis is an emerging, global topic in forest pathology and entomology due to many species being invasive pests that vector phytopathogenic fungi across native and introduced ranges. Notably, Raffaelea lauricola , the causal agent of laurel wilt disease, is vectored by the redbay ambrosia beetle Xyleborus glabratus (Fraedrich et al., 2008). Other phytopathogenic fungi, such as Fusarium species carried by Euwallacea ambrosia beetles, cause significant agricultural and economic damages to avocado, citrus, and tea (Freeman et al., 2013; O'Donnell et al., 2015). Understanding the developmental process of tissues in beetles or fungi may lead to the development of effective means to control these pests.
The beetles rely on novel pits or pouches called mycangia, in which they house and transmit fungal propagules between tree hosts. The location of these structures varies between beetle species. External mycangia, such as the pronotal pouches of the bark beetle Dendroctonus frontalis and related species, are commonly observed by electron scanning microscopy; ease of study has allowed for detailed structural descriptions (Yuceer et al., 2011). However, the internal mycangia, such as the preoral mycangia found in Euwallacea , are more difficult to observe and describe. Published studies of internal mycangia have employed microtome cross-sectioning, laser ablation tomography (LAT) scanning, and micro-computed tomography (Li et al., 2015, 2018). The destructive nature of microtome cross-sectioning can require many samples to produce a viable result, especially when using small arthropod samples. By employing scanning techniques, the artifacts caused by slicing and staining of cross-sections can be reduced, which allows us to achieve detailed results. This technique can assist other studies in observing and describing soft tissues in arthropods and can be combined with other techniques (such as RNA interference, allometry, etc.) to strengthen resources for small, internal, or otherwise difficult to measure structures.
Materials and Reagents
Eppendorf 1.5 mL microcentrifuge tubes (Sigma-Aldrich, catalog number: T6649)
200 μL pipette tips (Sigma-Aldrich, Corning, catalog number: CS4860)
Paint brush (any fine brush)
Scissors
100% ethanol (200 proof) (Sigma-Aldrich, catalog number: E7023)
Deionized/sterile water (Sigma-Aldrich, catalog number: 8483331000)
5% Lugol’s solution (Fisher Scientific, Spectrum Chemical, catalog number: 18-611-063)
Dental wax ortho tray strips (Kerr, Benco, catalog number: 1021-752)
Insect samples
70% ethanol (see Recipes)
Equipment
Bruker Skyscan 1272 micro-computed tomography scanner
Computer that can run the software (see Note 1 below)
Software
Skyscan Micro-CT scanning software (version 1.1.10, Bruker; https://www.bruker.com/en/products-and-solutions/microscopes/3d-x-ray-microscopes/skyscan-1272.html)
NRecon Reconstruction (Bruker, 3D.SUITE software includes Dataviewer, CTAn, CTVol, CTVox) (Bruker, https://www.bruker.com/en/products-and-solutions/preclinical-imaging/micro-ct/3d-suite-software.html)
Procedure
Sample preparation and staining
Retrieve fixed insects from 70% ethanol.
Rinse samples once or twice in 70% ethanol and then rehydrate insects in a graded series of ethanol (70% ethanol, to 50% ethanol, to 25% ethanol, to 100% deionized water).
Remove the liquid, place insect samples in a fresh Eppendorf microcentrifuge tube, and cover with 5% Lugol’s solution (approximately 300 μL; the volume is subjective, but sample should be submerged).
Place in a dark cabinet overnight, from 12 to 24 h.
Rinse or flush sample with water before replacing the solution with 70% ethanol.
Store in freezer at -20 °C until scanning.
Micro-computed tomography: preparing your sample for scanning
Trim a pipette tip to approximately 12.5 mm in height to accommodate the available space in the scanning chamber.
Seal the bottom of the trimmed pipette tip with dental wax, ensuring a liquid-tight seal is created.
Apply a small ball of wax to the pedestal and place the wax-sealed bottom of the trimmed pipette to the wax ball. Apply light pressure to adhere the wax from both surfaces together; additional dental wax can be added to ensure the pipette will stand upright on the pedestal.
Orient the pipette tip so that it is straight and centered upright. Set the pedestal on the counter and slowly rotate to visually examine for movement of the pipette tip. Adjust the orientation of the pipette tip in the wax until rotational movement is reduced and it appears centered.
Pipette 70% ethanol into the trimmed pipette (approximately 50–80 μL; can start at a lower volume and add more ethanol after placing sample).
Retrieve your stained insect sample from its storage tube with a paint brush and deposit it in the ethanol of the trimmed pipette. Add more ethanol if the sample is not submerged.
Gently tap the base of the pedestal on the counter (pipette staying upright) to dislodge any air bubbles within the pipette and to settle the sample in the bottom of the tube.
Lightly seal the top of the trimmed tube with wax; roll a small ball of wax into a flat circle, apply to the open top of the pipette, and gently press the edges around the outside wall of the pipette tip.
Check the orientation pipette tip one last time to ensure it is centered on the pedestal.
Open the Bruker Skyscan Micro-CT scanning software. If the lights on the micro-CT are flashing and an X-ray source dialog box opens, the X-ray source may need time to warm up if the machine has not been used recently.
Ensure the X-ray source is off and open the scanner door using the Bruker scanning software top menu bar.
Place the pedestal in the scanner platform and tighten the ring.
Close the scanning door using the Bruker software.
Micro-computed tomography: scanning
In the Skyscan Micro-CT software, turn on the Grab setting (TV icon) and visual camera (lightbulb icon) along the top bar to view the sample inside the micro-CT machine during scanning setup (Figure 1).
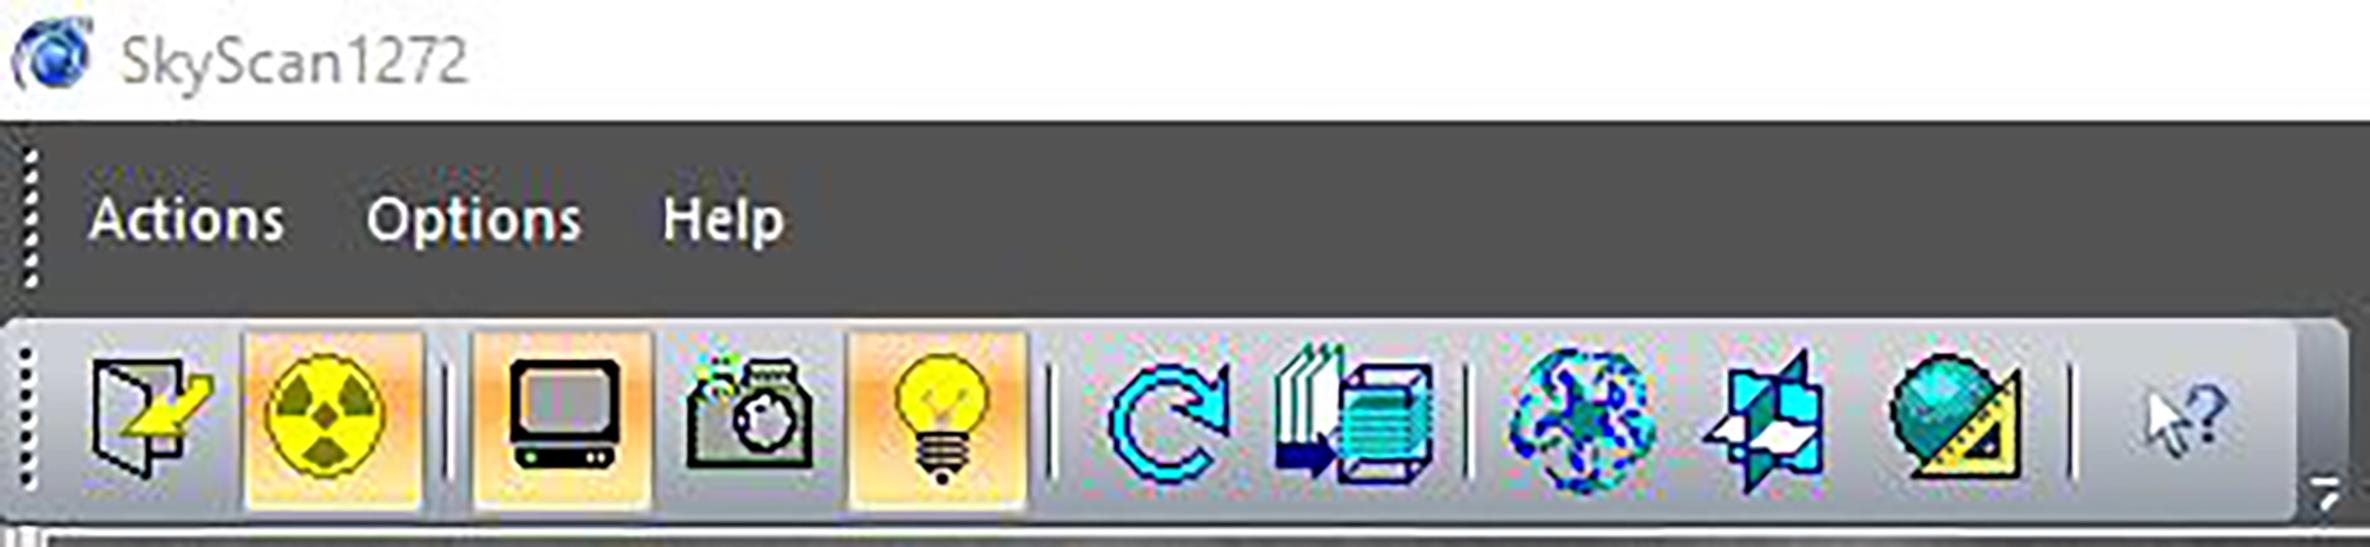
Figure 1. Screenshot of menu bar. Active features are labeled in orange.Adjust voltage and amperage to 50 kV and 200 μA, respectively.
Change the binning to 2,016 × 1,344 by clicking this setting on the bottom toolbar (found on the bottom right, dimensions next to an icon of a blue box with blue arrows, Figure 2).
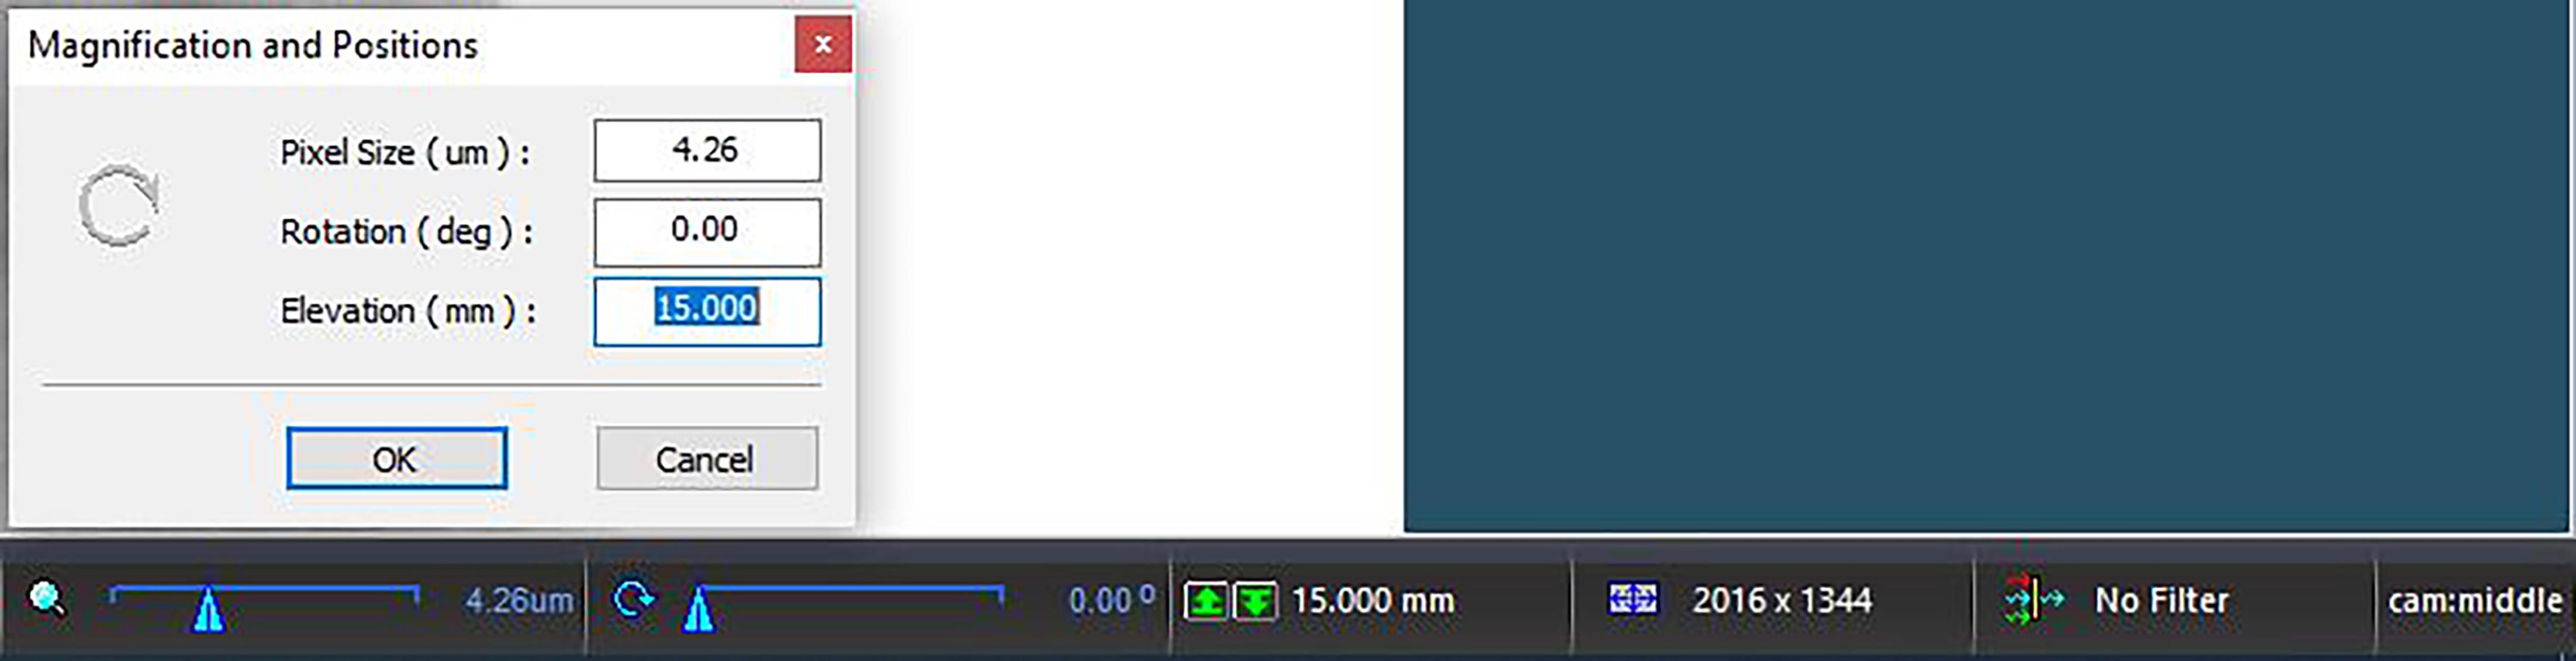
Figure 2. Screenshot of bottom toolbarTo the right of binning setting on the bottom toolbar is the filter setting. Set the filter setting to “no filter.”
Using the left mouse button and the Control key, click and drag the main image to center the sample. A line will appear to indicate the direction and degree of movement. Releasing will move the sample within the Skyscan unit.
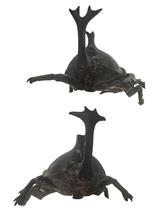
Rotate the sample 360° to ensure it is upright and within the bounds of the scanning area at all degrees of rotation. If the sample is tilted or rotates outside of the camera view, shut off the source and open the chamber to reorient the sample on the pedestal. Re-center the sample if any changes are made to the pipette orientation (Figure 3).
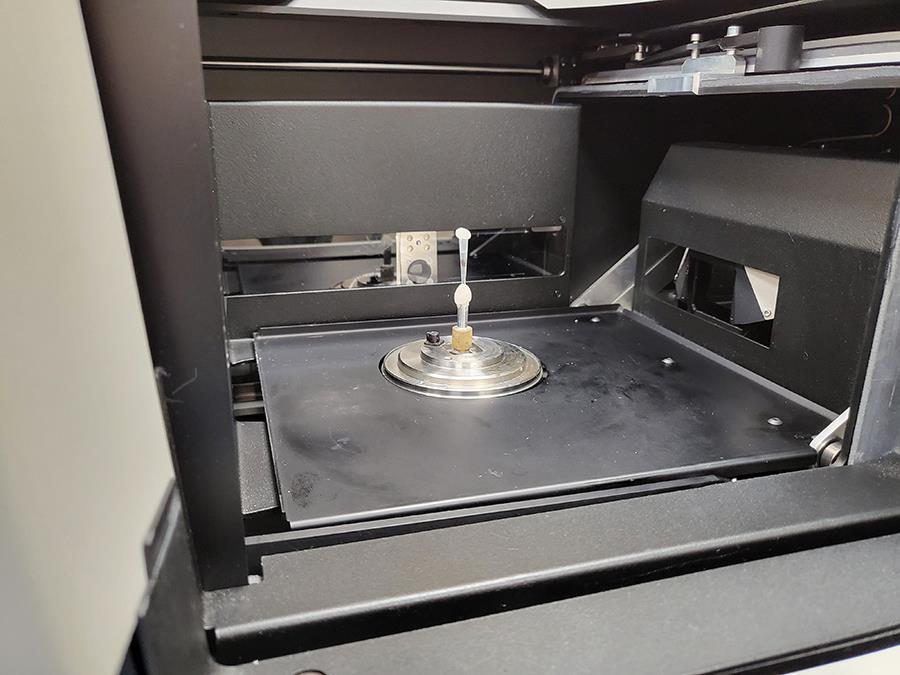
Figure 3. Inside of the scanner with a sampleClick the Elevation setting on the bottom toolbar (displays a “mm” setting found on the right side, next to two green arrows) to open the Magnification and Positions menu. Slowly decrease the pixel size in a stepwise manner until it reaches 4.26 μm, ensuring sample does not contact the internal camera.
Repeat step C6 to ensure the entire sample is still within the visible bounds of the screen. Repeat steps C5 and C6 if necessary.
Right click on the center of the sample to bring up the Transmission reading for your sample.
Return to the Magnification and Positions menu by clicking the Elevation setting on the bottom toolbar. Record the current elevation (mm) of the sample.
Remove the sample from field of view by lowering the sample height number.
Navigate to Scanning Modes menu from the Options tab to update the flat field correction. Adjust exposure time to obtain approximately 60% average transmission with flat fields turned off. In previous samples, 600 ms was optimal for ambrosia beetle scans.
Return the sample to the field of view by entering the recorded Elevation number in the Magnification and Position menu.
Click the Scan icon on the top toolbar (blue circular arrow) to begin setting the scan parameters: rotation step = 0.200 degrees; frame averaging = ON (2); Random Movement = OFF (0). Give the scan a descriptive title and use the Browse button to designate the data directory. Create a New Folder to house the scan data (Figure 4).
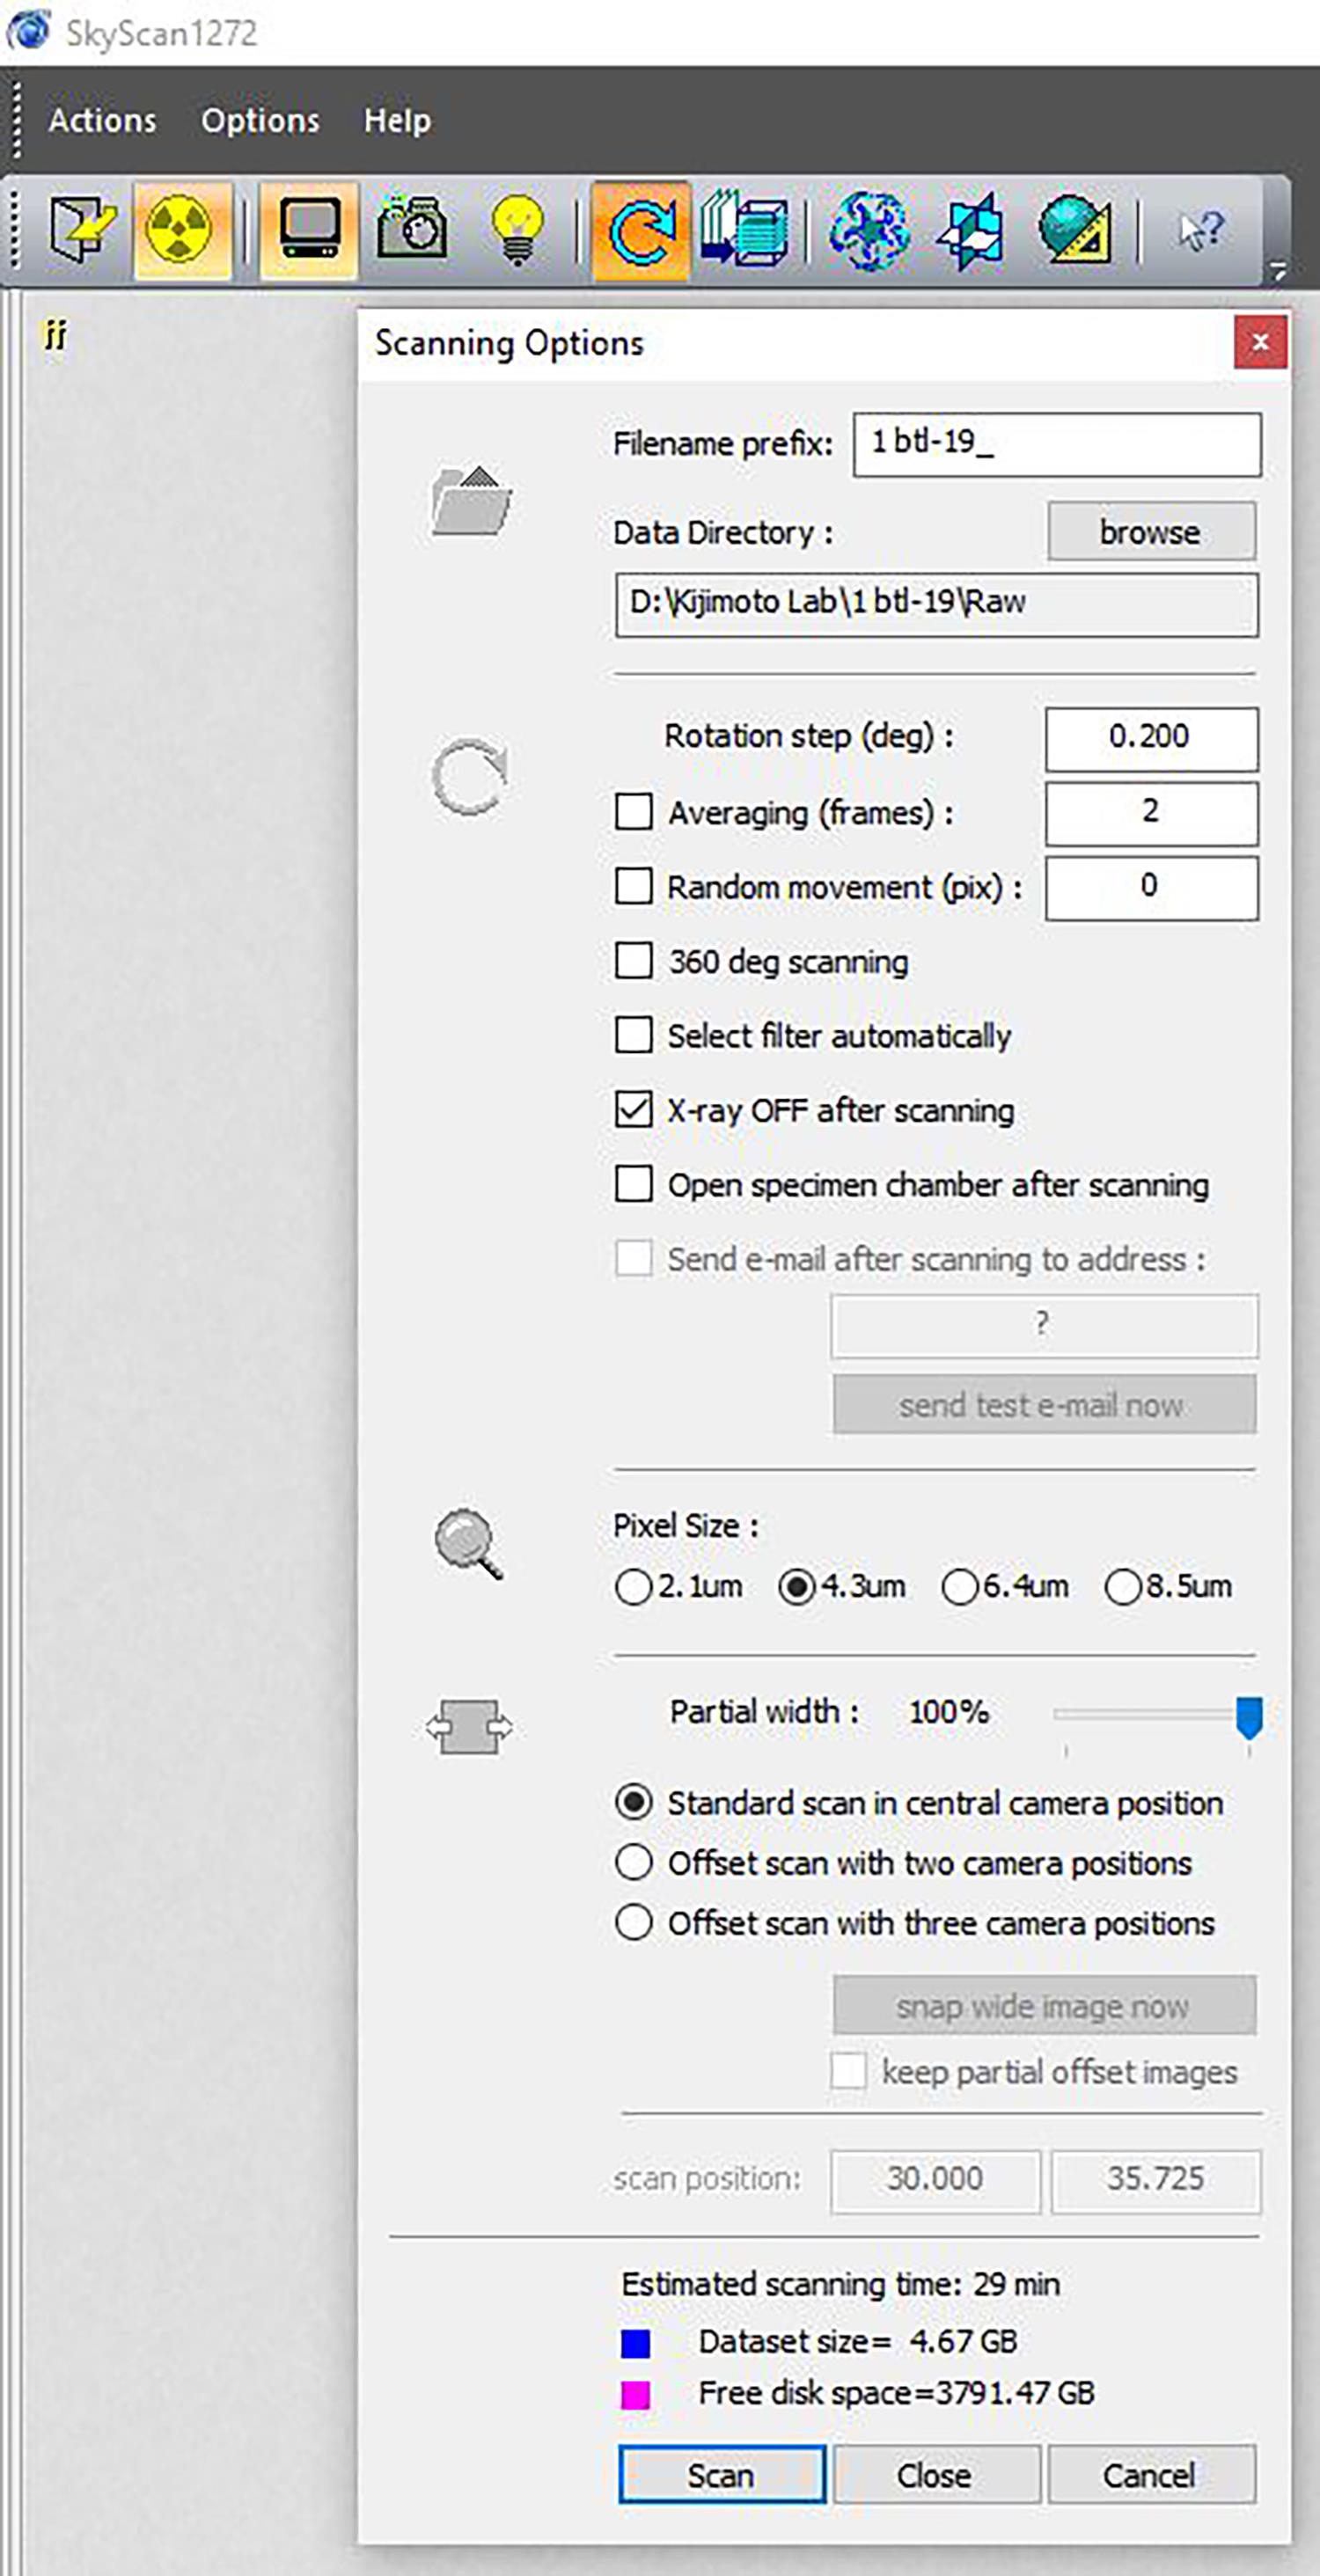
Figure 4. An example of scan settingPress ‘Scan’ to begin scanning.
Data analysis
Data processing and analysis
Micro-computed tomography: image processing, cropping, and reconstruction
Open NRecon.
Load the scan files.
On the right-hand side of the main program interface, select the Fine Tuning button from the Start tab. Work stepwise through the Fine Tuning interface to adjust Post-alignment, Beam-hardening correction, and Ring-artifacts reduction settings. Select one of these options at a time. It is recommended to leave the number of steps at 5 and parameter step at 1.0 for initial fine-tuning. Press Start within the Fine Tuning window to begin correction previews.
For each setting, the program will estimate the level of correction needed; even so, individual input is recommended to use this function to move through the range of provided previews to choose the optimal correction factor. On the toolbar, click through the arrows to examine the changes to the image preview at each setting. Examine how these settings change your scan data and choose the optimized image. Note the ideal setting for each correction type and change this number for reconstruction if necessary.
Repeat this process for each of the three correction types before proceeding. If necessary, adjust the parameter increments on the Fine Tuning window to examine smaller changes in correction factors.
In the Output tab, move the linear bounds surrounding the histogram to optimize the contrast of the scan.
Below the histogram settings in the Output tab, select the Save Destination on the computer by clicking Browse. It is recommended to save the reconstruction files with the initial scan data, but in a new subfolder with a specific designation such as Reconstruction .
Navigate back to the Start tab and press Start to reconstruct the scan data (or Start batch if batch correcting).
Once reconstruction has finished, close NRecon and open Dataviewer.
Select and open the reconstructed files saved during the previous step.
Move the selected cross-section to a point within the scan that shows the full length and width of the scanned sample within the pipette tip.
Adjust the bounds of the image to crop any unnecessary blank space; try to remove as much of the pipette tip or surrounding space from the scan without cropping portions of the insect.
Double-check the cropped information by selecting new points across your scan data to ensure all features are retained.
Save this cropped image in another new subfolder (title folder with a descriptive designation as before such as Cropped) and close the application.
Open CTVox.
Select the cropped, reconstructed image files as processed in the previous step.
If necessary, adjust the brightness and transparency of the scan data by modifying the Contrast histogram in the left panel.
Notes
Since 3D images are reconstructed from many high-resolution images, high performance computers are preferred to run the software used in this protocol. Bruker recommends an average workstation computer with dual 6-Core Intel processors, 32 GB RAM, and 6 TB of available disk space.
Variability can occur between samples, which will need to be reoriented for each scan. Rotating samples 360° before scanning ensures they are not askew and allows for a pre-scan check. If too much movement occurs during rotation, the pipette tip can be reoriented to minimize potential artifacts.
Altering the sample binning will alter the recommended pixel size if using the same camera position; always decrease pixel size in small increments as to not damage the internal camera. Optimization of scanning parameters should be considered based on the transmission through the sample. Ideal transmission through the sample is 20%–40% minimum intensity. Adjust by changing the filter, exposure time, and voltage.
Scanning samples using the same parameters can allow for comparisons between compiled models.
For an overview of SkyScan 1272 micro-CT sample loading and Dataviewer, Bruker Corporation has published short training videos introducing these software packages (Bruker Corporation, 2015 and 2018). These videos may be a good resource for basic use and familiarization with the software interface. The instructions in these videos are optimized for other sample types and, as such, should be used in conjunction with the above instruction to tailor data processing to insect samples.
Movies for the procedure of Dataviewer use and Reconstruction are also available from our group (McLaughlin et al., 2022a and 2022b, respectively).
Examples of reconstructed scan data generated from this protocol can be found as published in Spahr et al. (2020). Video of a 3D model from this publication can be viewed at the following link: https://doi.org/10.6084/m9.figshare.12221981.v1
Recipes
70% ethanol can be prepared from 190 or 200 proof stock as follows:
70% ethanol from 200 proof ethanol stock
Reagent Final concentration Amount Ethanol (absolute) 70% 700 mL H2O 30% 300 mL Total n/a 1,000 mL
Acknowledgments
We would like to thank Karen Martin from WVU Animal Models Imaging Facility for training and use of the Bruker Skyscan 1272 Micro-CT and accompanying software. This research was supported by funding provided by USDA-NIFA (HATCH) WVA00712. This protocol was developed and utilized in Spahr et al. (2020).
Competing interests
No conflict of interest is declared regarding this article.
References
- Fraedrich, S. W., Harrington, T. C., Rabaglia, R. J., Ulyshen, M. D., Mayfield, A. E., 3rd, Hanula, J. L., Eickwort, J. M. and Miller, D. R. (2008). A Fungal Symbiont of the Redbay Ambrosia Beetle Causes a Lethal Wilt in Redbay and Other Lauraceae in the Southeastern United States. Plant Dis 92(2): 215-224.
- Freeman, S., Sharon, M., Maymon, M., Mendel, Z., Protasov, A., Aoki, T., Eskalen, A. and O'Donnell, K. (2013). Fusarium euwallaceae sp. nov.--a symbiotic fungus of Euwallacea sp., an invasive ambrosia beetle in Israel and California. Mycologia 105(6): 1595-1606.
- Li, Y., Simmons, D. R., Bateman, C. C., Short, D. P., Kasson, M. T., Rabaglia, R. J. and Hulcr, J. (2015). New Fungus-Insect Symbiosis: Culturing, Molecular, and Histological Methods Determine Saprophytic Polyporales Mutualists of Ambrosiodmus Ambrosia Beetles. PLoS One 10(9): e0137689.
- Li, Y., Ruan, Y., Kasson, M. T., Stanley, E. L., Gillett, C., Johnson, A. J., Zhang, M. and Hulcr, J. (2018). Structure of the Ambrosia Beetle (Coleoptera: Curculionidae) Mycangia Revealed Through Micro-Computed Tomography. J Insect Sci 18(5).
- O'Donnell, K., Sink, S., Libeskind-Hadas, R., Hulcr, J., Kasson, M. T., Ploetz, R. C., Konkol, J. L., Ploetz, J. N., Carrillo, D., Campbell, A., et al. (2015). Discordant phylogenies suggest repeated host shifts in the Fusarium-Euwallacea ambrosia beetle mutualism. Fungal Genet Biol 82: 277-290.
- Spahr, E., Kasson, M. T. and Kijimoto, T. (2020). Micro-computed tomography permits enhanced visualization of mycangia across development and between sexes in Euwallacea ambrosia beetles. PLoS One 15(9): e0236653.
- Yuceer, C., Hsu, C.-Y., Erbilgin, N. and Klepzig, K. D. (2011). Ultrastructure of the mycangium of the southern pine beetle, Dendroctonus frontalis (Coleoptera: Curculionidae, Scolytinae): complex morphology for complex interactions. Acta Zoologica 92(3): 216-224.
- Bruker Corporation. (2015). Bruker microCT training video: Introduction to dataviewer. [Video]. Youtube, https://youtu.be/qs-ec2v3tuo
- Bruker Corporation. (2018) SKYSCAN 1272: Just start your analysis. [Video]. Youtube, https://youtu.be/HBZuBlg9qhg
- McLaughlin, S., Spahr, E., Kasson, M., and Kijimoto, T. (2022a). Cropping Data Files with Dataviewer. figshare. Media. https://doi.org/10.6084/m9.figshare.21273327.v1
- McLaughlin, S., Spahr, E., Kasson, M., and Kijimoto, T. (2022b). µCT Reconstruction with NRecon. figshare. Media. https://doi.org/10.6084/m9.figshare.21273342.v1
Article Information
Copyright
© 2023 The Authors; exclusive licensee Bio-protocol LLC.
How to cite
Spahr, E. J., McLaughlin, S. L., Tichinel, A. M., Kasson, M. T. and Kijimoto, T. (2023). Staining and Scanning Protocol for Micro-Computed Tomography to Observe the Morphology of Soft Tissues in Ambrosia Beetles. Bio-protocol 13(1): e4584. DOI: 10.21769/BioProtoc.4584.
Category
Molecular Biology > RNA > RNA interference
Developmental Biology > Morphogenesis
Do you have any questions about this protocol?
Post your question to gather feedback from the community. We will also invite the authors of this article to respond.